The energetic basis for smooth human arm movements
- University of Calgary, Faculty of Kinesiology, Department of Biomedical Engineering, Canada
- Hotchkiss Brain Institute, University of Calgary, Canada
Figures
Figure 1
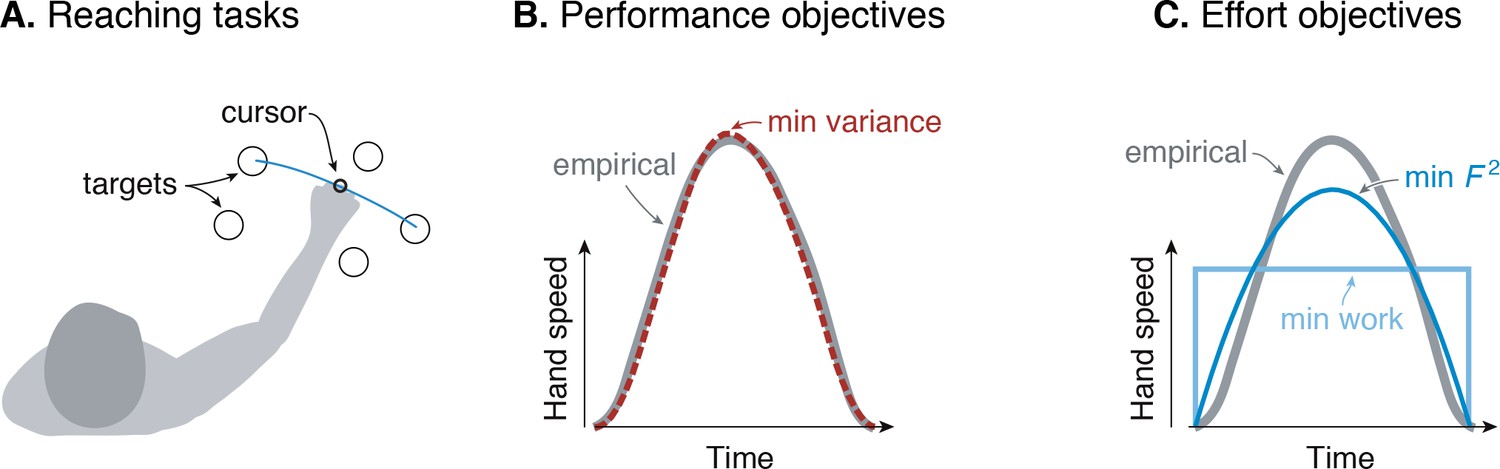
Goal-directed reaching tasks and optimization criteria.
(A) Typical experiments for point-to-point movements between targets. (B) Hand speed trajectories vs. time. Kinematic objectives such as minimizing jerk or variance predict the observed smooth, bell-shaped profiles for hand speed. (C) A number of effort-based objectives such as minimizing work or squared muscle force predict trajectories that are not smooth or not bell-shaped (Nelson, 1983).
Figure 2
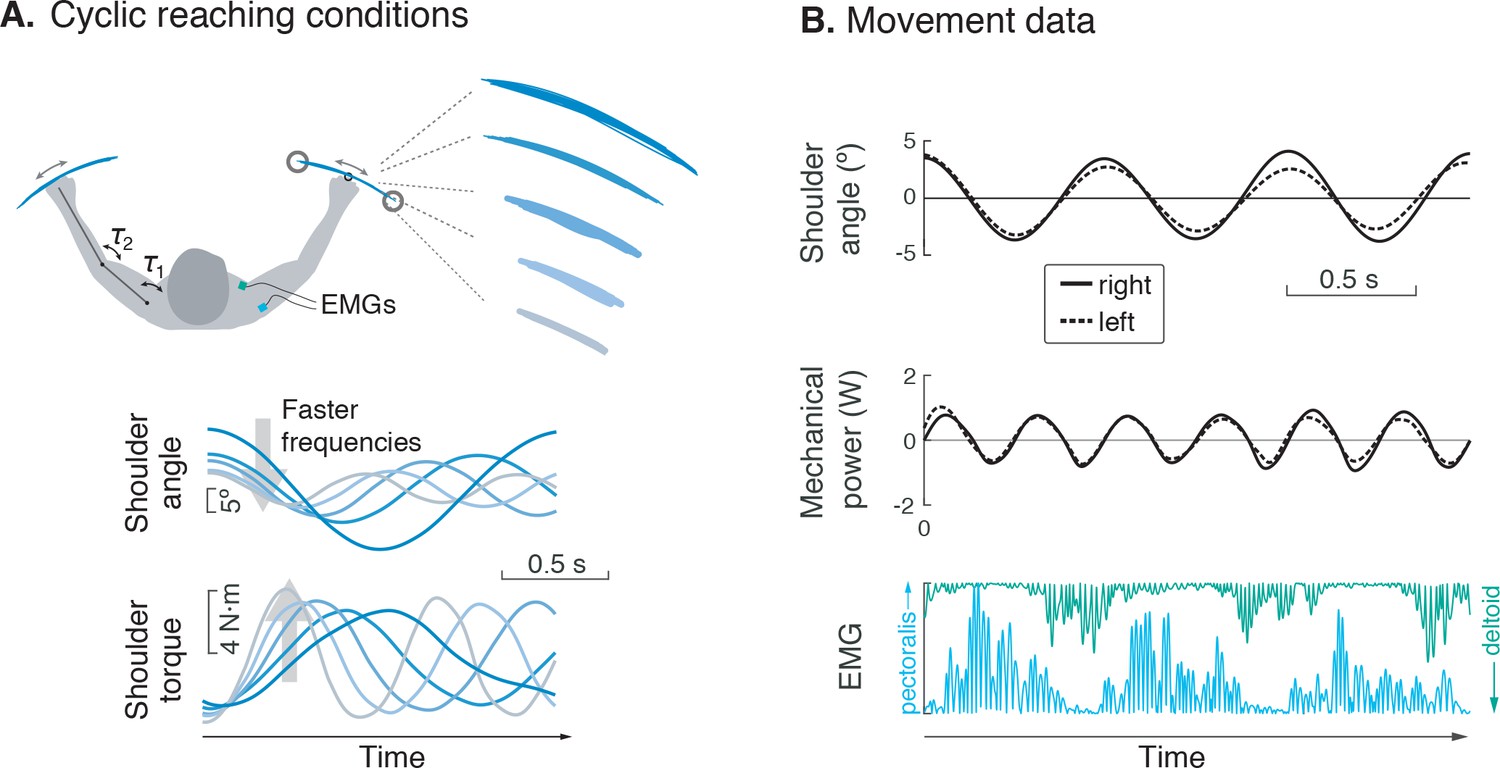
Experiment for metabolic cost of cyclic reaching.
(A) Cyclic reaching was performed bimanually and symmetrically in the horizontal plane, primarily about the shoulders. To isolate the hypothesized force-rate cost from the energetic cost of work, movements were varied to yield fixed mechanical power, by decreasing amplitudes with increasing movement frequency. (B) Movement data included shoulder angle, mechanical power, electromyography (EMG), and (not shown) metabolic energy expenditure via expired gas respirometry.
Figure 3
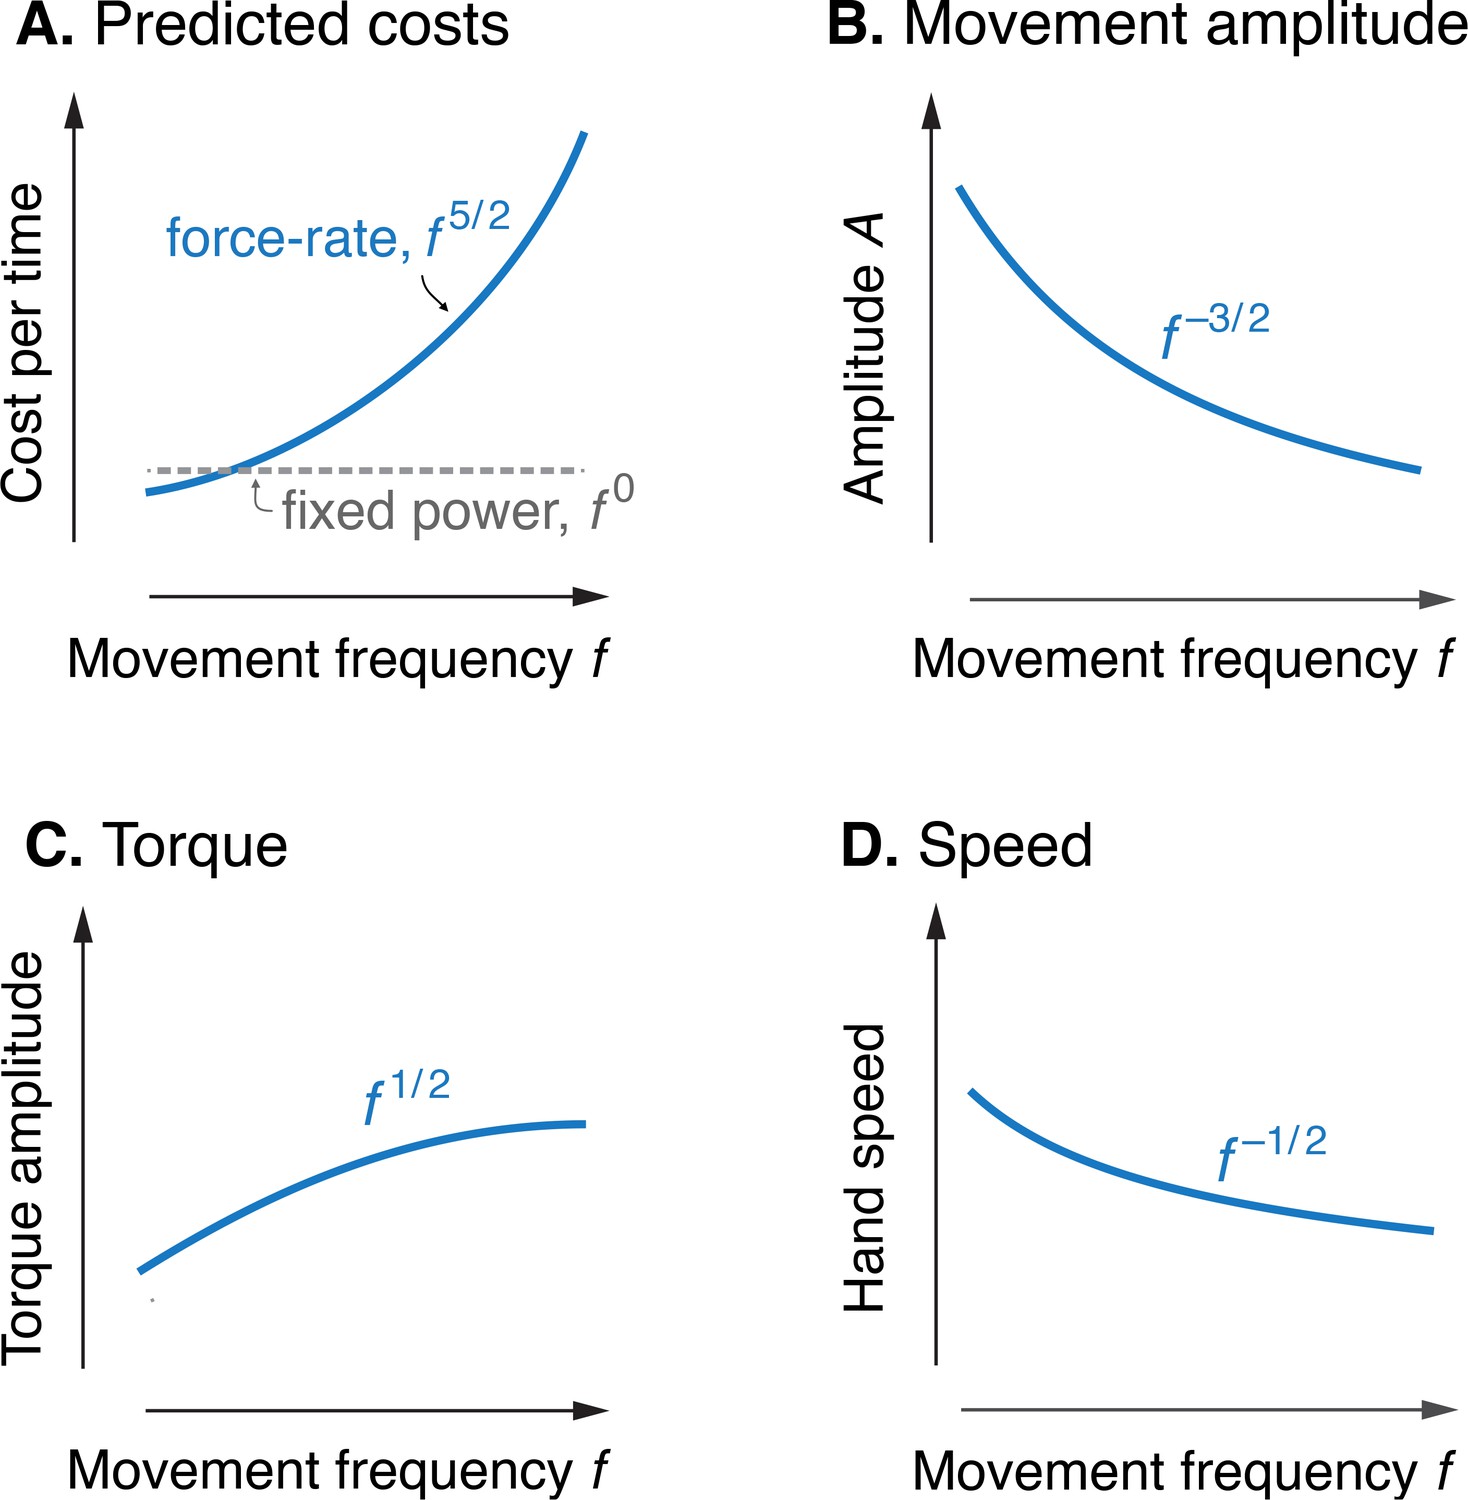
Predicted cost and dynamics for cyclic reaching, as a function of movement frequency .
(A) Force-rate cost is predicted to increase with , whereas cost for mechanical work is predicted to remain constant for fixed power conditions. (B) Fixed power is achieved by specifying movement amplitude to decrease with frequency, according to . (C) Torque amplitudes are expected to increase modestly, with Peak hand speed is expected to decrease, with .
Figure 4
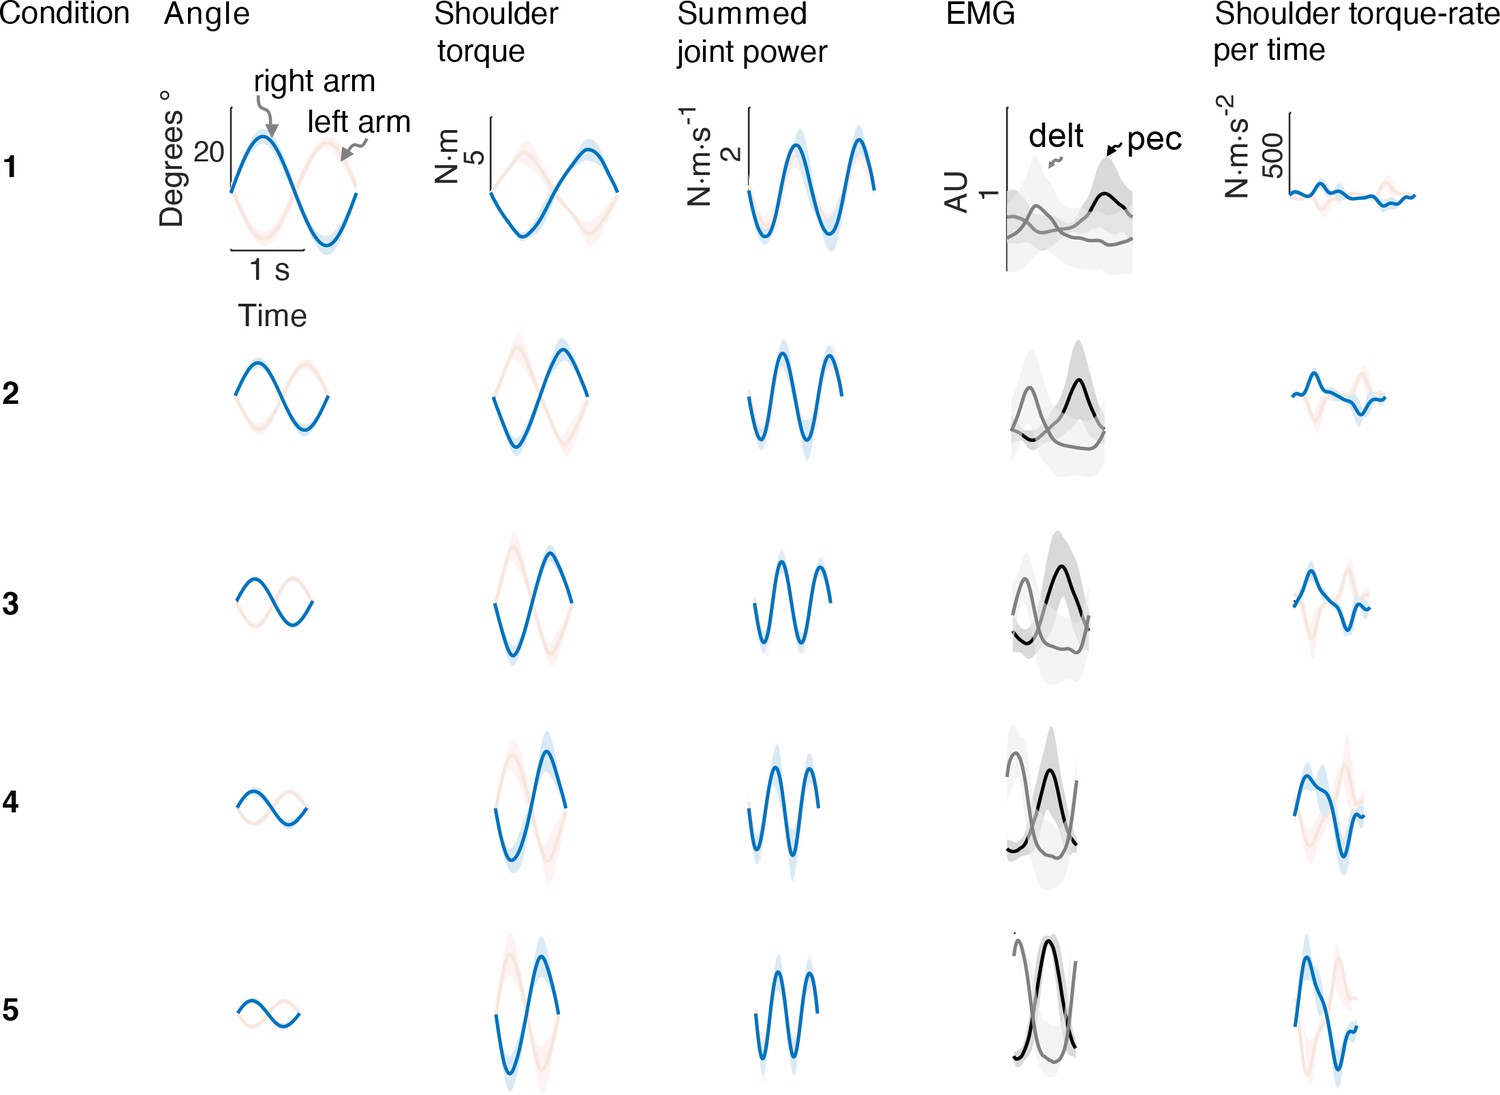
Average bimanual reach trajectories and EMG.
Mean (± s.d.; =5 EMG subjects) angular displacement, shoulder torque, summed joint power, EMG, and torque rate-per-time for five conditions from Experiment 1. Right (blue) and left (red) arms are shown separately.
Figure 5
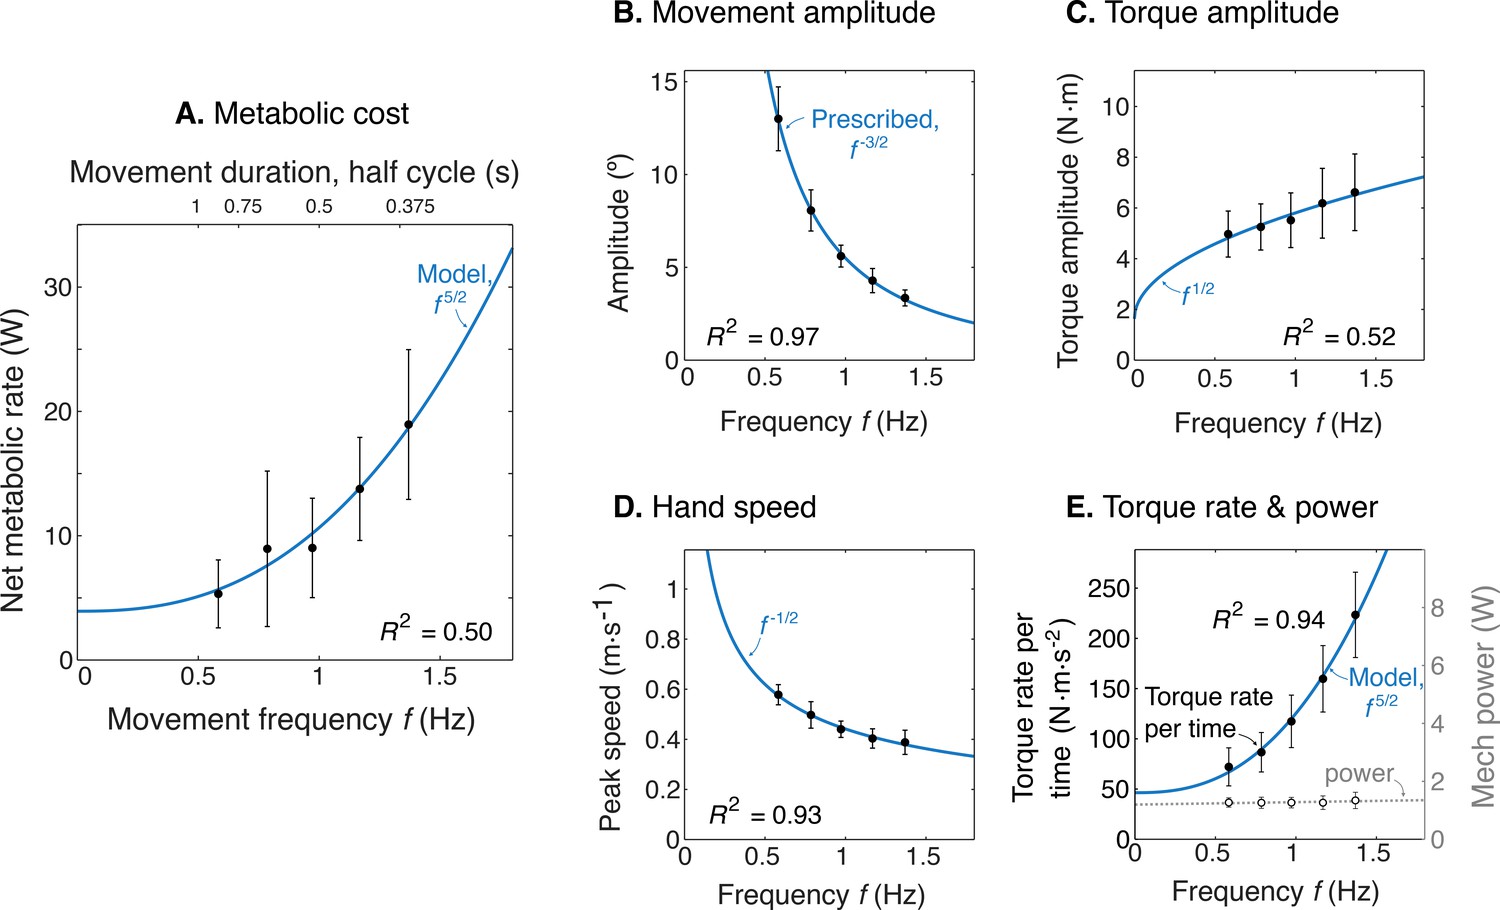
Experimental results as a function of movement frequency .
(A) Net metabolic power vs. frequency (means ± s.d., = 10), with predicted power law (solid line). (B) Movement amplitude and prescribed target . (C) Torque amplitude and prediction . (D) Hand speed amplitude and prediction . (E) Amplitude of torque rate per time and prediction , and mechanical power amplitude and constant power prediction.
Figure 6
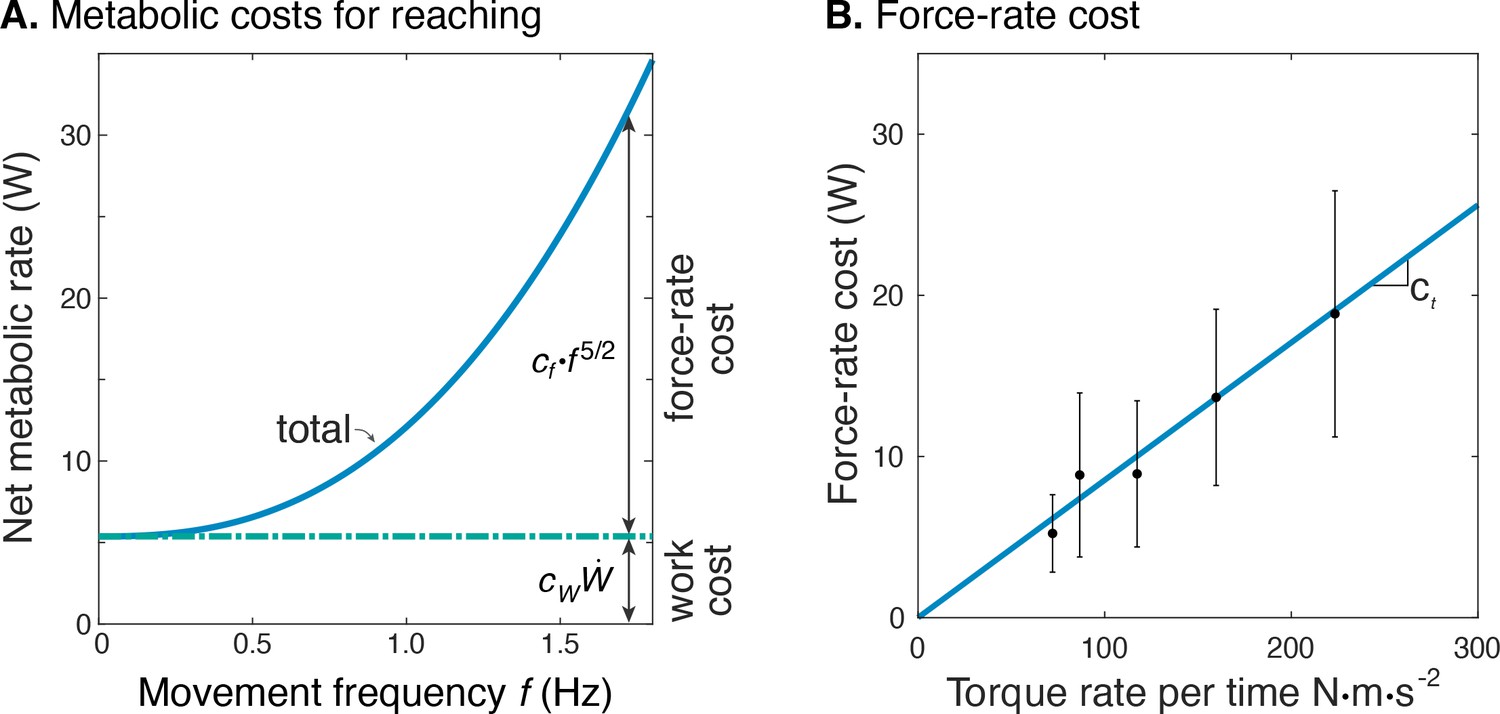
Estimated metabolic cost contributions from work and force-rate.
(A) Net metabolic rate vs. movement frequency for cyclic reaching, with contributions from force-rate cost () and mechanical work (). Coefficient was derived from experiment (Figure 4), whereas was specified as 4.2 to model a proportional cost for positive and negative mechanical work. (B) Force-rate cost (metabolic power ) is linearly related to amplitude of torque rate per time , by coefficient determined from part A. and Figure 4E.
Figure 7
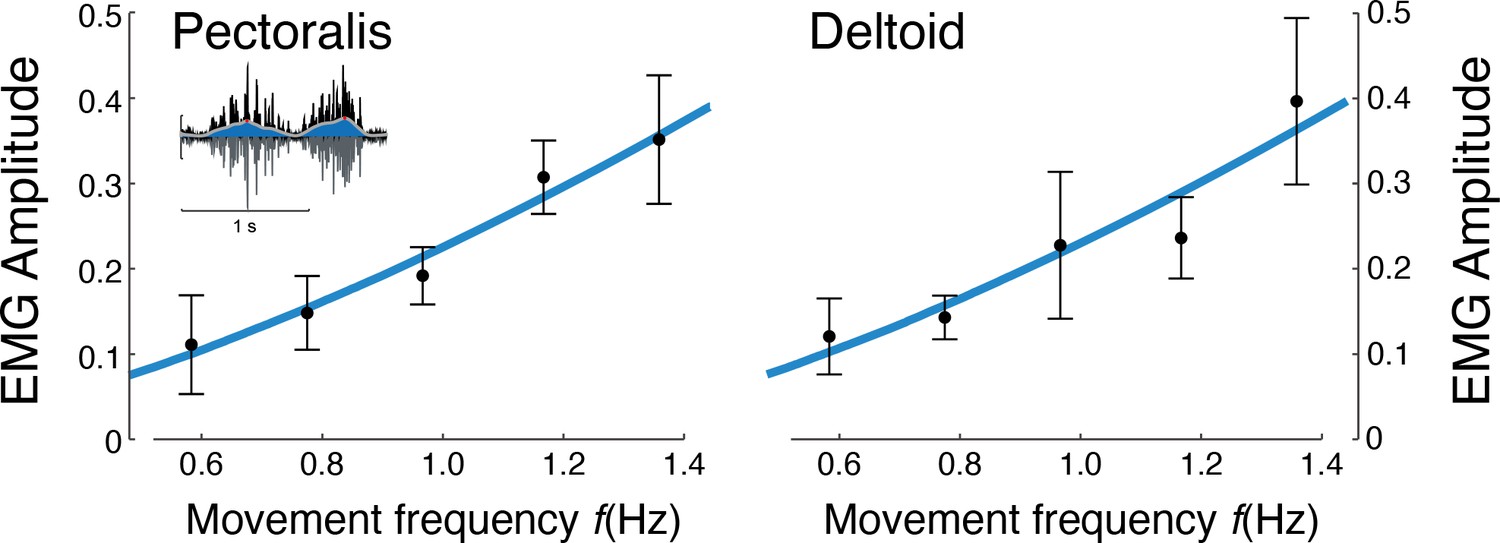
EMG amplitude vs.movement frequency during cyclic reaching.
Inset figure depicts an example EMG rectified (black), filtered (blue), and amplitude (red). Pectoralis and deltoid EMGs (means ± s.d.; = 10), with best-fit predictions curves (both ), and , respectively.
Figure 8
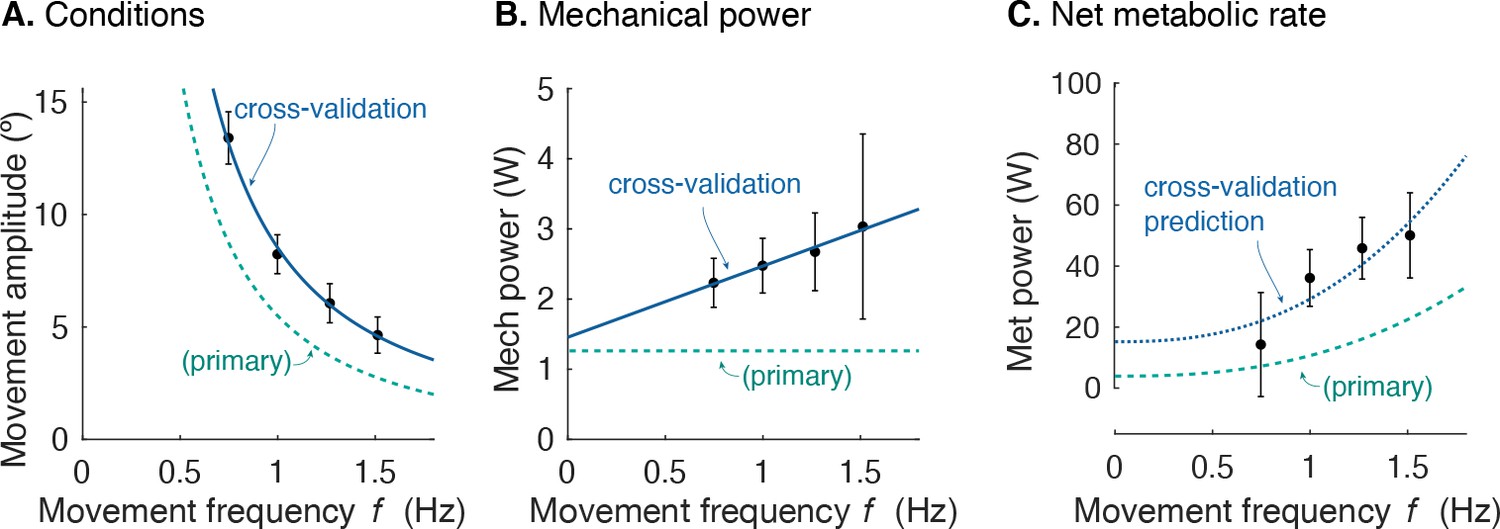
Cross-validation (CV) of force rate cost.
(A) Amplitude of cyclic reaching condition (compared with primary experiment) vs. movement frequency and (B) positive mechanical power vs. . (C) Net metabolic rate vs. movement frequency for cross-validation (means ± s.d.; = 10). Cross-validation conditions were such that average positive mechanical power increased slightly with , unlike the primary experiment. Predicted metabolic rate for CV was determined using and from primary experiment (solid line).
Figure 9
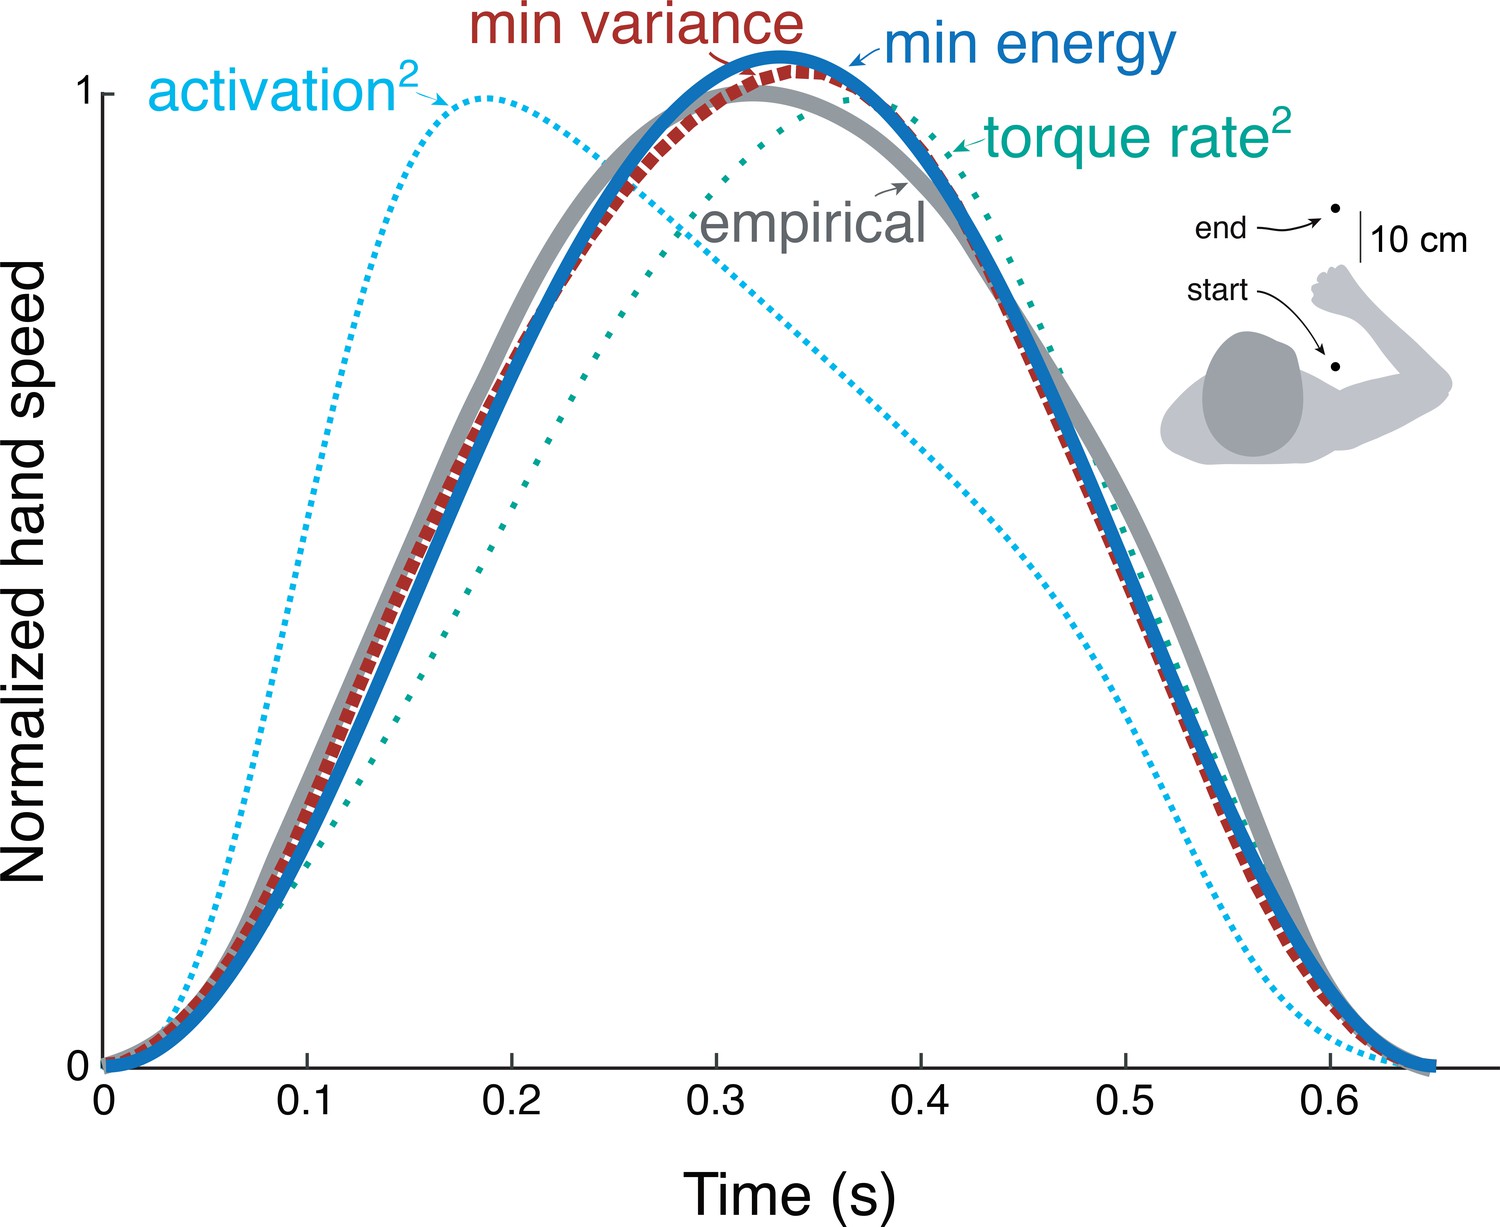
Hand speed trajectories vs.time for point-to-point movements predicted by various objective functions, compared to empirical, bell-shaped profiles.
Minimization objectives include metabolic energy expenditure (‘min energy’ according to model proposed here), error variance (Harris & Wolpert), torque-rate squared (Uno et al., 1989, purple), and activation squared for a Hill-type muscle model. Minimum energy expenditure is the sum of work and force-rate costs (Equation 1), with coefficient identified from the primary experiment (Figure 4). All optima use the same initial and final targets and a fixed movement duration.
Figure 10
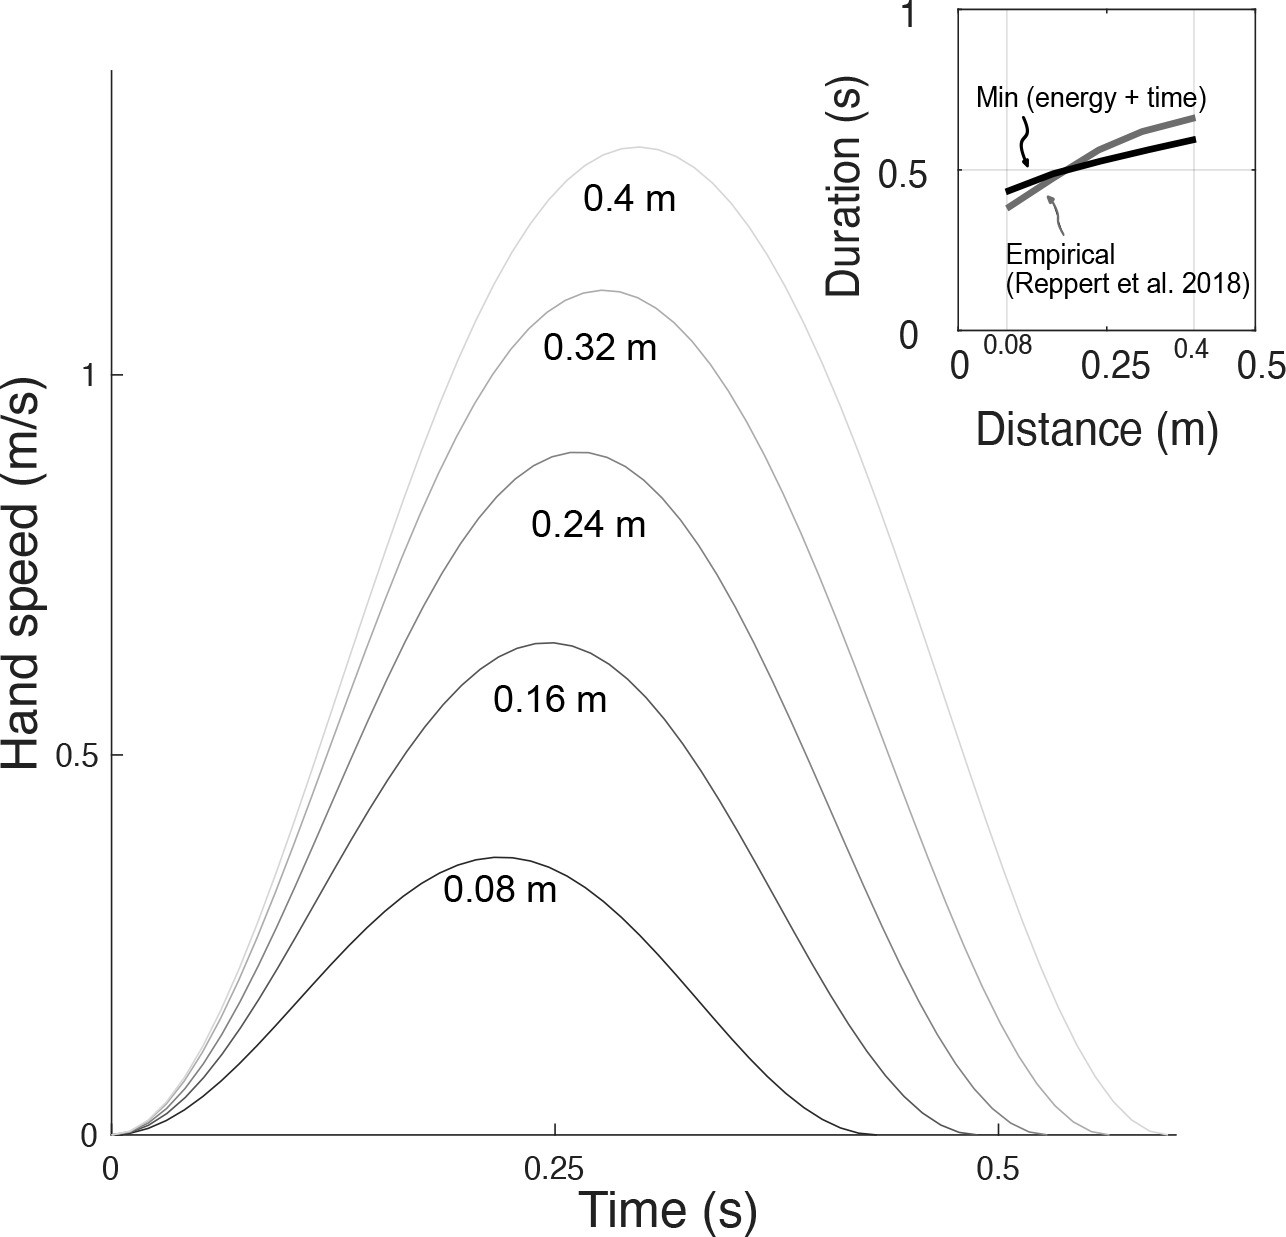
Hand speeds and movement time are predicted simultaneously by optimizing energetic cost and a (linear) cost of time.
Hand speed as a function of time are plotted for five different reach distances. Inset: In recent empirical observations (adapted from Reppert et al., 2018, Figure 5), movement duration varies approximately linearly with reach distance.
Tables
Table 1
Experimental results.
Linear mixed effects models were used to test model predictions from data. Listed for each quantity: predicted power law, estimated coefficient, 95% confidence interval (CI), , and p-value.
| Quantity | Power law | Coefficient | 95% CI | R2 | p | Intercept |
|---|---|---|---|---|---|---|
| Metabolic Power (W) | f 5/2 | 6.72 | (4.58, 8.86) | 0.50 | 9.70E-9 | 3.93 |
| Movement amplitude (°) | f 3/2 | 5.97 | (5.66, 6.28) | 0.97 | 1.02E-39 | –0.47 |
| Peak speed amplitude (m.s–1) | f -1/2 | 0.43 | (0.39, 0.47) | 0.93 | 6.63E-29 | 0.01 |
| Torque amplitude (N.m) | f 1/2 | 8.34 | (5.77, 10.91) | 0.52 | 4.10E-9 | 1.63 |
| Positive mechanical power (W) | f 0 | 1.20 | (0.85, 1.55) | |||
| Torque rate per time (N.m.s–2) | f 5/2 | 78.93 | (72.37, 85.48) | 0.94 | 2.19E-30 | 46.43 |
| EMG amplitude: Pec | f 3/2 | 0.17 | (0.12, 0.23) | 0.65 | 1.1E-6 | 0.17 |
| EMG amplitude: Delt | f 3/2 | 0.20 | (0.11, 0.27) | 0.56 | 1.5e-5 | 0.20 |
Additional files
Download links
A two-part list of links to download the article, or parts of the article, in various formats.
Downloads (link to download the article as PDF)
Open citations (links to open the citations from this article in various online reference manager services)
Cite this article (links to download the citations from this article in formats compatible with various reference manager tools)
The energetic basis for smooth human arm movements
eLife 10:e68013.
https://doi.org/10.7554/eLife.68013


