VASP-mediated actin dynamics activate and recruit a filopodia myosin
- Department of Genetics, Cell Biology, and Development, University of Minnesota, United States
- Structural Motility, Institut Curie, Paris Université Sciences et Lettres, Sorbonne Université, France
Figures
Figure 1 with 2 supplements
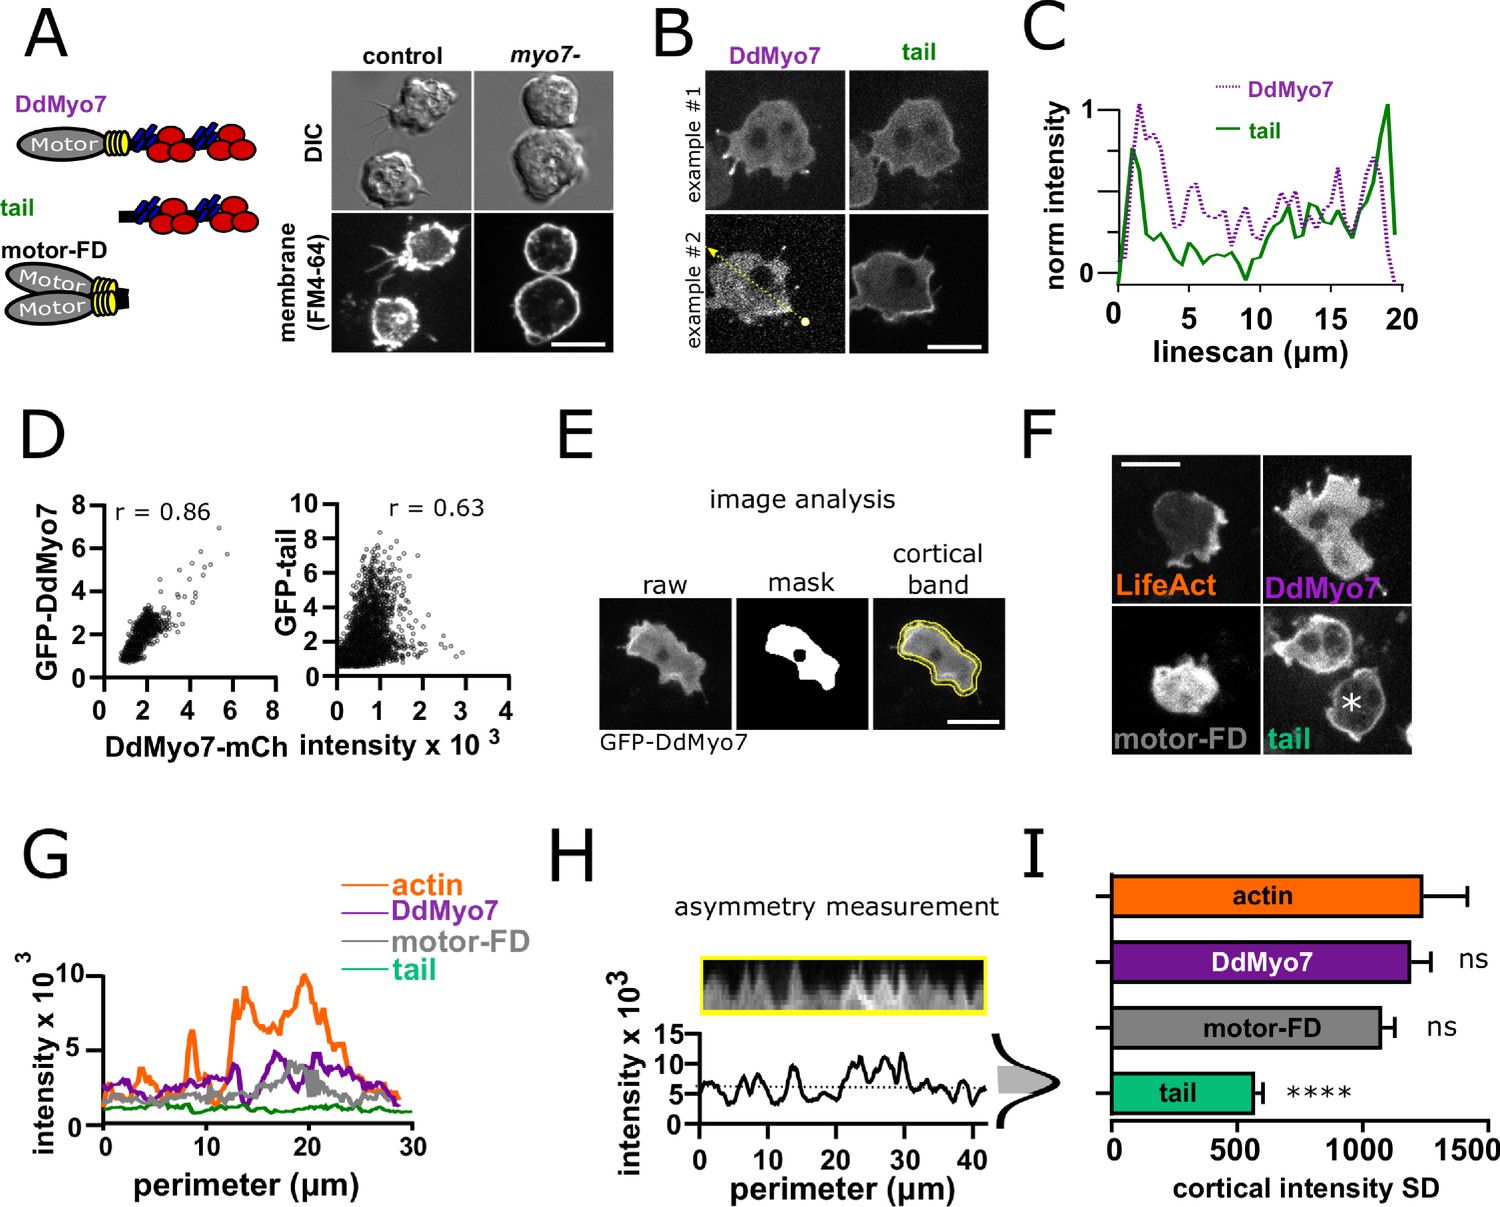
DdMyo7 has a distinct cortical localization from its tail domain.
(A) (left) Schematic of DdMyo7 illustrating its motor domain (gray), 4 IQ domains (yellow) and tandem MyTH4-FERM domains (blue-MyTH4, red-FERM) in the tail, the tail fragment, and a motor forced dimer (motor-FD); (right) Dictyostelium control, or myo7 null cells visualized with DIC and the membrane dye FM4-64 showing DdMyo7 is critical for filopodia formation. (B) Confocal images showing two examples of wild-type cells co-expressing DdMyo7-mCherry and GFP-DdMyo7-tail. The localization of DdMyo7-mCherry is at the cortex and in filopodia tips, and GFP-tail fragment localized around cortex. (C) Line intensity profile along the line shown in panel B. (D) Cytofluorograms of a representative field of cells comparing the colocalization between DdMyo7-mCherry intensity (x-axis) and GFP-DdMyo7 or GFP-DdMyo7 tail intensity (y-axis). (E) Analysis strategy for measuring entire cell peripheral intensity. (F) Micrographs of cells expressing RFP-Lifeact, GFP-DdMyo7, GFP-Tail, or GFP-Motor-Forced Dimer (FD) asterisks (*) on GFP-tail indicates the cell analyzed in G. (A,B,E,F) Scale bars are 10 µm. (G) Peripheral line scan intensity of cells from F. (H). Sample cortical band intensity showing the mean and variation of intensities around the periphery (asymmetry measurement), shaded region of the intensity distribution represents the standard deviation. (I). Cortical band standard deviation (SD; n > 93 cells from three experiments for each group) (see also Figure 1—source data 1). A higher SD indicates asymmetric localization. One-way ANOVA with multiple comparison correction compared to actin, ****p<0.001, ns not significant (see also Figure 1—source data 2).
-
Figure 1—source data 1
Values of the cortical standard deviation measurements (cortical asymmetry) for each cell for Figure 1I.
- https://cdn.elifesciences.org/articles/68082/elife-68082-fig1-data1-v2.xlsx
-
Figure 1—source data 2
Statistical test results for Figure 1I.
- https://cdn.elifesciences.org/articles/68082/elife-68082-fig1-data2-v2.xlsx
Figure 1—figure supplement 1
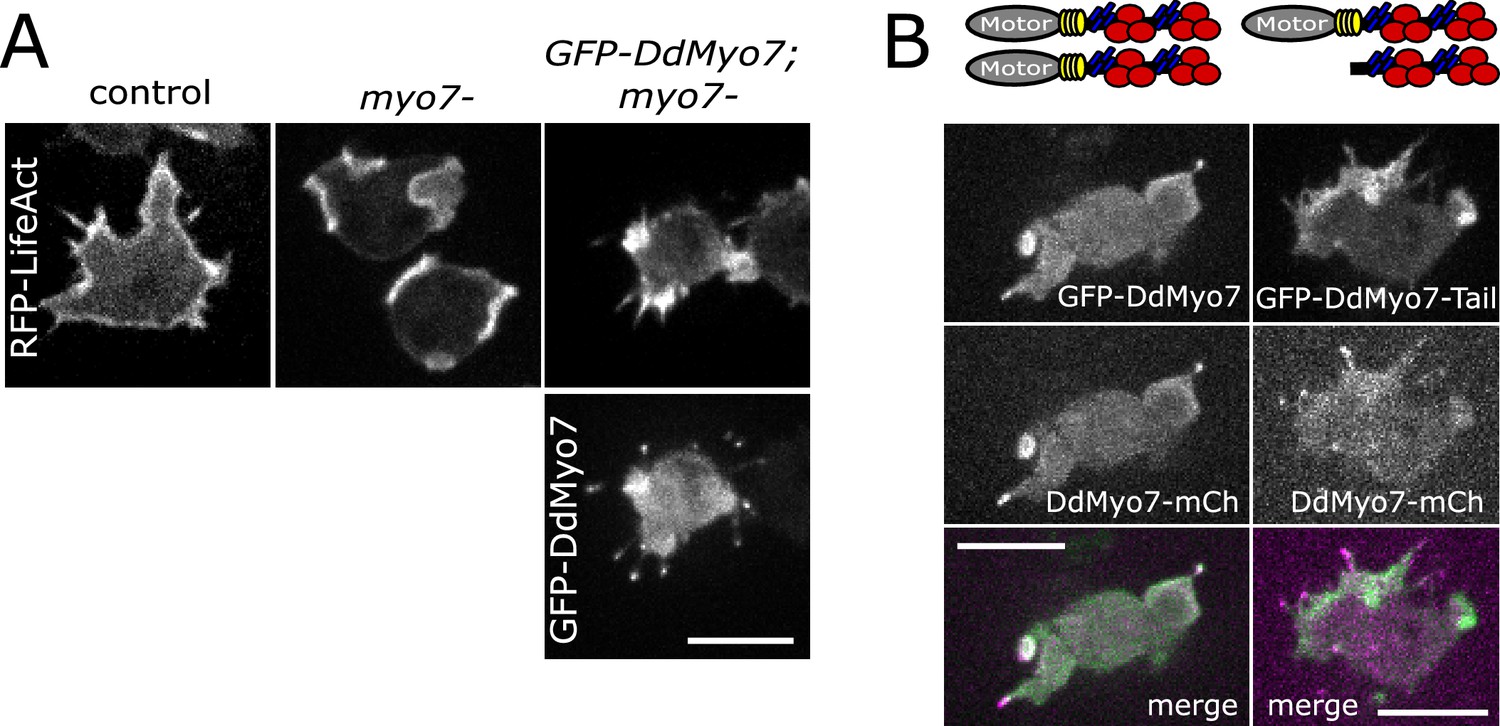
DdMyo7 is localized to filopodia and required for their formation.
(A) Micrographs of control (AX2), myo7 null or myo7 null with GFP-DdMyo7 rescue construct expressing RFP-Lifeact (actin, top) and GFP-DdMyo7 (bottom). (B) Micrographs of myo7 null cells co-expressing either GFP-DdMyo7 and DdMyo7-mCherry (left) or GFP-DdMyo7-tail and DdMyo7-mCherry (right). A-B. Scale bars: 10 µm.
Figure 1—figure supplement 2
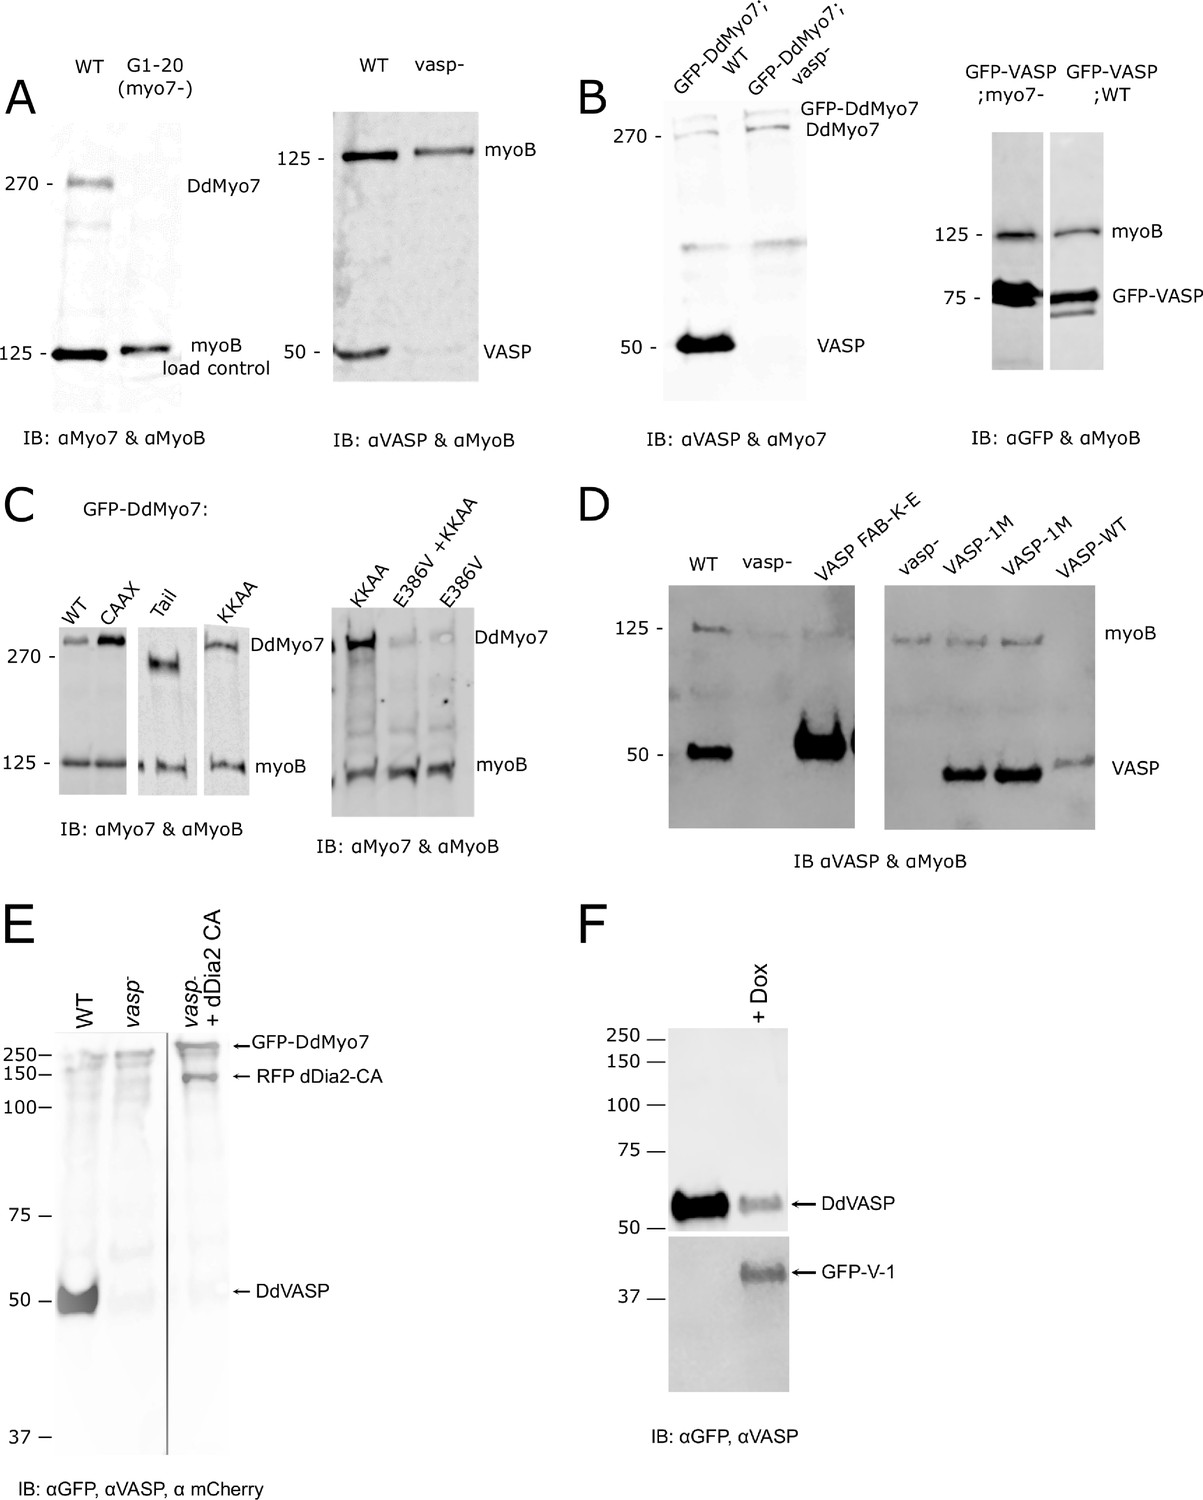
Analysis of protein expression.
Whole cell lysates from each line used in this study were analyzed for expression of endogenous proteins or expressed fusion proteins. Approximately 3 × 10⁵ cells were loaded per lane. The blot was also probed for the 125 kD MyoB heavy chain serving as the loading control. Antibodies used to probe each set of blots are indicated below and the molecular weights in kD marked on the side. (A) Control wild type (WT, Ax2), myo7 null or vasp null cell lines. Note that DdVASP runs at ~50 kD, higher than its calculated molecular weight of ~40 kD. (B) GFP-DdMyo7 expression in control (WT, Ax3) and vasp null cells, and GFP-VASP in control wild type (Ax2) and myo7 null cells. (C) Expression of wild type or mutant GFP-DdMyo7 in myo7 null cells. Note that GFP-DdVASP runs at ~75 kD, higher than its calculated molecular weight of ~65 kD (D) Expression of wild type VASP and VASP mutants (not fused to a fluorescent protein) in vasp null cells. (E) Numbers are molecular weight standard. Wild type, vasp null and vasp null cell line overexpressing GFP-dDia2 CA. (F) Western blot of GFP-V1 induced (+Dox) in control (Ax3) cells.
Figure 2 with 1 supplement
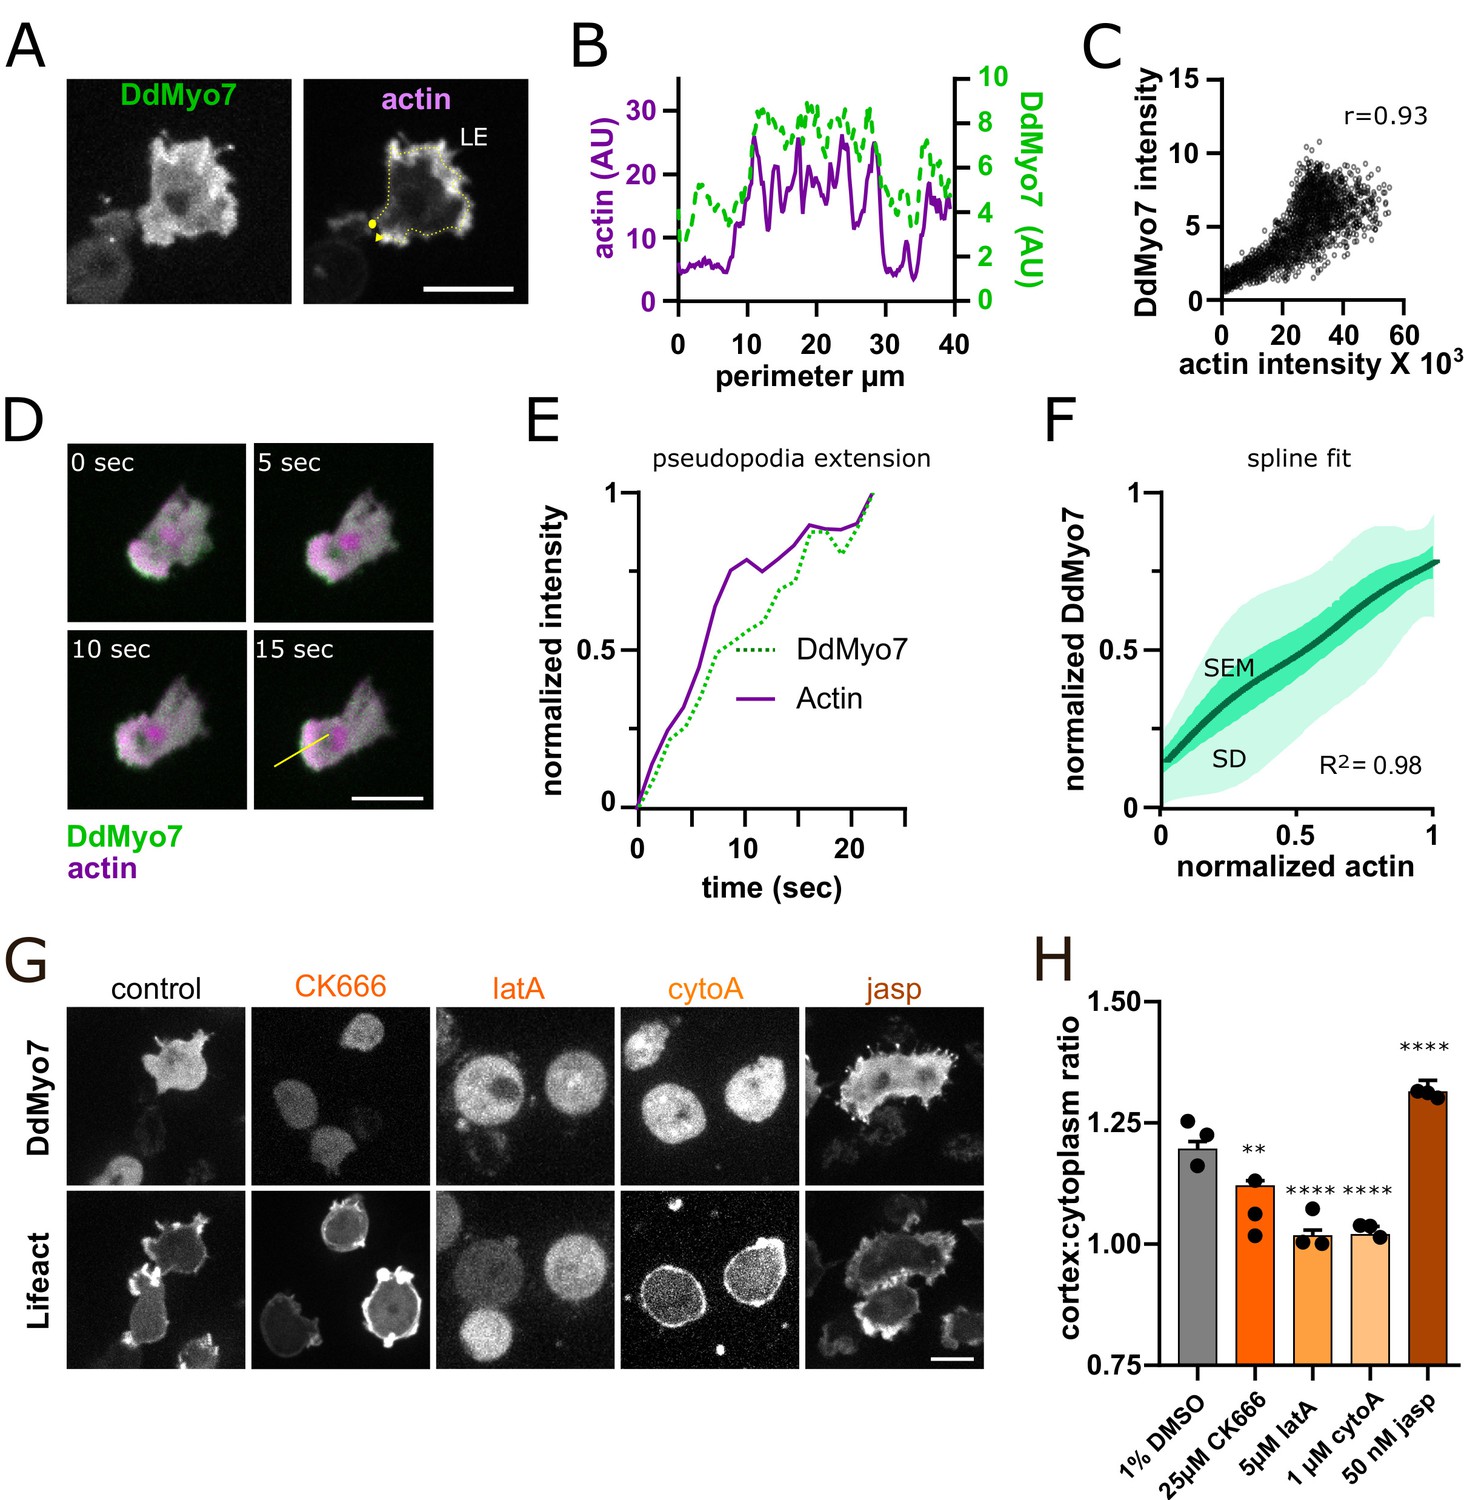
Actin dynamics regulate DdMyo7 recruitment to the cortex.
(A) Dictyostelium co-expressing GFP-DdMyo7 and RFP-Lifeact. (B) Line intensity profile from yellow dotted line in A (circle = beginning, arrowhead indicates end of scan). (C) Cytofluorogram from a representative field of cells showing the colocalization of actin and DdMyo7, r is correlation coefficient. (D) Confocal image series of an extending pseudopod. (E) Normalized linescan intensity profile of DdMyo7 and actin in extending pseudopod along the line from panel D. (F) Intensity correlation of GFP-DdMyo7 and RFP-Lifeact plotted as the average spline fit of 10 extending pseudopodia (SD - light green shading, SEM - dark green shading, see also Figure 2—source data 1). (G) Confocal micrographs of cells expressing GFP-DdMyo7 (top) or RFP-Lifeact (actin, bottom) treated with specified drug. (A,D,G) Scale bar is 10 µm. (H) Cortex:cytoplasm ratio (cortex is 0.8 µm band of cell periphery, cytoplasm is the rest of cell excluding the nucleus) of GFP-DdMyo7 of cells treated with anti-actin drugs, circles are experimental means (see also Table 1). One-way ANOVA with multiple comparison correction, shown to 1% DMSO control, **p<0.01, p****<0.0001.
-
Figure 2—source data 1
Normalized intensity values for each of the 10 extending pseudopodia in Figure 2F.
- https://cdn.elifesciences.org/articles/68082/elife-68082-fig2-data1-v2.xlsx
Figure 2—figure supplement 1
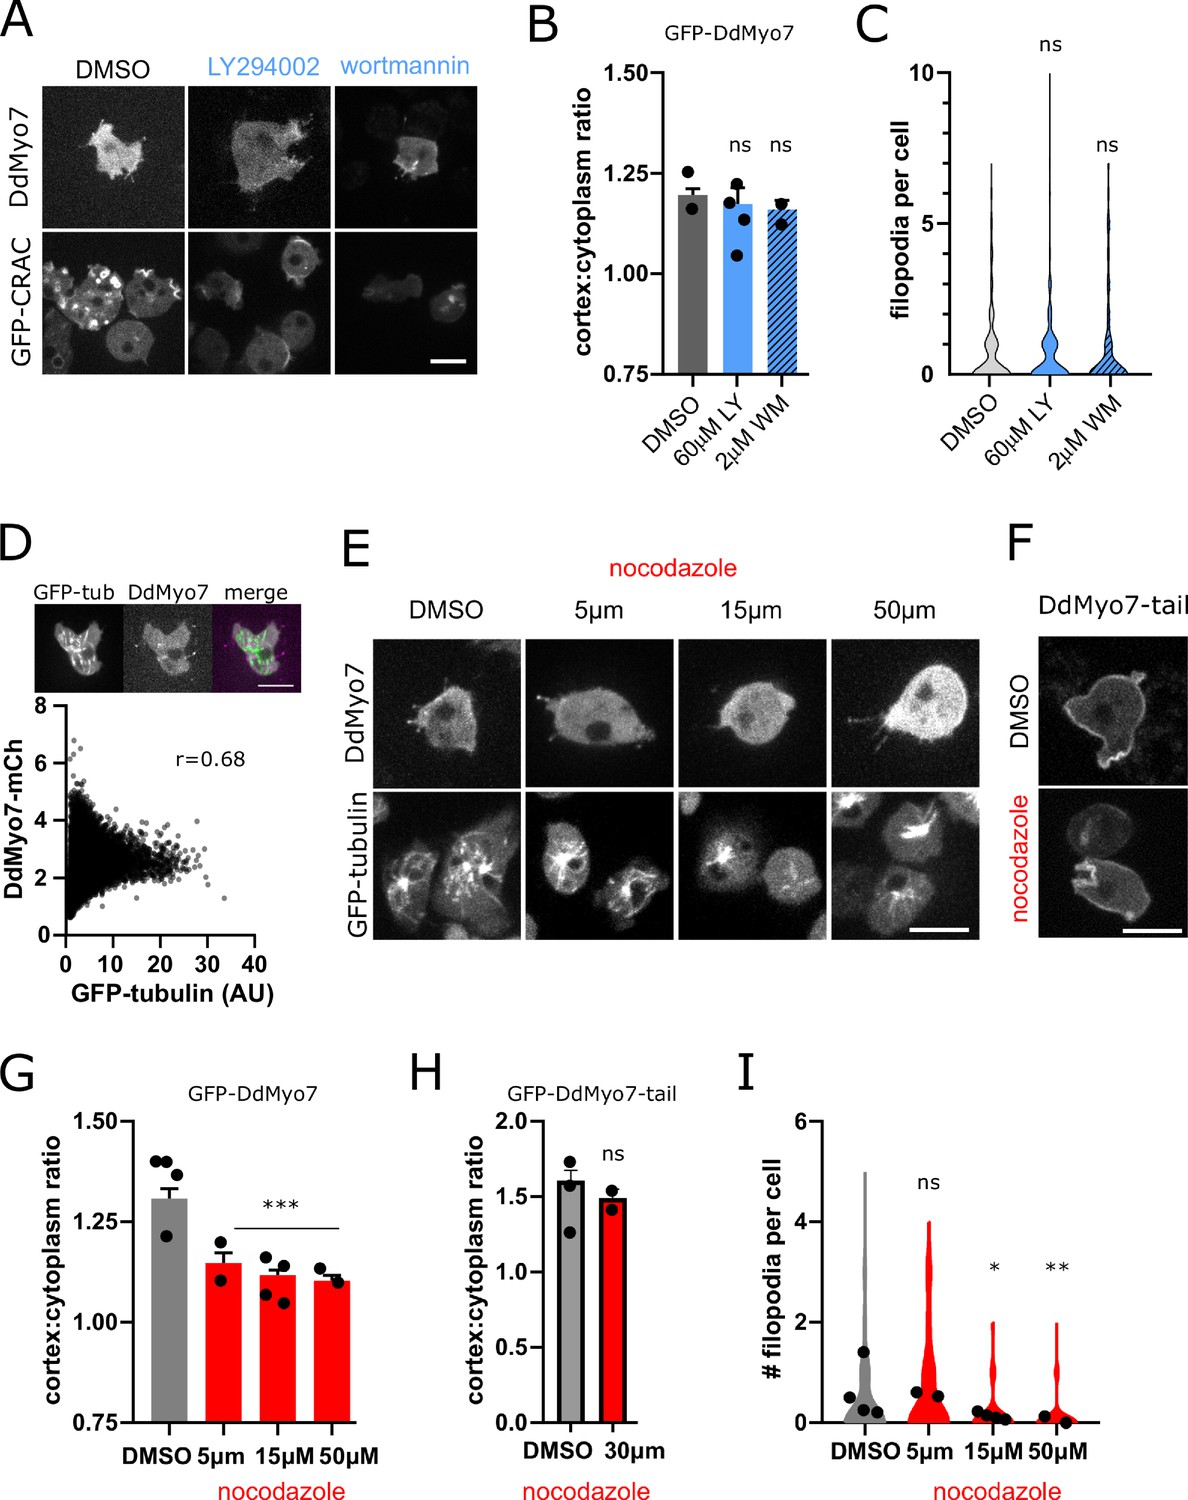
Effects of microtubule and membrane phospholipid inhibitors on DdMyo7 targeting and filopodia formation.
(A) Micrographs of cells expressing GFP-DdMyo7 or GFP-CRAC treated with LY294002 (LY), wortmannin (WM). (B) Quantification of GFP-DdMyo7 cortical recruitment. (C) Quantification of filopodia formation. (D) (top) Micrograph of representative cell expressing GFP-tubulin (GFP-tub) and DdMyo7-mCherry and the merged image. (bottom) Cytofluoragram from a representative field of cells of pixel-wise overlap of a cell expressing GFP-tubulin and DdMyo7-mCherry. (E) Micrographs of cells expressing mNeon-DdMyo7 or GFP-tubulin under DMSO (vehicle control) or noted concentration of nocodazole for 20–35 min. (F) Micrograph of cells expressing GFP-DdMyo7 tail fragment under control or 30 µM nocodazole for 30 min. (G) Quantification of DdMyo7 cortical recruitment. (H) Quantification of DdMyo7-tail cortical recruitment. (I) Quantification of filopodia formation. (B–I). Circles on graphs are experimental means. One-way ANOVA with multiple comparison correction to DMSO, ns, not significant, *p<0.05, **p<0.01, ***p<0.0001 (see also Table 1 and Table 1—source data 1–4). (A–E). Scale bars on micrographs are 10 µm.
Figure 3 with 1 supplement
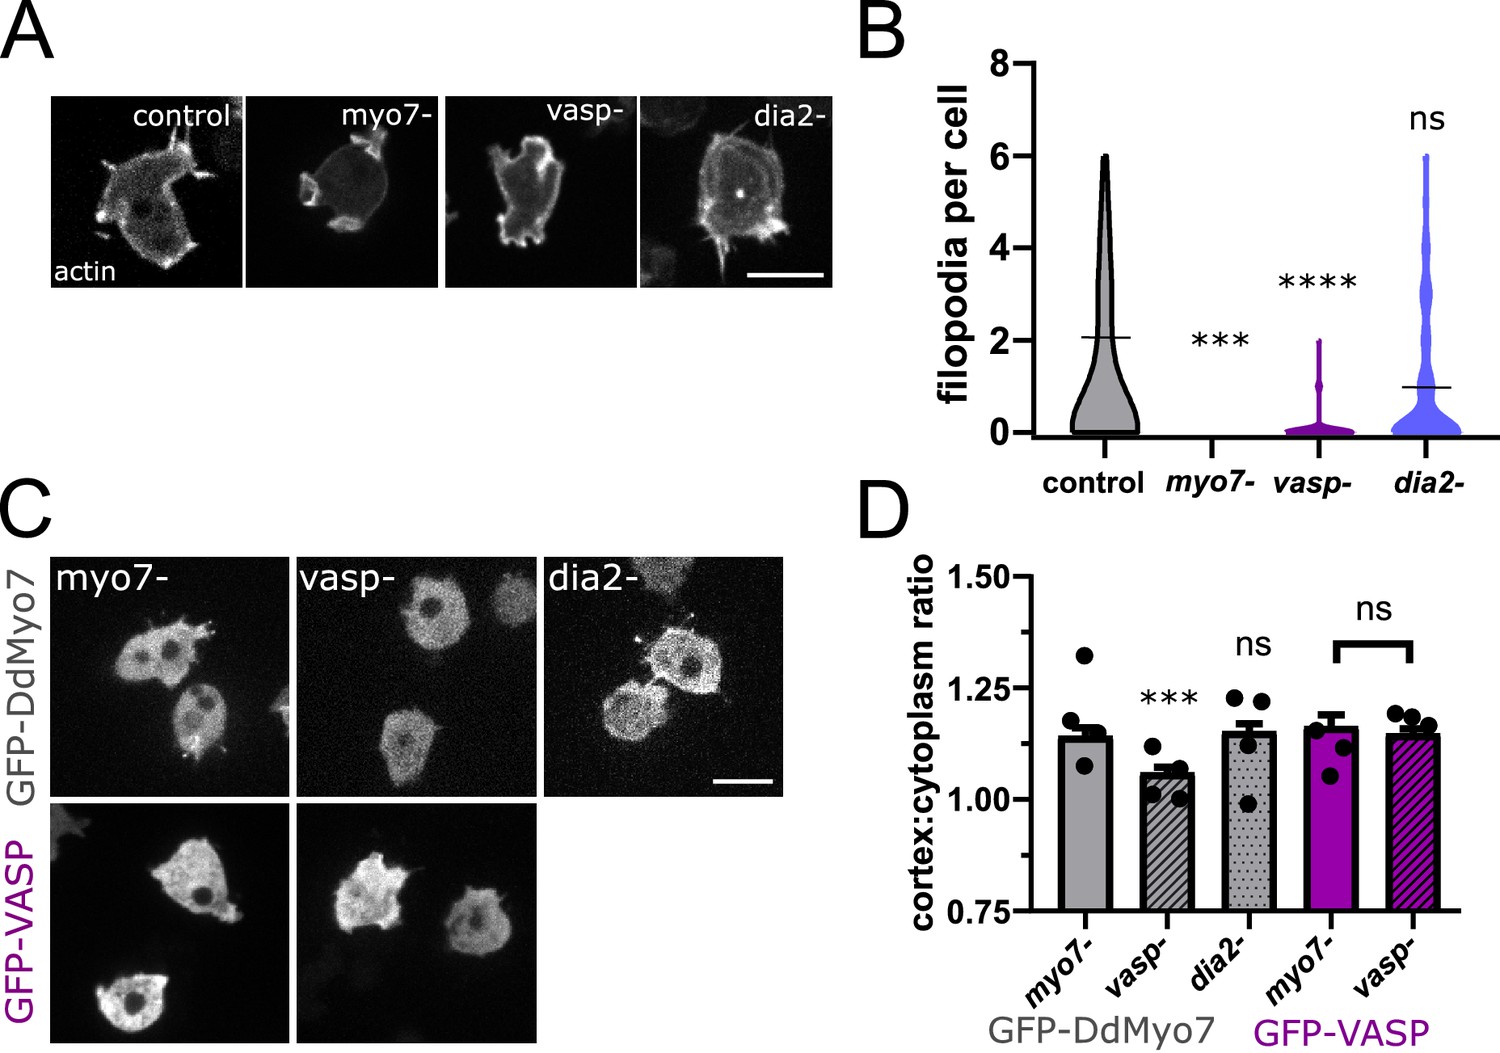
VASP is required for DdMyo7 cortical recruitment.
(A) Confocal images of wild type, myo7 null, vasp null or dia2 null cells expressing RFP-Lifeact (actin). (B) Violin plot of number of filopodia per cell (see also Figure 3—source data 1). (C) Micrographs of cells expressing GFP-DdMyo7 (top) or GFP-VASP in myo7 null, vasp null or dDia2 null cells. (D) Quantification of the cortical band (0.8 µm of periphery) relative to the cytoplasmic intensity of either GFP-Myo7 or GFP-VASP. (A,C) Scale bar is 10 µm (see also Figure 3—source data 3). (B, D) One-way ANOVA with multiple comparison correction or student’s t-test to compare GFP-VASP, ns, not significant, p***<0.001, p****<0.0001, circles are experimental means (see also Figure 3—source data 2 and 4).
-
Figure 3—source data 1
Number of filopodia per cell counted for each cell in strains in Figure 3B.
- https://cdn.elifesciences.org/articles/68082/elife-68082-fig3-data1-v2.xlsx
-
Figure 3—source data 2
Statistical test results for Figure 3B.
- https://cdn.elifesciences.org/articles/68082/elife-68082-fig3-data2-v2.xlsx
-
Figure 3—source data 3
Cortex: cell ratio values for each cell for lines analyzed in Figure 3D.
- https://cdn.elifesciences.org/articles/68082/elife-68082-fig3-data3-v2.xlsx
-
Figure 3—source data 4
Statistical test results for Figure 3D.
- https://cdn.elifesciences.org/articles/68082/elife-68082-fig3-data4-v2.xlsx
Figure 3—figure supplement 1
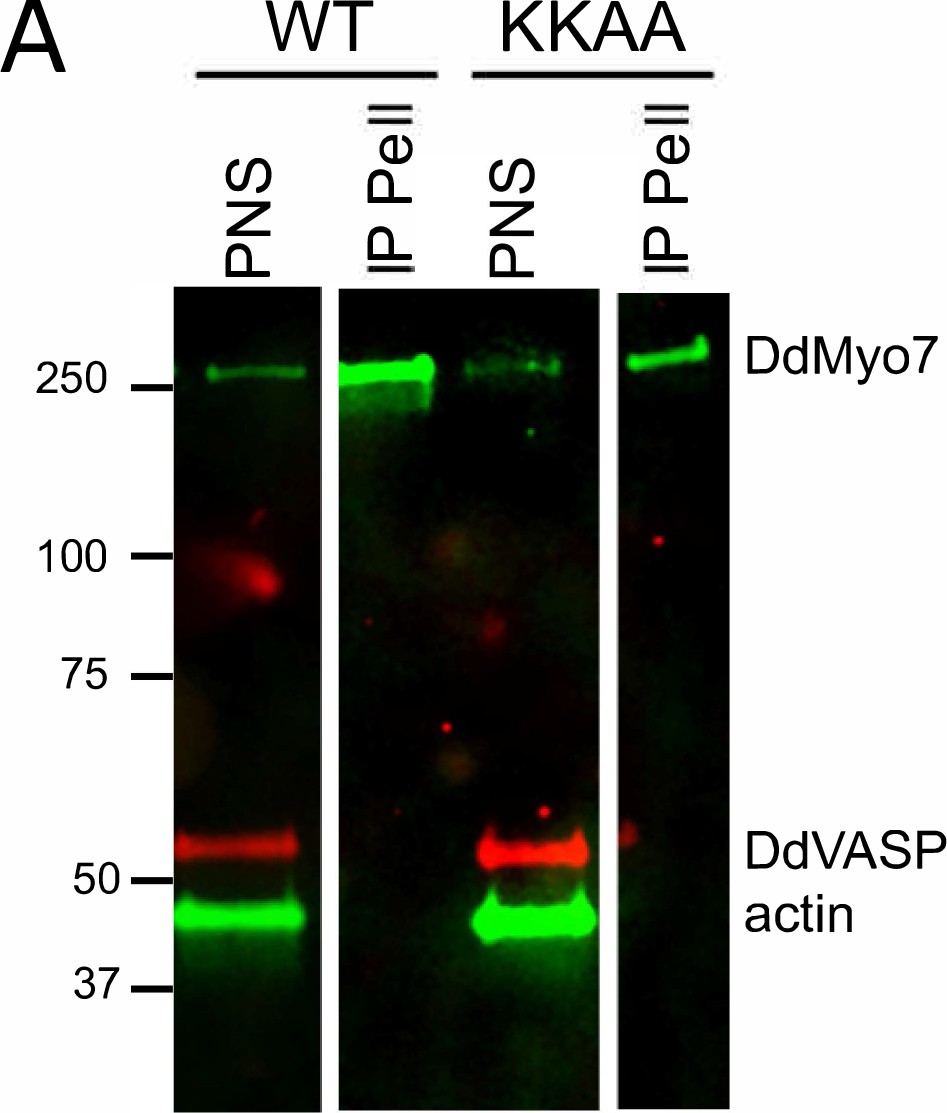
VASP is not present in DdMyo7 immunoprecipitates.
(A) GFP-DdMyo7 or GFP-DdMyo7-KKAA (see Figure 5) were immunoprecipitated from a clarified lysate (post nuclear spin sup; PNS) using GFP nanobody beads. Western blot analysis of PNS and immunoprecipitate pellet (IP Pell) probed with antibodies for DdMyo7, actin, and DdVASP.
Figure 4 with 1 supplement
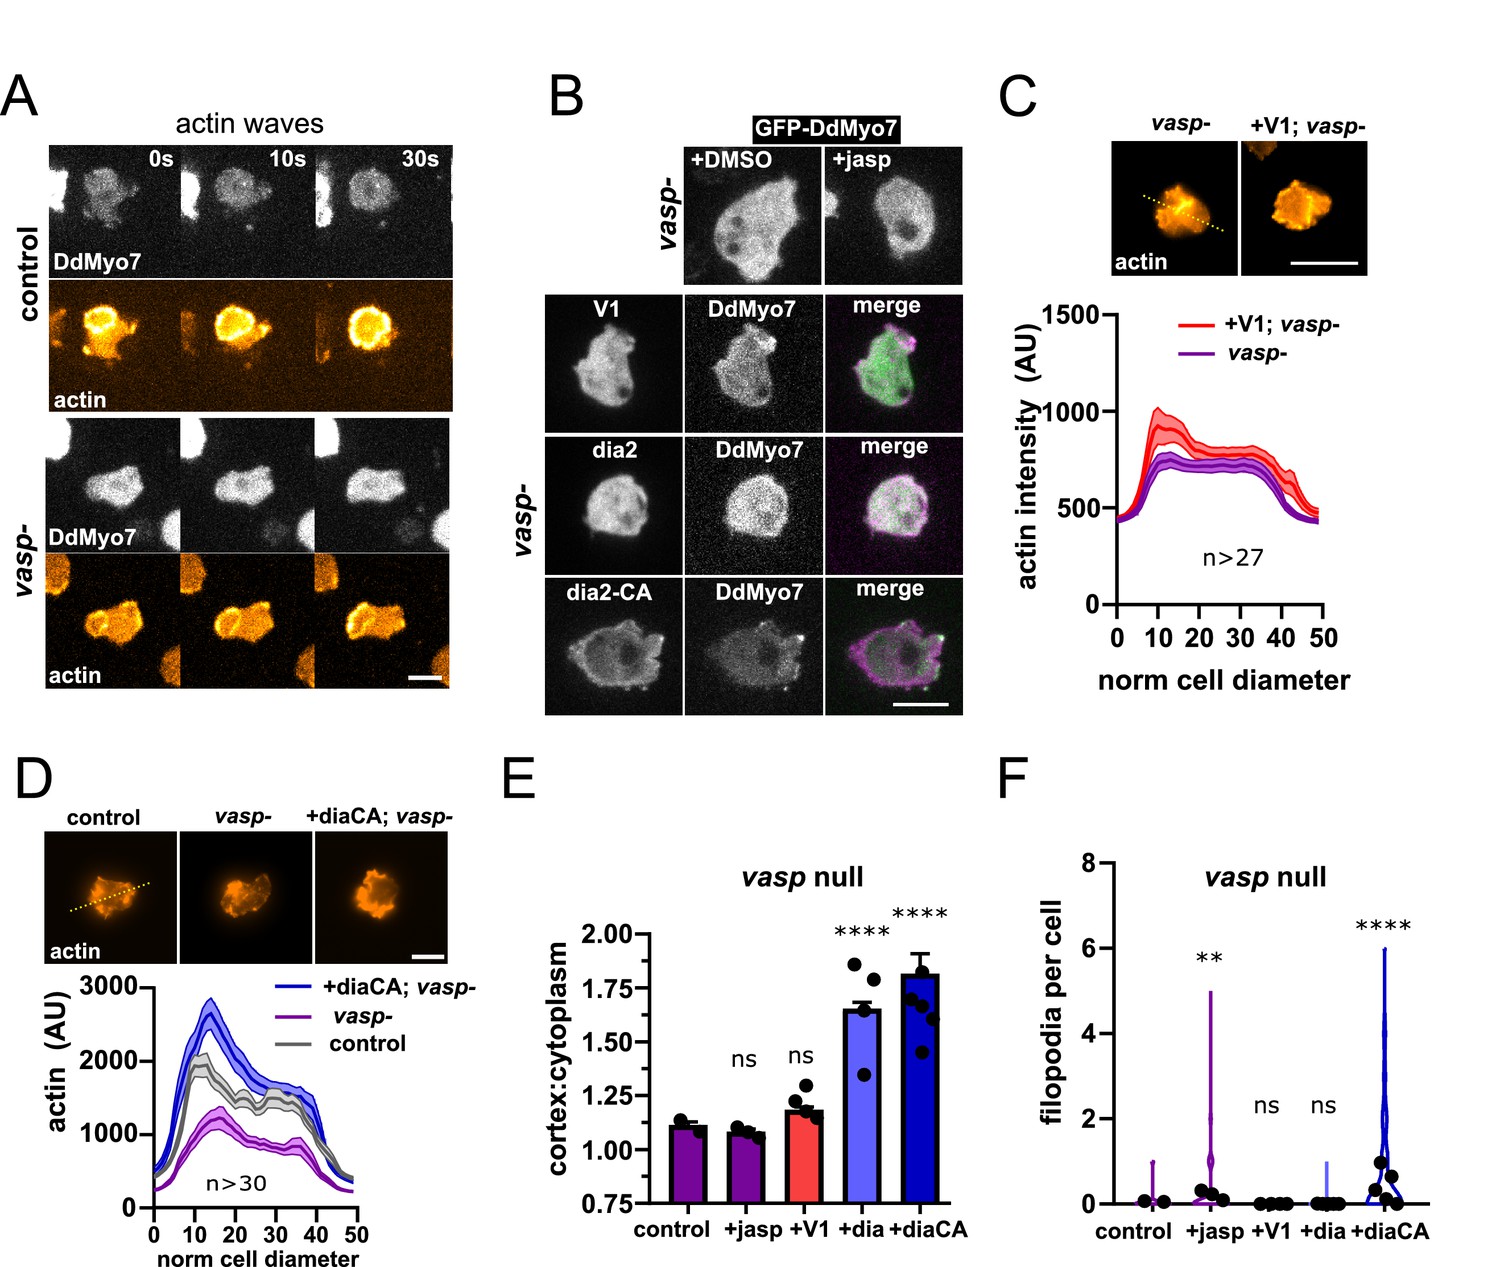
Linear actin polymerization drives DdMyo7 to the cortex.
(A) Image series showing DdMyo7 is absent from latrunculinA-induced actin waves in control (top) or vasp null (bottom) cells. (B) (top) Confocal images of GFP-DdMyo7 in vasp null cells treated with either DMSO or 50 nM jasp treatment. (bottom) Images of vasp null cells expressing GFP or mCherry DdMyo7 and different actin modulating proteins (GFP-V1, green; GFP-dia2WT, green; RFP-dia2CA, magenta). (C, D) Average actin intensity (phalloidin staining, top) of cells through the longest cell axis. The line is the mean and the shaded area is the SEM (graphs, bottom) (see also Figure 4—source data 1). (A–D), Scale bar is 10 µm. (E) Quantification of the cortical band intensity of DdMyo7 in vasp null cells, with no treatment, treated with jasp, or also overexpressing V-1, dia2, or dia2-CA (see also Figure 4—source data 2). (F) Violin plot of filopodia per cell (see also Figure 4—source data 4). (E-F). One-way ANOVA with multiple comparison correction, ns, not significant, **p<0.05, p****<0.0001 (see also Figure 4—source data 3 and 5).
-
Figure 4—source data 1
Actin line scans for Figure 4C,D.
- https://cdn.elifesciences.org/articles/68082/elife-68082-fig4-data1-v2.xlsx
-
Figure 4—source data 2
Cortex: cell ratio values for each cell for lines analyzed in Figure 4E.
- https://cdn.elifesciences.org/articles/68082/elife-68082-fig4-data2-v2.xlsx
-
Figure 4—source data 3
Statistical test results for Figure 4E.
- https://cdn.elifesciences.org/articles/68082/elife-68082-fig4-data3-v2.xlsx
-
Figure 4—source data 4
Filopodia per cell values for each cell for lines analyzed in Figure 4F.
- https://cdn.elifesciences.org/articles/68082/elife-68082-fig4-data4-v2.xlsx
-
Figure 4—source data 5
Statistical test results for Figure 4F.
- https://cdn.elifesciences.org/articles/68082/elife-68082-fig4-data5-v2.xlsx
Figure 4—figure supplement 1
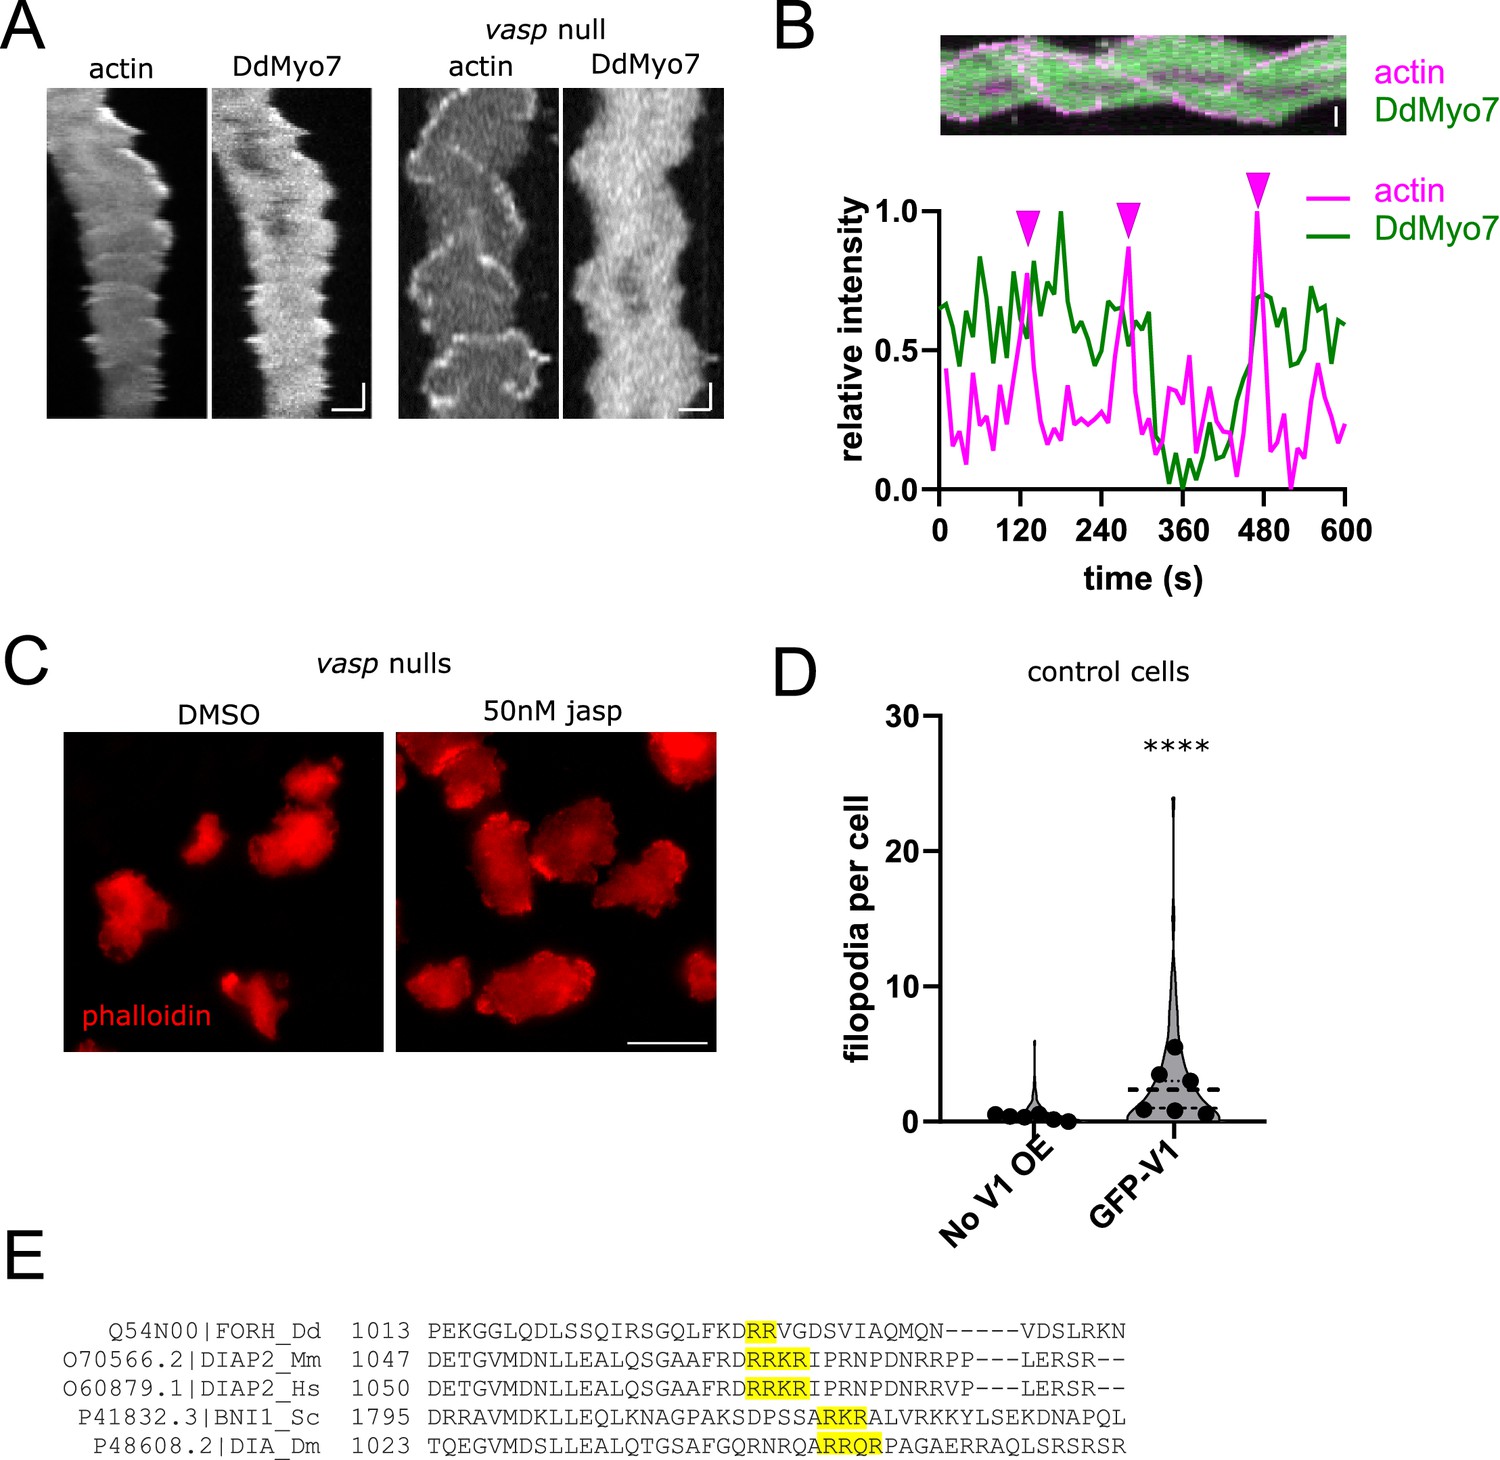
Effects of actin modulating drugs and proteins.
(A) Kymographs of cells expressing RFP-LimEΔcoil and GFP-DdMyo7 induced to make actin waves in either control (left) or vasp- cells. Scale bar is (x,y: 5 µm, 30 s). (B) (top) rotated kymograph of vasp- cell, scale bar is 5 µm. (bottom) Plot profile through center of kymograph above during time-lapse of the cell making actin waves. Arrows above point to peak actin intensity (magenta line) which corresponds to wave formation, green line shows DdMyo7 intensity, which is not well correlated with actin waves. (C) Phalloidin staining of vasp null cells treated with either DMSO or 50 nM jasplakinolide (jasp). (D) Quantification of induction of filopodia formation by control cells (no V1 OE) or cells that overexpress GFP-V1 (see also Figure 4—figure supplement 1—source data 1). Student's t-test, ****p<0.001 (see also Figure 4—figure supplement 1—source data 2). (E) Clustal Omega alignment of the DAD region of diaphanous related formins, the conserved basic residues are highlighted in yellow.
-
Figure 4—figure supplement 1—source data 1
Filopodia per cell values for lines shown in Figure 4—figure supplement 1D.
- https://cdn.elifesciences.org/articles/68082/elife-68082-fig4-figsupp1-data1-v2.xlsx
-
Figure 4—figure supplement 1—source data 2
Statistical test results for Figure 4—figure supplement 1D.
- https://cdn.elifesciences.org/articles/68082/elife-68082-fig4-figsupp1-data2-v2.xlsx
Figure 5
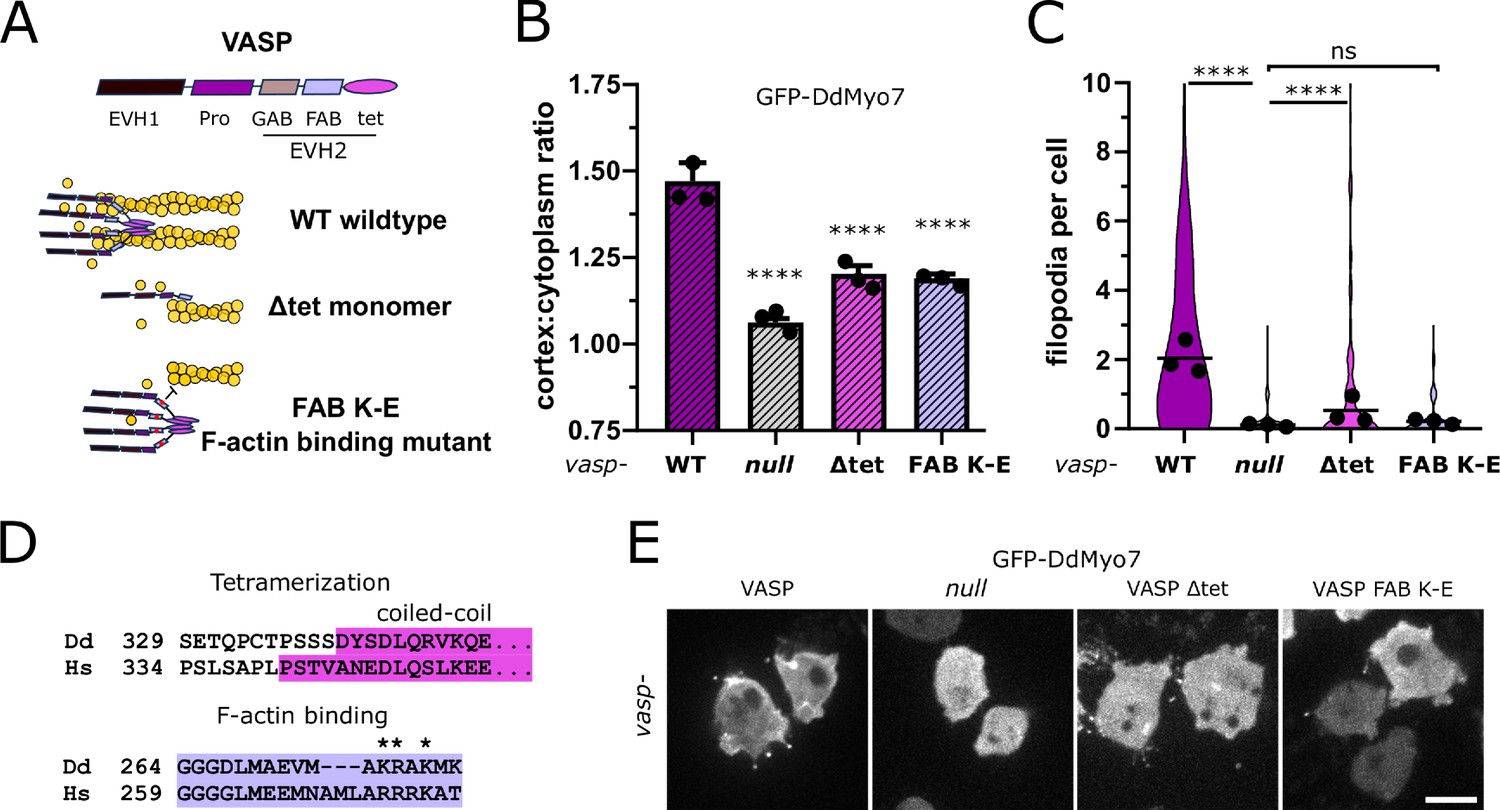
Reduced cortical recruitment of DdMyo7 by VASP mutants.
(A) Schematic of domains of DdVASP (top) and proposed interaction of DdVASP wildtype, monomeric (∆tet), and F-actin binding (FAB K-E) mutant with actin filaments. (B) Quantification of the cortical recruitment of GFP-DdMyo7 co-expressed in the vasp null with wildtype or mutant DdVASP (non-fluorescent) rescue constructs (see also Figure 5—source data 1). (C) Quantification of GFP-DdMyo7 positive filopodia per cell of vasp null cells with wildtype or mutant DdVASP rescue constructs (see also Figure 5—source data 3). (B–C) Circles represent experimental means. One-way ANOVA with multiple comparison correction, p****<0.0001, ns not significant (see also Figure 5—source data 2 and 4). (D) Clustal Omega alignment of Dictyostelium and human VASP sequences with conserved domains highlighted and mutated residues starred. (E) Micrographs of GFP-DdMyo7 in vasp nulls, or vasp nulls expressing wildtype DdVASP or mutant DdVASP rescue constructs. Scale bar is 10 µm.
-
Figure 5—source data 1
Cortex: cell ratio values for each cell for lines analyzed in Figure 5B.
- https://cdn.elifesciences.org/articles/68082/elife-68082-fig5-data1-v2.xlsx
-
Figure 5—source data 2
Statistical test results for Figure 5B.
- https://cdn.elifesciences.org/articles/68082/elife-68082-fig5-data2-v2.xlsx
-
Figure 5—source data 3
Filopodia per cell values for each cell for lines analyzed in Figure 5C.
- https://cdn.elifesciences.org/articles/68082/elife-68082-fig5-data3-v2.xlsx
-
Figure 5—source data 4
Statistical test results for Figure 5C.
- https://cdn.elifesciences.org/articles/68082/elife-68082-fig5-data4-v2.xlsx
Figure 6
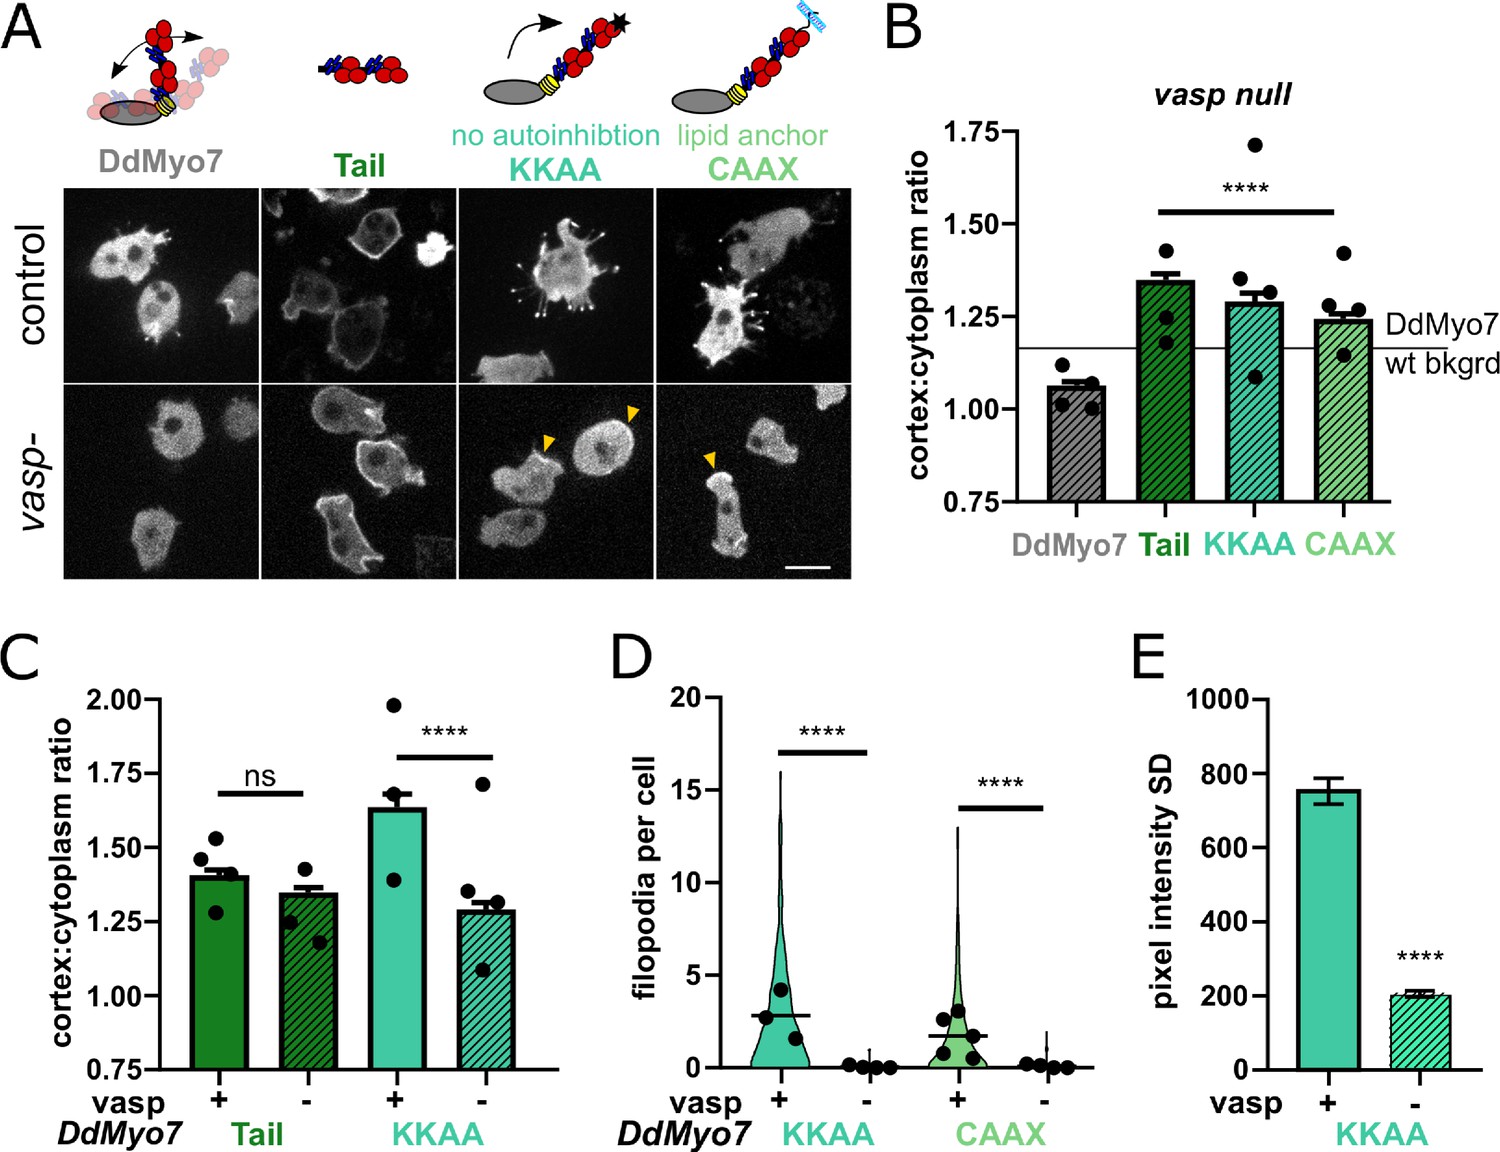
VASP-mediated actin assembly relieves DdMyo7 head-tail autoinhibition to promote targeting and filopodia formation.
(A) (top) Diagrams depicting mutants analyzed. (bottom) Micrographs of GFP-DdMyo7 fusion proteins in control and vasp null cells, scale bar is 10 μm. Arrows indicate cortical enrichment of DdMyo7. (B) Quantification of cortical recruitment of GFP-DdMyo7 and variants in vasp null cells (see also Table 2 and Figure 6—source data 1). The line represents the mean GFP-DdMyo7 recruitment in wild type cells. (C) Comparison of cortical targeting of activated DdMyo7-KKAA or tail in vasp null versus control cells (see also Figure 6—source data 1 and 2). (D) Quantification of number of filopodia per cell in control or vasp null cells (see also Table 2; Figure 6—source data 3). (B–D) Circles represent experimental means. One way ANOVA with multiple comparison test, ns not significant, p***<0.001, p****<0.0001, ns, not significant (see also Figure 6—source data 2 and 4). (E) Quantification of the cortical band intensity variation of DdMyo7-KKAA in control versus vasp null cells (see also Figure 6—source data 5). Students t-test ****p<0.0001.
-
Figure 6—source data 1
Cortex: cell ratio values for each cell for lines analyzed in Figure 6B.
- https://cdn.elifesciences.org/articles/68082/elife-68082-fig6-data1-v2.xlsx
-
Figure 6—source data 2
Statistical test results for Figure 6B,C.
- https://cdn.elifesciences.org/articles/68082/elife-68082-fig6-data2-v2.xlsx
-
Figure 6—source data 3
Filopodia per cell values for each cell for lines analyzed in Figure 6D.
- https://cdn.elifesciences.org/articles/68082/elife-68082-fig6-data3-v2.xlsx
-
Figure 6—source data 4
Statistical test results for Figure 6D.
- https://cdn.elifesciences.org/articles/68082/elife-68082-fig6-data4-v2.xlsx
-
Figure 6—source data 5
Values of the cortical standard deviation measurements (cortical asymmetry) measured for each cell for Figure 6E.
- https://cdn.elifesciences.org/articles/68082/elife-68082-fig6-data5-v2.xlsx
Figure 7 with 1 supplement
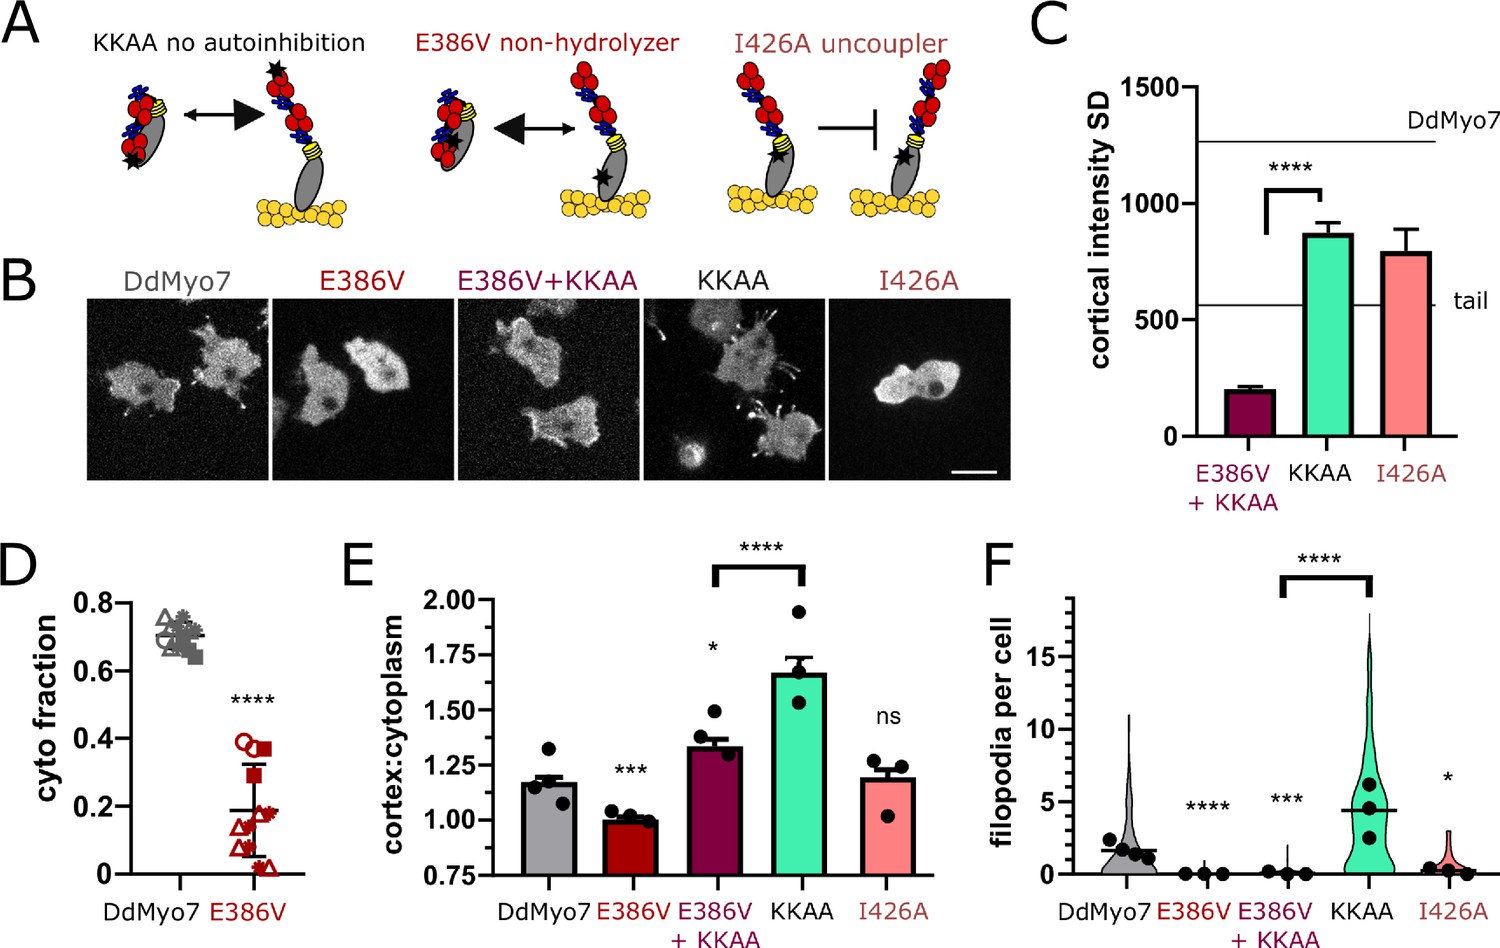
DdMyo7 motor activity is required to release autoinhibition.
(A) Schematic of proposed effect of mutations on DdMyo7 function (see alignment in Figure 7—figure supplement 1). (B) Confocal images of myo7 null cells expressing GFP-DdMyo7 fusion proteins, scale bar is 10 µm. (C) Quantification of the cortical band intensity variation. Mean lines from Figure 1I data on graph for comparison. DdMyo7 versus I426A uncoupler, p=0.07, not significant (see also Figure 7—source data 1 and 2). (D) Fraction of DdMyo7 cosedimenting with the cytoskeleton, symbols with the same shape are technical replicates, students t-test ****p<0.0001 (see also Figure 7—figure supplement 1, Figure 7—source data 3). (E) Quantification of cortical recruitment of DdMyo7 and mutants (see also Figure 7—source data 4). (F) Filopodia number per cell of wildtype and DdMyo7 mutants (see also Figure 7—source data 6). (E–F) Data for KKAA is taken from Figure 6, experimental means shown as circles. (C, E, and F) One-way ANOVA with multiple comparison correction, p*<0.05, p***<0.001, p****<0.0001, ns not significant (see also Figure 7—source data 5 and 7).
-
Figure 7—source data 1
Values of the cortical standard deviation measurements (cortical asymmetry) measured for each cell for Figure 7C, see also Figure 1—source data 1 and Figure 6—source data 5.
- https://cdn.elifesciences.org/articles/68082/elife-68082-fig7-data1-v2.xlsx
-
Figure 7—source data 2
Statistical test results for Figure 7C.
- https://cdn.elifesciences.org/articles/68082/elife-68082-fig7-data2-v2.xlsx
-
Figure 7—source data 3
Data and statistics test results for Figure 7D.
- https://cdn.elifesciences.org/articles/68082/elife-68082-fig7-data3-v2.xlsx
-
Figure 7—source data 4
Cortex: cell ratio values for each cell for lines analyzed in Figure 7E.
- https://cdn.elifesciences.org/articles/68082/elife-68082-fig7-data4-v2.xlsx
-
Figure 7—source data 5
Statistical test results for Figure 7E.
- https://cdn.elifesciences.org/articles/68082/elife-68082-fig7-data5-v2.xlsx
-
Figure 7—source data 6
Filopodia per cell values for each cell for lines analyzed in Figure 7F.
- https://cdn.elifesciences.org/articles/68082/elife-68082-fig7-data6-v2.xlsx
-
Figure 7—source data 7
Statistical test results for Figure 7F.
- https://cdn.elifesciences.org/articles/68082/elife-68082-fig7-data7-v2.xlsx
Figure 7—figure supplement 1
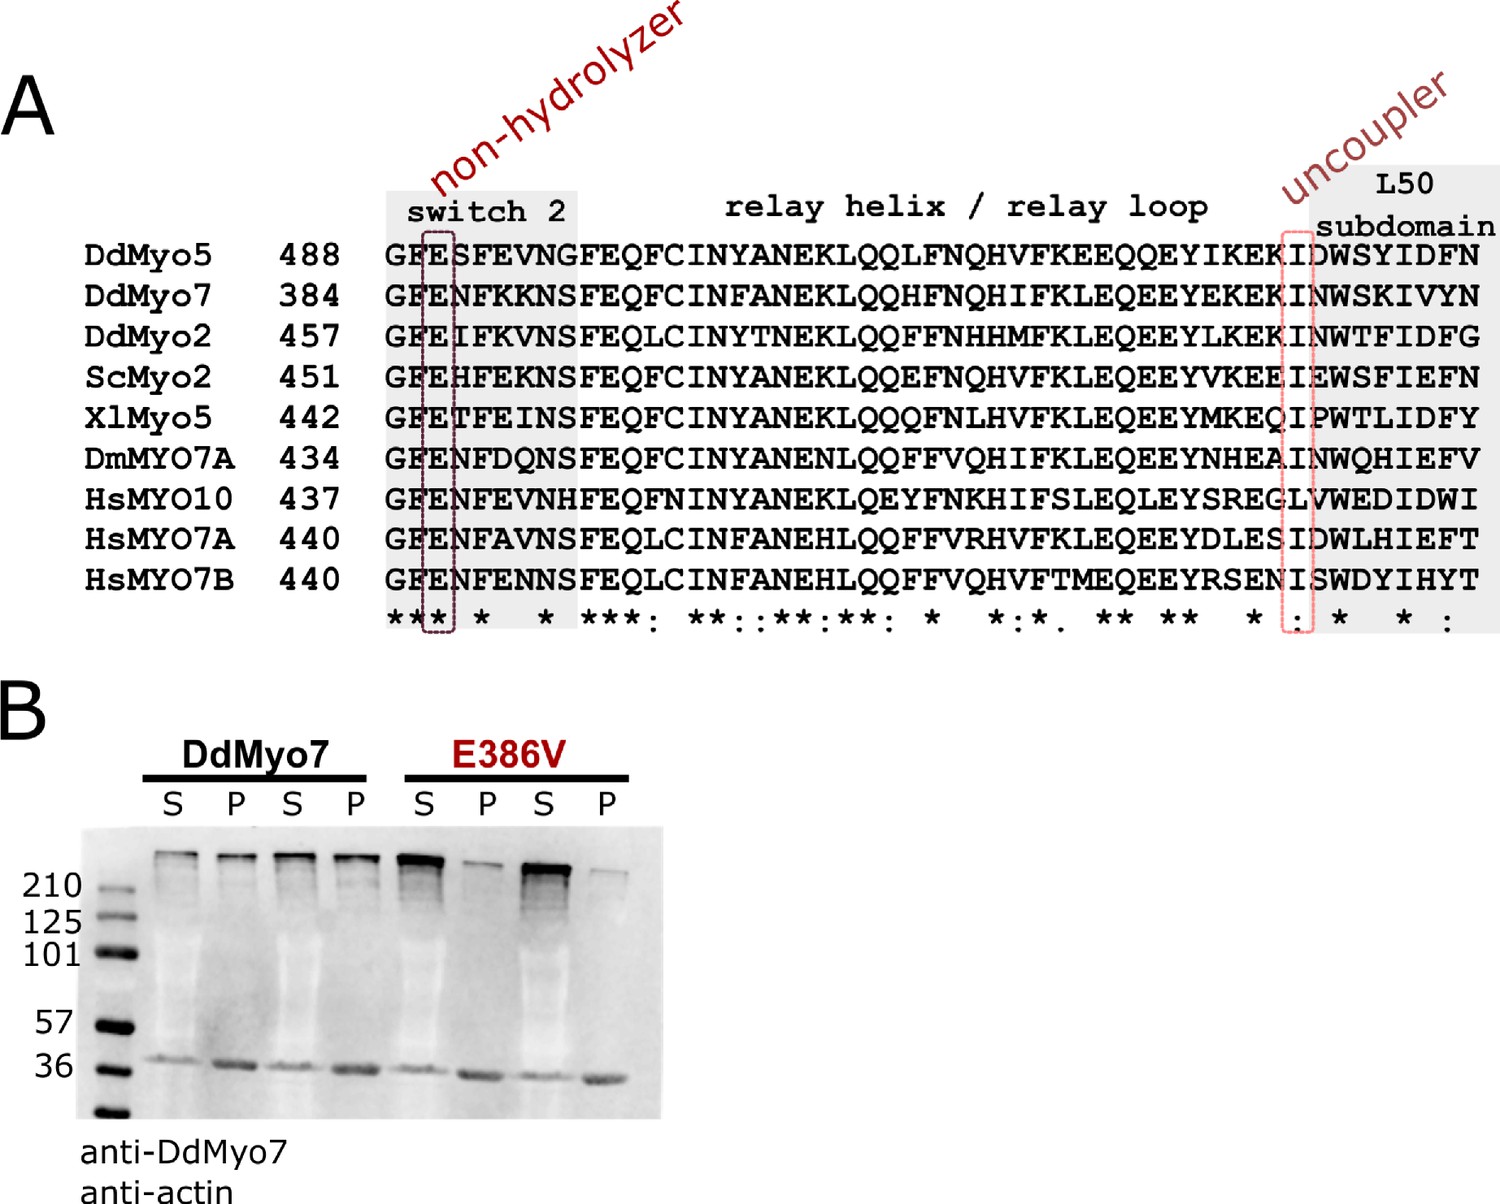
Conservation of the DdMyo7 motor domain.
(A) M-coffee sequence alignment (Wallace, 2006) of the relay helix region of different myosin motor domains, left column number is amino acid position. Switch two and L50 subdomain are shaded, circled columns indicate the highly conserved glutamic acid in switch 2 (non-hydrolyzer, DdMyo7 E386V) and hydrophobic residue in relay loop (uncoupler, DdMyo7 I426A). Symbols below indicate degree of conservation between sequences: ‘*’ identical, ‘:’ strongly similar, ‘.’ weakly similar. (B) Representative western blot analysis of two cytoskeleton prep supernatants (S) and pellets (P) from myo7 null cells expressing either wildtype or the E386V mutant. Band at 270 kDa is DdMyo7, band at 42 kDa is actin.
Figure 8
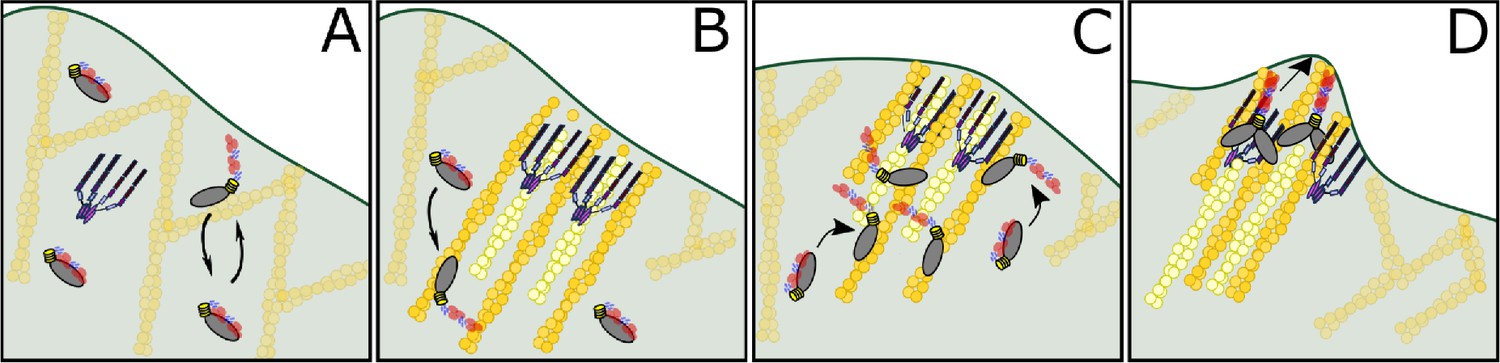
Model of DdMyo7 and VASP mediated filopodia initiation.
(A) The leading edge of the cell has a branched actin network and DdMyo7 is mostly autoinhibited in the cytoplasm. DdMyo7 monomers cycle back to a closed state if they do not dimerize. (B) VASP polymerizes actin at the leading edge, organizing the filaments into linear, parallel bundles. The DdMyo7 autoinhibitory state is destabilized is in the presence of this dense network via binding to actin filaments. (C) The motor of autoinhibited DdMyo7 binds to actin within the VASP-actin network, and the tail undergoes partner-mediated dimerization due to close proximity of other myosins. (D) Cooperative actions of VASP (bundles and polymerizes) and DdMyo7 dimers (bundle) organize actin filaments into nascent filopodia that continue to elongate by actin polymerization.
Tables
Table 1
Cortical recruitment ratio of DdMyo7 and filopodia per cell for GFP-DdMyo7/myo7 null cells treated with various pharmacological compounds.
| Controls | Buffer only | 1% DMSO | Noco. Ctrl. |
|---|---|---|---|
| Percent of cells with filopodia | 42 | 38 | 29 |
| Filopodia number + SEM | 2.01 ± 0.11 | 1.97 ± 0.09 | 1.5 ± 0.17 |
| Cortex:cytoplasm ratio + SEM | 1.18 ± 0.01 | 1.2 ± 0.02 | 1.31 ± 0.03 |
| N, n | 4, 238 | 3, 229 | 4138 |
| CytochalasinA | 1 µM | 5 µM | 30 µM |
| Percent of cells with filopodia | 0 | 8.5 | 19 |
| Filopodia number + SEM | 0 | 1.3 ± 0.04 | 0.1 ± 0.06 |
| Cortex:cytoplasm ratio + SEM | 1.02 ± 0.02 | 1.07 ± 0.01 | 1.04 ± 0.02 |
| N, n | 3, 66 | 3, 234 | 1, 42 |
| LatrunculinA | 1 µM | 5 µM | 15 µM |
| Percent of cells with filopodia | 19 | 4.7 | 20 |
| Filopodia number + SEM | 1.73 ± 0.06 | 1.33 ± 0.05 | 0.24 ± 0.06 |
| cortex:cytoplasm ratio + SEM | 1.12 ± 0.01 | 1.02 ± 0.01 | 1.08 ± 0.02 |
| N, n | 4, 387 | 3, 127 | 1, 74 |
| Jasplakinolide | 15 nM | 50 nM | 100 nM |
| Percent of cells with filopodia | 55 | 72 | 48 |
| Filopodia number + SEM | 1.47 ± 0.23 | 3.89 ± 0.2 | 2.21 ± 0.09 |
| Cortex:cytoplasm ratio + SEM | 1.19 ± 0.03 | 1.34 ± 0.03 | 1.24 ± 0.02 |
| N, n | 1, 84 | 3, 219 | 3, 337 |
| LY294002/wortmannin | 20 μM LY294002 | 60 μM LY294002 | 2 μM WM |
| Percent of cells with filopodia | 22 | 40 | 30 |
| Filopodia number + SEM | 0.56 ± 0.44 | 0.87 ± 0.12 | 0.84 ± 0.16 |
| Cortex:cytoplasm ratio + SEM | 1.22 ± 0.08 | 1.17 ± 0.04 | 1.16 ± 0.02 |
| N, n | 2, 9 | 4, 194 | 2, 101 |
| CK666 | 25 μM | ||
| Percent of cells with filopodia | 10.7 | ||
| Filopodia number + SEM | 0.145 ± 0.03 | ||
| Cortex:cytoplasm ratio + SEM | 1.12 ± 0.01 | ||
| N, n | 3, 366 | ||
| Nocodazole | 5 μM | 15 μM | 50 μM |
| Percent of cells with filopodia | 32 | 14 | 8 |
| Filopodia number + SEM | 1.74 ± 0.22 | 1.27 ± 0.11 | 1.1 ± 0.09 |
| Cortex:cytoplasm ratio + SEM | 1.15 ± 0.03 | 1.12 ± 0.01 | 1.1 ± 0.01 |
| N, n | 2, 59 | 4, 133 | 2, 127 |
-
Percent of all cells with at least one filopodia. Average number of filopodia per cells from cells with at least one filopodia. Cortex:cytoplasm ratio is intensity ratio of a 0.8 µm band around the periphery compared to the cytoplasm. N is number of experiments, n is number of cells. SEM is standard error of the mean. See also Table 1—source data 1–4.
-
Table 1—source data 1
Filopodia per cell values for each cell for lines analyzed in Table 1.
- https://cdn.elifesciences.org/articles/68082/elife-68082-table1-data1-v2.xlsx
-
Table 1—source data 2
Statistical test results for filopodia per cell data in Table 1 (see also Figure 2—figure supplement 1).
- https://cdn.elifesciences.org/articles/68082/elife-68082-table1-data2-v2.xlsx
-
Table 1—source data 3
Cortex: cell ratio values for each cell for lines presented in Table 1.
- https://cdn.elifesciences.org/articles/68082/elife-68082-table1-data3-v2.xlsx
-
Table 1—source data 4
Statistical test results for cortex: cell ratio data in Table 1 (see also Figure 2—figure supplement 1).
- https://cdn.elifesciences.org/articles/68082/elife-68082-table1-data4-v2.xlsx
Table 2
Quantification of filopodia number and cortical targeting.
| myo7- | DdMyo7 | KKAA | E386V | E386V-KKAA | I426A | CAAX | Tail | GFP-VASP | ||||
| percent of cells with filopodia | 54 | 80 | 1 | 3 | 22 | 58 | n.c. | n.c. | ||||
| filopodia number + SEM | 2.53 ± 0.15 | 5.32 ± 0.33 | 1 ± 0 | 1.5 ± 0.09 | 1.75 ± 0.15 | 2.87 ± 0.14 | n.c. | n.c. | ||||
| cortex:cytoplasm ratio + SEM | 1.18 ± 0.02 | 1.67 ± 0.06 | 1 ± 0.01 | 1.32 ± 0.04 | 1.19 ± 0.04 | 1.39 ± 0.03 | 1.61 ± 0.07 | 1.18 ± 0.29 | ||||
| N, n | 4, 198 | 3, 133 | 3, 186 | 3, 59 | 3, 37 | 3, 237 | 3, 55 | 3, 91 | ||||
| vasp- | GFP-DdMyo7 | VASP-∆TET | VASP -WT | VASP-FAB-K-E | GFP-VASP | DdMyo7-CAAX | DdMyo7-Tail | DdMyo7-KKAA | GFP-Dia2 | mCherry-Dia2-CA | GFP-V1 | |
| percent of cells with filopodia | 7 | 35 | 69 | 14 | n.c. | 4 | n.c. | 4 | 0 | 29 | 0 | |
| filopodia number + SEM | 1.25 ± 0.07 | 3.78 ± 0.31 | 3.07 ± 0.25 | 1.39 ± 0.03 | n.c. | 1.2 ± 0.03 | n.c. | 1 ± 0 | 0 ± 0 | 2.03 ± 0.24 | 0 ± 0 | |
| cortex:cytoplasm ratio + SEM | 1.06 ± 0.01 | 1.2 ± 0.02 | 1.47 ± 0.05 | 1.19 ± 0.01 | 1.18 ± 0.33 | 1.24 ± 0.01 | 1.35 ± 0.02 | 1.29 ± 0.02 | 1.65 ± 0.03 | 1.82 ± 0.09 | 1.12 ± 0.02 | |
| N, n | 3, 118 | 3, 131 | 3, 81 | 3, 322 | 3, 200 | 4, 239 | 3, 213 | 3, 193 | 5447 | 8,94 | 3,35 | |
| Ax2 control | GFP-DdMyo7 | GFP-DdMyo7-CAAX | GFP-DdMyo7-Tail | GFP-DdMyo7-KKAA | GFP-VASP | |||||||
| percent of cells with filopodia | 45 | 54 | n.c. | 73 | n.c. | |||||||
| filopodia num ber + SEM | 2.36 ± 0.2 | 2.9 ± 0.15 | n.c. | 3.65 ± 0.2 | n.c. | |||||||
| cortex:cytoplasm ratio + SEM | 1.35 ± 0.03 | 1.45 ± 0.04 | 1.41 ± 0.02 | 1.79 ± 0.07 | 1.16 ± 0.25 | |||||||
| N, n | 4, 124 | 5, 266 | 4, 351 | 3, 219 | 4, 216 |
-
The percent of all cells with at least one filopodia. Average number of filopodia per cells from cells with at least one filopodia. Cortex:cytoplasm ratio is intensity ratio of a 0.8 µm band around the periphery compared to the cytoplasm. N is number of experiments, n is number of cells. SEM is standard error of the mean. GFP-VASP and GFP-DdMyo7-Tail fail to efficiently target to filopodia tips and thus were not counted (n.c.) in this analysis. (See source data: Figure 4—source data 1 and 2; Figure 5—source data 1–3; Figure 6—source data 1–5; Figure 7—source data 1, 2, 4 and 5).
Appendix 1—key resources table
| Reagent type (species) or resource | Designation | Source or reference | Identifiers | Additional information |
|---|---|---|---|---|
| cell line (Dictyostelium) | control wild type | Provided by Dr. Günther Gerisch (MPI Martinsried) | Ax2 | Available at Dictybase.org |
| cell line (Dictyostelium) | control wild type | Provided by Dr. Rick Firtel (UCSD) | Ax3 | Available at Dictybase.org |
| cell line (Dictyostelium) | myo7 null | Titus Lab Tuxworth et al., 2001 | myo7 null HTD17-1 (G1-20) | Ax3 background |
| cell line (Dictyostelium) | control non-homologous recombinant - myo7 null | Titus Lab Tuxworth et al., 2001 | G1-21 | Ax3 background |
| cell line (Dictyostelium) | vasp null | Firtel Lab Han et al., 2002 | vasp- | Ax3 background |
| cell line (Dictyostelium) | dDia2 null | Provided by Dr. Jan Faix (Hannover Med Sch, Hannover Germany) Schirenbeck et al., 2005 | dia- | Ax2 background |
| Other | HL5 Medium including Glucose | Formedium | HLG0103 | Dictyostelium growth medium |
| Database | Dictybase.org | Fey et al., 2013 | ||
| Software | Prism 8.0 | Graphpad | Statistical Analysis | graph preparation, statistical analysis |
| Software | Seven | Petersen et al., 2016 | https://github.com/tituslabumn/Seven | |
| Antibody | Rabbit anti-DdMyo7 | UMN-87 Tuxworth et al., 2005 | 1:2000 | |
| Antibody | mouse monoclonal anti-GFP, clone B34 | Biolegend | 902602 | 1:5000 |
| Antibody | Rabbit polyclonal anti-vasp | Provided by Dr. Jan Faix (Hannover Med Sch, Hannover Germany) Breitsprecher et al., 2008 | 1:500 | |
| Antibody | Rabbit polyclonal anti myoB | Titus Lab Novak et al., 1995 | 1:2000 | |
| Antibody | Rabbit polyclonal anti-mCherry | Proteintech | 26765–1-AP | 1:500 |
| Antibody | Goat anti rabbit secondary | Licor | IR680 | 1:2500-1:10,000 |
| Antibody | Goat anti mouse secondary | Licor | IR800 | 1:2500-1:10,000 |
| Antibody | Mouse monoclonal anti- Dictyostelium actin | Provided by Dr. Günther Gerisch (MPI Martinsried) Westphal et al., 1997 | 1:4000 | |
| Chemical compound | G418 | Fisher Scientific | BP-673 | antibiotic |
| Chemical compound | G418 | Gold Biotechnology | G-418 | antibiotic |
| Chemical compound | Hygromycin B | Gold Biotechnology | H-270 | antibiotic |
| Chemical compound | Doxycycline Hyclate | Sigma | D9891 | antibiotic |
| Chemical compound | Pencillin G Sodium Salt | Sigma | P3032 | antibiotic |
| Chemical compound | Streptomycin Sulfate | Sigma | S9137 | antibiotic |
| Chemical compound, drug | Cytochalasin A | Sigma | C-6637 | |
| Chemical compound, drug | Jasplakinolide | Sigma | J4580 | |
| Chemical compound, drug | Latrunculin A | Sigma | L5163 | |
| Chemical compound, drug | LY294002 | EMD Millipore | 440204 | |
| Chemical compound, drug | Nocodazole | Sigma | M1404 | |
| Chemical compound, drug | Wortmannin | Sigma | W1628 | |
| Chemical compound, drug | CK666 | Gift from Dr. Brad Nolen (U. Oregon) Nolen et al., 2009 | ||
| Chemical compound, drug | Alexa Fluor 568 Phalloidin | Invitrogen | A12380 | |
| Chemical compound, drug | Alexa Fluor 647 Phalloidin | Invitrogen | A22287 | |
| Chemical compound, drug | FM 4-64 Dye | ThermoFisher | T13320 | |
| other | Q5 polymerase | New England Biolabs | M049L | |
| commercial assay or kit | NEBuilder HiFi DNA Assembly | New England Biolabs | E5520S | |
| Recombinant DNA reagent | synthesized gene - mScarlet I | Genscript | actagtggtggttcaggaGTTTCAAAAGGTGAAGCCGTTATTAAAGAATTTATGAGATTCAAGGTTCACATGGAAGGAAGTATGAACGGTCATGAATTTGAGATTGAAGGAGAAGGTGAAGGTAGACCATATGAAGGCACCCAAACAGCTAAATTAAAAGTAACTAAAGGTGGTCCATTACCATTTAGTTGGGATATTTTATCTCCACAATTTATGTATGGTTCACGTGCTTTCAttAAACATCCAGCAGATATTCCAGATTATTATAAACAATCATTTCCAGAA GGTTTTAAATGGGAACGTGTCATGAACTTTGAAGATGGTGGAGCAGTTACAGTCACACAAGATACCTCATTAGAAGATGGTACATTAATATATAAAGTTAAATTACGTGGTACTAATTTTCCACCAGACGGTCCAGTAATGCAAAAAAAAACAATGGGCTGGGAAGCTAGT ACAGAACGTTTATATCCTGAAGATGGTGTCCTTAAAGGCGATATAAAAATGGCCTTGAGATTAAAGGATGGTGGTAGGTATTTAGCAGATTTCAAAACCACTTATAAAGCAAAAAAACCAGTTCAAATGCCAGGTGCATATAATGTTGATAGAAAACTTGATATTACCAGTCATAATGAAGATTACACAGTTGTCGAACAATACGAACGTTCTGAAGGTCGTCATAGCACTGGTGGTATGGATGAATTATACAAATAAgctagc | |
| Recombinant DNA reagent | synthesized gene - mNeon | Genscript | ggatccATGGTGAGTAAAGGTGAAGAAGATAATATGGCATCGTTACCAGCTACACATGAGTTACATATATTCGGTAGCATTAATGGTGTTGATTTTGATATGGTGGGACAAGGTACCGGTAATCCTAATGATGGTTACGAAGAACTAAATTTAAAATCGACTAAAGGTGACTTACAATTTTCTCCATGGATTTTAGTGCCACATATAGGGTATGGTTTTCATCAATACTTACCATATCCAGATGGTATGTCACCATTTCAAGCTGCAATGGTTGATGGATCAGGTTATCAAGTTCATAGAACAATGCAATTTGAAGATGGTGCTTCATTAACTGTTAATTATAGATACACATATGAAGGCTCACATATTAAAGGTGAAGCTCAAGTTAAAGGTACTGGTTTCCCAGCCGATGGCCCAGTTATGACAAATAGTTTAACAGCAGCAGATTGGTGTAGATCCAAAAAAACTTATCCAAATGATAAAACAATTATTTCAACTTTTAAATGGTCATATACAACCGGTAATGGTAAACGTTATCGTTCAACAGCCCGTACAACATATACTTTTGCTAAACCAATGGCAGCTAATTATTTAAAAAATCAACCAATGTATGTTTTTCGTAAAACAGAGTTAAAACATTCAAAAACAGAACTTAATTTTAAAGAATGGCAAAAAGCATTTACAGACGTTATGGGTATGGATGAACTTTATAAGagatct | |
| Sequence-based reagent | CAAX F | IDTDNA | PCR Primer (pDTi346 plasmid) | ttattaTAAAAAAATTAAAATAAAATAAAATCTCGTG |
| Sequence-based reagent | CAAX R | IDTDNA | PCR Primer (pDTi346 plasmid) | tgtacaTTGAGAAGAATAAAATTGATAAACTG |
| Sequence-based reagent | E386V F | IDTDNA | PCR Primer (pDTi364 plasmid) | ttttgtAAATTTTAAAAAGAATAGTTTTGAACAATTTTG |
| Sequence-based reagent | E386V R | IDTDNA | PCR Primer (pDTi364 plasmid) | ccaaagATATCCAATACACCAATAAATGTTG |
| Sequence-based reagent | I426A F | IDTDNA | PCR Primer (pDTi435 plasmid) | AAAAGAAAAAgctAATTGGAGTAAGATCGTATATAATG |
| Sequence-based reagent | I426A R | IDTDNA | PCR Primer (pDTi435 plasmid) | TCATATTCTTCTTGTTCTAATTTAAAAATATG |
| Sequence-based reagent | myi42 | in-house synthesis | PCR Primer (pDTi289 + 2 plasmid) | catgccatggcagcagcagcaACCTTAAAGAGAAAAGCACCAGTCG |
| Sequence-based reagent | myi185 + 2 | IDTDNA | PCR primer (pDTi289 + 2 plasmid) | gctagcaaTTGAGAAGAATAAAATTGATAAACTGAAGC |
| Sequence-based reagent | VASP339* F | IDTDNA | related to pVASP29 plasmid | taataaAGAGCATCTCAACATTAACTAG |
| Sequence-based reagent | VASP339* R | IDTDNA | PCR Primer (pVASP29 plasmid) | cccgggAGCTGATAAGGATGGTGAAG |
| Sequence-based reagent | FAB K-E F | IDTDNA | PCR Primer (pVASP34 plasmid) | gaaatggagGCAGCAGCATCTCAACCAA |
| Sequence-based reagent | FAB K-E R | IDTDNA | PCR primer (pVASP34 plasmid) | ggcttcctcGGCCATAACTTCGGCCAT- |
| Sequence-based reagent | forH4L F | IDTDNA | PCR primer (dDia2-SC plasmid) | AATTGACCAGATCTAATTTGAG |
| Sequence-based reagent | forH8 R | IDTDNA | PCR primer (dDia2 SC plasmid) | actagtTTATTTTTTTAATTGGCCTGATGG |
| Sequence-based reagent | forH9 F | IDTDNA | PCR primer (dDia2-CA SC plasmid) | ggatccATGTCTTTTGATTTAGAGAGTAATAGTAGTGG |
| Sequence-based reagent | forH10 R | IDTDNA | PCR primer (dDia2-CA SC plasmid) | ATTCAAAGATagaagaGTTGGTGATTCTGTCATTG |
| Sequence-based reagent | V1 F | IDTDNA | PCR primer (V-1 SC plasmid) | agatctATGGAAGAACAAAATGATTTCAC |
| Sequence-based reagent | V1 R | IDTDNA | PCR primer (V-1 SC plasmid) | actagtTTATTTTAATAATGCTTTAATATCAGC |
| Transformed construct (Dictyostelium) | GFP-DdMyo7-Tail | Titus Lab Tuxworth et al., 2005 | pDTi35 | pSmall, G418, Extrachromosomal |
| Transformed construct (Dictyostelium) | GFP-DdMyo7 | Titus Lab Tuxworth et al., 2001 | pDTi74 | pBS, G418, Integrating |
| Transformed construct (Dictyostelium) | GFP-DdMyo7motor-FD | Titus Lab Arthur et al., 2019 | pDTi490 | pDXA, G418, Extrachromosomal |
| Transformed construct (Dictyostelium) | GFP-DdMyo7-KKAA | Titus Lab Arthur et al., 2019 | pDTi321 | pBS, G418, Integrating |
| Transformed construct (Dictyostelium) | GFP-DdMyo7-E386V | Titus Lab this paper | pDTi364 | pBS, G418, Integrating |
| Transformed construct (Dictyostelium) | GFP-DdMyo7-E386V; KKAA | Titus Lab this paper | pDTi386 | pBS, G418, Integrating |
| Transformed construct (Dictyostelium) | GFP-DdMyo7-CAAX | Titus Lab this paper | pDTi346 | pBS, G418, Integrating |
| Transformed construct (Dictyostelium) | GFP-DdMyo7-I426A | Titus Lab this paper | pDTi435 | pTX-GFP, G418, Extrachromosomal |
| Transformed construct (Dictyostelium) | GFP-DdMyo7 | Titus Lab this paper | pDTi504 | pDM317, G418, Extrachromosomal |
| Transformed construct (Dictyostelium) | mNeon-DdMyo7 | Titus Lab, this paper | pDTi516 | pDM304, G418, Extrachromosomal |
| Transformed construct (Dictyostelium) | mNeon-DdMyo7-E386V | Titus Lab, this paper | pDTi527 | pDM304, G418, Extrachromosomal |
| Transformed construct (Dictyostelium) | DdMyo7-mCherry | Titus Lab, this paper | pDTi340 | pDM358, Hyg, Extrachromosomal |
| Transformed construct (Dictyostelium) | mApple-DdMyo7 | Titus Lab | pDTi512 | pDM358, Hyg, Extrachromosomal |
| Transformed construct (Dictyostelium) | GFP-VASP | Provided by Dr. Rick Firtel (UCSD) Han et al., 2002 | GFP-VASP | EXP4+, G418, Extrachromosomal |
| Transformed construct (Dictyostelium) | VASP | Titus Lab, this paper | VASP | pDM358, Hyg, Extrachromosomal |
| Transformed construct (Dictyostelium) | VASP-∆TET | Titus Lab, this paper | VASP-∆TET | pDM358, Hyg, Extrachromosomal |
| Transformed construct (Dictyostelium) | VASP-FAB | Titus Lab, this paper | VASP-FAB | pDM358, Hyg, Extrachromosomal |
| Transformed construct (Dictyostelium) | diaWT | Provided by Dr. Jan Faix (Hannover Med Sch, Hannover Germany) Schirenbeck et al., 2005 | GFP-dDia2 | pDGFP-MCS, G418, Integrating |
| Transformed construct (Dictyostelium) | diaCA | Titus Lab, this paper | mRFP-mars-diaCA | pDM449, Hyg, Extrachromosomal |
| Transformed construct (Dictyostelium) | GFP-V1 | Titus Lab, this paper | Tetracycline -Inducible GFP-V1 | pDM334, G418, Extrachromosomal |
| Transformed construct (Dictyostelium) | RFP-Lifeact | Brzeska et al., 2014 | pDM358, Hyg, Extrachromosomal | |
| Transformed construct (Dictyostelium) | RFP-LimEΔcoil | Gerisch et al., 2004 | ||
| Transformed construct (Dictyostelium) | GFP-tubulin | Provided by Dr. Günther Gerisch (MPI Martinsried) Neujahr et al., 1998 | pDEXRH, G418, Integrating |
Additional files
Download links
A two-part list of links to download the article, or parts of the article, in various formats.
Downloads (link to download the article as PDF)
Open citations (links to open the citations from this article in various online reference manager services)
Cite this article (links to download the citations from this article in formats compatible with various reference manager tools)
VASP-mediated actin dynamics activate and recruit a filopodia myosin
eLife 10:e68082.
https://doi.org/10.7554/eLife.68082


