Non-nucleoside reverse transcriptase inhibitor-based combination antiretroviral therapy is associated with lower cell-associated HIV RNA and DNA levels compared to protease inhibitor-based therapy
- Amsterdam UMC, University of Amsterdam, Laboratory of Experimental Virology, Department of Medical Microbiology and Infection Prevention, Netherlands
- Amsterdam UMC, University of Amsterdam, Laboratory of Viral Immune Pathogenesis, Department of Experimental Immunology, Netherlands
- Amsterdam Institute for Global Health and Development, Netherlands
- Amsterdam UMC, University of Amsterdam, Department of Global Health, Amsterdam Institute for Infection and Immunity, Netherlands
- HIV Monitoring Foundation, Netherlands
- Amsterdam UMC, University of Amsterdam, Department of Internal Medicine, Netherlands
- Health Psychology Group, Institute of Applied Health Sciences, University of Aberdeen, United Kingdom
- Radboud University Medical Center, Radboud Institute for Health Sciences, Netherlands
- Institute for Global Health, University College London, United Kingdom
- Department of Medicine, Imperial College London, United Kingdom
Figures
Figure 1 with 2 supplements
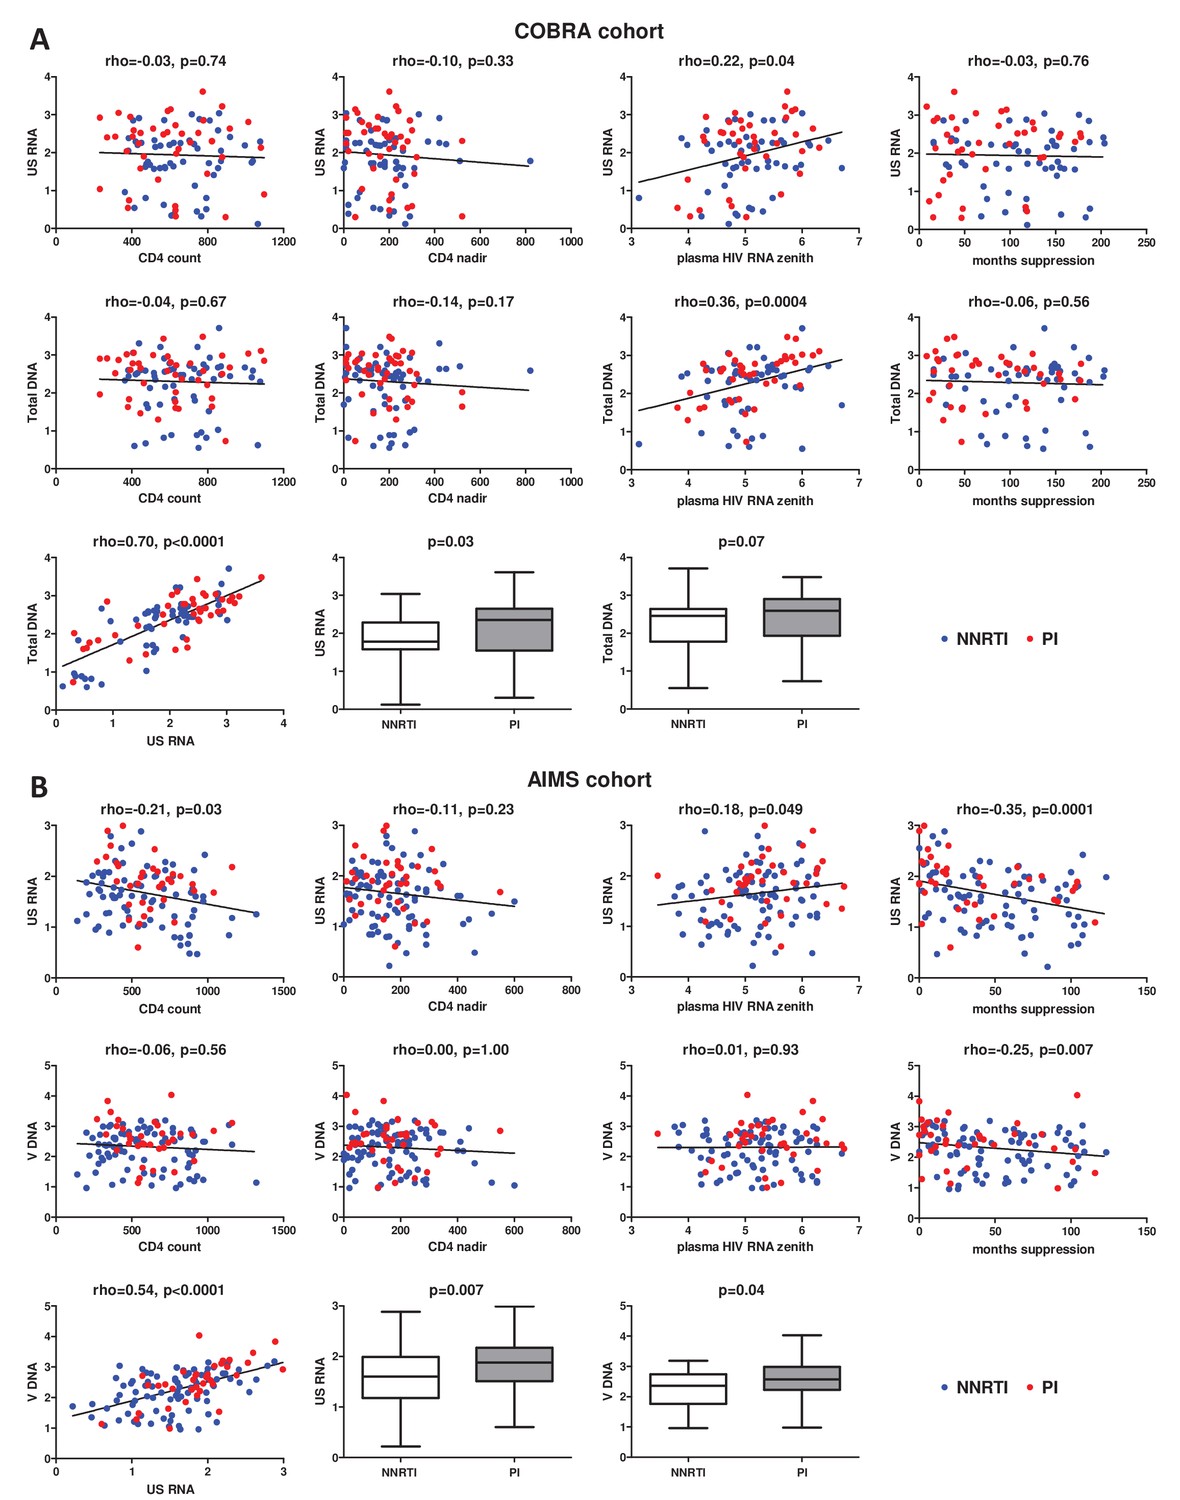
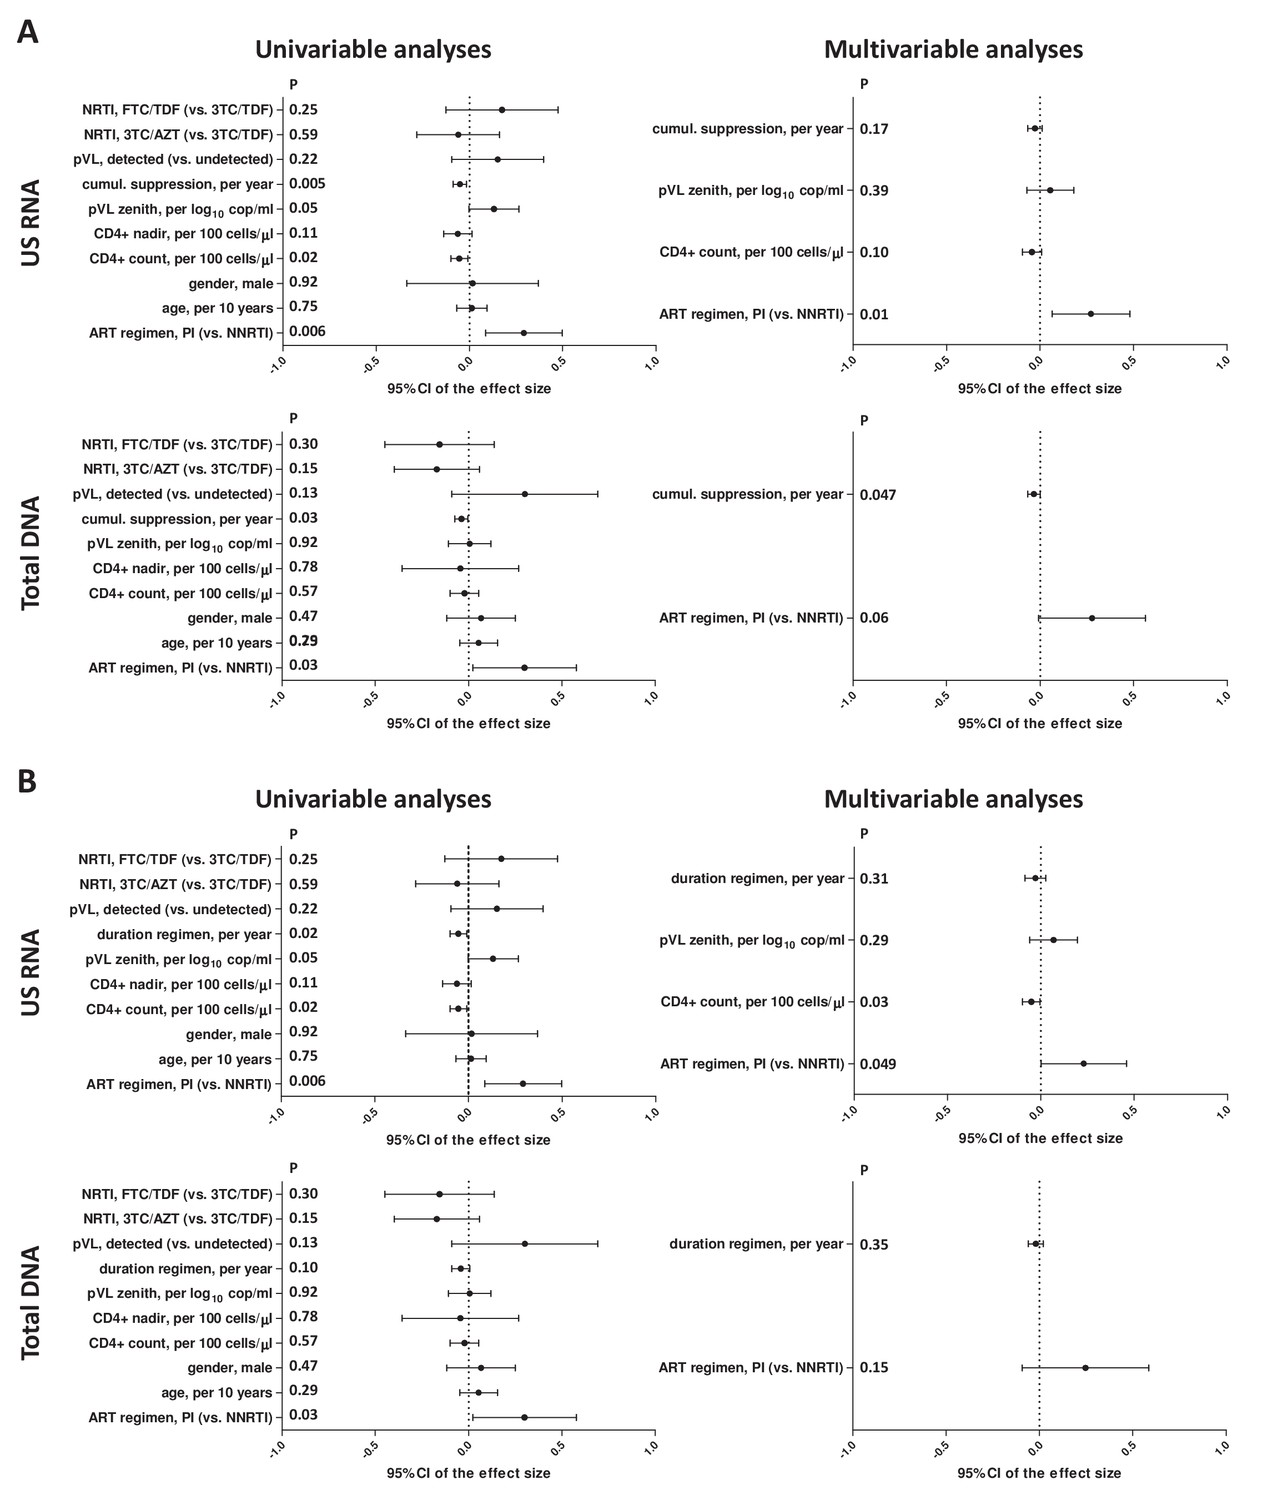
Associations of clinical and virological variables, time of virological suppression, and ART regimens (NNRTI-based vs PI-based) with the levels of cell-associated human immunodeficiency virus (HIV) unspliced RNA (US RNA) and total HIV DNA in (A) COBRA cohort (n = 100) and (B) AIMS cohort (n = 124).
Units of measurement are US RNA: log10 copies/μg total RNA, total DNA: log10 copies/106 peripheral blood mononuclear cells (PBMC), CD4 count and CD4 nadir: cells/mm3, plasma HIV RNA zenith: log10 copies/ml. Levels of significance were calculated by Spearman correlation analyses or Mann-Whitney tests, as appropriate. In all correlation graphs, non-nucleoside reverse transcriptase inhibitor (NNRTI)- and protease inhibitor (PI)-treated participants are color-coded (NNRTI - blue, PI - red).
Figure 1—figure supplement 1
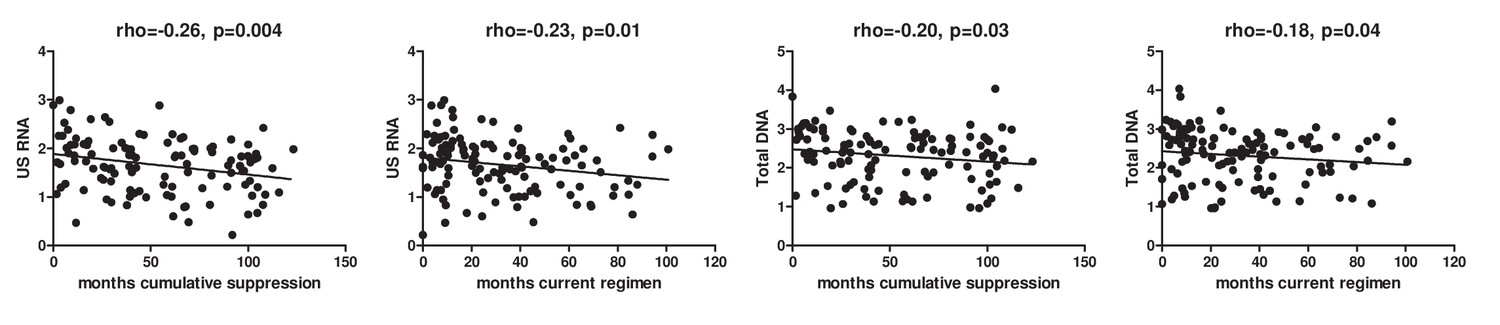
Effects of duration of cumulative virological suppression and duration of the current regimen on the levels of cell-associated HIV US RNA and total HIV DNA in the AIMS cohort (n = 124).
Units of measurement are US RNA: log10 copies/μg total RNA, total DNA: log10 copies/106 PBMC. Levels of significance were calculated by Spearman correlation analyses.
Figure 1—figure supplement 2
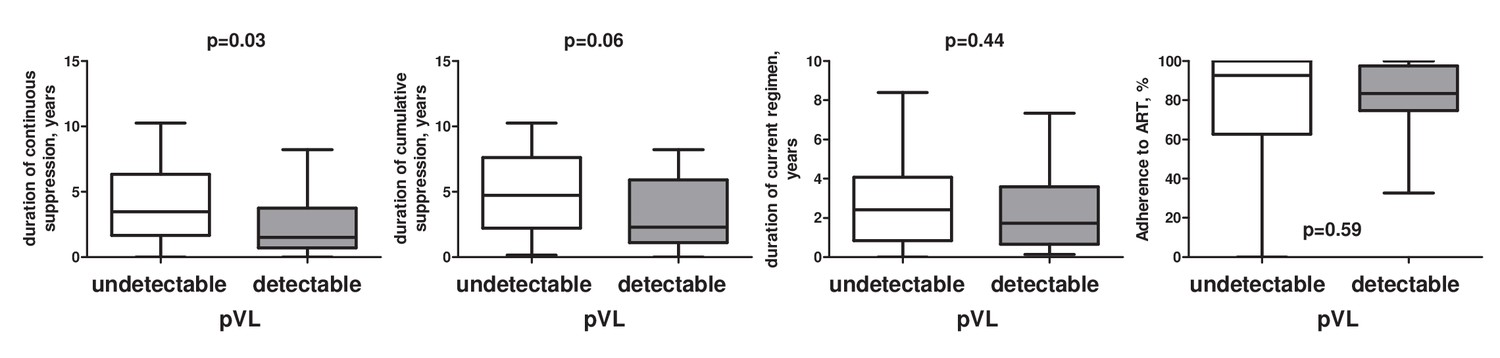
Differences in duration of continuous and cumulative virological suppression, duration of current regimen, and in adherence to ART between participants with undetectable vs low-level detectable pVL in the AIMS cohort.
Levels of significance were calculated by Mann-Whitney tests.
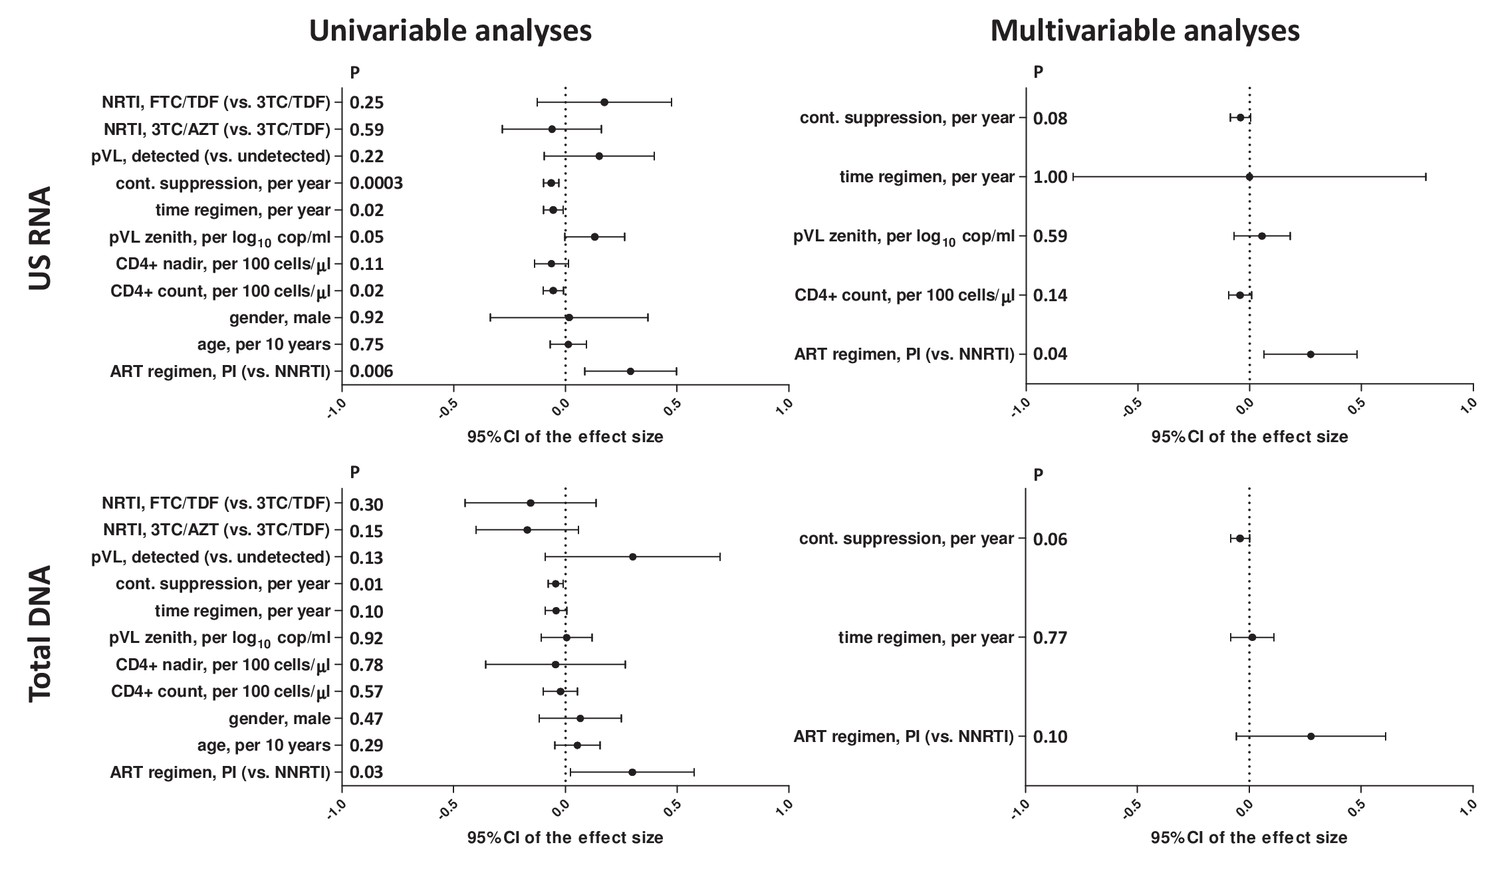
Figure 2 with 2 supplements
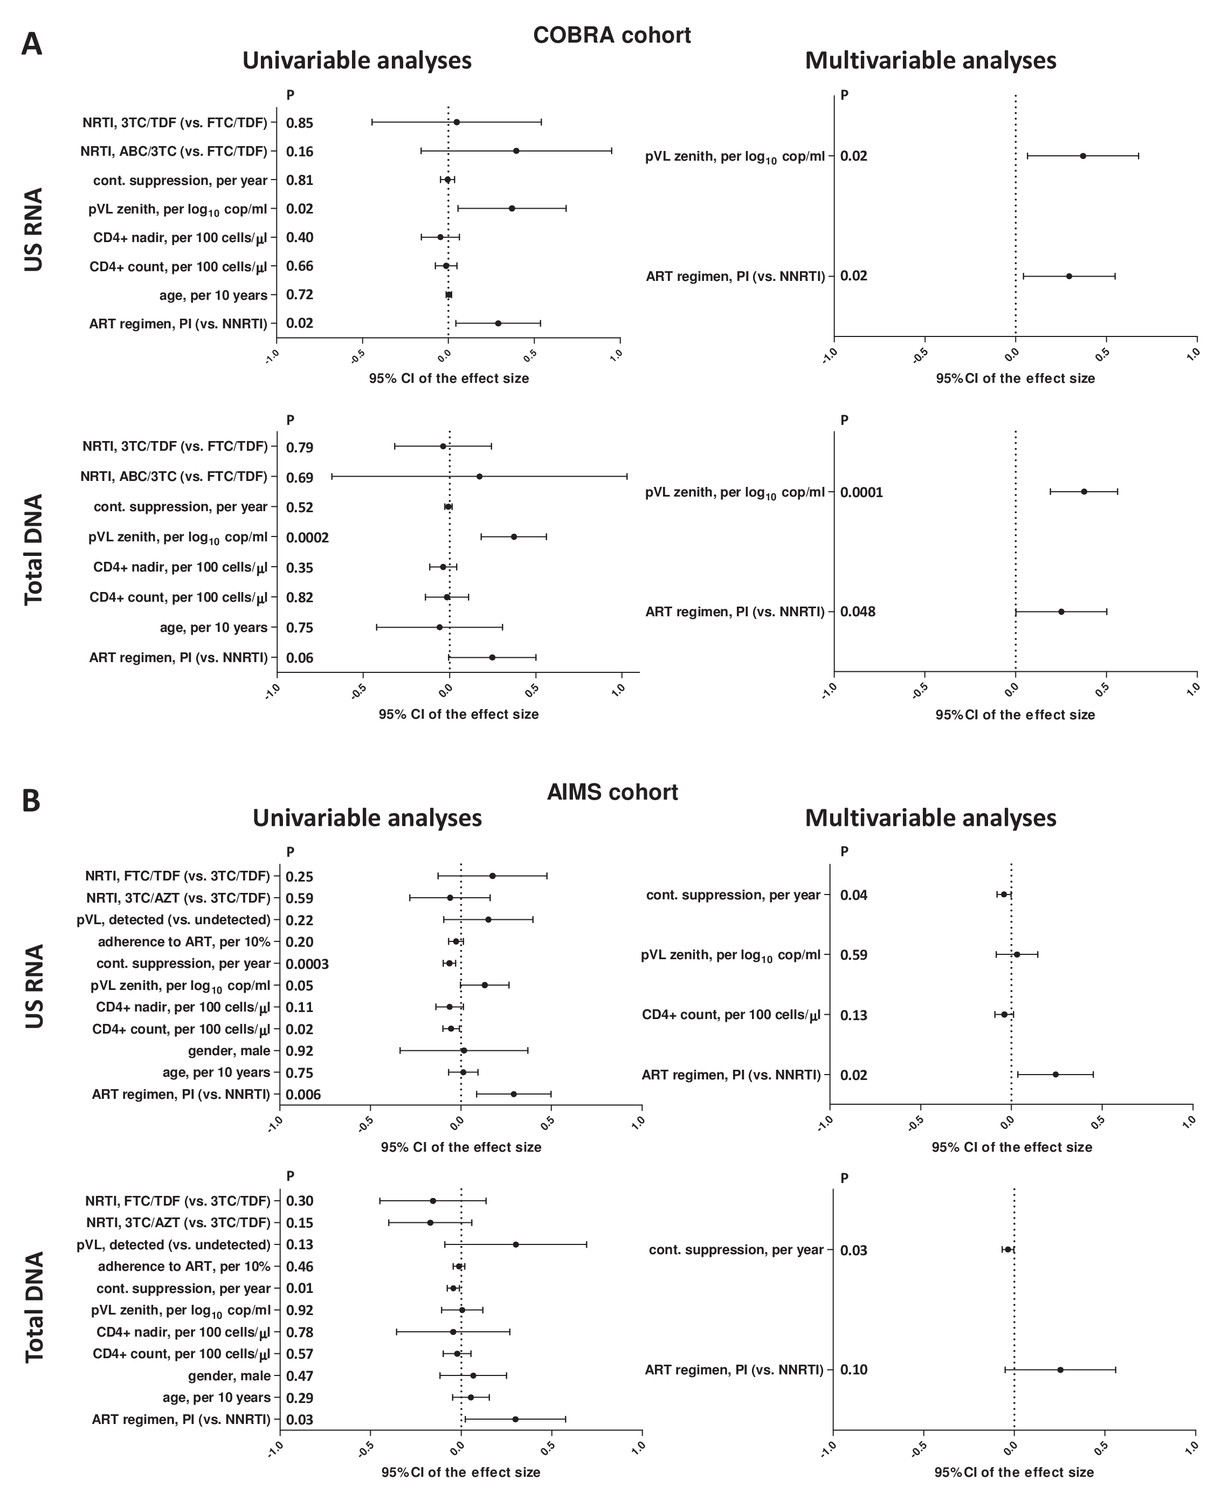
Regression analyses to identify variables associated with cell-associated human immunodeficiency virus (HIV) unspliced (US) RNA and total HIV DNA levels in (A) COBRA and (B) AIMS cohorts.
Effect sizes and 95% confidence intervals for US RNA are plotted as log10 copies per microgram of total cellular RNA and for total DNA as log10 copies per million peripheral blood mononuclear cells (PBMC). Effect sizes were obtained by fitting generalized linear models. Variables associated with HIV RNA or DNA with p-values <0.1 in the univariable analyses were included in the multivariable analyses.
Figure 2—figure supplement 1
Regression analyses to identify variables associated with cell-associated HIV US RNA and total HIV DNA levels in the AIMS cohort, taking into account either (A) duration of cumulative virological suppression on ART or (B) duration of current ART regimen, prior to the measurements.
Effect sizes and 95% confidence intervals for US RNA are plotted as log10 copies per microgram of total cellular RNA and for total DNA as log10 copies per million PBMC. Effect sizes were obtained by fitting generalized linear models. Variables associated with HIV RNA or DNA with p-values <0.1 in the univariable analyses were included in the multivariable analyses.
Figure 2—figure supplement 2
Regression analyses to identify variables associated with cell-associated HIV US RNA and total HIV DNA levels in the AIMS cohort, taking into account both duration of continuous virological suppression on ART and duration of current ART regimen, prior to the measurements.
Effect sizes and 95% confidence intervals for US RNA are plotted as log10 copies per microgram of total cellular RNA and for total DNA as log10 copies per million PBMC. Effect sizes were obtained by fitting generalized linear models. Variables associated with HIV RNA or DNA with p-values <0.1 in the univariable analyses were included in the multivariable analyses.
Figure 3 with 3 supplements

Sensitivity analysis and associations of individual antiretroviral drugs with cell-associated human immunodeficiency virus (HIV) RNA and DNA in the pooled cohort.
Associations of antiretroviral therapy (ART) regimens (non-nucleoside reverse transcriptase inhibitor (NNRTI)-based vs protease inhibitor (PI)-based) with the levels of cell-associated HIV unspliced RNA (US RNA) and total HIV DNA in either (A) the total pooled cohort (n = 213) or (B) limiting the analysis to participants with undetectable plasma viral loads (pVLs) and >6 months of virological suppression on ART (n = 178). (C) Differences in the levels of US RNA and total HIV DNA between participants treated with ART regimens based on efavirenz (EFV), nevirapine (NVP), or PIs in the total pooled cohort. (D) Differences in the levels of US RNA and total HIV DNA between participants treated with ART regimens based on different ritonavir-boosted PIs: atazanavir (ATZ/r), darunavir (DRV/r), or lopinavir (LPV/r) in the total pooled cohort. Units of measurement are US RNA: log10 copies/μg total RNA, total DNA: log10 copies/106 peripheral blood mononuclear cells (PBMC). Levels of significance were calculated by Mann-Whitney tests or Kruskal-Wallis tests with Dunn’s post-tests, as appropriate. For three-group comparisons, Kruskal-Wallis p-values are shown on top of the graphs and Dunn’s significance levels of pairwise comparisons are shown by asterisks only where significant; **0.001 < p < 0.01; *0.01 < p < 0.05. Participant numbers per regimen are indicated below the graphs.
Figure 3—figure supplement 1
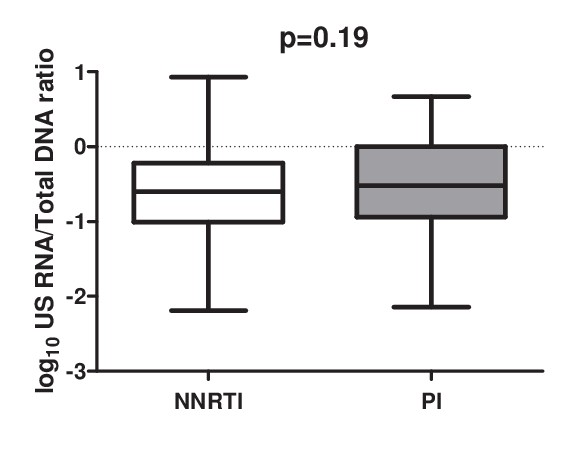
Association of ART regimen (NNRTI-based vs PI-based) with the cell-associated HIV US RNA/total HIV DNA ratio in the total pooled cohort (n = 213).
Level of significance was calculated by Mann-Whitney test.
Figure 3—figure supplement 2
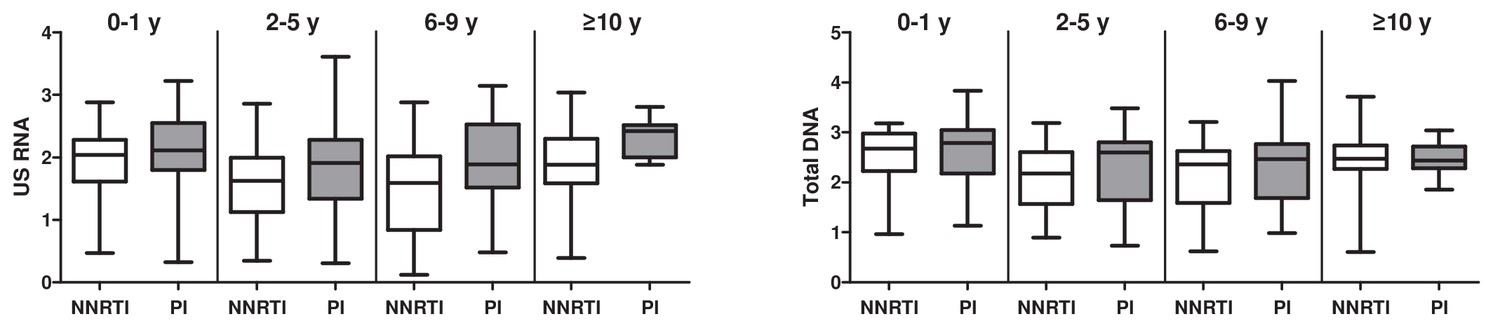
Associations of ART regimen (NNRTI-based vs PI-based) with the levels of cell-associated HIV US RNA and total HIV DNA in the total pooled cohort.
Participants were grouped according to the time of continuous virological suppression: 0–1 years, 2–5 years, 6–9 years, and 10 years or more. Units of measurement are US RNA: log10 copies/μg total RNA, total DNA: log10 copies/106 PBMC.
Figure 3—figure supplement 3

Levels of US RNA and total HIV DNA in participants treated with ART regimens based on efavirenz (EFV), nevirapine (NVP), ritonavir-boosted atazanavir (ATZ/r), ritonavir-boosted darunavir (DRV/r), or ritonavir-boosted lopinavir (LPV/r) in the total pooled cohort.
Units of measurement are US RNA: log10 copies/μg total RNA, total DNA: log10 copies/106 PBMC. Levels of significance were calculated by Kruskal-Wallis tests. Participant numbers per regimen are indicated below the graphs.
Tables
Key resources table
| Reagent type (species) or resource | Designation | Source or reference | Identifiers | Additional information |
|---|---|---|---|---|
| Biological sample (Homo sapiens) | PBMC samples from HIV-infected individuals | |||
| Commercial assay or kit | DNA-free DNA Removal Kit | ThermoFisher Scientific | Cat# AM1906 | |
| Commercial assay or kit | Platinum Quantitative PCR SuperMix-UDG | ThermoFisher Scientific | Cat# 11730–025 | |
| Commercial assay or kit | TaqMan β-Actin Detection Reagents | ThermoFisher Scientific | Cat# 401846 | |
| Commercial assay or kit | TaqMan Ribosomal RNA Control Reagents | ThermoFisher Scientific | Cat# 4308329 | |
| Chemical compound, drug | SuperScript III reverse transcriptase | ThermoFisher Scientific | Cat# 18080–085 | |
| Chemical compound, drug | Random primers | ThermoFisher Scientific | Cat# 48190–011 | |
| Chemical compound, drug | RNaseOUT Recombinant Ribonuclease Inhibitor | ThermoFisher Scientific | Cat# 10777–019 | |
| Software, algorithm | Prism 8.3.0 | GraphPad Software | https://www.graphpad.com/; RRID:SCR_002798 | |
| Software, algorithm | IBM SPSS Statistics (version 25) | IBM Corporation | https://www.ibm.com/; RRID:SCR_019096 |
Table 1
Characteristics of participants treated with NNRTI- and PI-based ART regimens.
| Variable | COBRA cohort (n = 100) | AIMS cohort (n = 124) | |||||
|---|---|---|---|---|---|---|---|
| NNRTI (n = 58) | PI (n = 42) | p[i] | NNRTI (n = 88) | PI (n = 36) | p | ||
| Age (years) | 55 (51–61)[ii] | 56 (50–62) | 0.97 | 47 (41–54) | 44 (39–53) | 0.23 | |
| Male gender | 56 (96.6) | 39 (92.9) | 0.65 | 78 (88.6) | 31 (86.1) | 0.76 | |
| Current CD4+ count (cells/mm3) | 640 (511–796) | 617 (408–782) | 0.21 | 550 (368–798) | 575 (470–745) | 0.46 | |
| CD4+ count nadir (cells/mm3) | 180 (115–253) | 200 (88–253) | 0.91 | 160 (83–240) | 165 (85–220) | 0.78 | |
| Plasma HIV RNA zenith (log10 copies/ml) | 5.08 (4.71–5.52) | 5.00 (4.72–5.70) | 0.84 | 5.21 (4.68–5.62) | 5.35 (4.96–5.97) | 0.09 | |
| Duration of cumulative virological suppression (months) | 137.0 (93.3–171.3) | 90.4 (46.5–133.1) | 0.004 | 55.6 (28.5–90.2) | 40.2 (11.0–87.5) | 0.20 | |
| Duration of continuous virological suppression (months) | 118.3 (73.6–151.6) | 62.2 (33.5–118.4) | 0.001 | 45.4 (25.4–74.3) | 19.9 (6.2–64.3) | 0.01 | |
| Duration of the current NNRTI or PI regimen (months) | 98.6 (48.4–136.6) | 48.0 (26.3–68.2) | <0.0001 | 39.1 (12.4–59.9) | 12.5 (7.2–23.6) | <0.0001 | |
| Current plasma HIV RNA <50 copies/ml[iii] | 56 (96.6) | 42 (100.0) | 0.51 | 80 (90.9) | 27 (75.0) | 0.04 | |
| Adherence to ART (%)[iv] | - | - | - | 89.2 (63.6–100) | 91.3 (65.5–100) | 0.55 | |
| NRTI backbone | FTC + TDF[v] | 47 (81.0) | 31 (73.8) | 0.43 | 8 (9.1) | 4 (11.1) | 0.26 |
| ABC + 3TC | 4 (6.9) | 6 (14.3) | 4 (4.5) | - | |||
| 3TC + TDF | 5 (8.6) | 2 (4.8) | 42 (47.7) | 21 (58.3) | |||
| 3TC + AZT | 2 (3.4) | 1 (2.4) | 26 (29.5) | 6 (16.7) | |||
| Other[vi] | - | 2 (4.8) | 8 (9.1) | 5 (13.9) | |||
| NNRTI | EFV[vii] | 28 (48.3) | - | 46 (52.3) | - | ||
| NVP | 26 (44.8) | - | 41 (46.6) | - | |||
| Other[viii] | 4 (6.9) | - | 1 (1.1) | - | |||
| PI | ATZ/r[ix] | - | 19 (45.2) | - | 22 (61.1) | ||
| DRV/r | - | 16 (38.1) | - | - | |||
| LPV/r | - | 3 (7.1) | - | 9 (25.0) | |||
| Other[x] | - | 4 (9.5) | - | 5 (13.9) | |||
-
[i]Mann-Whitney tests were used for continuous variables and Fisher’s exact tests or Chi-square tests were used for categorical variables.
[ii]Data are medians (interquartile ranges) for continuous variables and numbers (percentages) for discrete variables.
-
[iii]Where detectable, plasma HIV RNA was <400 copies/ml for all patients.
[iv]Adherence was measured electronically.
-
[v]NRTIs: FTC, emtricitabine; TDF, tenofovir disoproxil fumarate; ABC, abacavir; 3TC, lamivudine; AZT, zidovudine; D4T, stavudine; DDI, didanosine.
[vi]COBRA: ABC+TDF – 1 (PI), ABC+AZT – 1 (PI). AIMS: 3TC+D4T – 3 (NNRTI), 3TC+DDI – 3 (NNRTI) + 2 (PI), D4T+DDI – 1 (NNRTI), DDI+TDF – 1 (NNRTI) + 1 (PI), 3TC+FTC – 1 (PI), AZT+DDI – 1 (PI).
-
[vii]NNRTIs: EFV, efavirenz; ETR, etravirine; NVP, nevirapine; RIL, rilpivirine.
[viii]COBRA: ETR – 2, RIL – 2. AIMS: unknown – 1.
-
[ix]PIs: ATZ, atazanavir; DRV, darunavir; FOS, fosamprenavir; LPV, lopinavir; SAQ, saquinavir; IDV, indinavir; /r, ritonavir-boosted PI.
[x]COBRA: FOS/r – 3, SAQ/r – 1. AIMS: ATZ – 3, IDV/r – 1, IDV – 1.
Additional files
-
Supplementary file 1
Variables associated with cell-associated human immunodeficiency virus (HIV) unspliced (US) RNA and total HIV DNA levels in both cohorts.
(a) Variables associated with cell-associated HIV US RNA and total HIV DNA levels in the COmorBidity in Relation to AIDS (COBRA) cohort. (b) Variables associated with cell-associated HIV US RNA and total HIV DNA levels in the Adherence Improving Self-Management Strategy (AIMS) cohort.
- https://cdn.elifesciences.org/articles/68174/elife-68174-supp1-v2.docx
-
Transparent reporting form
- https://cdn.elifesciences.org/articles/68174/elife-68174-transrepform-v2.docx
Download links
A two-part list of links to download the article, or parts of the article, in various formats.
Downloads (link to download the article as PDF)
Open citations (links to open the citations from this article in various online reference manager services)
Cite this article (links to download the citations from this article in formats compatible with various reference manager tools)
Non-nucleoside reverse transcriptase inhibitor-based combination antiretroviral therapy is associated with lower cell-associated HIV RNA and DNA levels compared to protease inhibitor-based therapy
eLife 10:e68174.
https://doi.org/10.7554/eLife.68174


