The hepcidin regulator erythroferrone is a new member of the erythropoiesis-iron-bone circuitry
- Division of Hematology Oncology, Tisch Cancer Institute, Icahn School of Medicine at Mount Sinai, United States
- The Mount Sinai Bone Program, Departments of Medicine and Pharmacological Sciences, and Center for Translational Medicine and Pharmacology, Icahn School of Medicine at Mount Sinai, United States
- Center for Iron Disorders, University of California, Los Angeles (UCLA), United States
- Department of Pediatrics, Division of Hematology, and Penn Center for Musculoskeletal Disorders, Children’s Hospital of Philadelphia (CHOP), University of Pennsylvania, Perelman School of Medicine, United States
- Intrinsic Lifesciences, LLC, United States
- Department of Pediatrics, Saint Louis University School of Medicine, United States
Figures
Figure 1 with 1 supplement
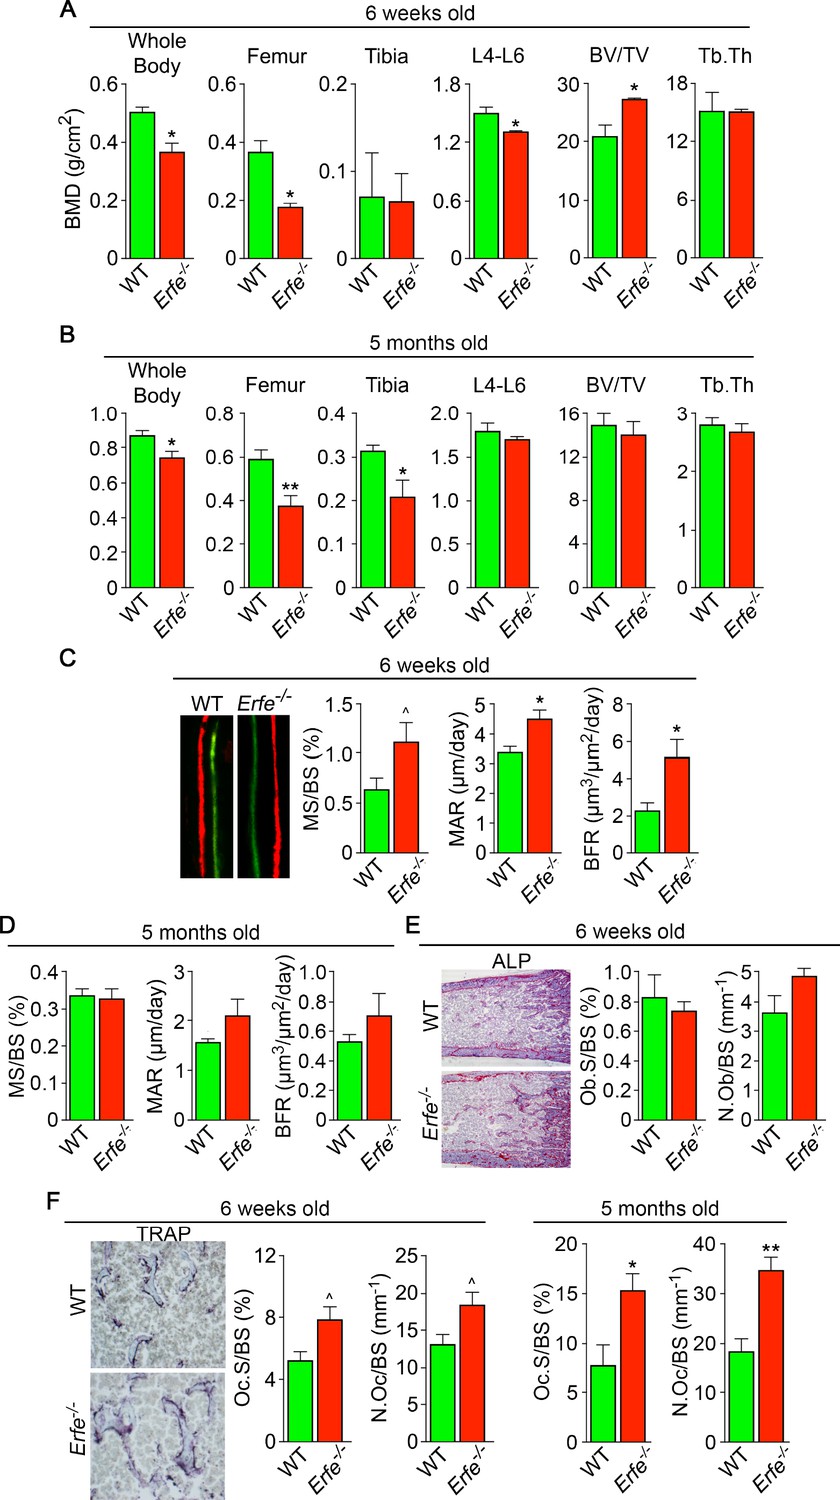
ERFE loss results in high turnover osteoporosis.
Bone mineral density (BMD) measured in whole body, femur, tibia, and lumbar spine (L4–L6) along with bone volume (BV/TV) and trabecular thickness (Tb.Th) in growing (6-week-old) (A) and mature (5-month-old) (B) Erfe-/- and wild-type (WT) littermates. Dynamic histomorphometry following two i.p. injections of calcein (green) and xylenol orange (red) given at days 8 and 2, respectively. Representative dual labels from the epiphysis are shown, together with measured and derived parameters, namely mineralizing surface (MS) as a function of bone surface (BS), mineral apposition rate (MAR) and bone formation rate (BFR) in 6-week-old (C) and 5-month-old (D) mice. (E) Alkaline phosphatase staining (magenta) in sections of femura demonstrates no differences in osteoblast surface (Ob.S) and number (N.Ob) as a function of BS in 6-week-old Erfe-/- and WT mice. (F) TRAP staining at the epiphysis showing both osteoclast surface (Oc.S) and number (N.Oc) as a function of BS. Statistics: Mean ± SEM; unpaired two-tailed Student’s t-test; *p<0.05, **p<0.01, ^0.05 < p < 0.1, N = 3–6 mice per group.
Figure 1—figure supplement 1
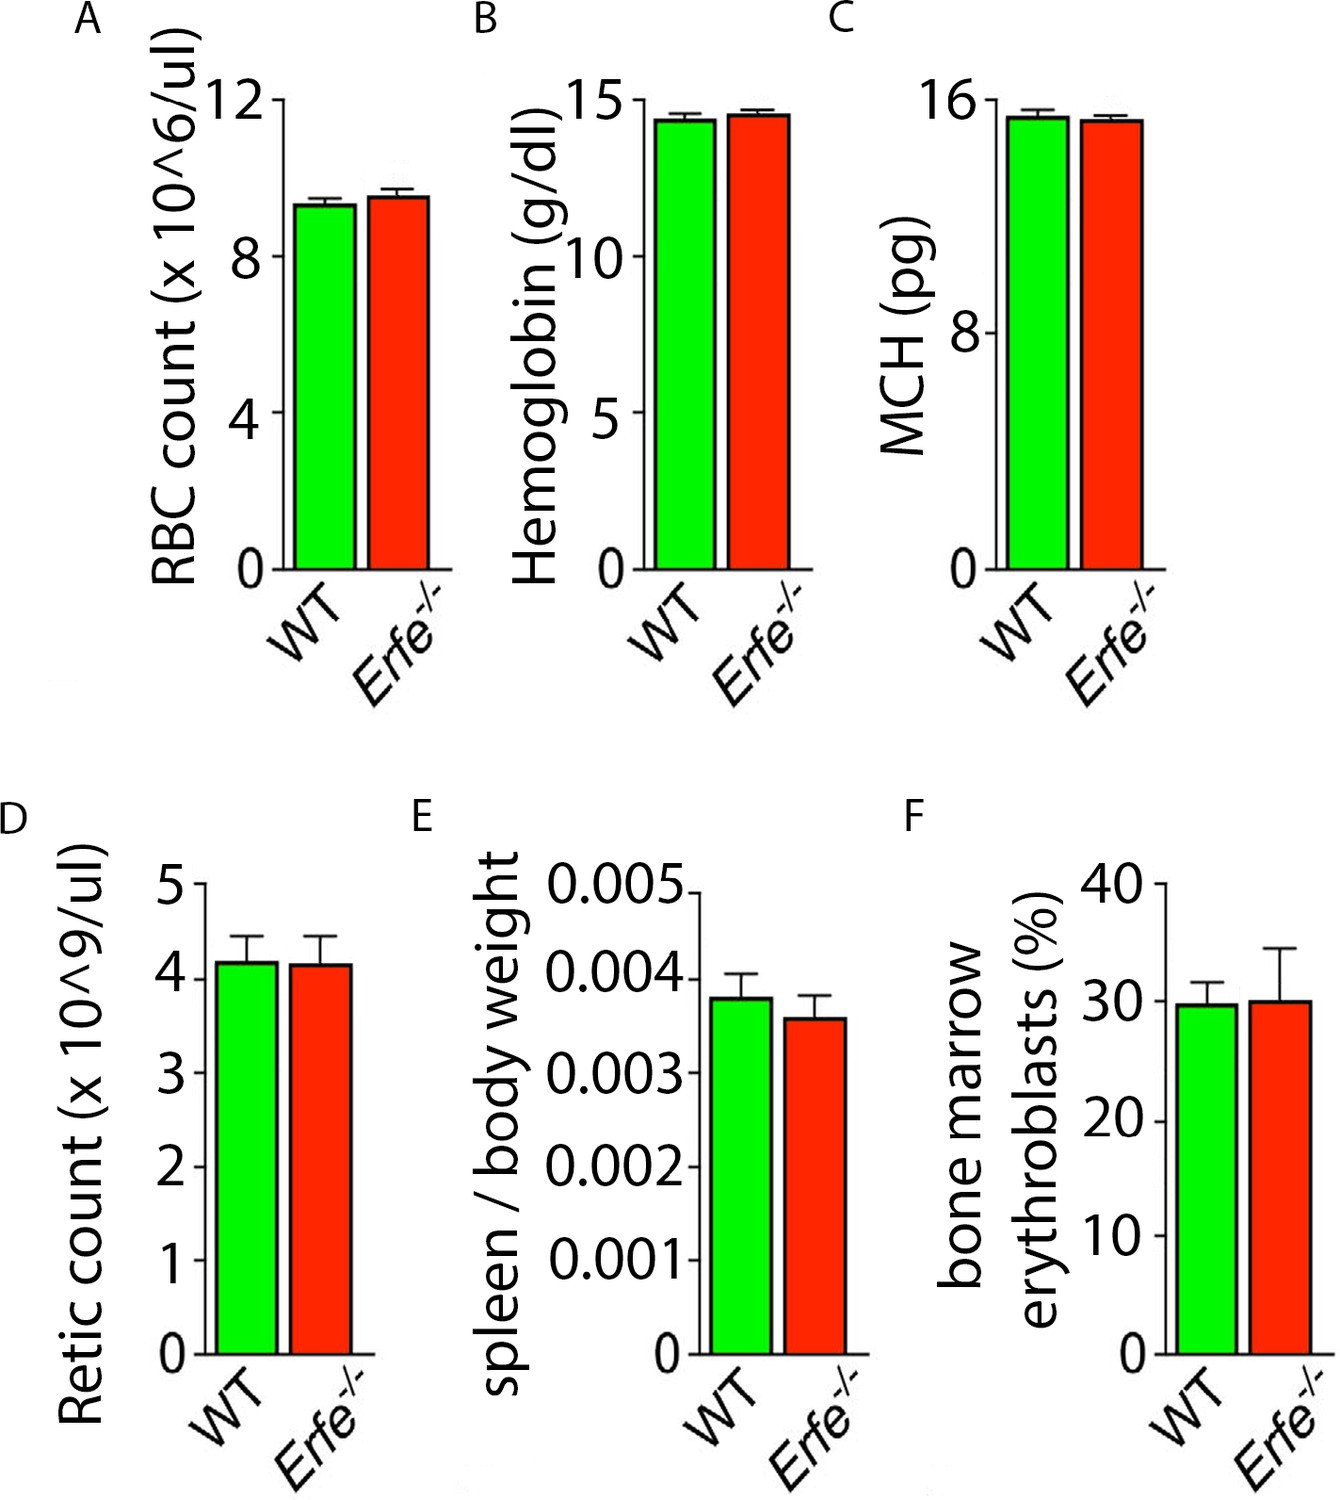
Erythropoiesis-related parameters in Erfe-/- mice.
We confirm previously reported lack of difference relative to wild-type (WT) mice in red blood cell (RBC) count (A), hemoglobin (B), mean corpuscular hemoglobin (MCH) (C), reticulocyte count (D), spleen weight (E), and bone marrow erythroblast fraction (F). Statistics: Mean ± SEM; unpaired two-tailed Student's t-test; N = 4–5 mice per group.
Figure 2 with 1 supplement
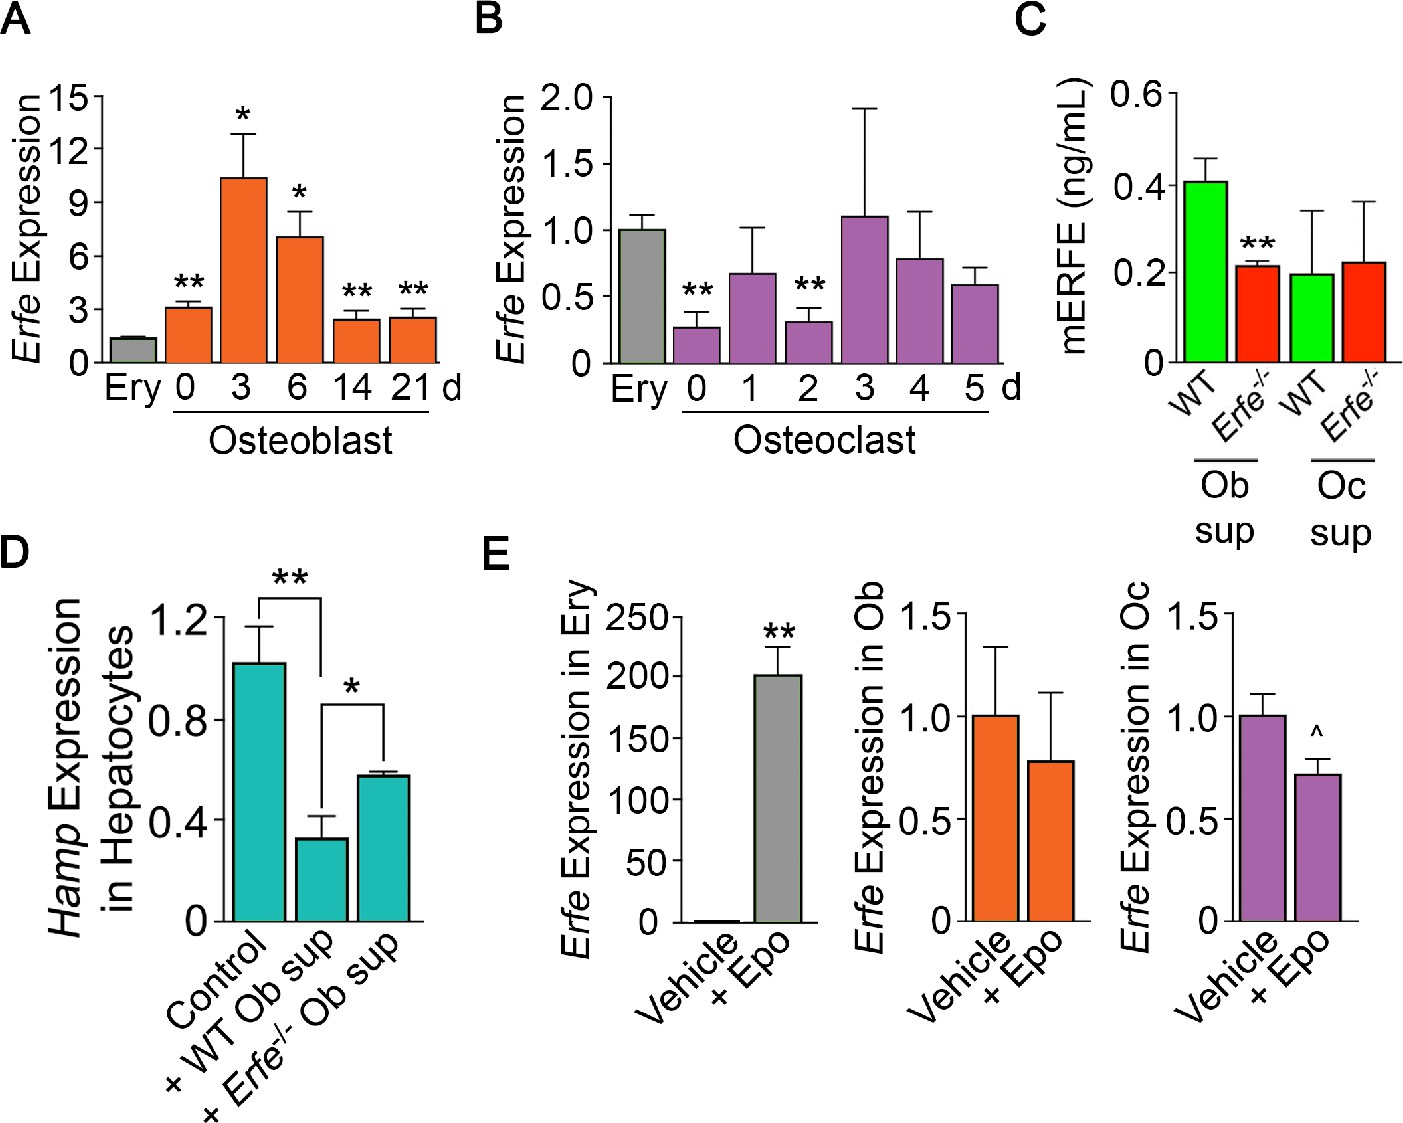
ERFE is expressed at higher levels in osteoblasts than in erythroblasts.
(A) Quantitative PCR showing high levels of Erfe expression in osteoblasts from wild type mice cultured under differentiating conditions. Notably, at 3 days of culture, there was a 10-fold greater expression in osteoblasts relative to bone-marrow-derived wild-type cultured erythroblasts. (B) Quantitative PCR showing comparable levels of Erfe expression in osteoclasts at 3–5 days of culture relative to bone-marrow-derived wild-type cultured erythroblasts from wild-type mice cultured under differentiating conditions. (C) Increased supernatant murine ERFE (mERFE) concentration in day 3 osteoblast cultures and no difference in day 5 osteoclast cultures from wild type relative to Erfe-/- mice (detection limit of 0.2 ng/ml mERFE). (D) Hepcidin (HAMP) expression is suppressed in primary wild-type hepatocytes in response to conditioned media from wild-type relative to Erfe-/- osteoblast cultures (day 6), confirming functionality of osteoblast-derived ERFE. Control hepatocytes were exposed to osteoblast culture media. (E) Unlike in erythroblasts, Erfe expression in cultured wild-type osteoblasts and osteoclasts does not respond to erythropoietin (Epo). Statistics: Mean ± SEM; unpaired two-tailed Student’s t-test; *p<0.05, **p<0.01, ^0.05 < P < 0.1, N = 3 wells per group.
Figure 2—figure supplement 1

Alkaline phosphatase expression increased during osteoblast differentiation in culture.
As expected, alkaline phosphatase is increased in ostoblast culture conditions at day 3 and day 6, providing evidence of osteoblasts at the expected time frame. Statistics: Mean ± SEM; unpaired two-tailed Student's t-test; *p<0.05, **p<0.01.
Figure 3 with 1 supplement
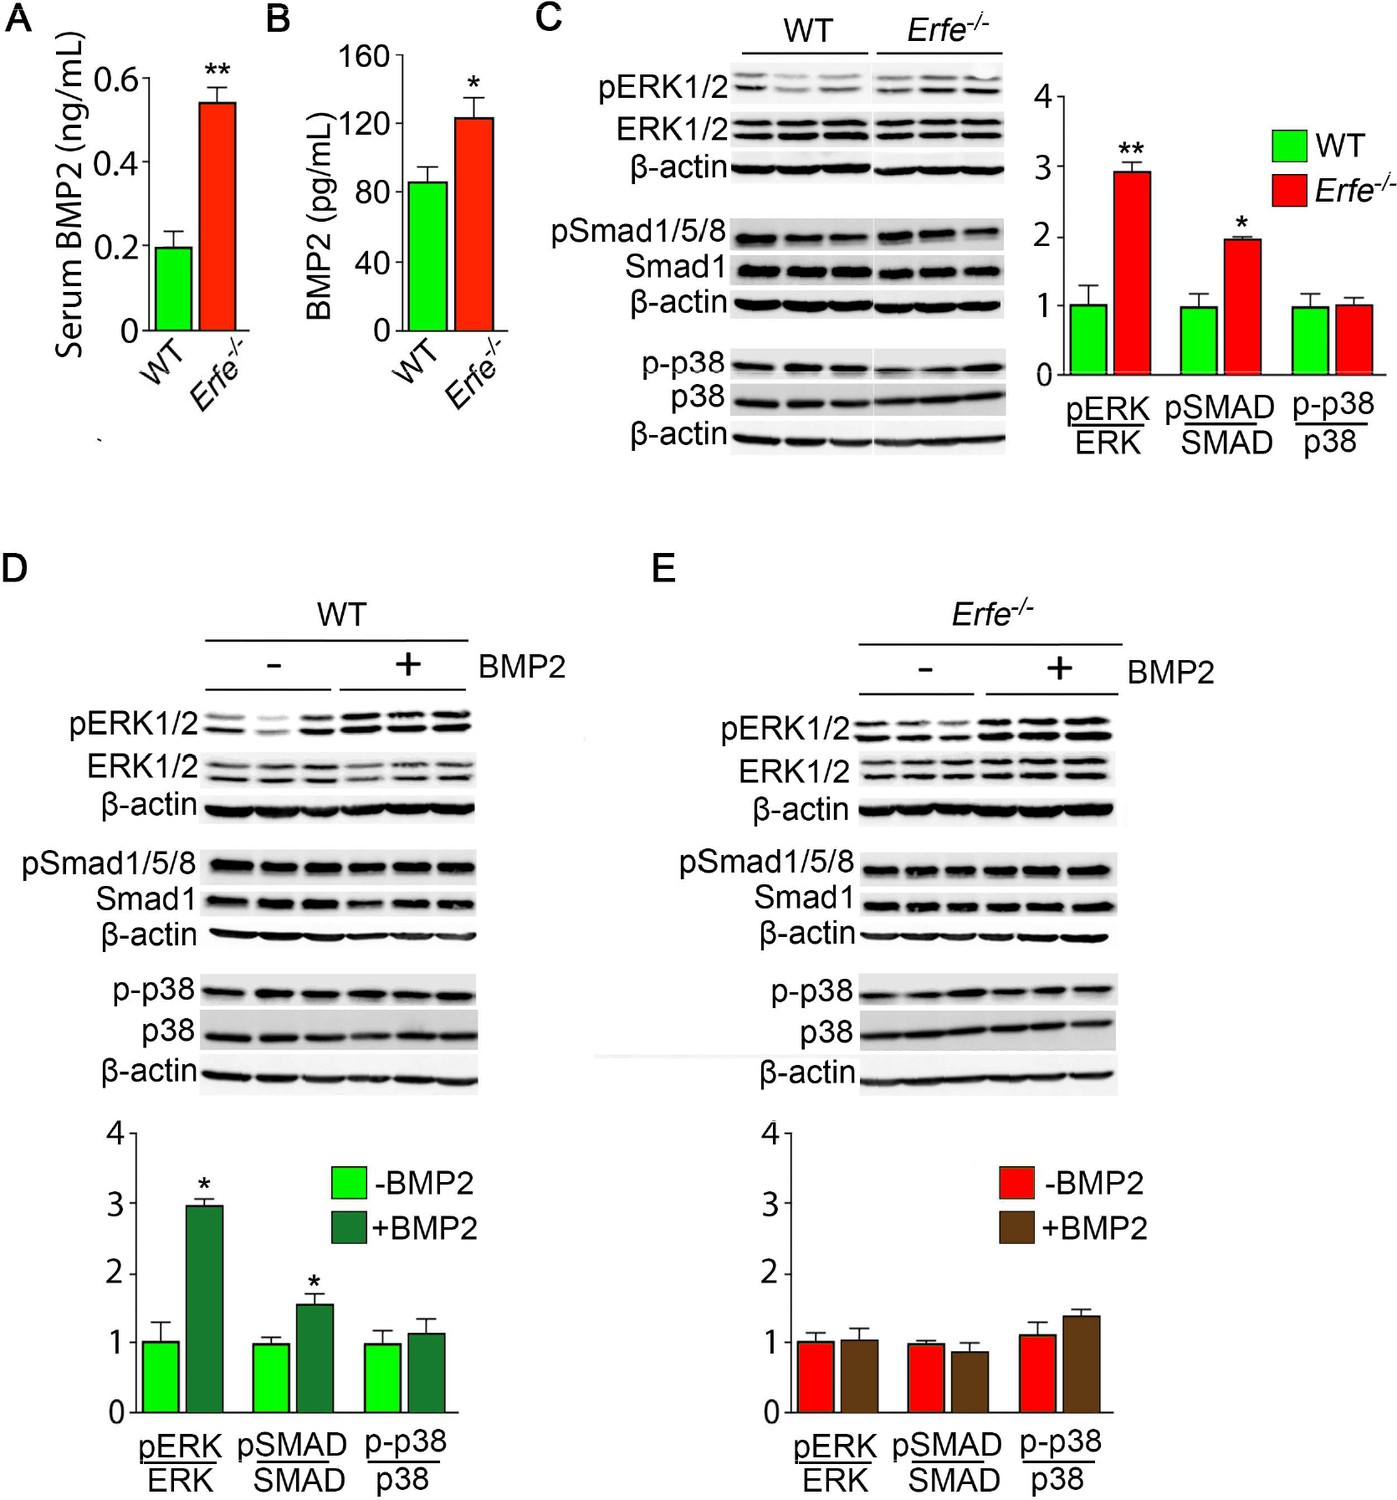
ERFE function on bone involves BMP-2 sequestration.
(A) BMP2 ELISA demonstrates elevated BMP2 concentration in serum samples from Erfe-/- relative to WT mice (N = 4 per group). In the 3-day cultures, there was an increase in BMP2 concentration in culture supernatants from Erfe-/- relative to WT osteoblasts (N = 6 per group) (B). (C) Similarly, signaling via the known BMP receptor pathways, namely ERK1/2 and Smad1/5/8, without changes in p38/MAPK, increase in Erfe-/- relative to WT osteoblasts; western blots with quantification shown. Finally, pSmad1/5/8 and pERK1/2 signaling is further induced by BMP2 (50 ng/ml) only in WT (D) but not in Erfe-/- (E) osteoblasts. Statistics: Mean ± SEM; unpaired two-tailed Student’s t-test; *p<0.05, **p<0.01.
Figure 3—figure supplement 1

ERFE function on bone involves BMP-6 sequestration.
Similarly to effects of BMP2, signaling via the known BMP receptor pathways, namely ERK1/2 and Smad1/5/8, was further induced by BMP6 (50 ng/ml) only in WT but not in Erfe-/- osteoblasts. Statistics: Mean ± SEM; unpaired two-tailed Student's t-test; ^0.05 < p < 0.1, **p<0.01.
Figure 4
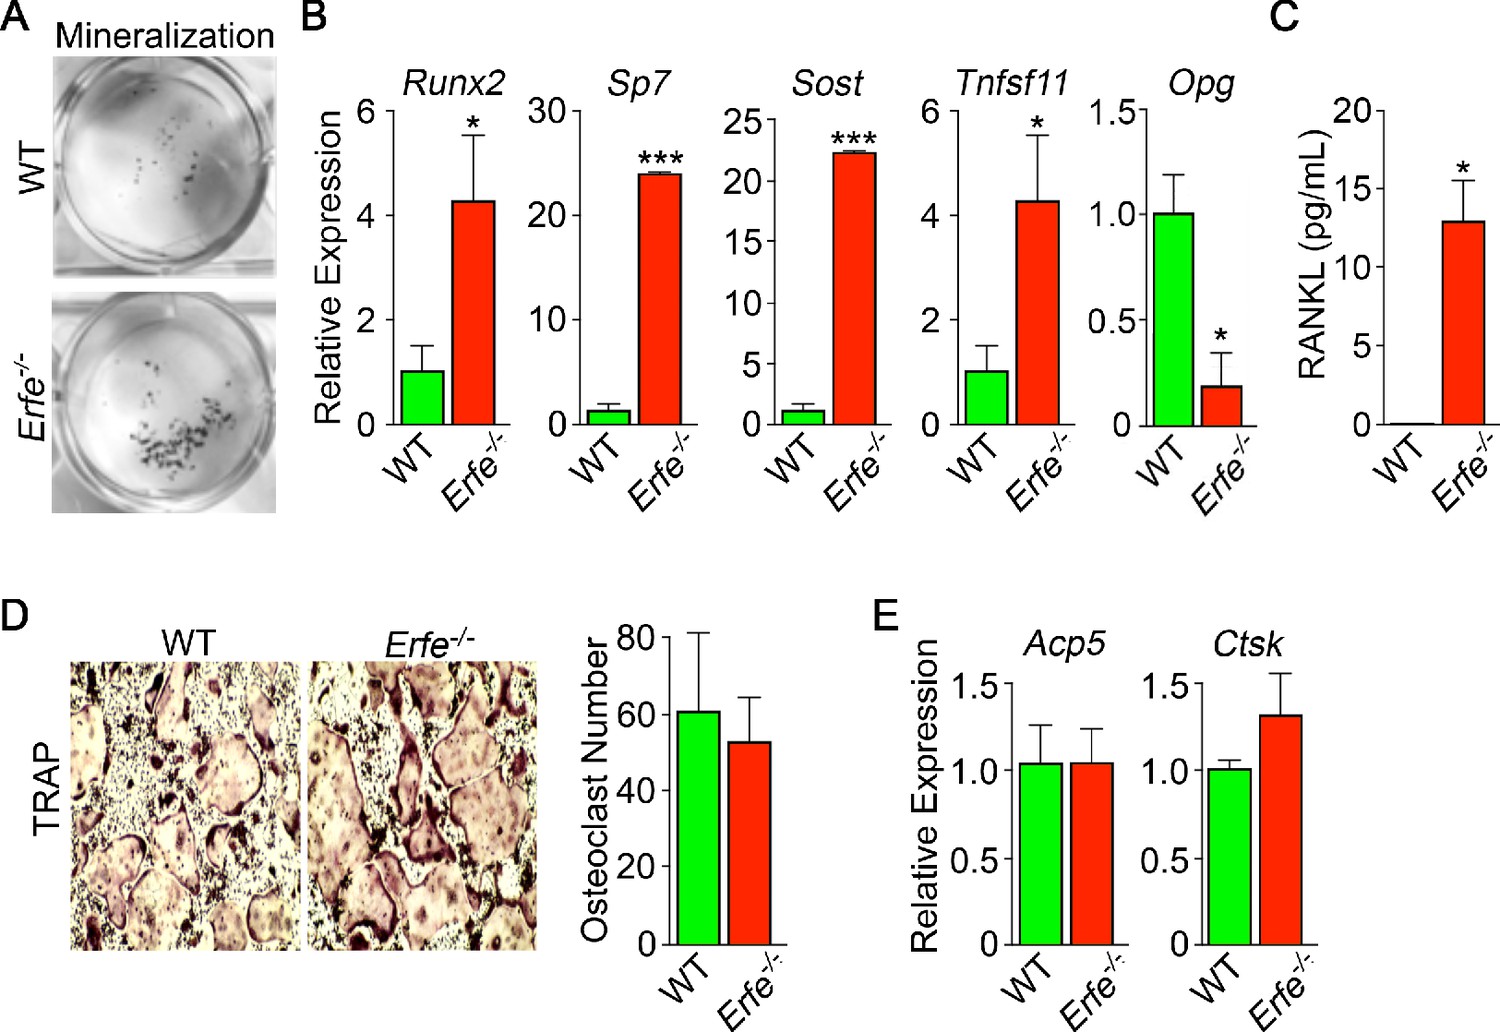
Mechanism of action of ERFE on bone involves interplay between osteoblastic RANKL and sclerostin.
Osteoblasts from 5-month-old wild type and Erfe-/- mouse bone marrow cultured under differentiating conditions for 5 or 21 days. Loss of ERFE resulted in accelerated mineralization, noted by an increase in Von Kossa-stained nodules (A). Consistent with the cellular phenotype is the upregulation in Erfe-/- osteoblasts of Runx2, Sp7, Sost, and Tnfsf11 expression and suppression of Opg expression (quantitative PCR on 21-day cultures) (B) as well as increased secreted RANKL (ELISA on 3 day cultures) (C). In vitro osteoclastogenesis assays show that ERFE loss does not alter osteoclast number, as measured by TRAP staining (D), or the expression of osteoclast genes, namely Acp5 or Ctsk (E). Statistics: Mean ± SEM; unpaired two-tailed Student’s t-test; *p<0.05, **p<0.01; wells per group – three for A-C.
Figure 5 with 1 supplement

ERFE loss in β-thalassemia mice causes profound bone loss.
(A) Bone mineral density (BMD) measured in whole body, femur, tibia, and lumbar spine (L4–L6) in 5-month-old β-thalassemia mice (Hbbth3/+ mice) and compound Hbbth3/+;Erfe-/- mutants. (B) Representative section of femoral epiphyses stained with Von Kossa, and quantitative estimates of bone volume (BV/TV) and trabecular thickness (Tb.Th). (C) Dynamic histomorphometry following two i.p. injections of calcein (green) and xylenol orange (red) given at days 8 and 2, respectively. Shown are measured and derived parameters, namely mineralizing surface (MS), mineral apposition rate (MAR) and bone formation rate (BFR). (D) Representative image of TRAP (ACP5) staining of femoral epiphysis, also showing both osteoclast surface (Oc.S) and number (N.Oc), expressed as a function of bone surface (BS). Statistics: Mean ± SEM; unpaired two-tailed Student’s t-test; *p<0.05, **p<0.01; N = 4–5 mice per group.
Figure 5—figure supplement 1

Erythropoiesis-related parameters in Hbbth3/+ and Hbbth3/+;Erfe-/-mutant mice.
We confirm previously reported differences in relative to wild-type (WT) mice with decreased red blood cell (RBC) count (A), hemoglobin (B), and mean corpuscular hemoglobin (MCH) (C) as well as increased reticulocyte count (D), spleen weight (E), and bone marrow erythroblast fraction (F) with only minor differences in RBC count and hemoglobin between Hbbth3/+ and compound Hbbth3/+;Erfe-/- mutant mice. Statistics: Mean ± SEM; unpaired two-tailed Student's ttest; *p<0.05, **p<0.01, ***p<0.0001; N = 4–5 mice per group.
Figure 6
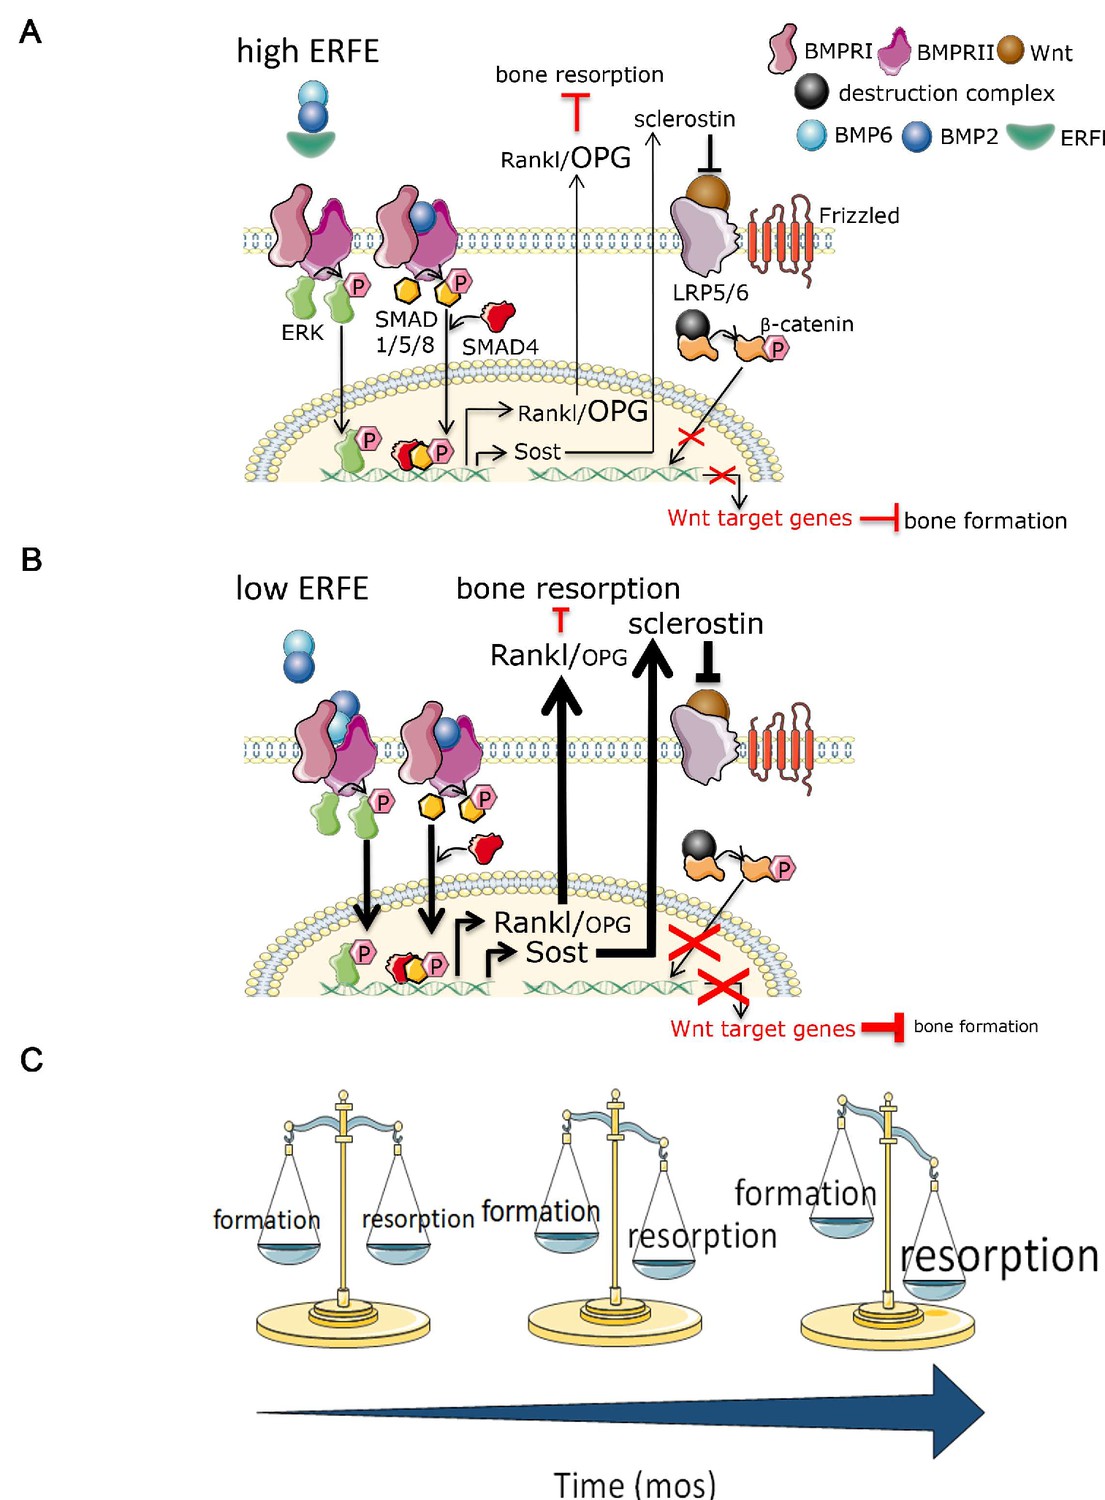
Putative osteoprotective function of ERFE in health and in β-thalassemia.
In conditions of elevated ERFE (A), sich as β-thalassemia, more BMP2 and BMP6 is sequestered, decreasing signaling through the BMP/Smad and ERK pathways. This would result in decreased Sost and Rankl expression to decrease osteoclastogenesis and bone resorption. In contrast, when ERFE is low (B), increased BMP2, and possibly BMP6, leads to increased osteoclastogenesis with consequent decrease in bone formation. (C) Together, ERFE loss leads to a greater degree of progressively increased bone resorption relative to bone formation with age. ERFE = erythroferrone; BMP = bone morphogenetic protein; BMPR = BMP receptor; SOST = Sclerostin; RANKL = receptor activator of nuclear factor kappa-B ligand; OPG = osteoprotegrin; LRP = lipoprotein receptor-related protein; Wnt = wingless type MMTV integration site family.
Author response image 1
Tables
Table 1
Primers used in the presented studies.
| Gene | Forward (sense) | Reverse (antisense) |
|---|---|---|
| Actb | TTCTTTGCAGCTCCTTCGTT | ATGGAGGGGAATACAGCCC |
| Tubb | CTGGAGCAGTTTGACGACAC | TGCCTTTGTGCACTGGTATG |
| Hamp | TGAGCAGCACCACCTATCTC | ACTGGGAATTGTTACAGCATTT |
| Acp5 | ACCTGTGCTTCCTCCAGGAT | TCTCAGGGTGGGAGTGGG |
| Ctsk | CCATATGTGGGCCAGGATG | TCAGGGCTTTCTCGTTCCC |
| Runx2 | GTGGCCACTTACCACAGAGC | GTTCTGAGGCGGGACACC |
| Alpl | ACACCTTGACTGTGGTTACTGCTGA | CCTTGTAGCCAGGCCCGTTA |
| Osx | TGAGGAAGAAGCCCATTCAC | GTGGTCGCTTCTGGTAAAGC |
| Col1a1 | CCTGGCAAAGACGGACTCAAC | GCTGAAGTCATAACCGCCACTG |
| Tnsf11 | CAGCCATTTGCACACCTCAC | GTCTGTAGGTACGCTTCCCG |
| Opg | ACAGTTTGCCTGGGACCAAA | CAGGCTCTCCATCAAGGCAA |
| Dmp1 | GGGCTGTGTTGTGCAAGACA | GGTGCACACCTGACCTTCTTTAA |
| Fam132b | ATGGGGCTGGAGAACAGC | TGGCATTGTCCAAGAAGACA |
Table 2
Antibodies used in the presented studies.
| Antibody | Company | # catalog | Dilution | BSA/Milk (5%) | Rabbit/mouse |
|---|---|---|---|---|---|
| PRIMARY antibodies | |||||
| pSMAD 1/5/8 | Cell signaling | 9511 | 1:1000 | BSA | Rabbit |
| pSMAD 1/5/8 (monoclonal) | Cell signaling | 9516 | 1:1000 | BSA | Rabbit |
| SMAD 1 | Cell signaling | 6944S | 1:1000 | BSA | Rabbit |
| p-ERK (monoclonal) | Cell signaling | 4376 | 1:1000 | BSA | Rabbit |
| ERK | Cell signaling | 4695 | 1:1000 | BSA | Rabbit |
| pp38 | Cell signaling | 4511 | 1:1000 | BSA | Rabbit |
| p38 | Cell signaling | 8690 | 1:1000 | BSA | Rabbit |
| Beta-actin | ThermoFisher | MA515452 | 1:1000 | BSA | Mouse |
| SECONDARY antibodies | |||||
| Rabbit | Cell signaling | 7074 | 1:5000 | BSA | |
| Mouse | GE Healthcare | NXA931V | 1:20000 | BSA | |
Additional files
-
Source data 1
Source data file for presented studies.
- https://cdn.elifesciences.org/articles/68217/elife-68217-data1-v2.xlsx
-
Transparent reporting form
- https://cdn.elifesciences.org/articles/68217/elife-68217-transrepform-v2.pdf
Download links
A two-part list of links to download the article, or parts of the article, in various formats.
Downloads (link to download the article as PDF)
Open citations (links to open the citations from this article in various online reference manager services)
Cite this article (links to download the citations from this article in formats compatible with various reference manager tools)
The hepcidin regulator erythroferrone is a new member of the erythropoiesis-iron-bone circuitry
eLife 10:e68217.
https://doi.org/10.7554/eLife.68217


