UBTD1 regulates ceramide balance and endolysosomal positioning to coordinate EGFR signaling
- Université Côte d'Azur, CNRS, IPMC, France
- Université Côte d’Azur, Inserm, C3M, Team Targeting prostate cancer cell metabolism, France
- Université Côte d’Azur, Inserm, C3M, Team Metabolism and cancer, France
- Biomedical Department, Centre Scientifique de Monaco, Monaco
- Biochemistry Laboratory, University Hospital, France
- MRC Centre for Environment and Health, Department of Epidemiology and Biostatistics, School of Public Health, Imperial CollegeLondon, United Kingdom
- Department of Medical Biochemistry and Cell Biology, University of Gothenburg, Sweden
- Inserm U1065, Université Côte d’Azur, France
- CCMA, UFR Sciences, Université Côte d'Azur, France
- Université Côte d’Azur, Inserm, C3M, Team Cellular and Molecular Pathophysiology of Obesity and Diabetes, France
Figures
Figure 1 with 1 supplement
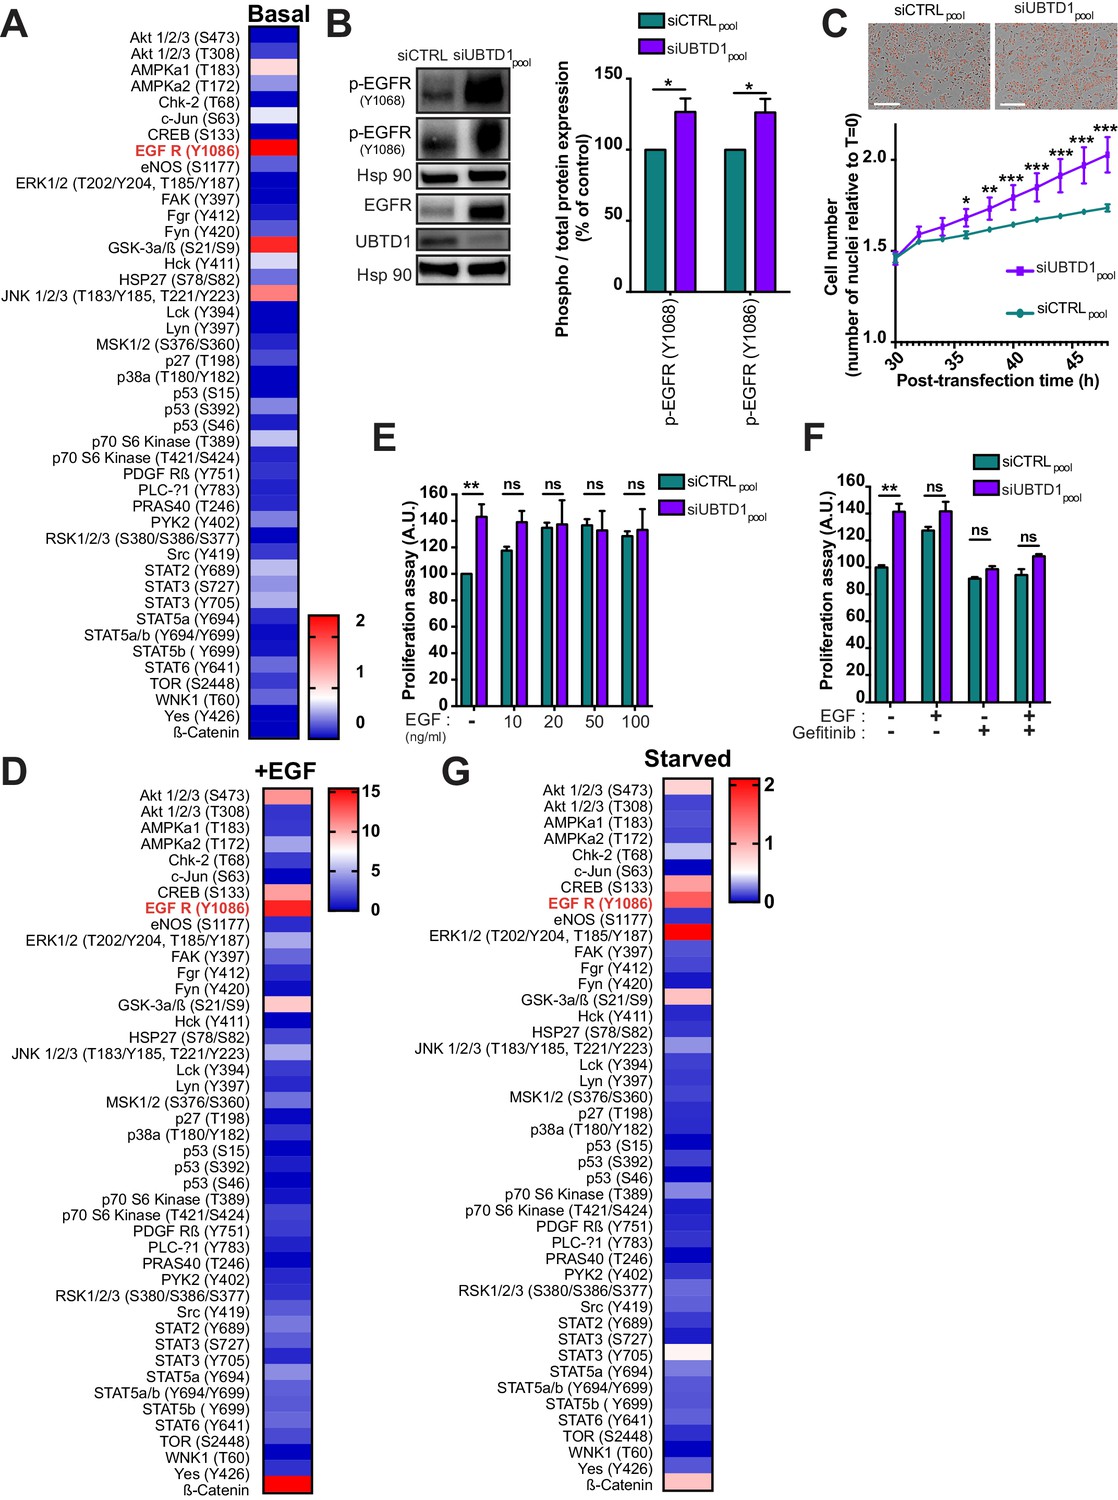
UBTD1 depletion exacerbates EGFR signaling to induce cell proliferation.
(A–G) DU145 cells were transfected for 48 hr with the indicated siRNA (siCTRLpool or siUBTD1pool). (A, D, G) Heatmap of protein phosphorylation relative quantification from multiple signaling pathways in complete media (A), under EGF stimulation (D) at 50 ng/ml for 10 min or under serum-starved medium (G). Data quantification is carried out from dot blot (Figure 1—figure supplement 1A, C, H) and normalized to the siCTRL condition. (B) Immunoblot and quantification of p-EGFR (Y1068 or Y1086). p-EGFR levels were quantified by calculating the ratio between p-EGFR and EGFR, both normalized to loading control signal. Immunoblot of UBTD1 shows the level of siRNA depletion. (C) Representative images and cell growth curves measured by videomicroscopy (Incucyte, Essen Bioscience). T = 0 corresponds to transfection time and the time window (30–50 hr) is presented. (E, F) Proliferation assay in the presence of different concentrations of EGF (E) and in the presence of EGF inhibitor (Gefitinib) (F). n ≥ 3 independent experiments. ns = non-significant, *p<0.05; **p<0.01, ***p<0.001; (C) Bonferroni’s multiple comparison test; (E–F) two-way ANOVA and Bonferroni’s multiple comparisons test; data are mean ± s.e.m.
-
Figure 1—source data 1
Uncropped western blot for Figure 1.
- https://cdn.elifesciences.org/articles/68348/elife-68348-fig1-data1-v2.pdf
-
Figure 1—source data 2
Row data for Figure 1 and for Figure 1—figure supplement 1.
- https://cdn.elifesciences.org/articles/68348/elife-68348-fig1-data2-v2.xlsx
Figure 1—figure supplement 1
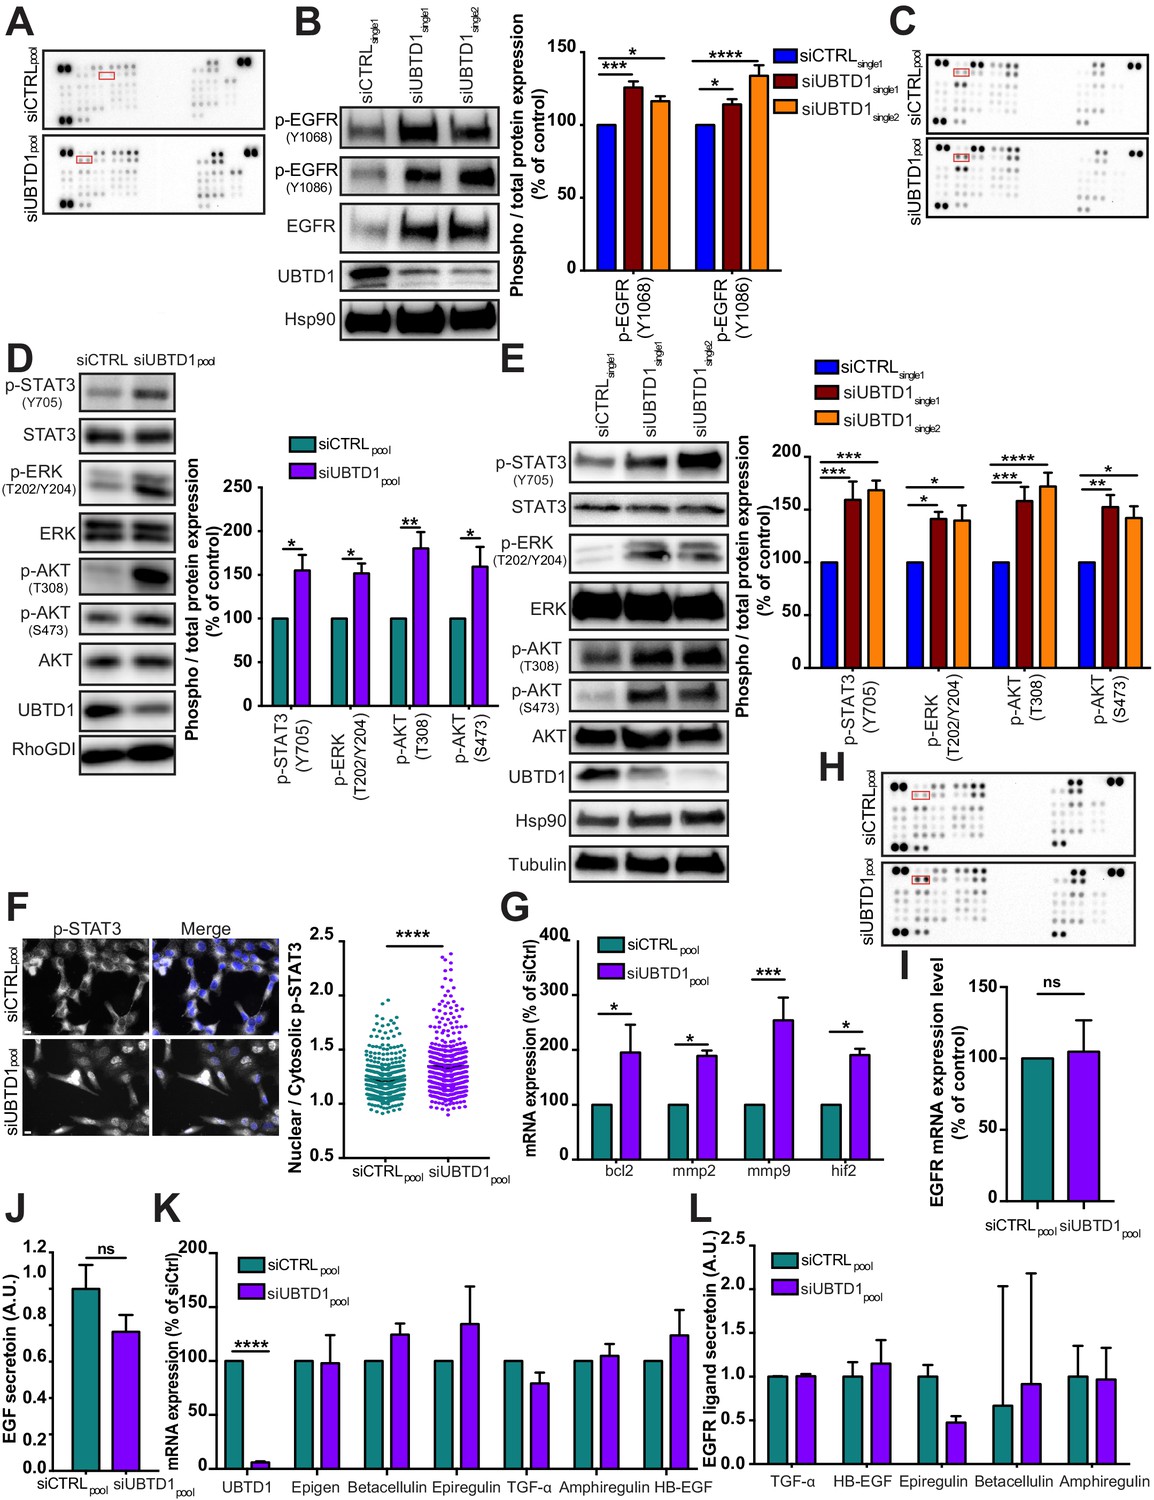
UBTD1 depletion exacerbates EGFR signaling.
(A–L) DU145 cells were transfected for 48 hr with the indicated siRNA (control, siCTRLpool or siCTRLsingle1; control, siCTRL; UBTD1: siUBTD1pool or siUBTD1single1 or single2). (A,C,H) Western blotting images of phospho-kinases spotted on the Proteome Profiler Human Phospho-Kinase Array in complete media (A) or under EGF stimulation (C, 50 ng/ml, 10 min) or serum-starved (H). Phospho-EGFR double spots are marked in red rectangles. (B) Immunoblot and quantification (n = 3 independent experiments) of p-EGFR (Y1068 or Y1086). p-EGFR levels were quantified by calculating the ratio between p-EGFR and EGFR, both normalized to loading control signal. Immunoblot of UBTD1 shows the level of siRNA depletion. (D, E) Immunoblot and quantification (n = 3 independent experiments) of pSTAT3, p-ERK, and p-AKT. p-STAT3, p-ERK, and p-AKT levels were quantified by calculating the ratio between phospho-protein and total-protein, both normalized to loading control signal. Immunoblot of UBTD1 shows the level of siRNA depletion. (F) Representative wide-field immunofluorescence images (left) and quantification (right) of pSTAT3 nuclear translocation corresponding to nuclei/cytoplasm mean intensity ratio of pSTAT3. (G) mRNA quantification of STAT3 target genes (bcl2, mmp2, mmp9 and hif2). (I) Quantification of EGFR mRNA level. (J) EGF secretion measured by ELISA. (K) mRNA quantification of EGFR ligands. (L) EGFR ligands secretion measured by ELISA. Scale bar = 10 µm. n ≥ 3 independent experiments; ns = non-significant; *p<0.05; **p<0.01; ***p<0.001; ****p<0.0001; (F, I, J) two-tailed t-test; (B,C,E,G, K,L) two-way ANOVA and Bonferroni’s multiple comparisons test; data are mean ± s.e.m.
-
Figure 1—figure supplement 1—source data 1
Uncropped western blot for Figure 1—figure supplement 1.
- https://cdn.elifesciences.org/articles/68348/elife-68348-fig1-figsupp1-data1-v2.pdf
Figure 2 with 1 supplement
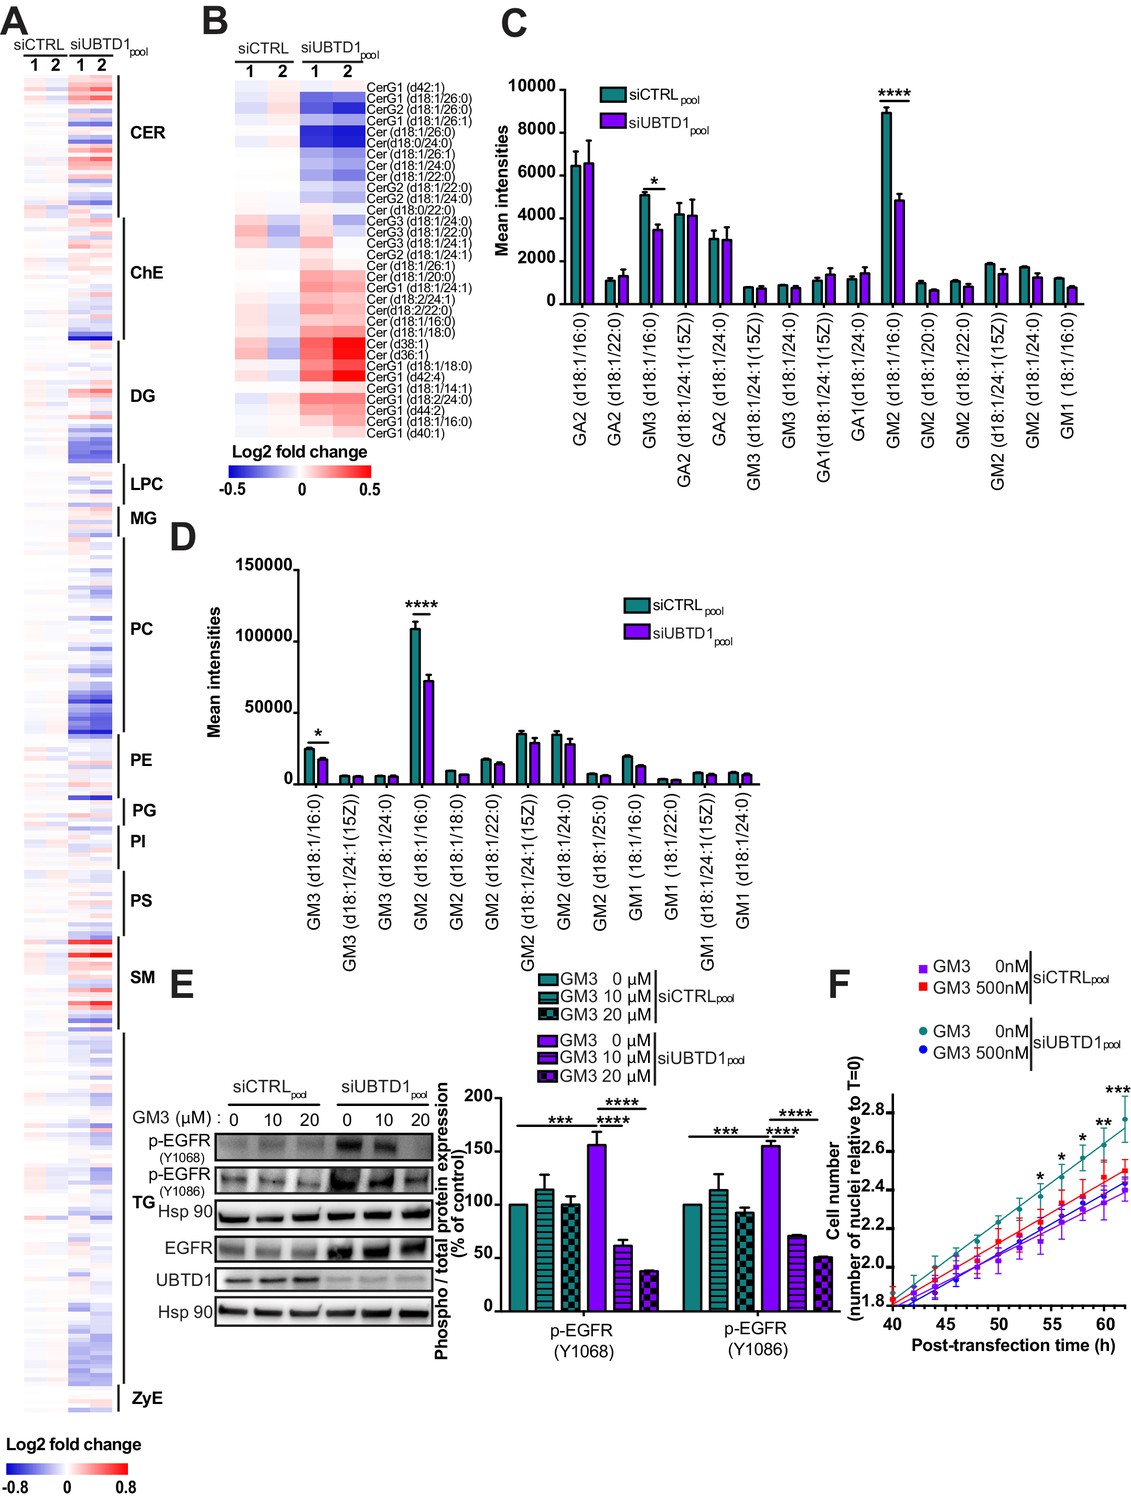
UBTD1 depletion induces EGFR self-phosphorylation by modifying membrane lipid composition.
(A–F) DU145 cells were transfected for 48 hr with the indicated siRNA (siCTRLpool or siUBTD1pool). (A,B) Heatmap of all (A) lipids and (B) ceramide levels. The normalized expression of each lipid is shown in a scale range from blue to red. CER: ceramides; ChE: cholesterol ester; DG: diacylglycerols; LPC: lysophosphatidylcholines; MG: monoacylglycerols; PC: phosphatidylcholines; PE: phosphatidylethanolamines; PG: phosphatidylglycerol; PI: phosphatidylinositol; PS: phosphatidylserines; SM: sphingomyelins; TG: triglycerides; ZyE: zymosterols. (C,D) Mean intensities of positive-ion (C) and negative-ion (D) MS spectra from reflectron MALDI-TOF analyses. (E) Immunoblot and quantification of p-EGFR (Y1068 or Y1086) in the presence of different concentrations of GM3. p-EGFR levels were quantified by calculating the ratio between p-EGFR and EGFR, both normalized to loading control signal. Immunoblot of UBTD1 shows the level of siRNA depletion. (F) Representative cell growth curves measured by videomicroscopy (Incucyte, Essen Bioscience) in the presence of GM3. T = 0 corresponds to transfection time and the time window (40–60 hr) is presented. n ≥ 3 independent experiments. *p<0.05 **p<0.01, ***p<0.001; ****p<0.0001; (C–F) two-way ANOVA and Bonferroni’s multiple comparisons test; data are mean ± s.e.m.
-
Figure 2—source data 1
Uncropped western blot for Figure 2.
- https://cdn.elifesciences.org/articles/68348/elife-68348-fig2-data1-v2.pdf
-
Figure 2—source data 2
Row data for Figure 2 and for Figure 2—figure supplement 1.
- https://cdn.elifesciences.org/articles/68348/elife-68348-fig2-data2-v2.xlsx
Figure 2—figure supplement 1
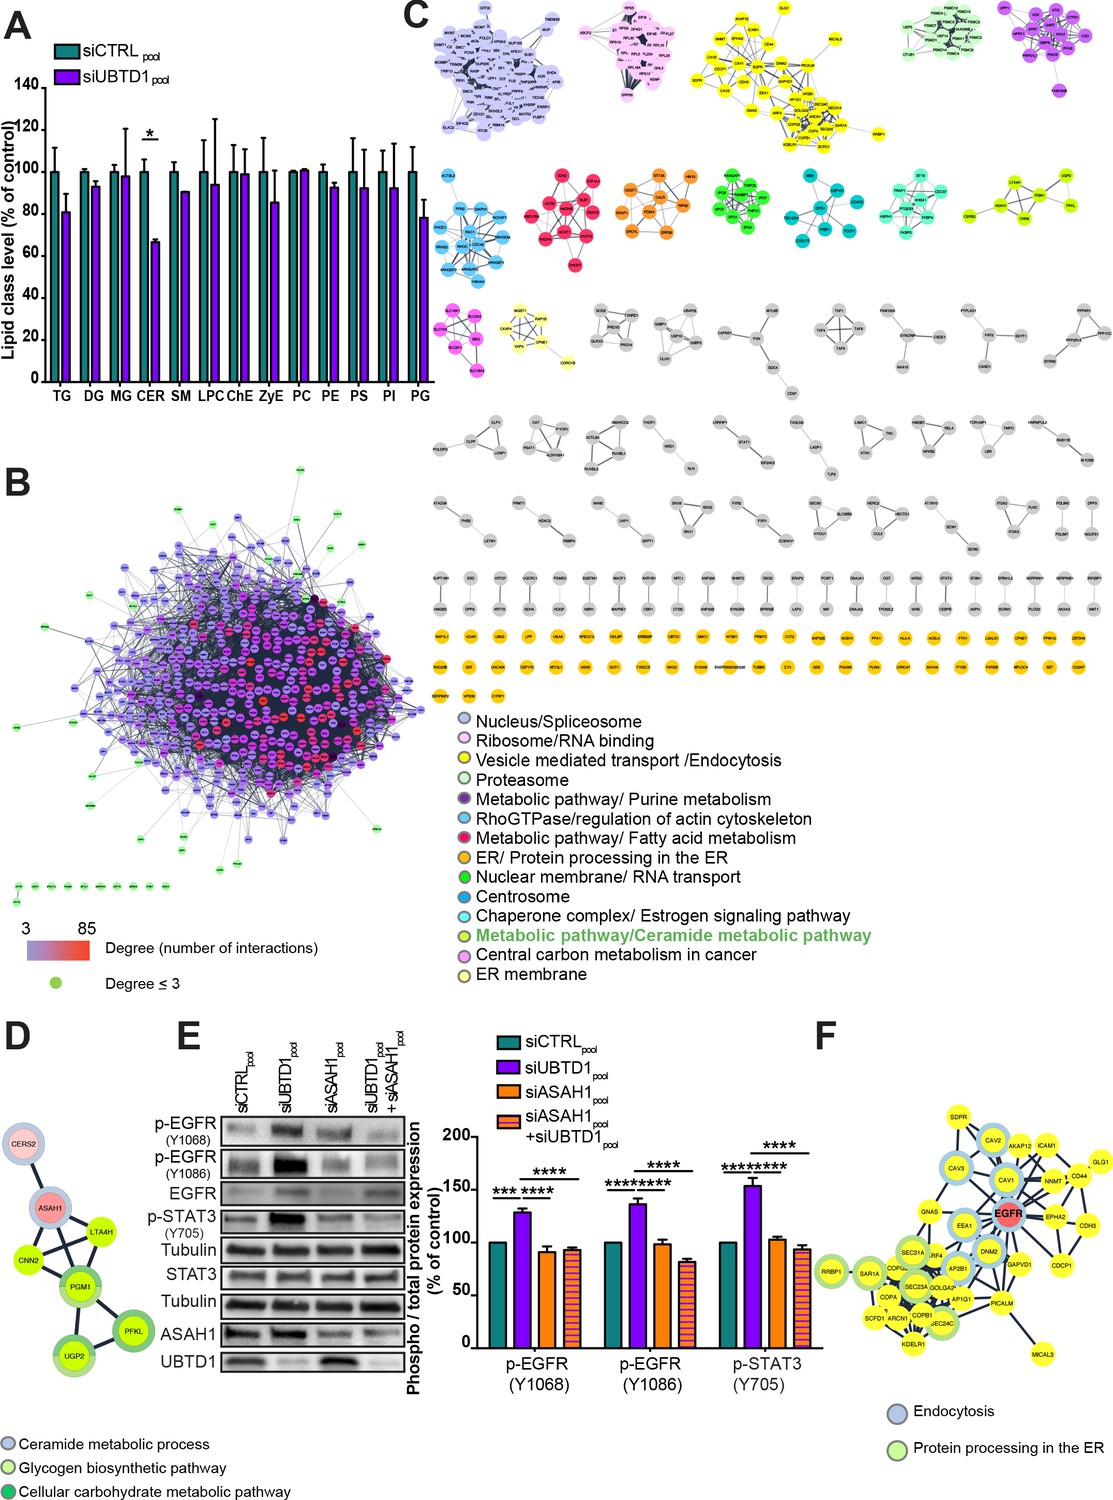
Protein clustering and functional interaction analysis of the UBTD1 interactome.
(A) DU145 cells were transfected for 48 hr with the indicated siRNA (control, siCTRLpool or UBTD1: siUBTD1pool). Quantification of lipid class levels, as measured by lipidomics. Data quantification is normalized to siCTRL condition. CER: ceramides; ChE: cholesterol ester; DG: diacylglycerols; LPC: lysophosphatidylcholines; MG: monoacylglycerols; PC: phosphatidylcholines; PE: phosphatidylethanolamines; PG: phosphatidylglycerol; PI: phosphatidylinositol; PS: phosphatidylserines; SM: sphingomyelins; TG: triglycerides; ZyE: zymosterols. (B) The UBTD1 interactome in DU145 cell line was generated from proteins identified by mass spectrometry (nodes) and interaction scores extracted from the String database (connecting lines: edges). The thickness of the edge represents the interaction score (string database, combined score). Node color scale (from blue to red) illustrates the degree (number of interactors). Green-colored node corresponds to protein with a degree £3. (C) The proteins were clustered using an unsupervised clustering algorithm (MCL) and ordered according to the number of nodes. For each protein cluster, the main KEGG pathway or Go component (highest FDR values) was assigned (color code). (D) Functional cluster ‘metabolic pathway/Ceramide metabolic pathway’. Pink-colored nodes represents proteins involved in ceramide turnover. For each protein the highest value (FDR) ‘Go Function’ was represented using a split donut. (E) DU145 cells were transfected for 48 hr with the indicated siRNA (control, siCTRLpool or UBTD1: siUBTD1pool or ASAH1: siASAH1pool). Immunoblot and quantification (n = 3 independent experiments) of p-EGFR (Y1068 or Y1086) and p-STAT3. p-EGFR or p-STAT3 levels were quantified by calculating the ratio between p-EGFR and EGFR or p-STAT3 and STAT3, both normalized to loading control signal. Immunoblot of UBTD1 and ASAH1 show the level of siRNA depletion. (F) Functional cluster ‘vesicle mediated transport/endocytosis’. Pink-colored node: EGFR. Proteins associated to endocytosis (blue) or protein processing in the ER (green) was represented using a full donut (Cytoscape, StringApp, KEGG pathways database). n = 3 biologically independent samples per condition; *p<0.05; (A) two-tailed t-test; (E) two-way ANOVA and Bonferroni’s multiple comparisons test; data are mean ± s.e.m.
-
Figure 2—figure supplement 1—source data 1
Uncropped western blot for Figure 2—figure supplement 1.
- https://cdn.elifesciences.org/articles/68348/elife-68348-fig2-figsupp1-data1-v2.pdf
Figure 3
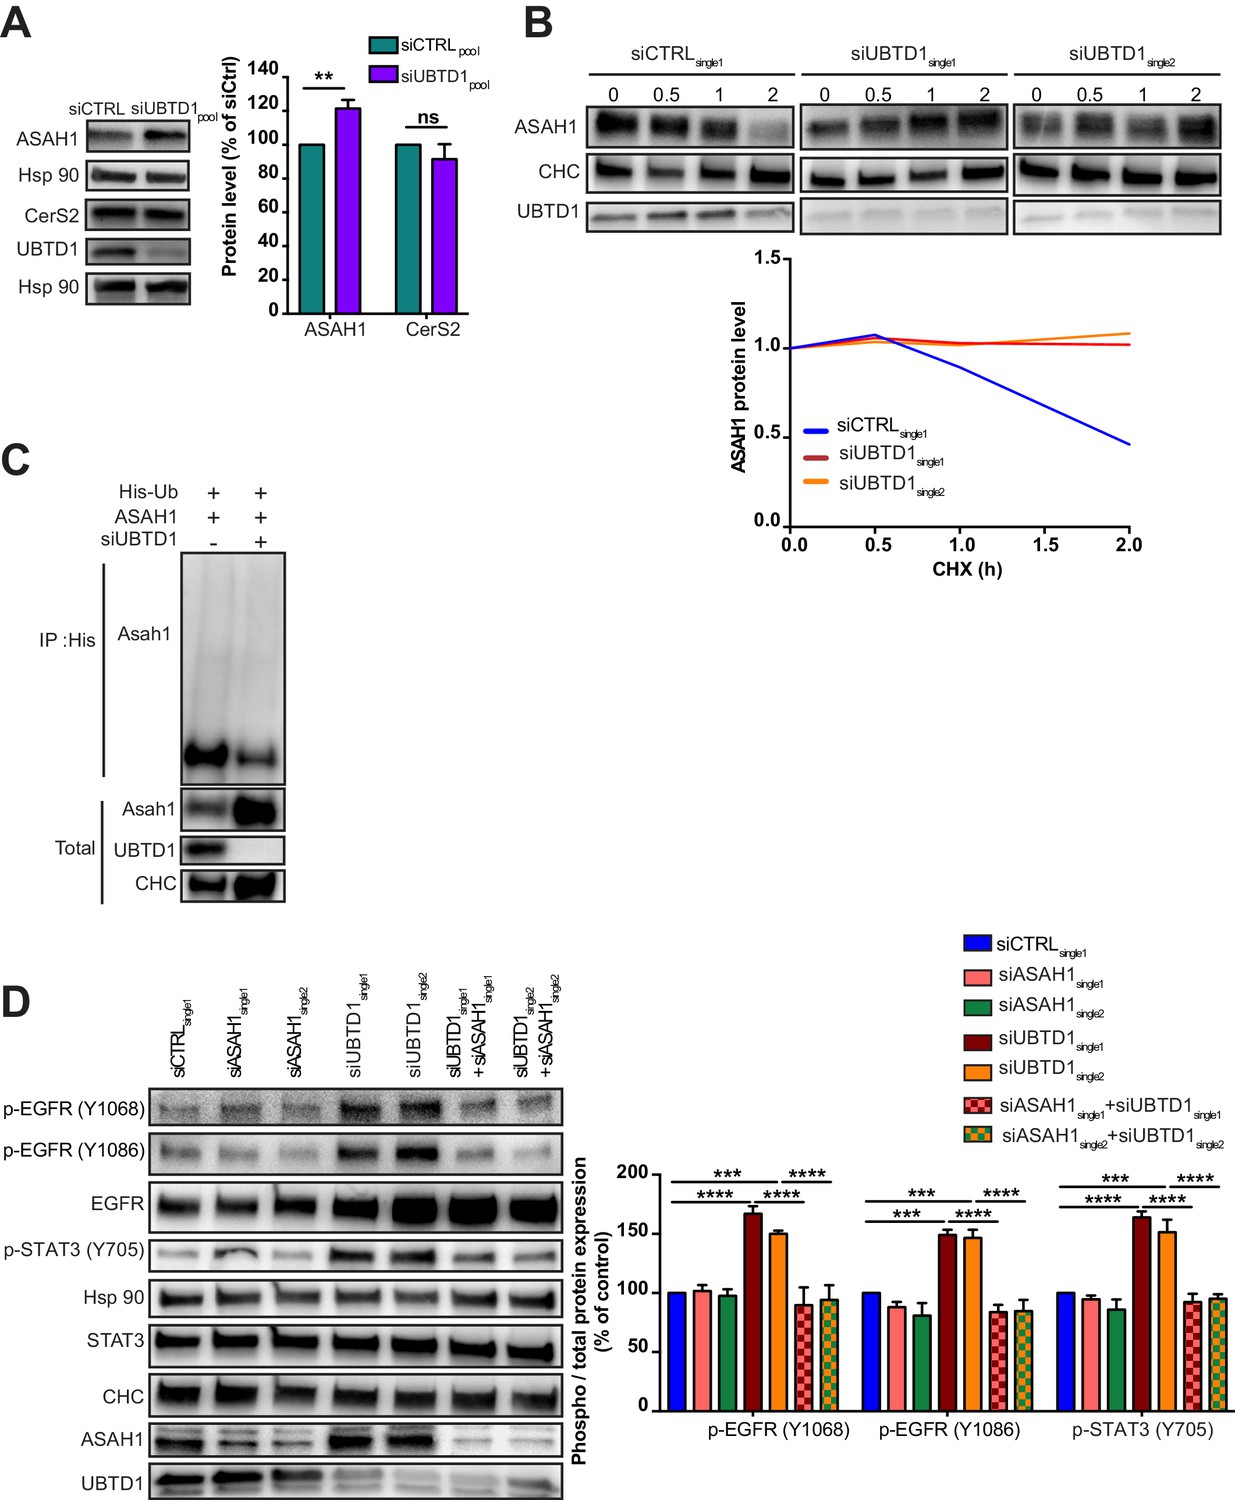
UBTD1 controls ASAH1 ubiquitination to promote EGFR self-phosphorylation.
(A–D) DU145 cells were transfected for 48 hr with the indicated siRNA (siCTRLpool or siUBTD1pool or siUBTD1single1 or single2 or siASAH1 single1 or single2). (A) Immunoblot and quantification of ceramide synthase 2 (CerS2) and the lysosomal ceramidase (ASAH1). (B) Immunoblots (up) and quantification (down) of ASAH1 levels in cells treated with cycloheximide (CHX) at different time points. Immunoblot of UBTD1 shows the level of siRNA depletion. CHC was used as a loading control. (C) Immunoblots show ASAH1 ubiquitylation in HEK cells in different experimental conditions. Cells were transfected, as indicated, with expression vectors for histidine-tagged ubiquitin (His-Ub) together with control siRNA or UBTD1 siRNA. His-Ub crosslinked forms of ASAH1 were purified (IP: His) and the immunoblot of ASAH1 showed ASAH1 ubiquitylation. The immunoblot of ASAH1 (bottom panel) was performed in parallel to verify the amounts of ASAH1 protein engaged in His-Ub purifications. The immunoblot of UBTD1 shows the level of siRNA depletion. (D) Immunoblot and quantification of p-EGFR (Y1068 or Y1086) and p-STAT3. p-STAT3, p-ERK and p-AKT levels were quantified by calculating the ratio between phospho-protein and total-protein, both normalized to loading control signal. Immunoblot of UBTD1 shows the level of siRNA depletion. n ≥ 3 independent experiments; ns = non-significant, **p<0.01, ***p<0.001; ****p<0.0001; (A,D) two-way ANOVA and Bonferroni’s multiple comparisons test; data are mean ± s.e.m.
-
Figure 3—source data 1
Uncropped western blot for Figure 3.
- https://cdn.elifesciences.org/articles/68348/elife-68348-fig3-data1-v2.pdf
-
Figure 3—source data 2
Row data for Figure 3.
- https://cdn.elifesciences.org/articles/68348/elife-68348-fig3-data2-v2.xlsx
Figure 4 with 2 supplements
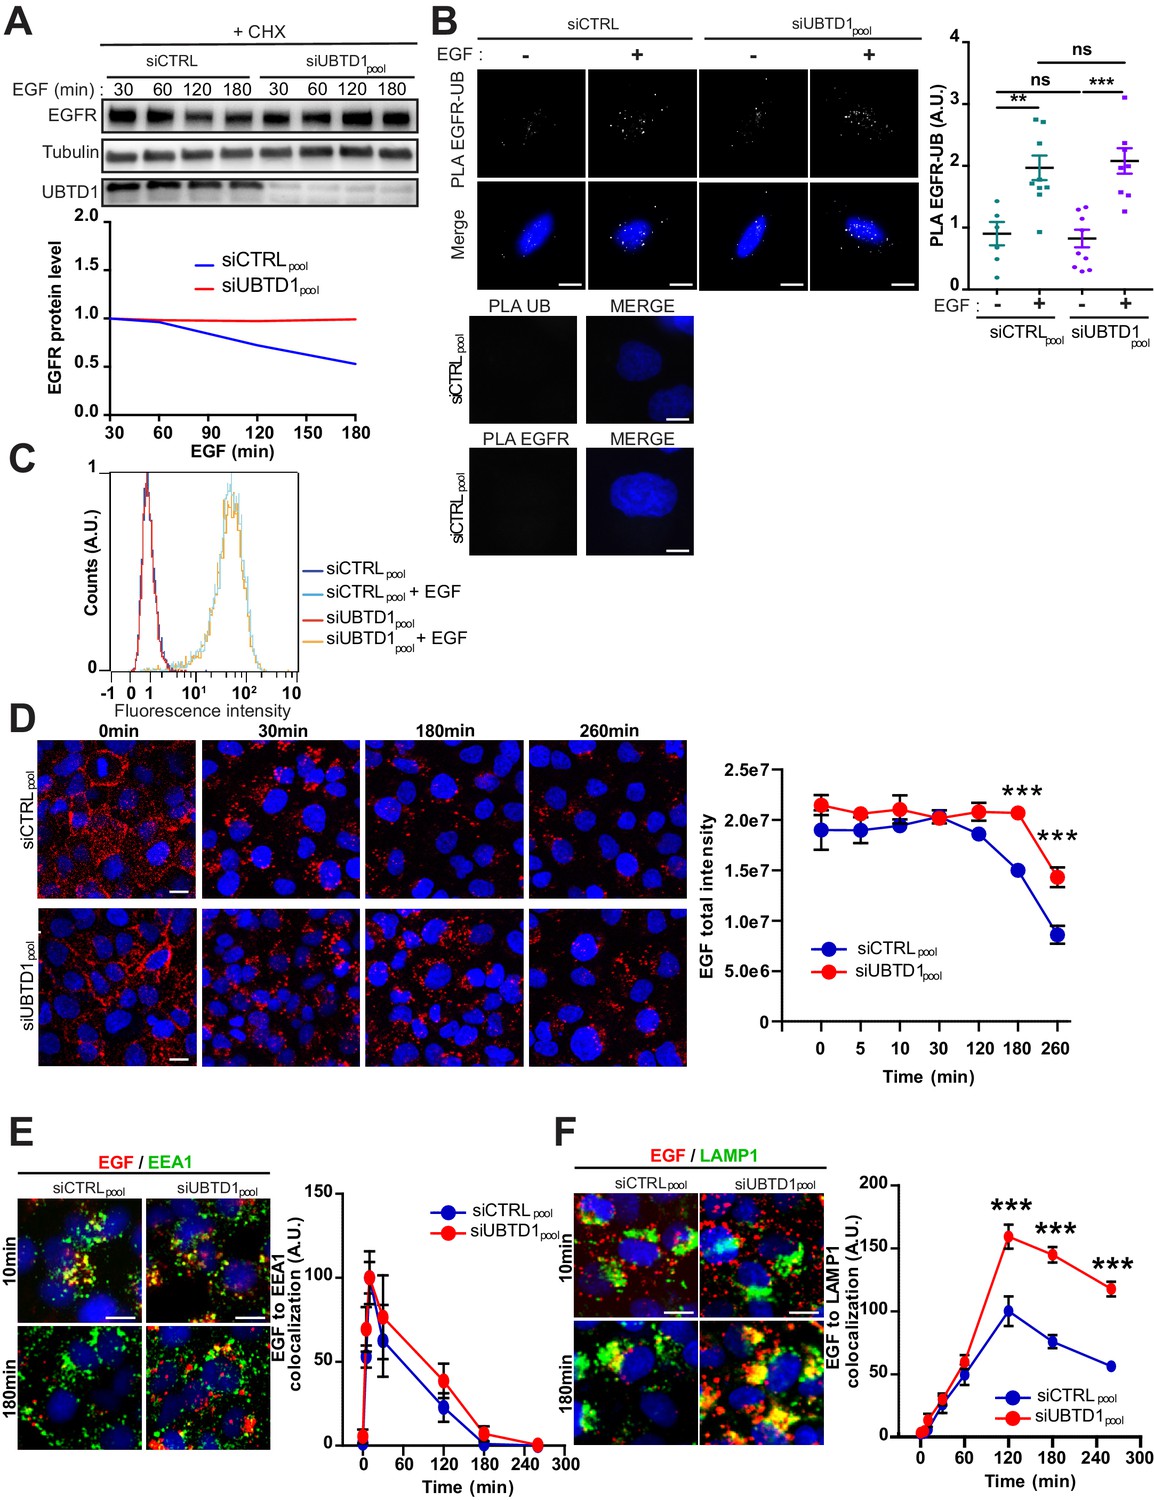
UBTD1 depletion slows-down EGFR degradation.
(A–F) DU145 cells were transfected for 48 hr with the indicated siRNA (siCTRLpool or siUBTD1pool). (A) Immunoblots (up) and quantification (down) of EGFR levels in cells treated with cycloheximide (CHX) for 2 hr and in presence of EGF (50 ng/ml) at different time points. Immunoblot of UBTD1 shows the level of siRNA depletion. Tubulin was used as a loading control. (B) Proximal ligation assay monitoring and quantification of EGFR associated with ubiquitin in DU145 treated with EGF (50 ng/ml, 10 min). Nuclei were stained with DAPI (blue) on the MERGE image. (C) EGF binding to cell surfaces detected by flow cytometry. (D) EGF-alexa647 pulse chase images and quantification. (D) Representative images and quantification of EGF and EEA1 co-localization during EGF-alexa647 pulse chase. (E,F) Representative images and quantification of EGF and LAMP1 co-localization during EGF-Alexa647 pulse chase. Scale bar = 10 µm. n ≥ 3 independent experiments; ns = non-significant; **p<0.01; ***p<0.001; (B, D–F) Bonferroni’s multiple comparison test; data are mean ± s.e.m.
-
Figure 4—source data 1
Uncropped western blot for Figure 4.
- https://cdn.elifesciences.org/articles/68348/elife-68348-fig4-data1-v2.pdf
-
Figure 4—source data 2
Row data for Figure 4 and for Figure 4—figure supplements 1–2.
- https://cdn.elifesciences.org/articles/68348/elife-68348-fig4-data2-v2.xlsx
Figure 4—figure supplement 1

UBTD1 depletion slows down EGFR degradation.
(A–K) DU145 cells were transfected for 48 hr with the indicated siRNA (control, siCTRLpool or siCTRLsingle1; control, siCTRL; UBTD1: siUBTD1pool or siUBTD1single1 or single2). (A) Immunoblots (up) and quantification (down) of EGFR levels in cells treated with cycloheximide (CHX) for 2 hr and in presence of EGF (50 ng/ml) at different time points. Immunoblot of UBTD1 shows the level of siRNA depletion. Hsp90 was used as a loading control. (B) Immunoblots show EGFR ubiquitylation in presence of EGF (50 ng/ml, 10 min) in HEK cells in different experimental conditions. Cells were transfected, as indicated, with expression vectors for histidine-tagged ubiquitin (His-Ub) and EGFR. His-Ub crosslinked forms of EGFR were purified (IP: His) and the immunoblot of EGFR showed EGFR ubiquitylation. The immunoblot of EGFR (bottom panel) was performed in parallel to verify the amounts of EGFR protein engaged in His-Ub purifications. The immunoblot of UBTD1 shows the level of siRNA depletion. (C) Quantification of the EEA1 vesicle number from the pulse-chase experiments. (D) Quantification of the LAMP1 vesicle number from the pulse-chase experiments. (E) Quantification of the EEA1 vesicle size from the pulse-chase experiments. (F) Quantification of the LAMP1 vesicle size from the pulse-chase experiments. (G,H) Electron microscopy representative images (G) and quantification (H) of the number of early endosomes, late endosomes and lysosomes based on their morphological description. (I–K) Representative images and quantification of the QD-BSA vesicle number and total frame intensity. Scale bar = 10 µm. n ≥ 3 independent experiments. (C–F,H,J,K) Bonferroni’s multiple comparison test; data are mean ± s.e.m.
-
Figure 4—figure supplement 1—source data 1
Uncropped western blot for Figure 4—figure supplement 1.
- https://cdn.elifesciences.org/articles/68348/elife-68348-fig4-figsupp1-data1-v2.pdf
-
Figure 4—figure supplement 1—source data 2
Uncropped western blot for Figure 4—figure supplement 2.
- https://cdn.elifesciences.org/articles/68348/elife-68348-fig4-figsupp1-data2-v2.pdf
Figure 4—figure supplement 2
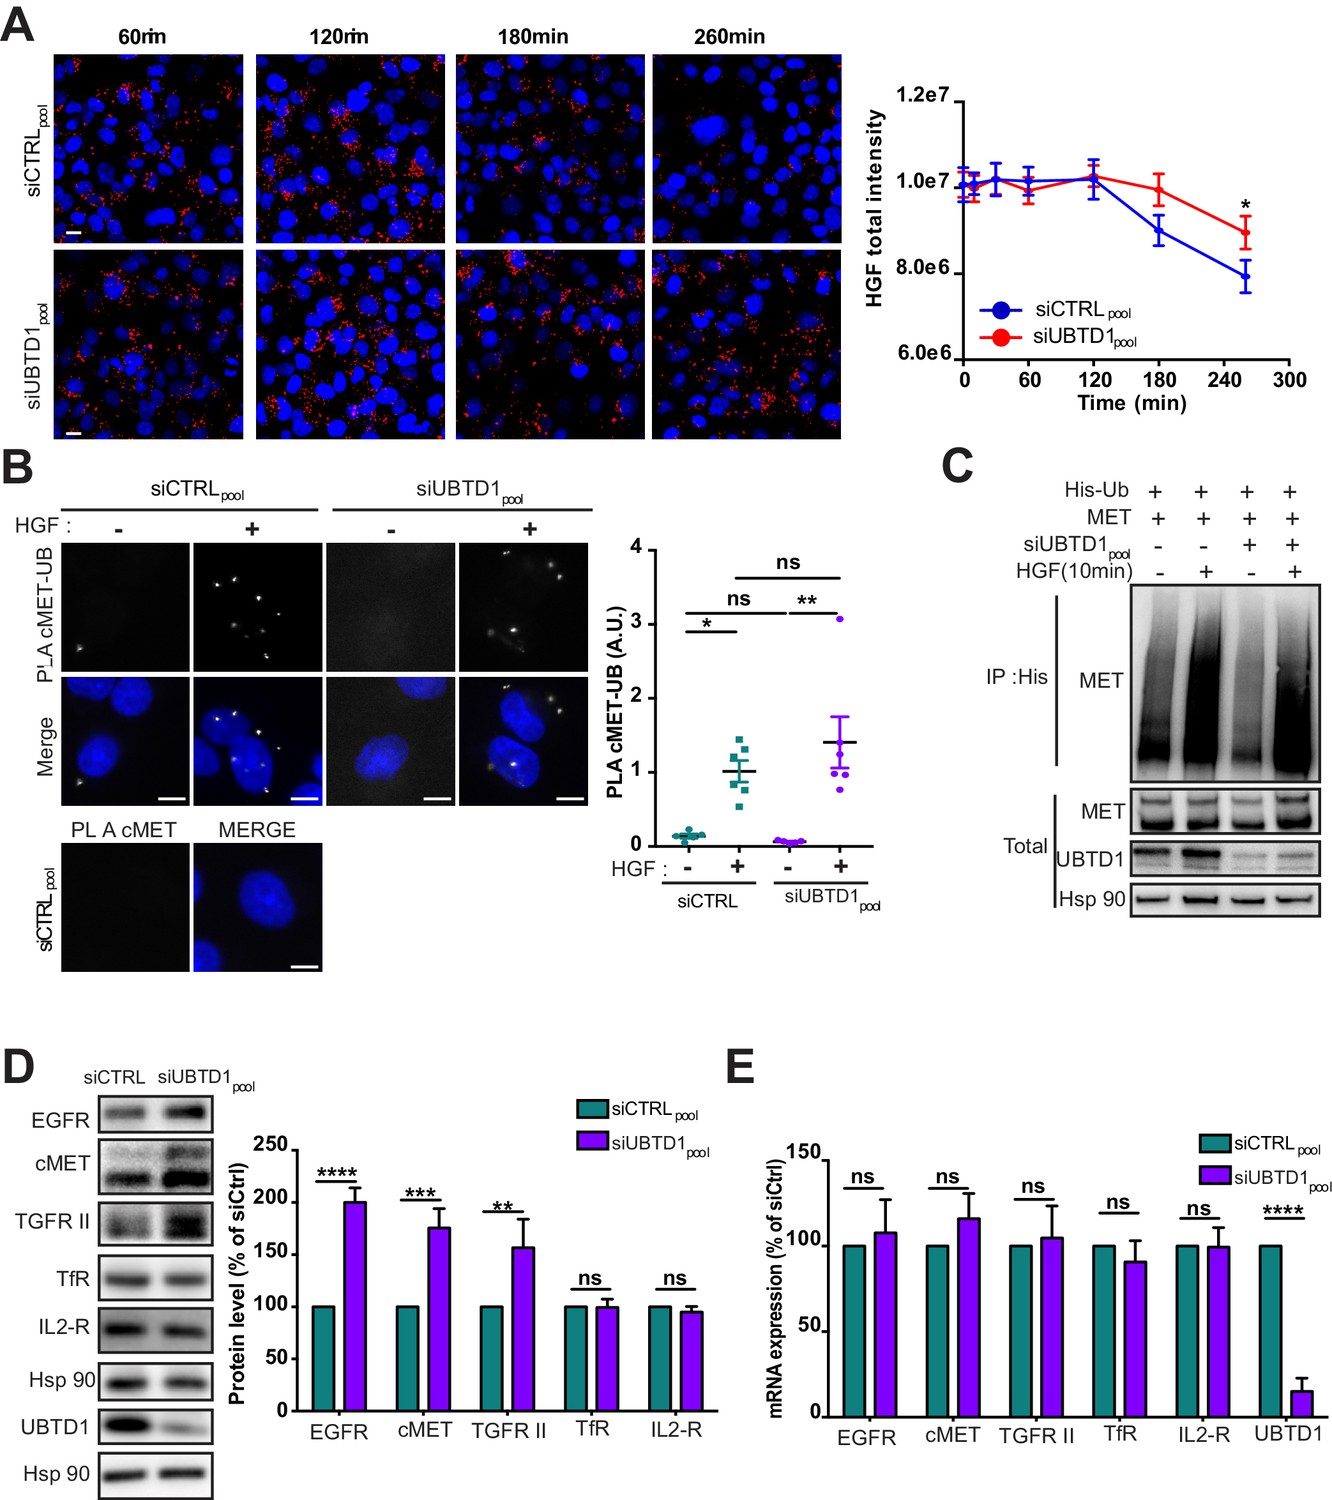
UBTD1 depletion slows down RTK degradation.
(A–E) DU145 cells were transfected for 48 hr with the indicated siRNA (control, siCTRLpool or UBTD1: siUBTD1pool). (A) HGF-alexa647 pulse chase images and quantification. (B) Proximal ligation assay monitoring and quantification of MET associated with ubiquitin in DU145 treated with HGF (40 ng/ml, 10 min). Nuclei were stained with DAPI (blue) on the MERGE image. (C) Immunoblots show MET ubiquitylation in presence of HGF (40 ng/ml, 10 min) in HEK cells in different experimental conditions. Cells were transfected, as indicated, with expression vectors for histidine-tagged ubiquitin (His-Ub) and MET. His-Ub crosslinked forms of MET were purified (IP: His) and the immunoblot of MET showed MET ubiquitylation. The immunoblot of MET (bottom panel) was performed in parallel to verify the amounts of MET protein engaged in His-Ub purifications. The immunoblot of UBTD1 shows the level of siRNA depletion. (D) Immunoblot and quantification of receptors. The immunoblot of UBTD1 shows the level of siRNA depletion. (E) mRNA quantification of receptors. mRNA of UBTD1 shows the level of siRNA depletion. Scale bar = 10 µm. n ≥ 3 independent experiments. ns = non-significant; *p<0.05; **p<0.01; ***p<0.001; ****p<0.0001; (A,B) Bonferroni’s multiple comparison test; (D,E) two-way ANOVA and Bonferroni’s multiple comparisons test; data are mean ± s.e.m.
Figure 5 with 1 supplement
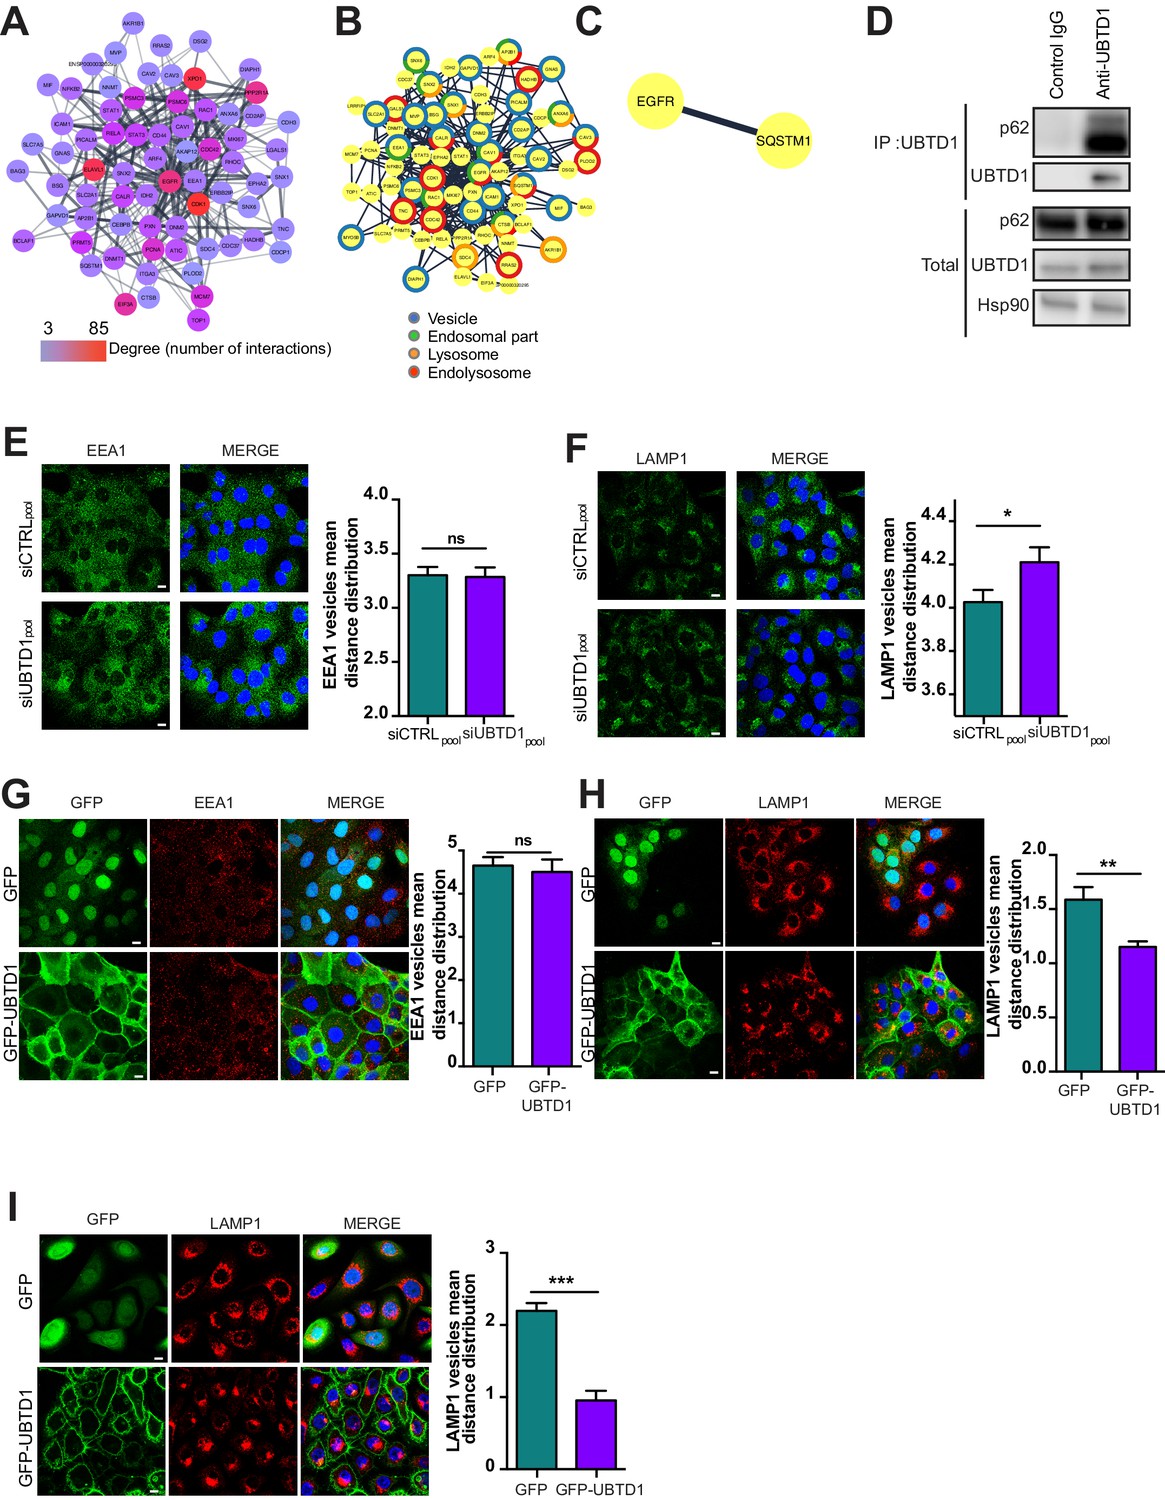
UBTD1 interacts with p62/SQSTM1 and controls endolysosomal vesicle positioning.
(A) UBTD1 protein interactome in DU145 cell line centered on EGFR (first neighbors). Node color scale (from blue to red) illustrates the degree (number of interactors). The edges (connecting lines) represent the interactions between proteins reported in String database. The thickness of the edge represents the interaction score (string database, combined score). (B) Go Enrichment analysis (http://geneontology.org). Most relevant Go component are presented by using a split donut color code (C) Minimal protein interaction network derived from graph (A) by applying subcellular localization filters focused on endosome, ER, and lysosome (StringApp, Cytoscape). (D) Co-immunoprecipitation in DU145 cells between endogenous p62 and UBTD1. UBTD1 was used as bait. The IgG isotype was used as a negative control. (E,F) DU145 cells were transfected for 48 hr with the indicated siRNA (siCTRLpool or siUBTD1pool). Representative confocal immunofluorescence images (left) and quantification (right) of EEA1 (E) or LAMP1 (F) vesicle distribution. (G,H) DU145 or (I) RWPE cells were stably transduced with GFP or GFP-UBTD1. Representative confocal immunofluorescence images (left) and quantification (right) of EEA1 (G) or LAMP1 (H,I) vesicles distribution. Scale bar = 10 μm. n ≥ 3 independent experiments; ns = non-significant; *p<0.05, **p<0.01; ***p<0.001; (E–I) two-tailed t-test; data are mean ± s.e.m.
-
Figure 5—source data 1
Uncropped western blot for Figure 5.
- https://cdn.elifesciences.org/articles/68348/elife-68348-fig5-data1-v2.pdf
-
Figure 5—source data 2
Row data for Figure 5 and for Figure 5—figure supplement 1.
- https://cdn.elifesciences.org/articles/68348/elife-68348-fig5-data2-v2.xlsx
Figure 5—figure supplement 1

UBTD1 controls p62/SQSTM1 ubiquitination and endolysosomal vesicles positioning.
(A,B) DU145 cells were transfected for 48 hr with the indicated siRNA (control, siCTRLpool or UBTD1: siUBTD1pool). Representative confocal immunofluorescence images (left) and quantification (right) of EEA1 (A) or LAMP1 (B) co-localization with Calreticulin. Scale bar = 10 µm. n ≥ 3 independent experiments; ns = non-significant; ***p<0.001; (A,B) two-tailed t-test; data are mean ± s.e.m.
Figure 6 with 1 supplement
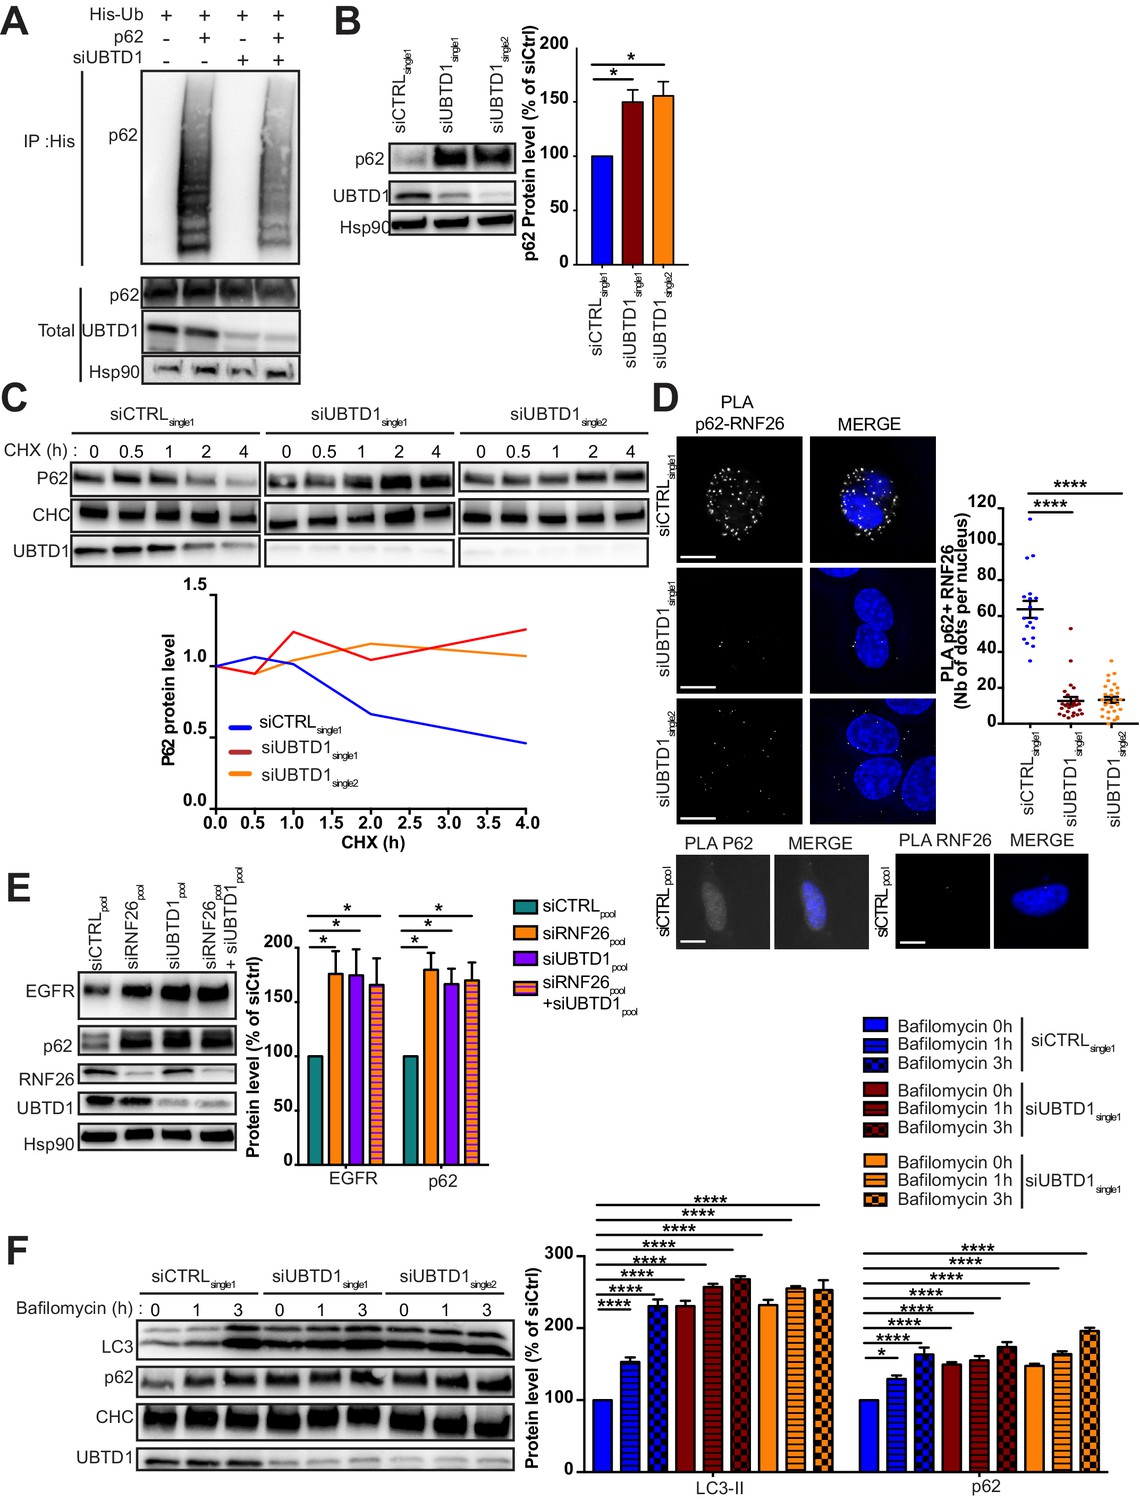
UBTD1 controls p62/SQSTM1 ubiquitination.
(A–F) DU145 cells were transfected for 48 hr with the indicated siRNA (siCTRLpool or siUBTD1pool or siUBTD1single1 or single2 or RNF26: siRNF26pool). (A) Immunoblots show p62 ubiquitylation in HEK cells in different experimental conditions. Cells were transfected, as indicated, with expression vectors for histidine-tagged ubiquitin (His-Ub) together with control siRNA or UBTD1 siRNA. His-Ub crosslinked forms of p62 were purified (IP: His) and the immunoblot of p62 showed p62 ubiquitylation. The immunoblot of p62 (bottom panel) was performed in parallel to verify the amounts of p62 protein engaged in His-Ub purifications. The immunoblot of UBTD1 shows the level of siRNA depletion. (B) Immunoblot and quantification of p62. The immunoblot of UBTD1 shows the level of siRNA depletion. (C) Immunoblots (up) and quantification (down) of p62 levels in cells treated with cycloheximide (CHX) at different time points. Immunoblot of UBTD1 shows the level of siRNA depletion. CHC was used as a loading control. (D) Proximal ligation assay monitoring and quantification of p62 associated with RNF26. (E) Immunoblot and quantification of p62 and EGFR. The immunoblots of RNF26 and UBTD1 show the level of siRNA depletion. (F) Immunoblot and quantification of LC3 and p62 in cells treated or not with bafilomycin at different time points. The immunoblot of UBTD1 shows the level of siRNA depletion. Scale bar = 10 μm. n ≥ 3 independent experiments; *p<0.05, ****p<0.0001; (B,D) Bonferroni’s multiple comparison test; (E–F) two-way ANOVA and Bonferroni’s multiple comparisons test; data are mean ± s.e.m.
-
Figure 6—source data 1
Uncropped western blot for Figure 6.
- https://cdn.elifesciences.org/articles/68348/elife-68348-fig6-data1-v2.pdf
-
Figure 6—source data 2
Raw data for Figure 6 and for Figure 6—figure supplement 1.
- https://cdn.elifesciences.org/articles/68348/elife-68348-fig6-data2-v2.xlsx
Figure 6—figure supplement 1

UBTD1 controls p62/SQSTM1 ubiquitination.
(A–D) DU145 cells were transfected for 48 hr with the indicated siRNA (control, siCTRLpool or UBTD1: siUBTD1pool). (A) Immunoblot and quantification of p62. The immunoblot of UBTD1 shows the level of siRNA depletion. (B) Immunoblots (up) and quantification (down) of p62 levels in cells treated with cycloheximide (CHX) at different time points. Immunoblot of UBTD1 shows the level of siRNA depletion. Hsp90 was used as a loading control. (C) Proximal ligation assay monitoring and quantification of p62 associated with RNF26. (D) Immunoblot and quantification of LC3 and p62 in cells treated or not with bafilomycin at different time points. The immunoblot of UBTD1 shows the level of siRNA depletion. (E) A proposed model for UBTD1 coordination of EGFR signaling and cell proliferation. EGF binding induces phosphorylation of EGFR and causes internalization of the EGF/EGFR complex. The complex is then transported by the endocytic system to be either recycled to the membrane or degraded by the lysosome. EGFR auto-phosphorylation is prevented by ganglioside 3 (GM3) (left). UBTD1 depletion decreases the ubiquitination of the ASAH1 leading to a decline of GM3. Decrease of GM3 induce EGFR self-phosphorylation and signaling. Depletion of UBTD1 also alters endolysosomal positioning and decreases p62/SQSTM1 ubiquitination leading to the inhibition of EGFR degradation. A decrease in EGFR degradation combined with an increase in auto-phosphorylation exacerbates EGFR signaling pathway and induces an EGFR-dependent cell proliferation (right). Scale bar = 10 µm. n ≥ 3 independent experiments; ns = non-significant; *p<0.05; ***p<0.001; ****p<0.0001; (A,C) two-tailed t-test; (D) Bonferroni’s multiple comparison test; data are mean ± s.e.m.
-
Figure 6—figure supplement 1—source data 1
Uncropped western blot for Figure 6—figure supplement 1.
- https://cdn.elifesciences.org/articles/68348/elife-68348-fig6-figsupp1-data1-v2.pdf
Author response image 1
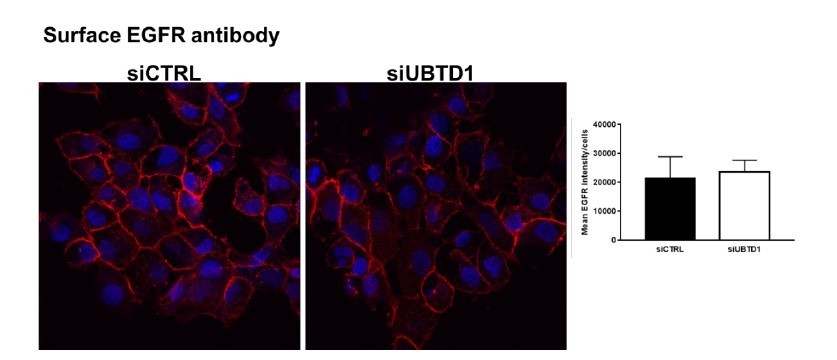
Staining of surface EGFR using an antibody against the extracellular region of EGFR bound at 4°C in unpermeabilised.
Control and UBTD1-depleted cells.
Author response image 2
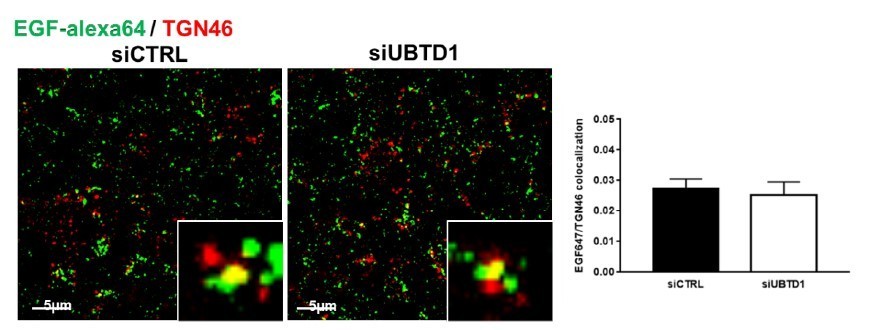
Cells were treated with EGF-647 (100 ng/ml) and stained with a Trans-Golgi network marker (TGN46) to evaluate recycling of EGF-647 in control and UBTD1-depleted cells.
Author response image 3
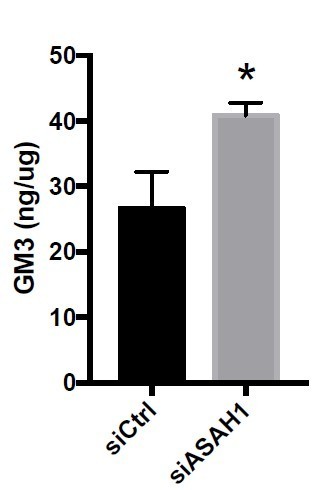
GM3 levels are increased upon siASAH1 in the DU145 cells.
Additional files
-
Supplementary file 1
Proteins identified by LC-MS/MS following UBTD1 immunoprecipitation in DU145 cell line.
- https://cdn.elifesciences.org/articles/68348/elife-68348-supp1-v2.docx
-
Supplementary file 2
Subcellular localization score of UBTD1 interactants in DU145 cell line.
- https://cdn.elifesciences.org/articles/68348/elife-68348-supp2-v2.docx
-
Transparent reporting form
- https://cdn.elifesciences.org/articles/68348/elife-68348-transrepform-v2.pdf
Download links
A two-part list of links to download the article, or parts of the article, in various formats.
Downloads (link to download the article as PDF)
Open citations (links to open the citations from this article in various online reference manager services)
Cite this article (links to download the citations from this article in formats compatible with various reference manager tools)
UBTD1 regulates ceramide balance and endolysosomal positioning to coordinate EGFR signaling
eLife 10:e68348.
https://doi.org/10.7554/eLife.68348


