Single mosquito metatranscriptomics identifies vectors, emerging pathogens and reservoirs in one assay
- Chan Zuckerberg Biohub, United States
- Gothenburg Global Biodiversity Centre, Sweden
- Alameda County Mosquito Abatement District, United States
- Program in Immunology, Stanford University School of Medicine, United States
- Department of Biochemistry and Biophysics, University of California San Francisco, United States
Figures
Figure 1 with 2 supplements
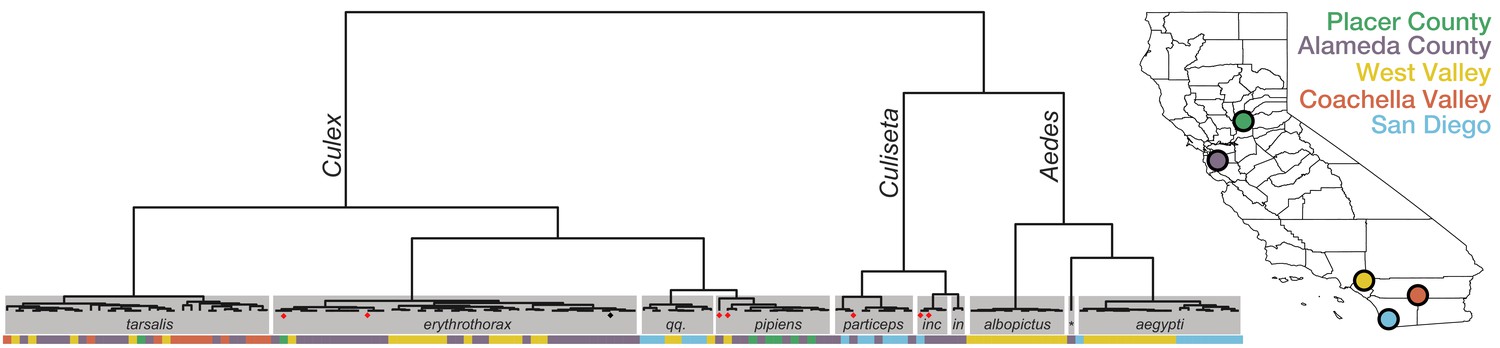
Whole transcriptome analysis for mosquito species identification.
Hierarchical clustering of pairwise single-nucleotide polymorphism (SNP) distances between whole transcriptome sequences from the 148 mosquitoes included in this study estimated using SKA (Harris, 2018). The inferred mosquito species for each cluster (text in gray boxes) is the consensus of the species calls made by visual inspection during sample collection for samples in that cluster (qq. = Culex quinquefasciatus, particeps = Culiseta particeps, inc = Culiseta incidens, in = Culiseta inornata, albo = Aedes albopictus, *=Aedes dorsalis). Red dots below the nodes on the tree highlight mismatches (n = 7) between consensus transcriptome species call and initial visual species call; black dot indicates a sample missing a visual species call. Color bar below the tree shows the collection location for each sample, coded according to the California map legend at right.
-
Figure 1—source data 1
Mosquito demographic metadata.
- https://cdn.elifesciences.org/articles/68353/elife-68353-fig1-data1-v2.xlsx
-
Figure 1—source data 2
Per sample sequence read yield metadata.
- https://cdn.elifesciences.org/articles/68353/elife-68353-fig1-data2-v2.xlsx
Figure 1—figure supplement 1
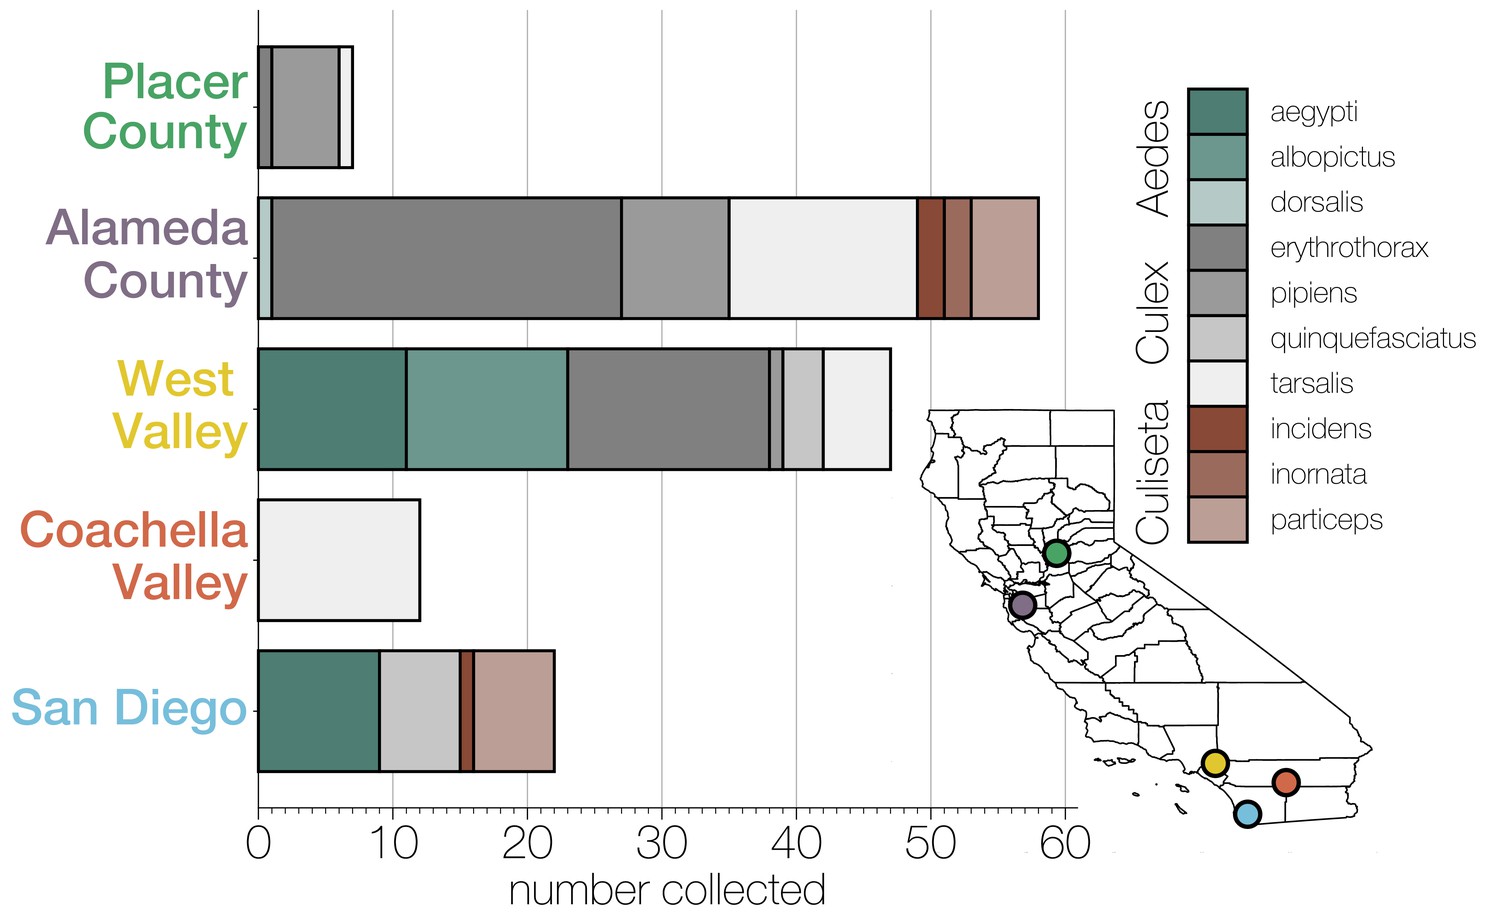
Diversity of individual mosquitoes collected across California.
Plot shows the number of each genus and species of mosquitoes collected across five regions in California: Placer County, Alameda County, West Valley, Coachella Valley, and San Diego, as indicated by the correspondingly colored dots on the map, lower right. Colors in the bar graphs correspond to mosquito species as indicated in the legend.
Figure 1—figure supplement 2
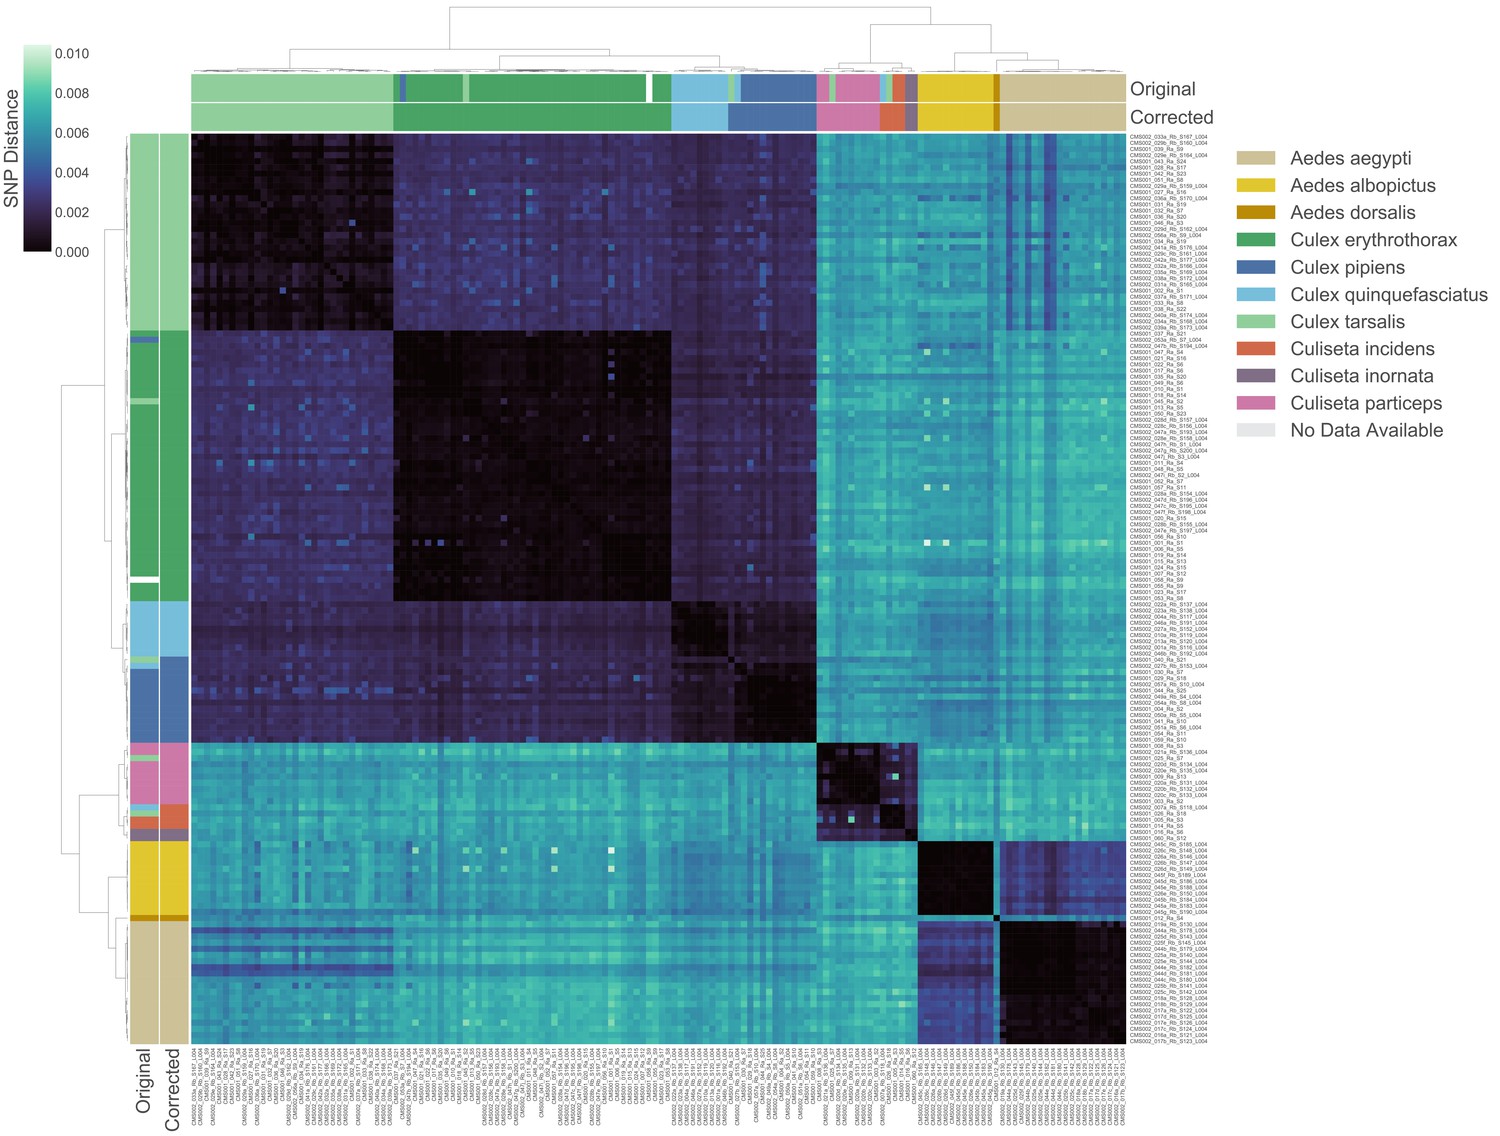
Transcriptome-based identification of mosquito species.
Hierarchical clustering of pairwise single-nucleotide polymorphism (SNP) distances between samples estimated using SKA (Harris, 2018), ranging from 0 (no SNPs detected, black) to 0.01 (1% of comparable sites had SNPs, blue). Outside color bar indicates visual species label for each sample (Visual), inside color bar indicates consensus transcriptome species label for each sample’s cluster (Computed). Computed mosquito species calls were used when Visual and Computed calls were discordant.
-
Figure 1—figure supplement 2—source data 1
SNP distance matrix data underlying Figure 1—figure supplement 2.
- https://cdn.elifesciences.org/articles/68353/elife-68353-fig1-figsupp2-data1-v2.tsv
Figure 2 with 4 supplements
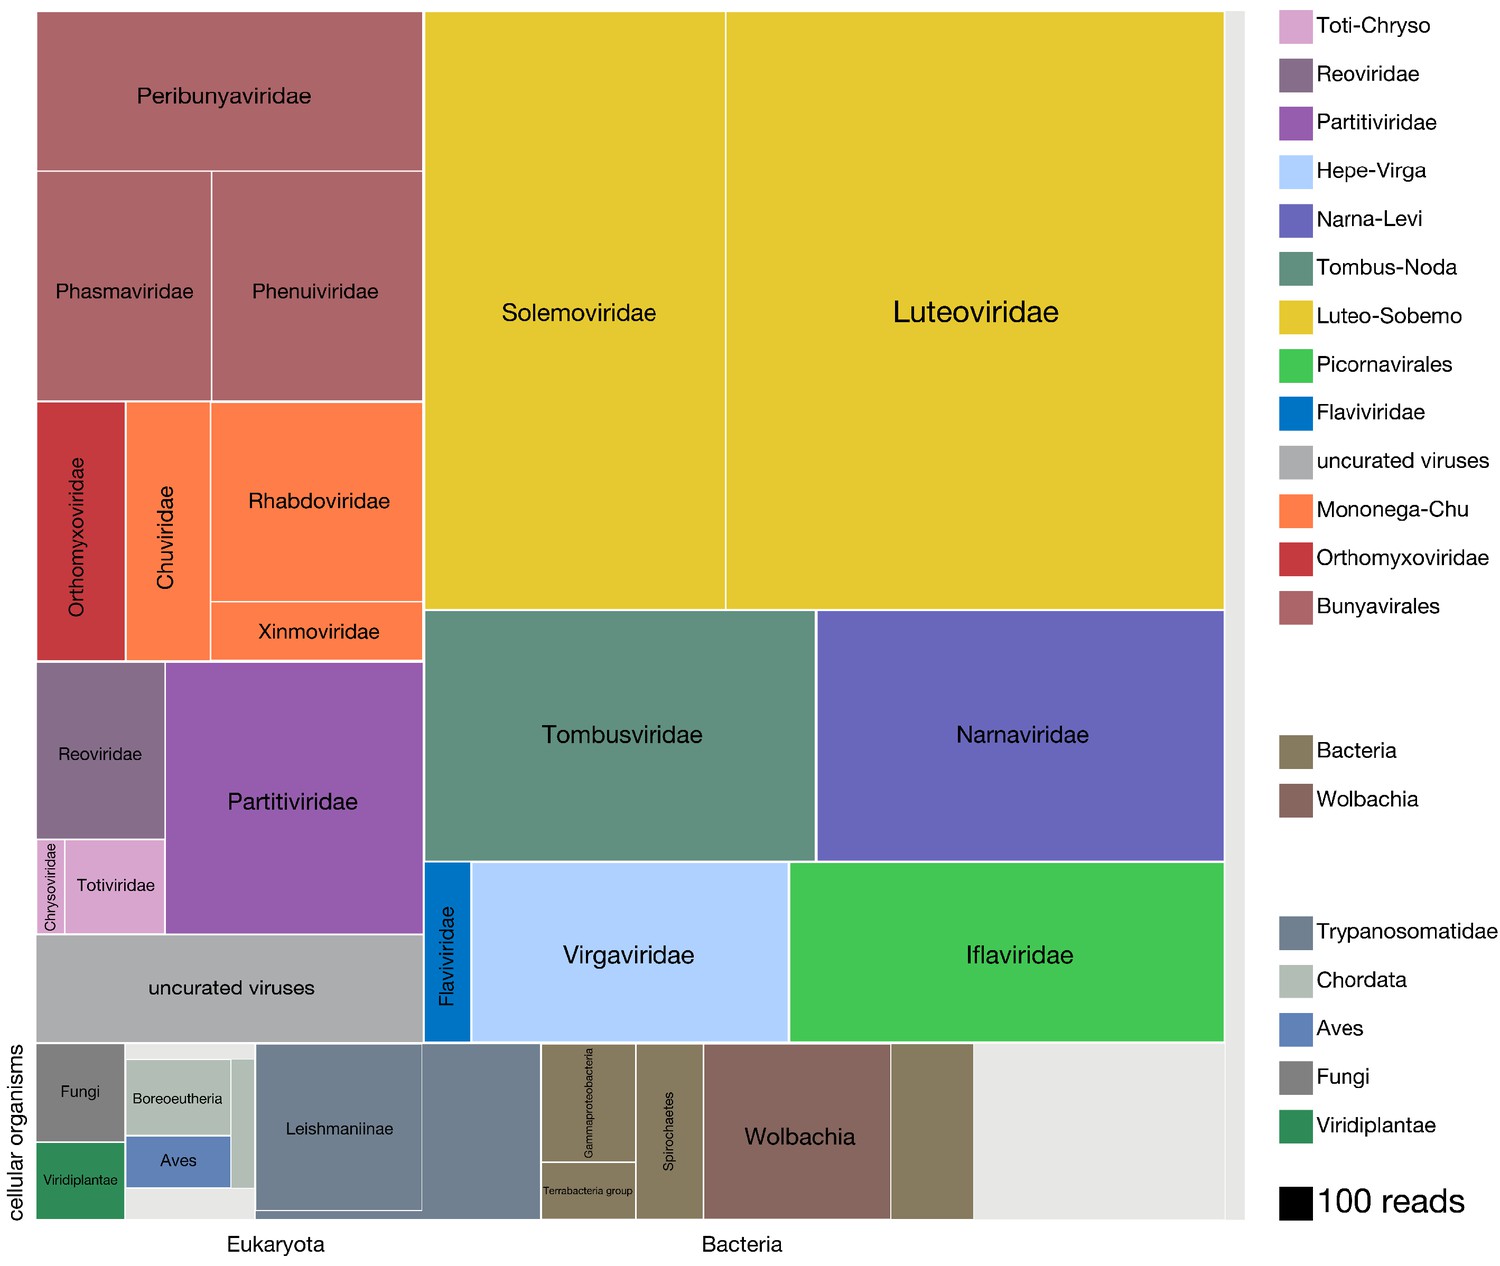
Viruses dominate the microbial signature of mosquitoes.
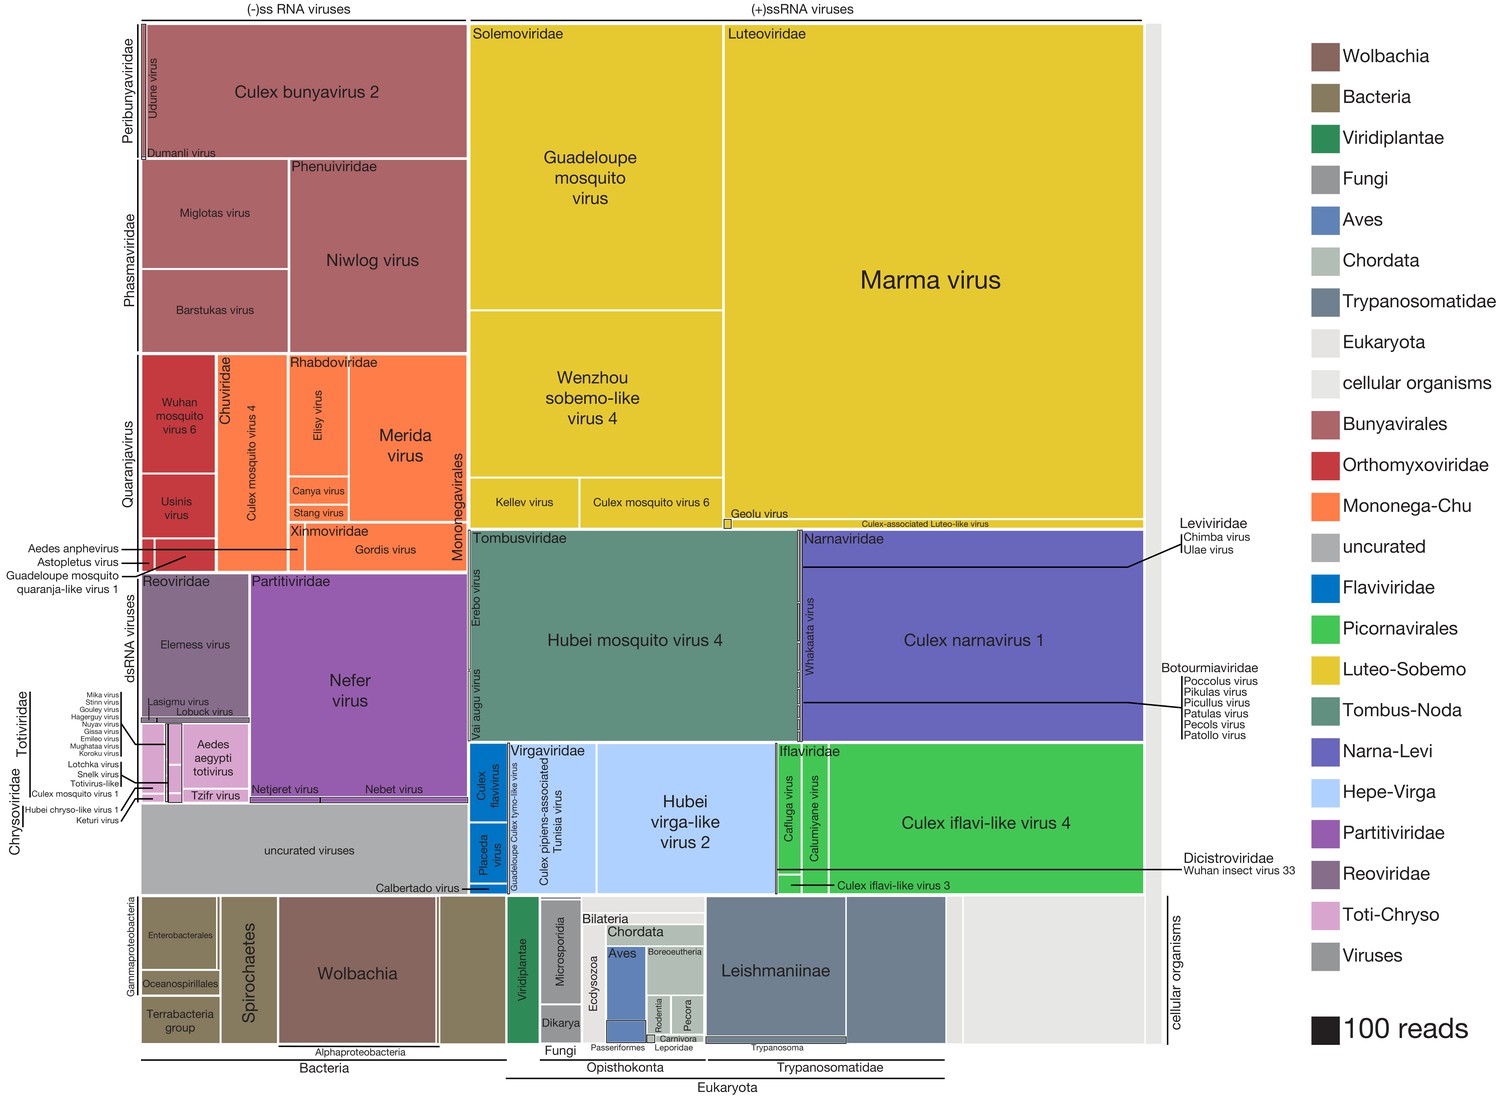
Treemap plot of the proportion of reads recovered among non-host contigs assembled from the 148 single mosquitoes, with viral taxa making up the top portion of the plot above ‘cellular organisms’ label at lower left edge of image, which designates reads assembled into contigs encompassing prokaryotic taxa, the eukaryotic taxa and the taxonomically ambiguous ‘cellular organisms’ that were not possible to assign to a higher resolution (light gray box). The block areas are plotted in proportion to the number of reads assembled into contigs that could be assigned to a given taxon (see area scale, legend). The gray block labeled ‘uncurated viruses’ corresponds to the number of reads assembled into contigs that were clearly viral in origin, but difficult to further resolve due to fragmented genomes and/or the lack of an associated RNA-dependent RNA polymerase.
-
Figure 2—source data 1
Detailed summary of sequences used for mosquito host reference.
- https://cdn.elifesciences.org/articles/68353/elife-68353-fig2-data1-v2.txt
Figure 2—figure supplement 1
Summary of single mosquito mNGS analysis pipeline with sequence recovery yields.
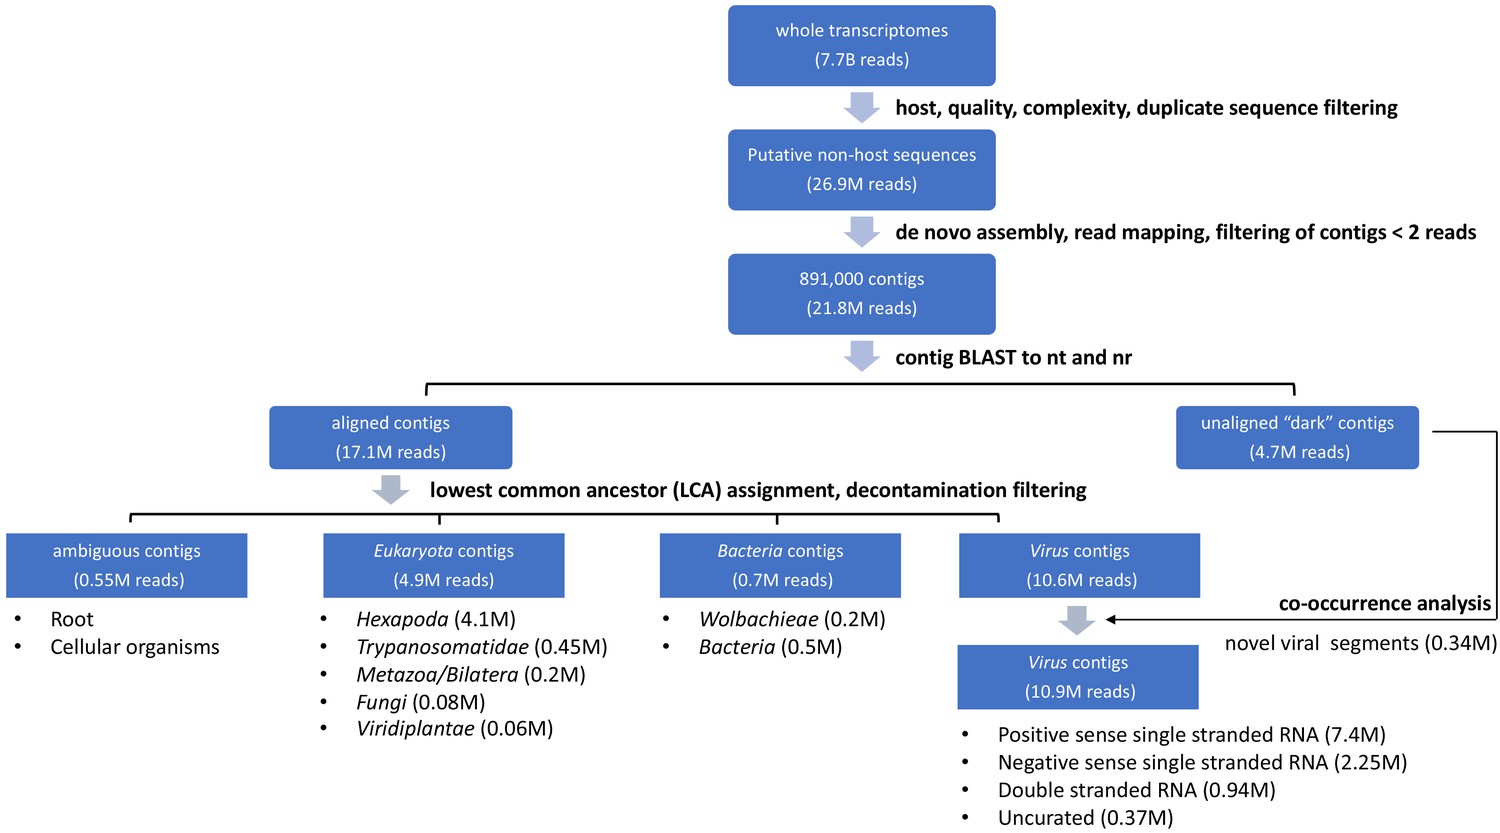
A set of 7.78 billion reads served as input transcriptome sequence data for analysis of the taxonomic distribution of 148 single mosquitoes sequenced in this study. We first filtered host, low quality, and low complexity sequences from each transcriptome dataset. A total set of 26.9 million reads passed all of these filters. A set of 891,00 contigs were de novo assembled from 21.8 million of these reads (81%). To classify and quantify the reads assembled into the contigs into viral, eukaryotic or prokaryotic taxa, we aligned each contig to the NCBI nucleotide and non-redundant protein databases. 17.1 million reads were assembled into contigs that yielded plausible BLAST alignments, while 4.7 million reads were assembled into contigs corresponding to metagenomic ‘dark matter’, that is contigs without recognizable homology to previously published sequence data. After lowest common ancestor analysis (LCA) and decontamination filtering (see Materials and methods for details), final contig assignments were assigned. Ambiguous contigs correspond to a class of 0.55M reads assembled into contigs that did not readily align to microbial species or plausible bloodmeal hosts. For eukaryotic and prokaryotic taxa, only a fraction of a genome was generally detected among contigs. Here, the LCA analysis was generally applied to infer the corresponding taxon assignments of non-host reads assembled into contigs. Within the 4.9 million reads identified as Eukaryota, 4.1 million reads contributed to contigs classified as Hexapoda. These likely correspond to mosquito host sequences too diverged from available mosquito genome reference sequences to be recognized at the initial host filtering step. Excluding these reads left 12.65 million reads assembled into contigs that were identifiable non-host reads. These were assigned to eukaryotes, bacteria, and viral species based on alignment as diagrammed in the flow chart. Recovery of complete or near complete genomes of RNA viruses facilitated viral taxonomic assignment directly from the BLAST results. We further curated contigs likely to code for viral RNA-dependent RNA polymerases (RdRps) and contigs that were physically unlinked but showed evidence of co-occurrence with viral RdRps (0.34M reads, labeled ‘co-occurrence analysis’, above; details in Materials and methods and manuscript text).
-
Figure 2—figure supplement 1—source data 1
Data underlying counts summarized in Figure 2—figure supplement 1.
- https://cdn.elifesciences.org/articles/68353/elife-68353-fig2-figsupp1-data1-v2.zip
Figure 2—figure supplement 2
Summary of all reads in each mosquito.
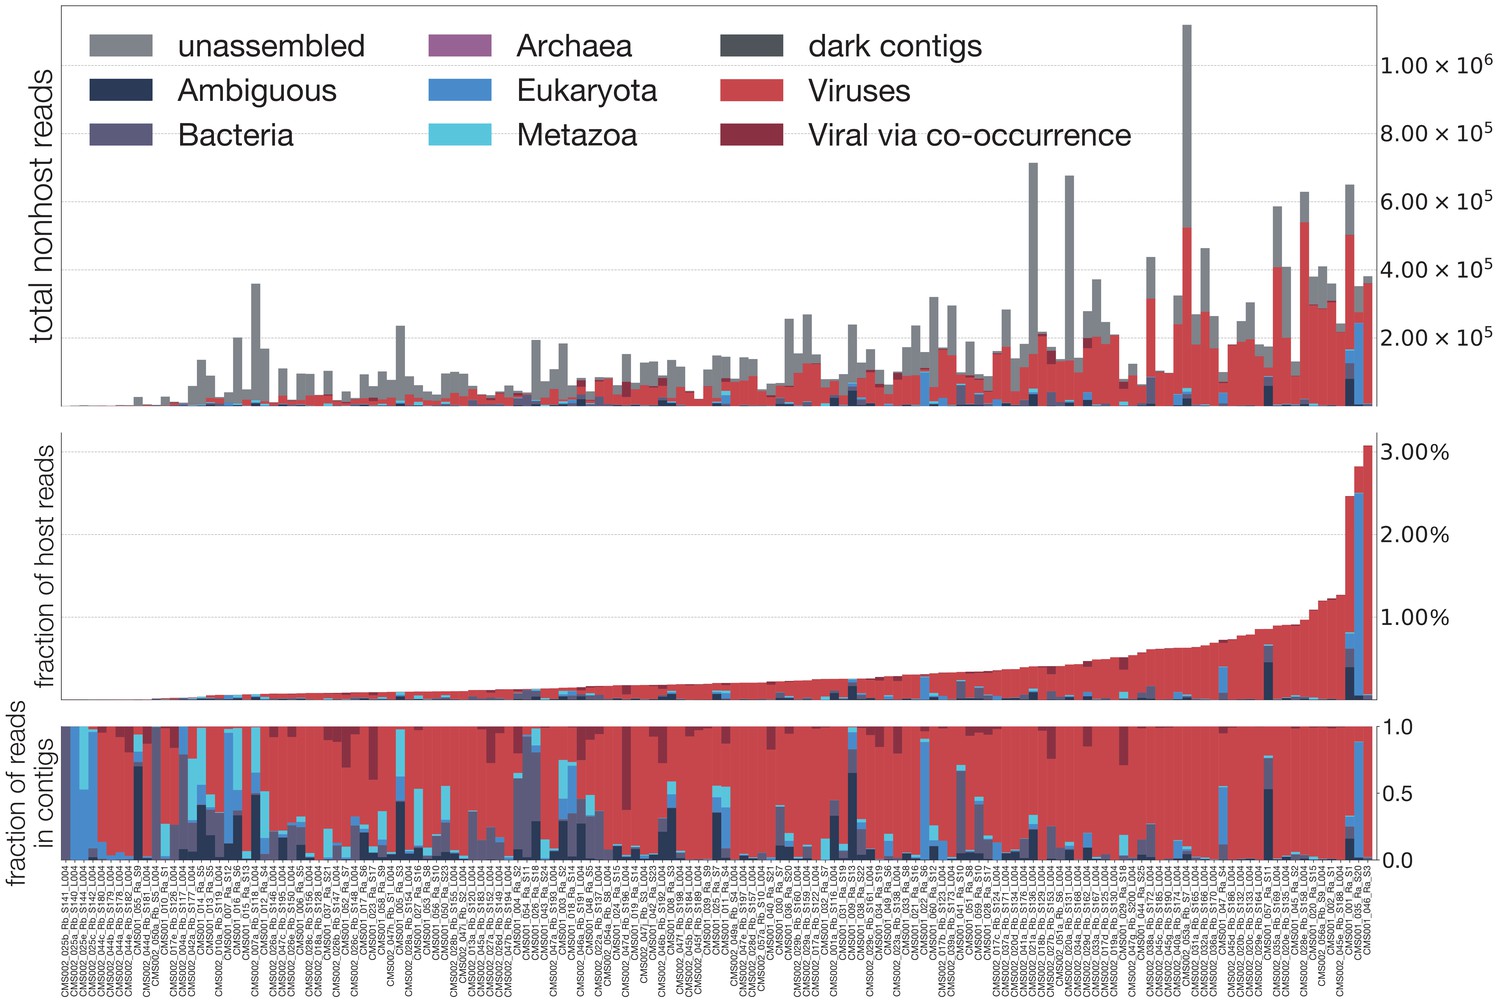
A breakdown of reads for each sample, into unassembled (those which did not assemble into contigs), dark (those which assembled but were not identifiable taxonomically), Ambiguous (those with LCA at root or cellular organisms), Bacteria, Archaea, Eukaryota, Metazoa, Viruses (via alignment to reference), and Viral via co-occurrence analysis (see Figure 6). Top panel is a stacked bar decomposing the total reads per sample. Middle panel shows the break-down scaled as a fraction of all reads in a sample. Bottom panel shows the fractional breakdown among assembled reads.
-
Figure 2—figure supplement 2—source data 1
Data underlying Figure 2—figure supplement 2.
- https://cdn.elifesciences.org/articles/68353/elife-68353-fig2-figsupp2-data1-v2.tsv
Figure 2—figure supplement 3
High-resolution breakdown the microbial signature of mosquitoes.
Shown is the read count distribution across non-host taxonomic groups detected among the set of 148 mosquitoes. Treemap overview of taxa detected among the assembled contigs are plotted in squares shaded according to taxon identity (legend) and sized according to number of reads supporting each contig (scaled as indicated, bottom right). Due to the uncertainty in prokaryotic and eukaryotic taxonomic assignments, cellular organisms are assigned to the lowest plausible taxonomic rank. Each distinct viral lineage is displayed as its own compartment. Reddish hues indicate negative-sense RNA viruses; purple hues indicate double-stranded RNA viruses; blue, green, and yellow hues indicate positive-sense RNA viruses. The ‘uncurated viruses’ box (light gray, lower left) indicates contigs that were clearly viral in origin but too fragmented and/or not associated with an RNA-dependent RNA polymerase.
-
Figure 2—figure supplement 3—source data 1
Data underlying Figure 2, and Figure 2—figure supplement 3.
- https://cdn.elifesciences.org/articles/68353/elife-68353-fig2-figsupp3-data1-v2.tsv
Figure 2—figure supplement 4
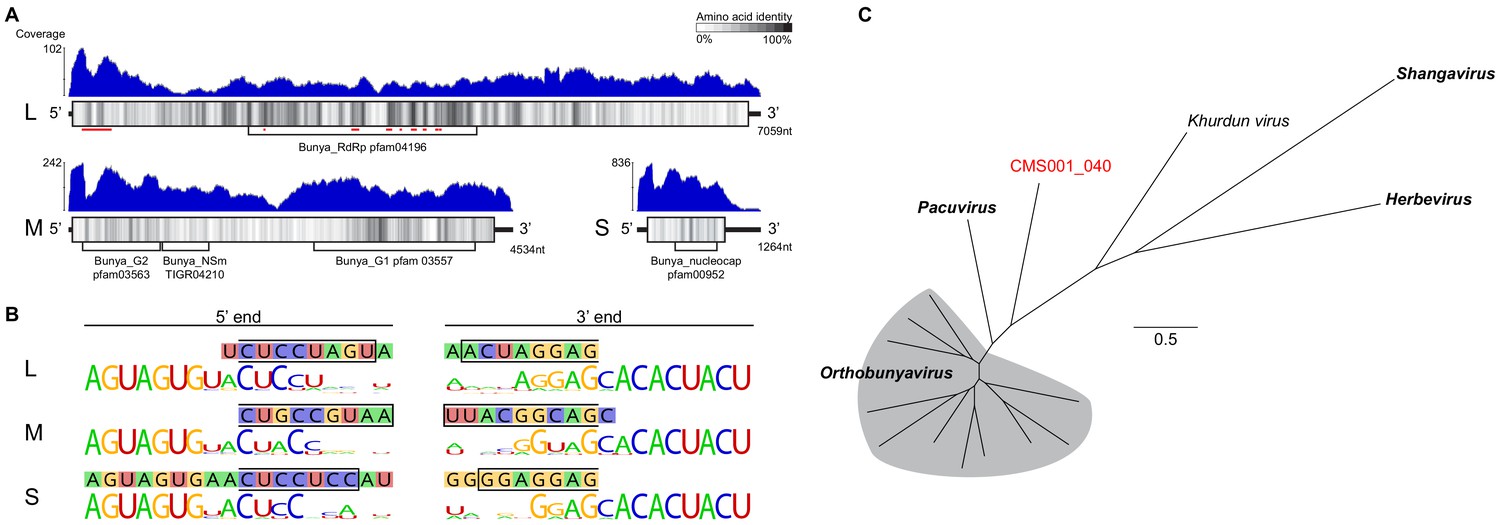
Analysis of novel peribunya-like virus showing completes of genome recovery.
(A) Read coverage in blue across the length of each genome segment. Diagrams of genome segments display the longest ORF and indicate amino acid identity with a sliding window of 15 amino acids. Regions of homology to known domains are indicated by Pfam labels, and on the L segment, the locations of canonical RdRp motifs are indicated by red underlining. (B) Ends of the assembled contigs are shown (sequence in 1lled boxes). Regions complementary between 5’ and 3’ end for each segment are indicated by a black outline. These contig ends were aligned to the conserved end sequences of orthobunya and nearby peribunya viruses (logo diagram shows conservation after alignment of reference sequences). (C) Maximum likelihood phylogenetic tree with representative orthobunyaviruses and nearby peribunyaviruses.
-
Figure 2—figure supplement 4—source data 1
Underlying data for Figure 2—figure supplement 4.
- https://cdn.elifesciences.org/articles/68353/elife-68353-fig2-figsupp4-data1-v2.zip
Figure 3 with 1 supplement
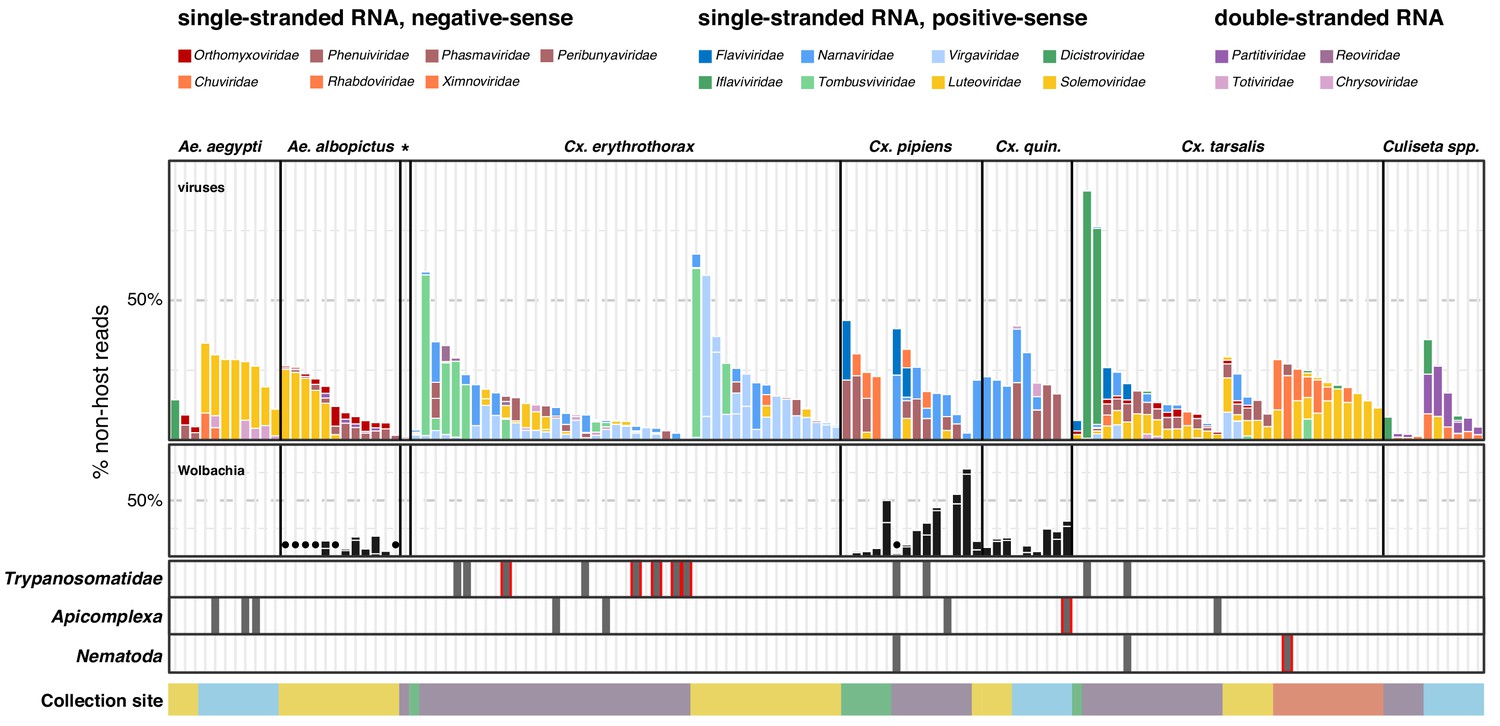
Single mosquito sequencing reveals the heterogeneity of microbiota between individuals, species and locations.
Plotted bars report the proportions of non-host reads from individual mosquitoes that are supported by >1% of non-host reads corresponding to assembled contigs identified as viruses (top panel), Wolbachia (middle panel), and selected eukaryotic microbes (bottom panel). Species are color coded as indicated in the legend (top of graph). Plotted symbols on the Wolbachia and eukaryotic panels indicate microbes confidently identified, but present at <1% of non-host reads middle panel, black circles = Wolbachia taxa; bottom panels, gray bars are plotted in samples with Trypanosomatidae, Apicomplexa or Nematoda taxa; gray bars outlined in red indicate detection of these taxa at >1% of non-host reads. Samples were clustered by mosquito species (top labels) and ordered by: (i) collection site location from north to south (indicated at the bottom, colored as in Figure 1) and (ii) viral abundance (descending order, left to right).
-
Figure 3—source data 1
Underlying virus data for Figure 3.
- https://cdn.elifesciences.org/articles/68353/elife-68353-fig3-data1-v2.tsv
-
Figure 3—source data 2
Underlying bacteria data for Figure 3.
- https://cdn.elifesciences.org/articles/68353/elife-68353-fig3-data2-v2.tsv
-
Figure 3—source data 3
Underlying eukaryotic data for Figure 3.
- https://cdn.elifesciences.org/articles/68353/elife-68353-fig3-data3-v2.tsv
Figure 3—figure supplement 1
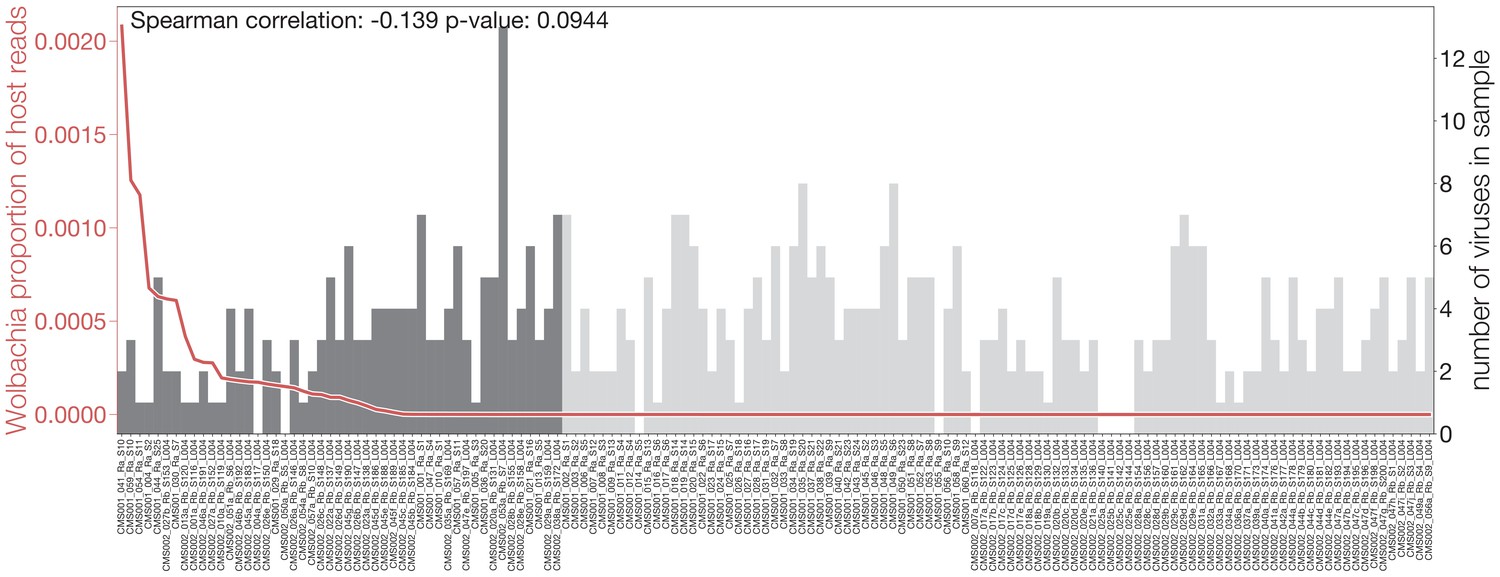
Evidence for a potential interplay between Wolbachia and viral infections.
Number of viruses found in each sample (gray bars), sorted by number of Wolbachia reads present (red line). Vertical dotted lines indicate the p-value of a Kruskal-Wallis test when comparing the number of viruses found in samples on the left and right of the Wolbachia read cutoff.
Figure 4
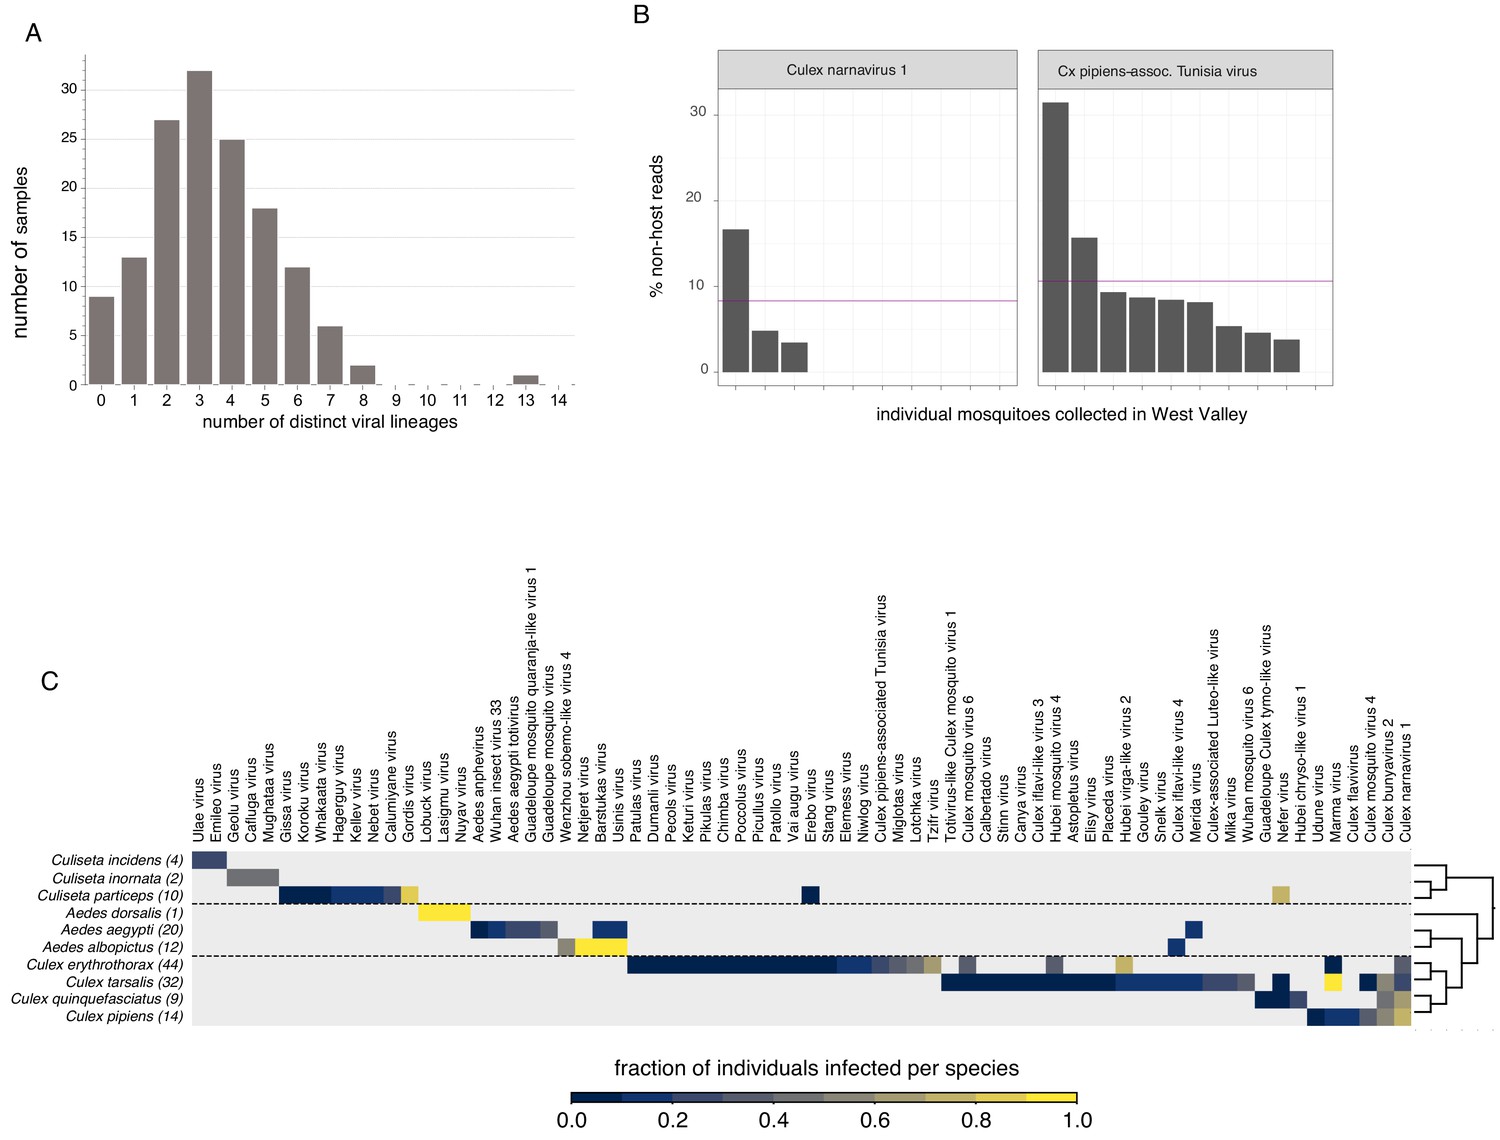
Quantifying viral diversity in and prevalence among single mosquitoes.
(A) Distribution of mosquitoes within the study in which no, one, or multiple viral lineages were detectable. The sample with 13 distinct viral lineages is sample CMS002_053a that contains six Botourmia-like viruses thought to primarily infect fungi and in which evidence of an ergot fungus was detected. (B) An example of viruses with similar bulk abundance, but different prevalence. Both Culex narnavirus one and Culex pipiens-associated Tunisia virus were found among the 10 Culex erythrothorax mosquitoes collected at the same collection site in West Valley. The bulk abundances were calculated by the mean % non-host reads averaged across the 10 mosquitoes for Culex narnavirus one and Culex pipiens-associated Tunisia virus were 8.3% and 10.6%, respectively (as indicated by the red line). However, the prevalence (i.e. the percent of single mosquitos carrying the virus) was markedly different (C). Global analysis of viral prevalence measured in this study. For each virus, the fraction of individuals infected within each species was calculated, shown on a color scale. Mosquito species arranged according to a phylogeny based on the cytochrome c oxidase subunit I (COI) gene.
-
Figure 4—source data 1
Data underlying Figure 4, panel A (coinfection plot).
- https://cdn.elifesciences.org/articles/68353/elife-68353-fig4-data1-v2.tsv
-
Figure 4—source data 2
Data underlying Figure 4, panel B (prevalence-abundance plot).
- https://cdn.elifesciences.org/articles/68353/elife-68353-fig4-data2-v2.tsv
-
Figure 4—source data 3
Data underlying Figure 4, panel C (mosquito - virus species plot).
- https://cdn.elifesciences.org/articles/68353/elife-68353-fig4-data3-v2.tsv
Figure 5
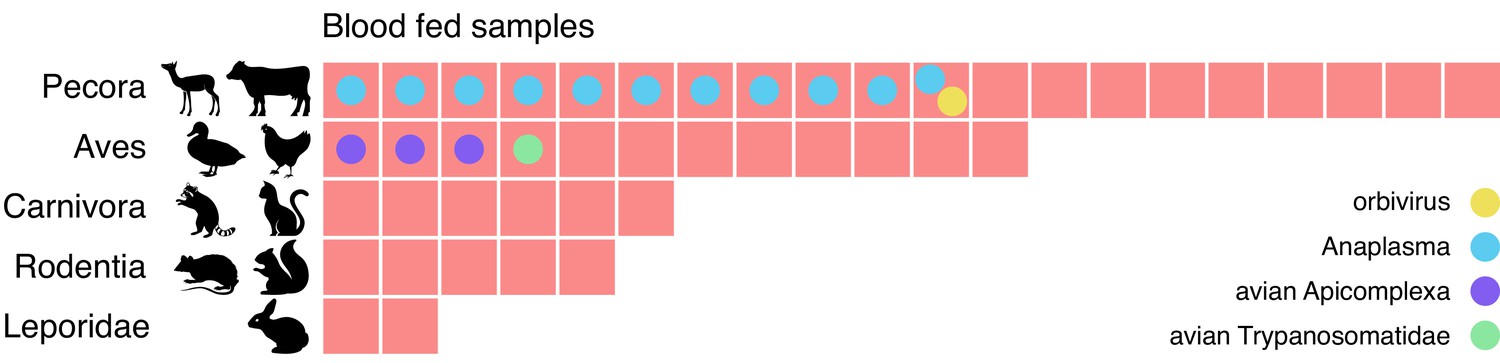
Metagenomic identification of sources of blood meals in individual mosquitos.
Consensus taxonomic calls of vertebrate contigs for 45 of 60 blood fed mosquitoes collected in Alameda County. The remaining 15 samples had no vertebrate contigs. Red blocks represent individual mosquito samples; colored circles represent co-occurring contigs matching Orbivirus, Anaplasma, Avian Apicomplexa and Avian Trypanosomatidae representing possible bloodborne pathogens of the blood meal host.
-
Figure 5—source data 1
Data underlying Figure 5 blood meal sources.
- https://cdn.elifesciences.org/articles/68353/elife-68353-fig5-data1-v2.csv
-
Figure 5—source data 2
Data underlying Figure 5 microbe calls.
- https://cdn.elifesciences.org/articles/68353/elife-68353-fig5-data2-v2.tsv
-
Figure 5—source data 3
Data underlying Figure 5 virus and eukaryote calls.
- https://cdn.elifesciences.org/articles/68353/elife-68353-fig5-data3-v2.xlsx
Figure 6 with 5 supplements
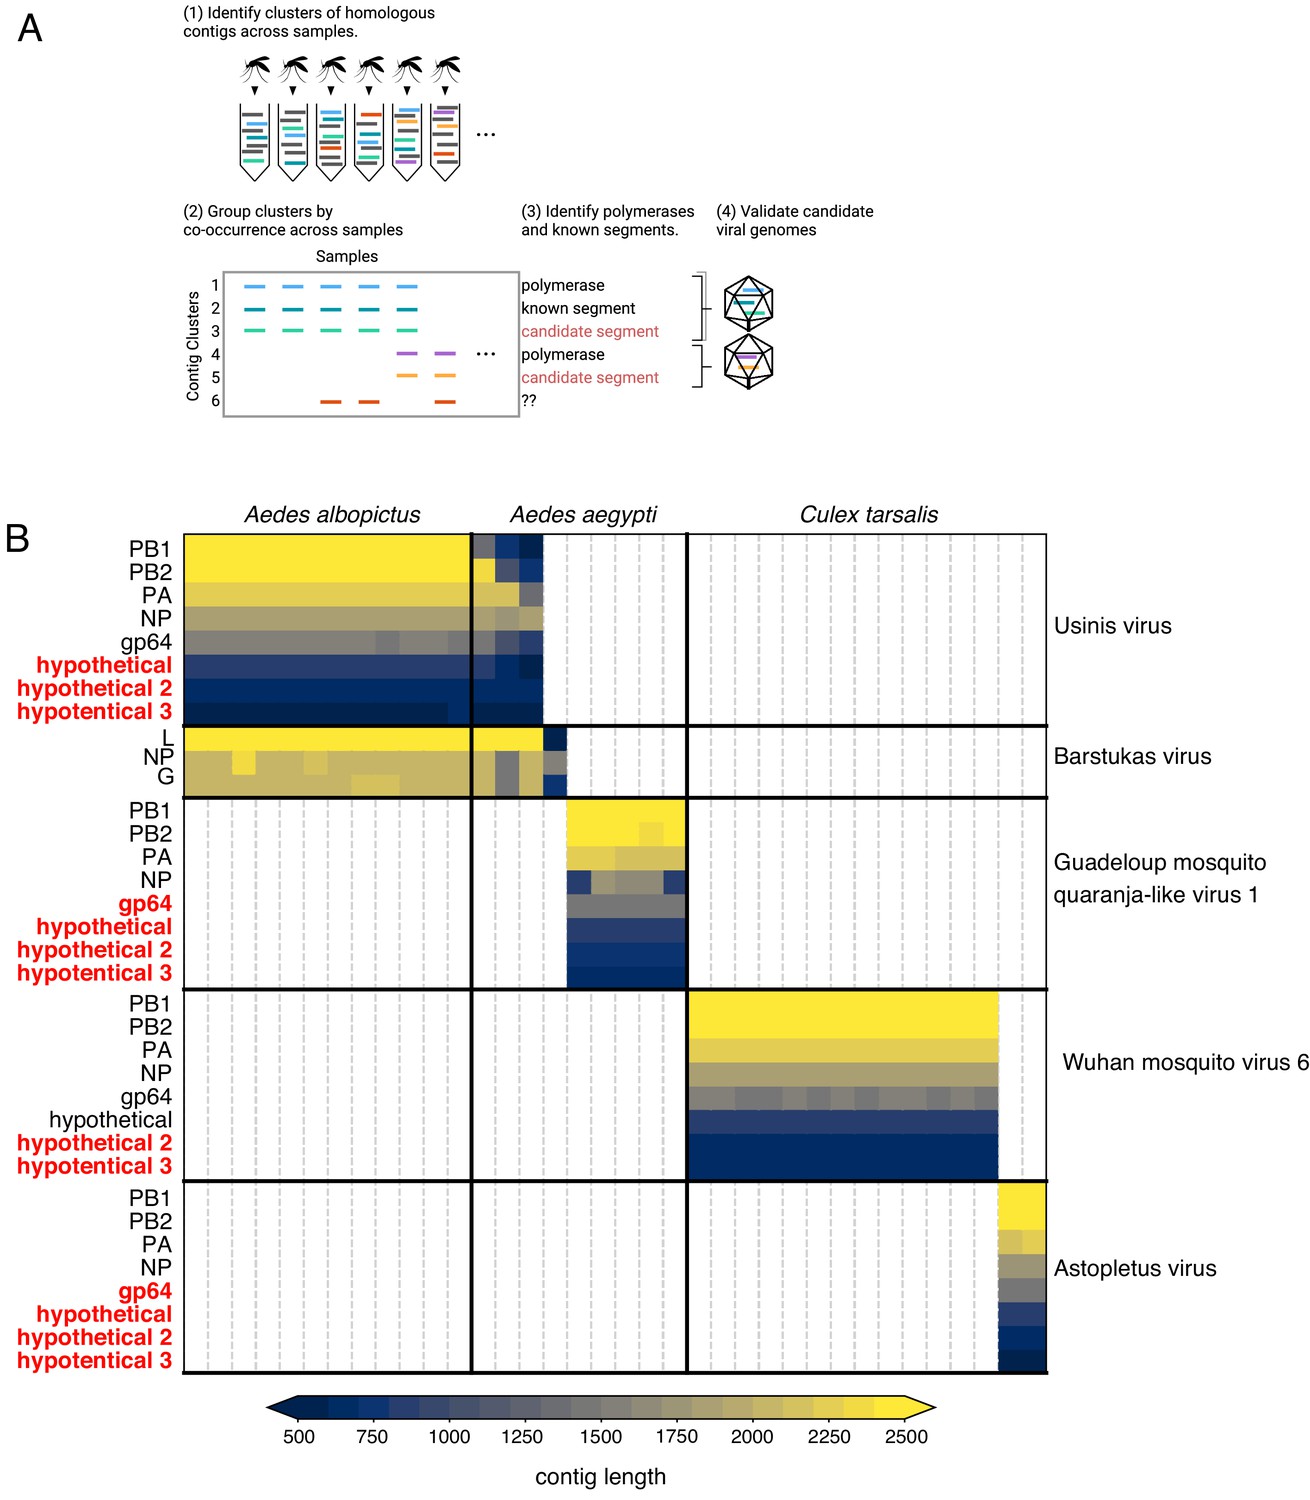
Bringing viral genomic dark matter into the light through single mosquito next generation metagenomic sequencing.
(A) Previously unrecognized viral genome segments were identified among unaligned ‘dark matter’ contigs using co-occurrence analysis, which assumes that all segments of a segmented virus will co-occur in the samples where that virus is present and be absent in samples where the virus is absent. (B) Matrix of contigs derived from four distinct Orthomyxoviruses and one Phasma-like virus that were detected via their distinct co-occurrence pattern across mosquitoes. Rows are clusters of highly similar (99% identity) contigs and columns are individual mosquito samples. Light gray vertical lines delineate mosquito samples, dark black vertical lines indicate boundaries between mosquito species of each sample. Dark horizontal lines delineate segments comprising viral genomes. Labels on the right indicate viruses, with genomes delineated by horizontal lines. Guadeloupe mosquito quaranja-like virus one and Wuhan mosquito virus six were previously described and Ūsinis, Barstukas and Astopletus were named here. At left, plain text indicates putative labels for homologous clusters; black text indicates segments identifiable via homology (BLASTx) and red text indicates contig clusters that co-occur with identifiable segments but themselves have no identifiable homology to anything in GenBank. The Phasma-like Barstukas virus exhibits a nearly perfect overlap with Ūsinis virus (except for one sample in which Ūsinis was not found) but is identifiable as a Bunya-like virus due to having a three-segmented genome with recognizable homology across all segments to other Phasma-like viruses. Cells are colored by contig lengths (see color scale legend), highlighting their consistency which is expected of genuine segments. Deviations in detected contig lengths (e.g. Aedes aegypti samples that harbor shorter Ūsinis virus genome segments) reflect the presence of partial or fragmented contig assemblies in some of the samples.
-
Figure 6—source data 1
Data underlying Figure 6, panel B.
- https://cdn.elifesciences.org/articles/68353/elife-68353-fig6-data1-v2.tsv
Figure 6—figure supplement 1
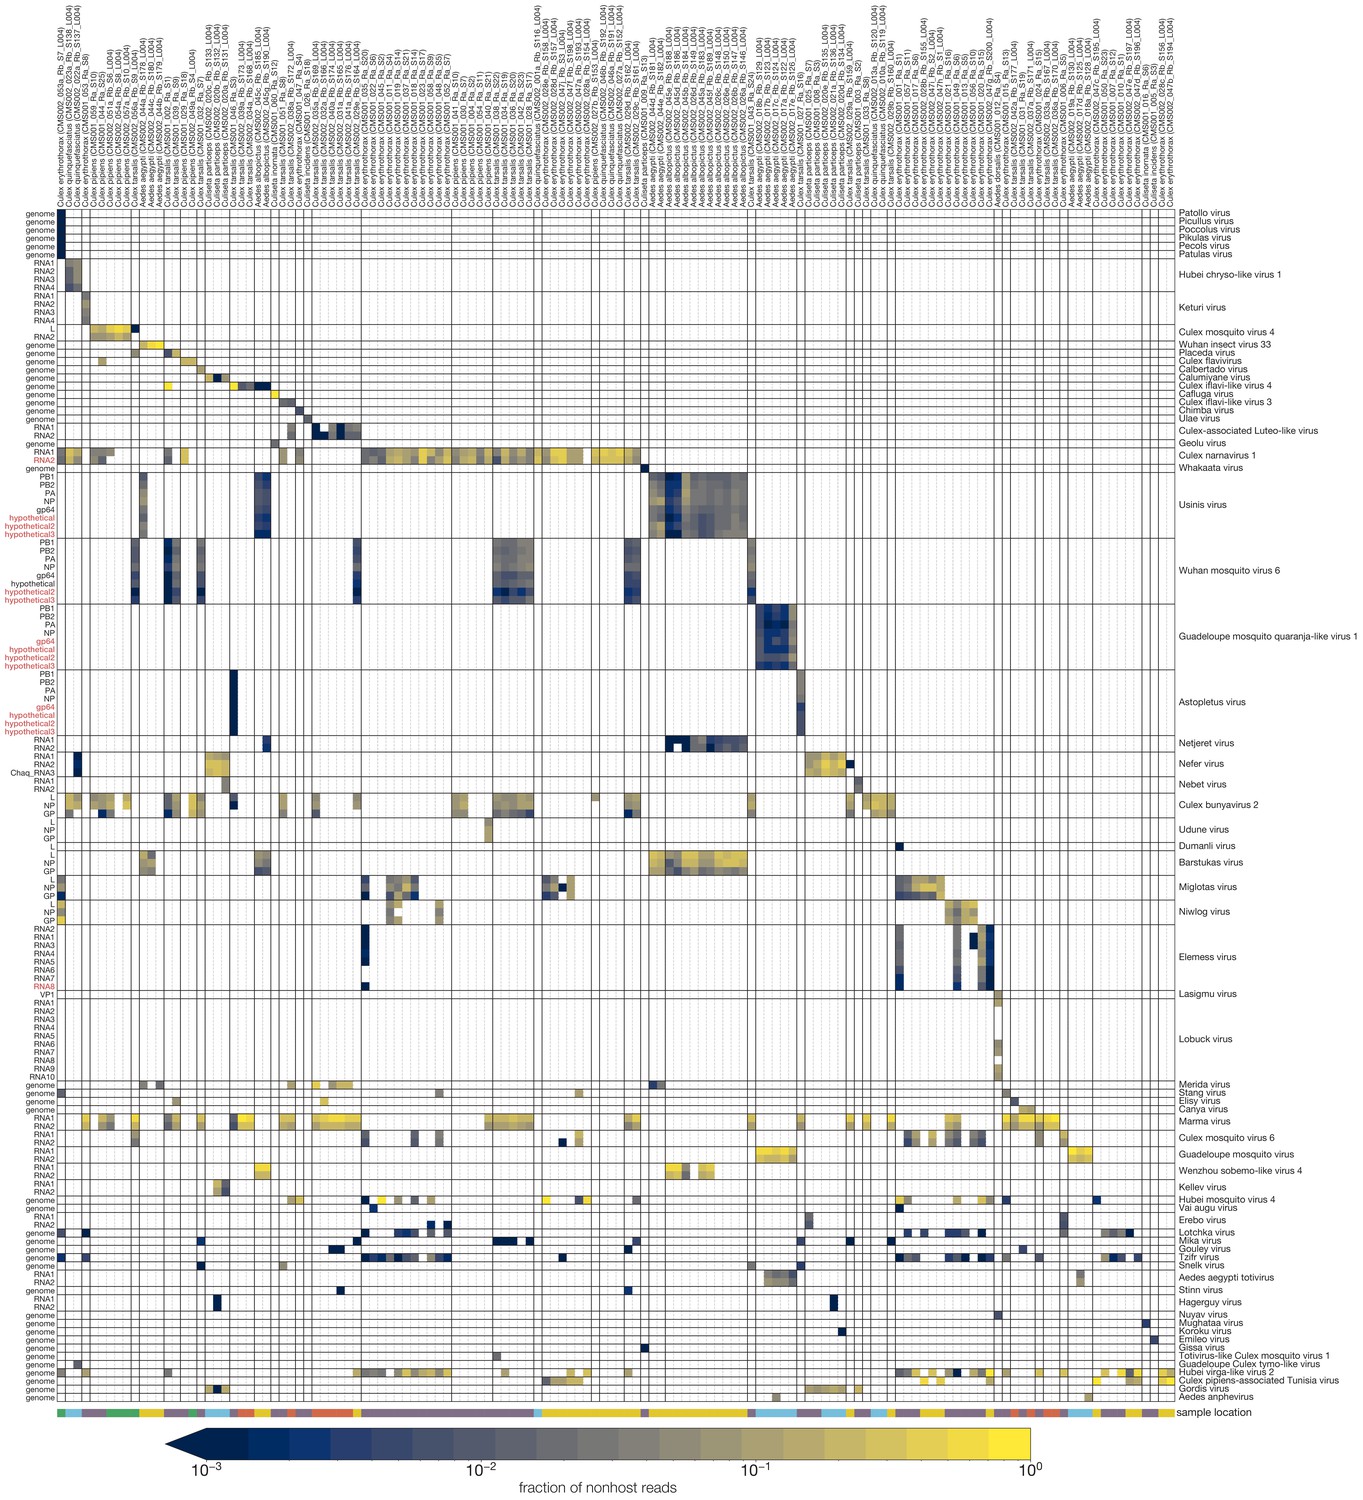
Identifying novel RNA segments in the ‘dark matter’ by co-occurrence.
Rows indicate groups of contigs clustered based on nucleotide identity (>99%). Rows labeled in black text correspond to contigs within a cluster that were recognizable by blast alignment; red indicate putative segments identified from the pool of ‘dark matter’ contigs. Columns are samples with computed mosquito species indicated. Cells are colored by the fraction of non-host reads in the sample with color bar legend at the bottom. Clusters of rows likely comprising a single genome are separated from other such putative genomes by black horizontal lines with identified or proposed virus names. Black vertical lines delineate blocks of neighboring samples with the same computed mosquito species. Sampling locations are indicated by colored rectangles at the bottom edge of the plot, above the color bar legend.
-
Figure 6—figure supplement 1—source data 1
Data underlying Figure 6—figure supplement 1.
- https://cdn.elifesciences.org/articles/68353/elife-68353-fig6-figsupp1-data1-v2.xlsx
-
Figure 6—figure supplement 1—source data 2
Data underlying read fractions plotted in Figure 6—figure supplement 1.
- https://cdn.elifesciences.org/articles/68353/elife-68353-fig6-figsupp1-data2-v2.tsv
Figure 6—figure supplement 2
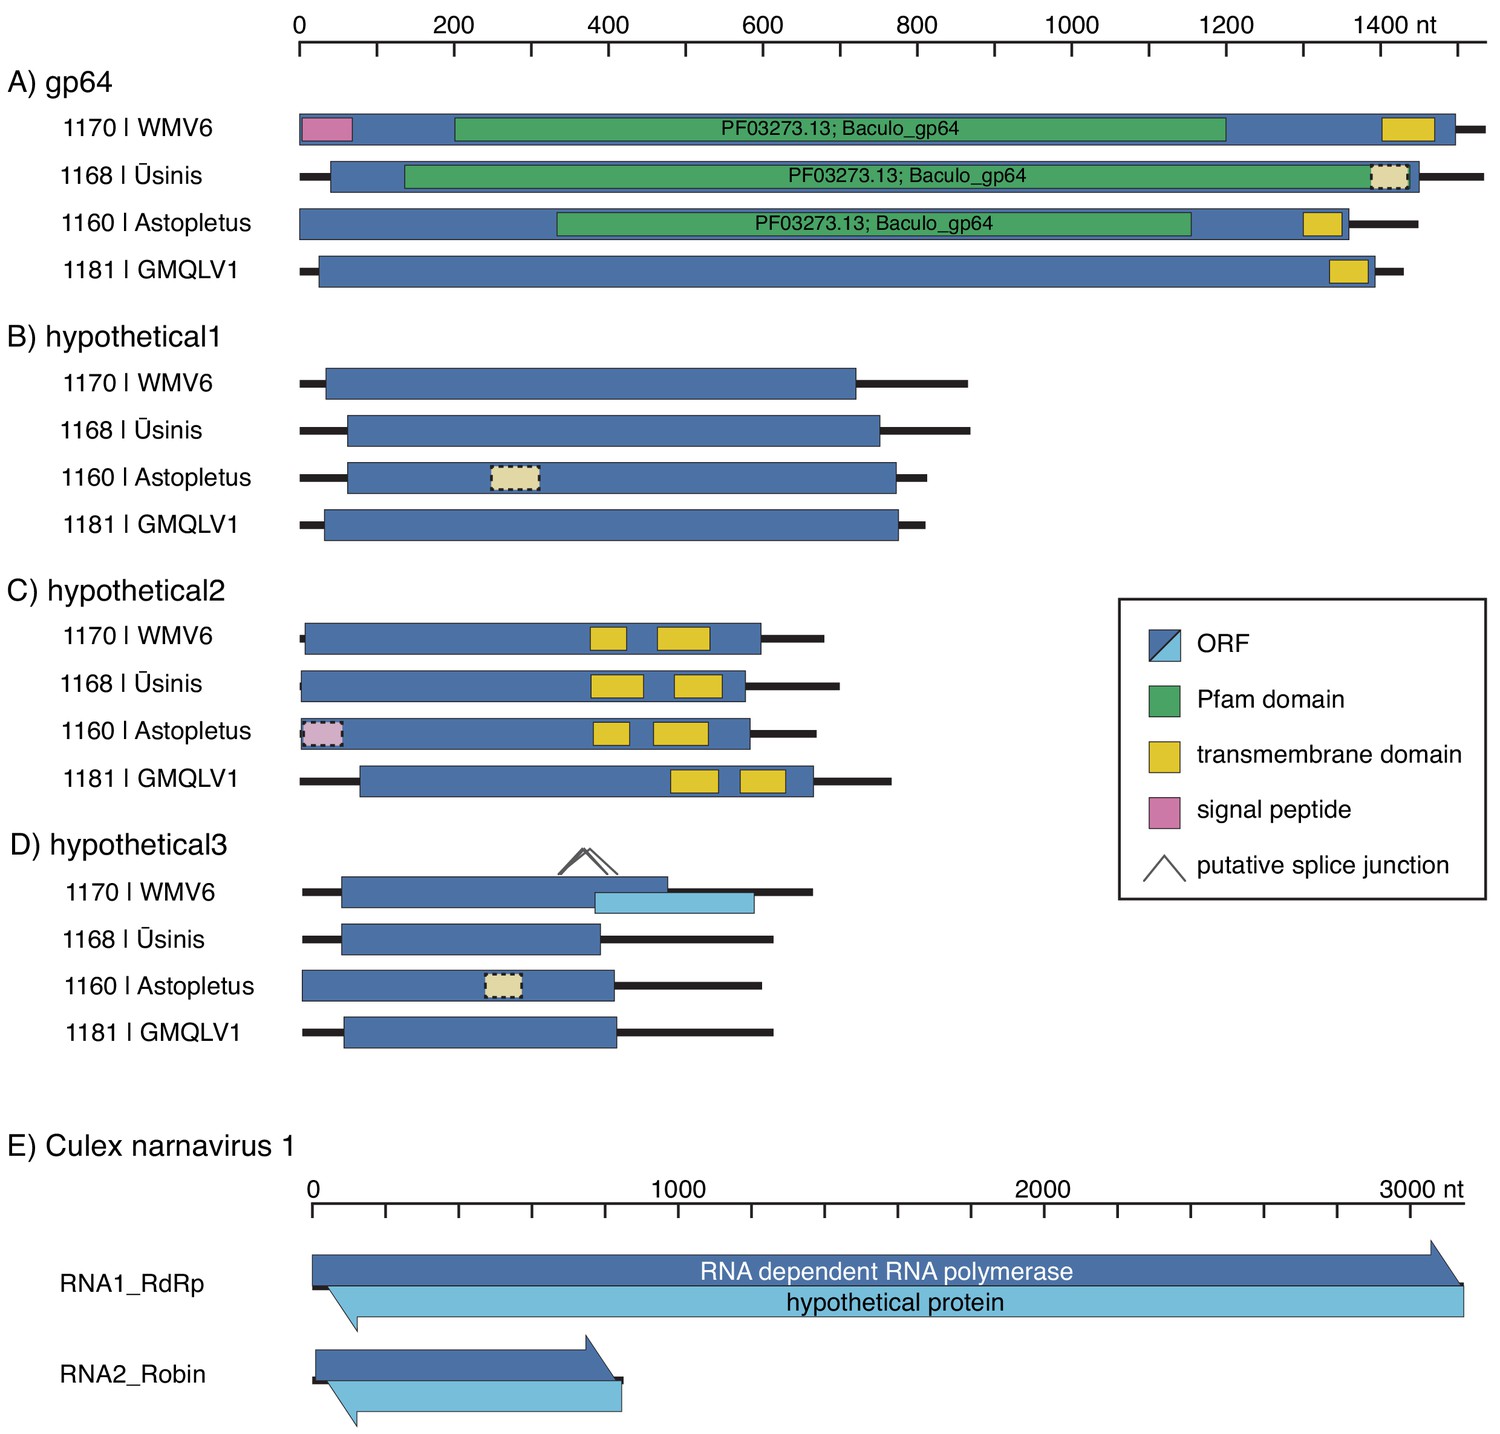
Co-occurrence in individual mosquitoes allows identification of novel RNA genome segments in mosquito-borne viruses.
Diagrams of newly discovered genome segments for quaranjaviruses identified in this study, including Wuhan Mosquito Virus 6 (WMV6), Usinis, Astopletus, and Guadeloupe Mosquito, Quaranja-Like Virus 1 (GMQLV1) (panels A-D, respectively), and Culex narnavirus 1 (panel E), are shown (displayed 5’ to 3’, left to right, not aligned to each other). (A–D) The longest ORFs of the new quaranjavirus segments were analyzed for the presence of transmembrane domains and similarity to known domains (see Materials and methods for details). Weaker support for these predictions is indicated by lighter color and dashed border. In the hypothetical 3 segment of WMV6, putative splicing events could result in a jump to a frameshifted ORF, which would substantially increase the coding region of the segment. (E) In both segments of the Culex narnavirus 1, long uninterrupted ORFs are found on both RNA strands (arrowheads indicate 5’ to 3’ direction), and in each case the codon boundaries are aligned.
Figure 6—figure supplement 3
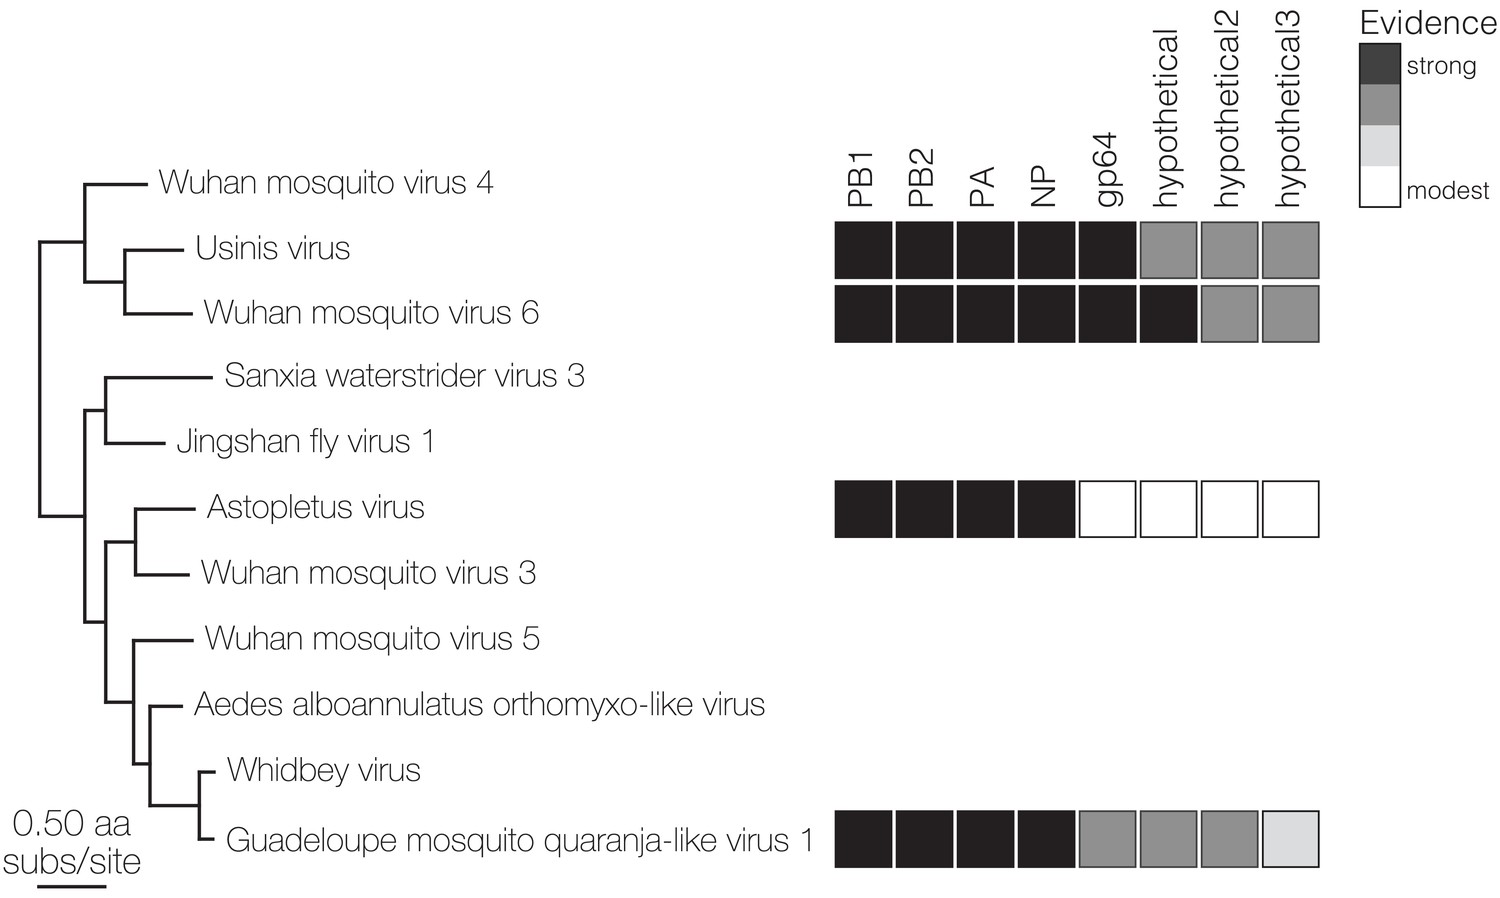
RdRp-based maximum likelihood tree spanning the quaranjaviruses in this study for which eight segments were recovered.
The eight boxes in the graphic to the right of the tree correspond to each of these eight genome segments, which are labeled at top right. Levels of evidence for the existence of each segment is highlighted by a grayscale shading of the segment boxes, ranging from strong (black) to modest (white), based on: homology to BLAST hits from NCBI nt/nr database (black); assembly of contigs > 500 nt from SRA samples containing the RdRp, or co-occurrence in >10 samples in our data (dark gray); reads mapping from SRA and co-occurrence in five samples in our data (light gray); or co-occurrence in <5 samples and shared protein domains (white).
-
Figure 6—figure supplement 3—source data 1
Data underlying Figure 6—figure supplement 3.
- https://cdn.elifesciences.org/articles/68353/elife-68353-fig6-figsupp3-data1-v2.newick
Figure 6—figure supplement 4
Co-occurrence analysis enables identification of novel second narnavirus ambigrammatic RNA segment.
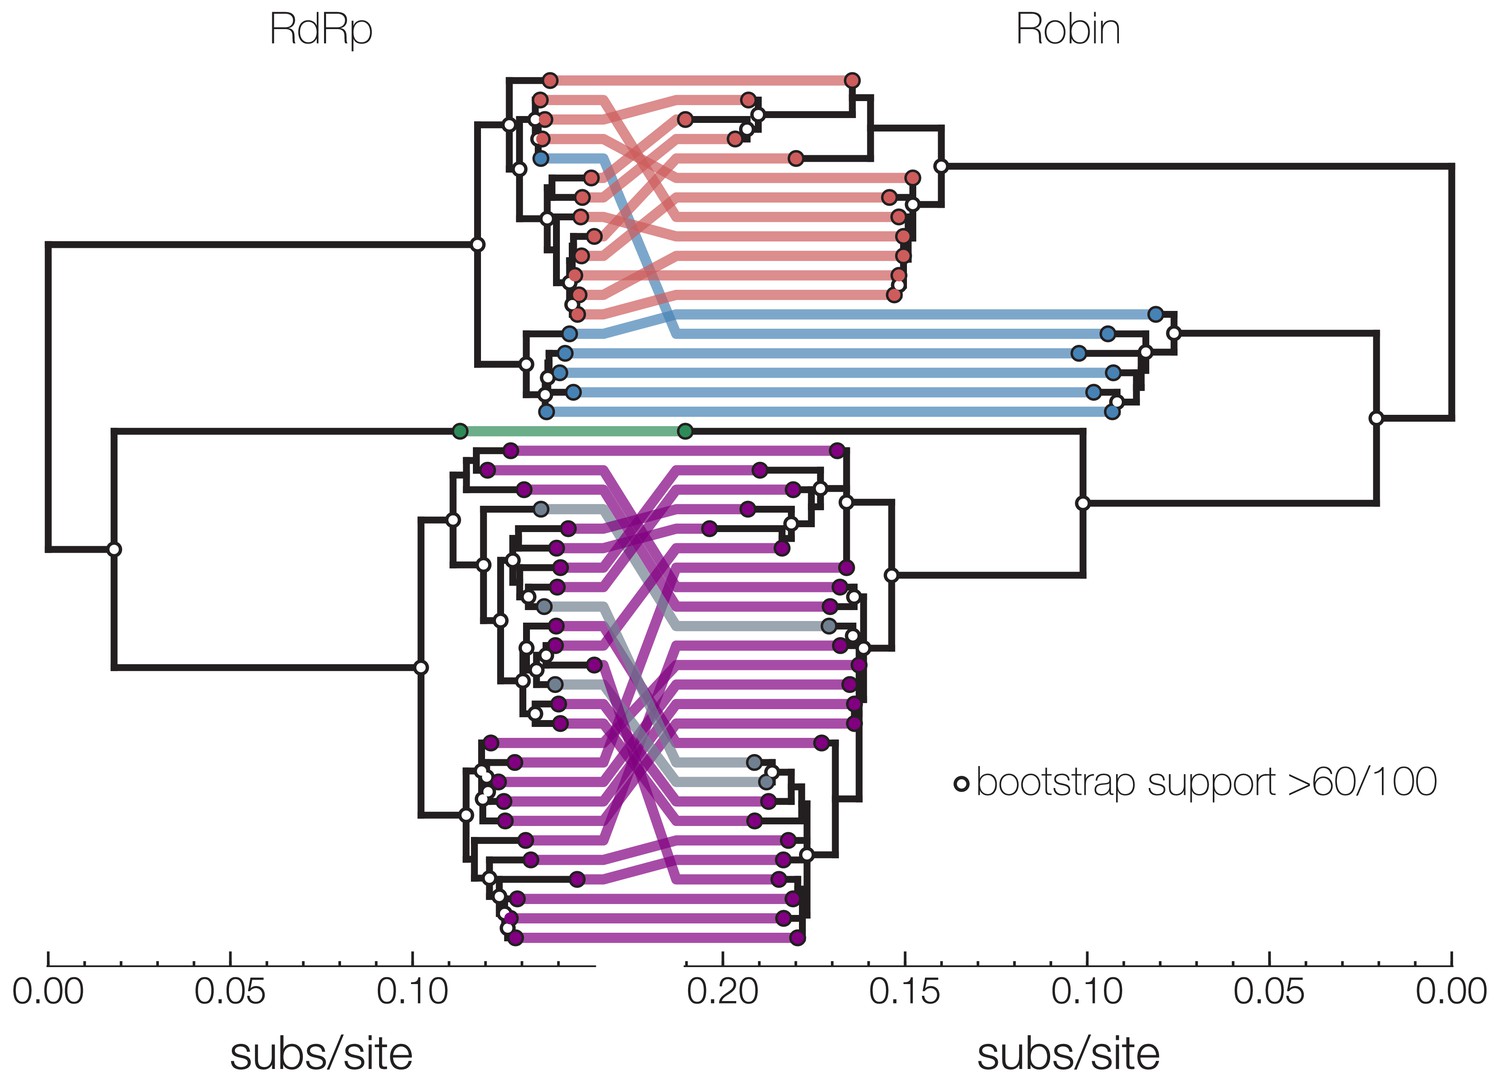
Narnavirus Robin segment. tanglegram shows two midpoint rooted nucleotide phylogenies of Culex narnavirus 1 – RdRp segment on left and Robin segment on right. Tips are colored based on visual presence of clusters on longer branches – clusters in red, blue, green, and purple are sequences reported in this study. Gray tips in the RdRp phylogeny were published by other studies, and their Robin segment counterpart was assembled here from corresponding SRA entries. Reassortment between the two segments is largely restricted to lineages within clusters, but reassortment also took place in either the red or the blue lineage. One possibility is a replacement of a red/blue lineage RdRp with a blue/red lineage or a replacement of red Robin with a diverged and unsampled lineage. White dots on nodes indicate bootstrap support >60 out of 100 replicates. Scale at the bottom of each tree is nucleotide substitutions per site.
-
Figure 6—figure supplement 4—source data 1
Data underlying Figure 6—figure supplement 4.
- https://cdn.elifesciences.org/articles/68353/elife-68353-fig6-figsupp4-data1-v2.zip
Figure 6—figure supplement 5
Investigation of co-occurrences of narnaviruses and fungi in mosquitoes.
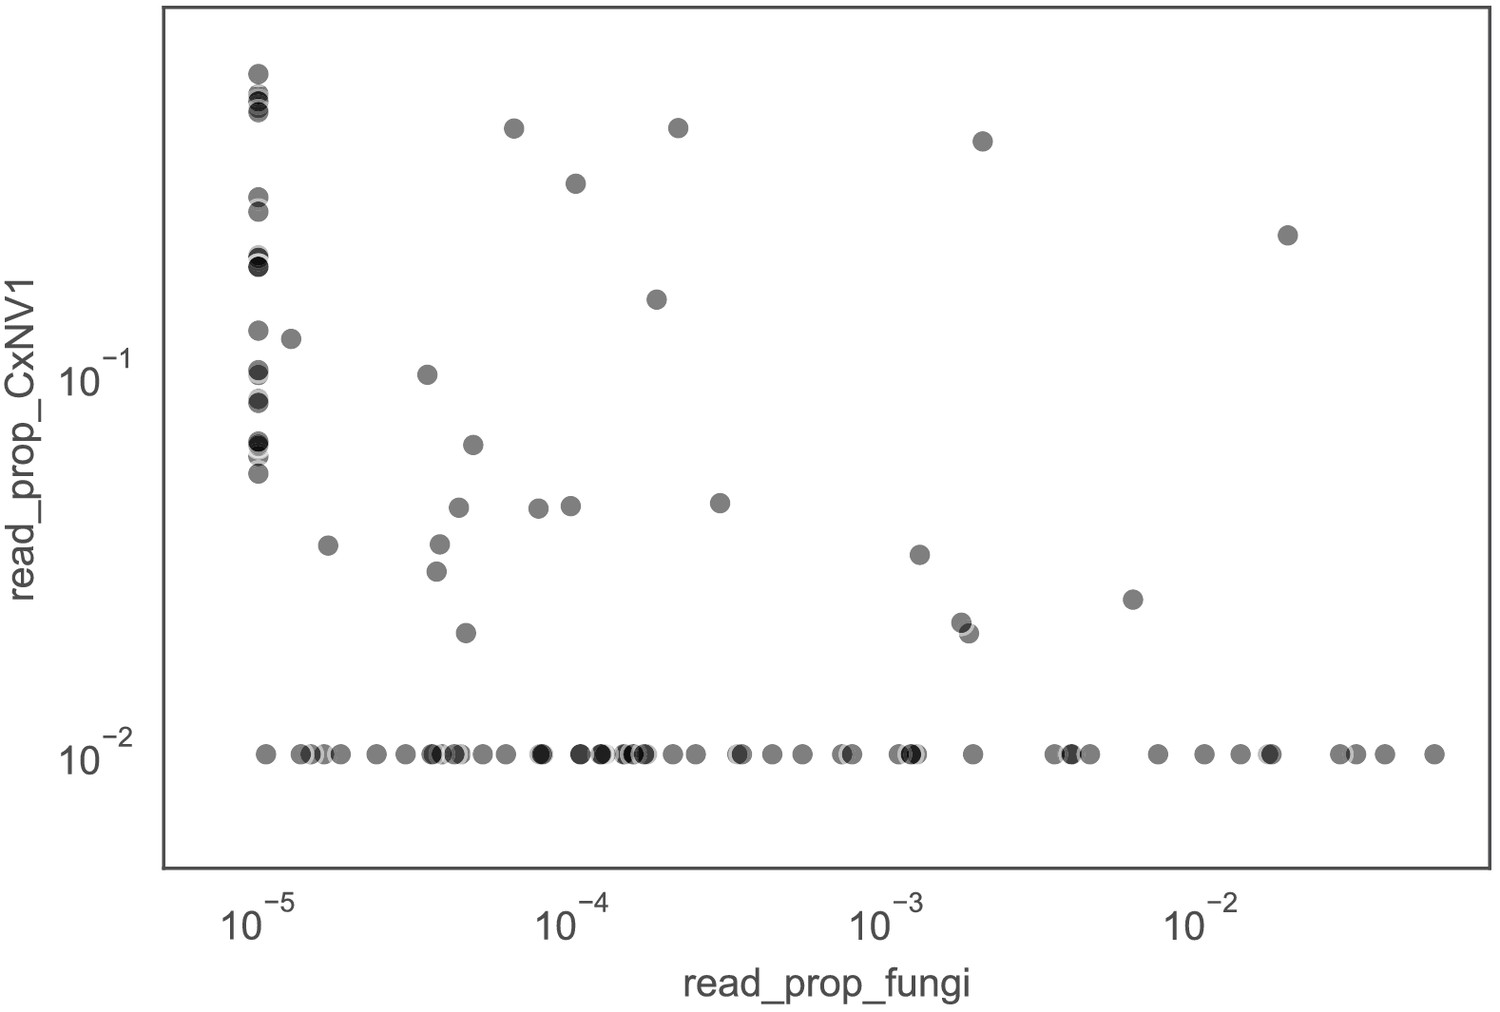
Proportion of non-host reads mapped to contigs of Culex narnavirus 1 (CxNV1) versus proportion of non-host reads mapped to contigs of any fungus. The lack of correlation argues against an indirect infection of fungi by the narnavirus. Each point represents a single mosquito. For visualization purposes, values of zero are displayed at 1e-6 for fungi and 1e-3 for Culex narnavirus.
-
Figure 6—figure supplement 5—source data 1
Data underlying Figure 6—figure supplement 5.
- https://cdn.elifesciences.org/articles/68353/elife-68353-fig6-figsupp5-data1-v2.csv
Figure 7
Genomic evidence for segment reassortment and intercontinental spread of mosquito-borne quaranjaviruses.
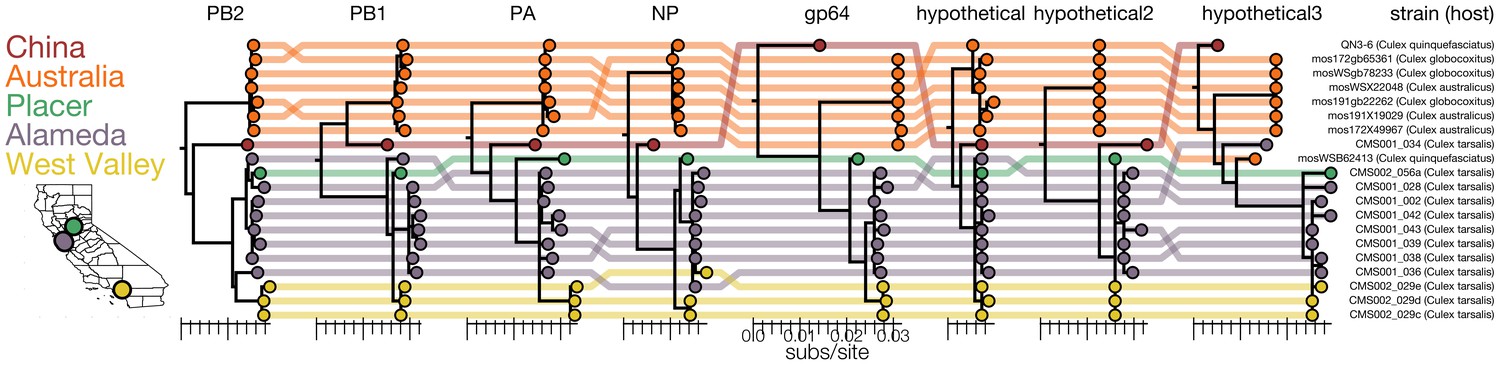
(A) The Chinese strain (QN3-6) was originally described from a single PB1 sequence, while Australian (orange) viruses were described as having six segments. In this study we report the existence of two additional smaller segments (named hypothetical 2 and hypothetical 3) which we have assembled from our samples and the SRA entries of Chinese and Australian samples. Strains recovered in California as part of this study are colored by sampling location (Placer County in green, Alameda County in purple, West Valley in yellow). Strain names and hosts are indicated on the far right with colored lines tracing the position of each tip in other segment trees with crossings visually indicating potential reassortments.
-
Figure 7—source data 1
Data underlying Figure 7.
- https://cdn.elifesciences.org/articles/68353/elife-68353-fig7-data1-v2.zip
Tables
Table 1
Complete genomes of known and novel viral taxa recovered in this study*.
| Genome type | Viral family | Virus name | Novel? | Number detected overall | Number in Aedes samples | Number in Culex samples | Number in Culiseta samples |
|---|---|---|---|---|---|---|---|
| Single-stranded positive sense RNA | Botourmiaviridae | Patollo virus | TRUE | 1 | 0 | 1 | 0 |
| Botourmiaviridae | Picullus virus | TRUE | 1 | 0 | 1 | 0 | |
| Botourmiaviridae | Poccolus virus | TRUE | 1 | 0 | 1 | 0 | |
| Botourmiaviridae | Pikulas virus | TRUE | 1 | 0 | 1 | 0 | |
| Botourmiaviridae | Pecols virus | TRUE | 1 | 0 | 1 | 0 | |
| Botourmiaviridae | Patulas virus | TRUE | 1 | 0 | 1 | 0 | |
| Dicistroviridae | Wuhan insect virus 33 | FALSE | 3 | 3 | 0 | 0 | |
| Flaviviridae | Placeda virus | TRUE | 3 | 0 | 3 | 0 | |
| Flaviviridae | Culex flavivirus | FALSE | 3 | 0 | 3 | 0 | |
| Flaviviridae | Calbertado virus | FALSE | 1 | 0 | 1 | 0 | |
| Iflaviridae | Culex iflavi-like virus 4 | FALSE | 6 | 2 | 4 | 0 | |
| Iflaviridae | Calumiyane virus | TRUE | 3 | 0 | 0 | 3 | |
| Iflaviridae | Culex iflavi-like virus 3 | FALSE | 2 | 0 | 2 | 0 | |
| Iflaviridae | Calfluga virus | TRUE | 1 | 0 | 0 | 1 | |
| Leviviridae | Chimba virus | TRUE | 1 | 0 | 1 | 0 | |
| Leviviridae | Ulae virus | TRUE | 1 | 1 | 0 | 1 | |
| Luteoviridae | Culex-associated Luteo-like virus | FALSE | 7 | 0 | 7 | 0 | |
| Luteoviridae | Geolu virus | TRUE | 1 | 0 | 0 | 1 | |
| Narnaviridae | Culex narnavirus 1 | FALSE | 43 | 0 | 43 | 0 | |
| Narnaviridae | Whakaata virus | TRUE | 1 | 0 | 0 | 1 | |
| Solemoviridae | Marma virus | FALSE | 39 | 0 | 39 | 0 | |
| Solemoviridae | Culex mosquito virus 6 | FALSE | 15 | 0 | 15 | 0 | |
| Solemoviridae | Guadeloupe mosquito virus | FALSE | 8 | 8 | 0 | 0 | |
| Solemoviridae | Wenzhou sobemo-like virus 4 | FALSE | 7 | 7 | 0 | 0 | |
| Solemoviridae | Kellev virus | TRUE | 2 | 0 | 0 | 2 | |
| Tombusviridae | Hubei mosquito virus 4 | FALSE | 18 | 0 | 18 | 0 | |
| Tombusviridae | Erebo virus | TRUE | 4 | 0 | 3 | 1 | |
| Tombusviridae | Vai augu virus | TRUE | 2 | 0 | 2 | 0 | |
| Tymoviridae | Guadeloupe Culex tymo-like virus | FALSE | 1 | 0 | 1 | 0 | |
| Virgaviridae | Hubei virga-like virus 2 | FALSE | 36 | 0 | 36 | 0 | |
| Virgaviridae | Culex pipiens-associated Tunisia virus | FALSE | 13 | 0 | 13 | 0 | |
| Single-stranded negative sense RNA | Chuviridae | Culex mosquito virus 4 | FALSE | 6 | 0 | 6 | 0 |
| Orthomyxoviridae | Üsinis virus | TRUE | 15 | 15 | 0 | 0 | |
| Orthomyxoviridae | Wuhan mosquito virus 6 | FALSE | 13 | 0 | 13 | 0 | |
| Orthomyxoviridae | Guadeloupe mosquito quaranja-like virus 1 | FALSE | 5 | 5 | 0 | 0 | |
| Orthomyxoviridae | Astopletus virus | TRUE | 2 | 0 | 2 | 0 | |
| Peribunyaviridae | Culex bunyavirus 2 | FALSE | 30 | 0 | 30 | 0 | |
| Peribunyaviridae | Udune virus | TRUE | 1 | 0 | 1 | 0 | |
| Peribunyaviridae | Dumanli virus | TRUE | 1 | 0 | 1 | 0 | |
| Phasmaviridae | Barstukas virus | TRUE | 16 | 16 | 0 | 0 | |
| Phasmaviridae | Miglotas virus | TRUE | 16 | 0 | 16 | 0 | |
| Phenuiviridae | Niwlog virus | TRUE | 8 | 0 | 8 | 0 | |
| Rhabdoviridae | Merida virus | FALSE | 9 | 4 | 5 | 0 | |
| Rhabdoviridae | Stang virus | TRUE | 4 | 0 | 4 | 0 | |
| Rhabdoviridae | Elisy virus | TRUE | 3 | 0 | 3 | 0 | |
| Rhabdoviridae | Canya virus | TRUE | 2 | 0 | 2 | 0 | |
| Xinmoviridae | Gordis virus | TRUE | 9 | 0 | 0 | 9 | |
| Xinmoviridae | Aedes anphevirus | FALSE | 2 | 2 | 0 | 0 | |
| Double-stranded RNA | Chrysoviridae | Hubei chryso-like virus 1 | FALSE | 2 | 0 | 2 | 0 |
| Chrysoviridae | Keturi virus | TRUE | 1 | 0 | 1 | 0 | |
| Partitiviridae | Netjeret virus | TRUE | 11 | 11 | 0 | 0 | |
| Partitiviridae | Nefer virus | TRUE | 10 | 0 | 2 | 8 | |
| Partitiviridae | Nebet virus | TRUE | 2 | 0 | 0 | 2 | |
| Reoviridae | Elemess virus | TRUE | 6 | 0 | 6 | 0 | |
| Reoviridae | Lasigmu virus | TRUE | 1 | 1 | 0 | 0 | |
| Reoviridae | Lobuck virus | TRUE | 1 | 1 | 0 | 0 | |
| Totiviridae | Tzifr virus | TRUE | 27 | 0 | 27 | 0 | |
| Totiviridae | Lotchka virus | TRUE | 19 | 0 | 19 | 0 | |
| Totiviridae | Mika virus | TRUE | 10 | 0 | 10 | 0 | |
| Totiviridae | Aedes aegypti totivirus | FALSE | 5 | 5 | 0 | 0 | |
| Totiviridae | Snelk virus | TRUE | 4 | 0 | 4 | 0 | |
| Totiviridae | Gouley virus | TRUE | 4 | 0 | 4 | 0 | |
| Totiviridae | Stinn virus | TRUE | 2 | 0 | 2 | 0 | |
| Totiviridae | Hagerguy virus | TRUE | 2 | 0 | 0 | 2 | |
| Totiviridae | Nuyav virus | TRUE | 1 | 1 | 0 | 0 | |
| Totiviridae | Mughataa virus | TRUE | 1 | 0 | 0 | 1 | |
| Totiviridae | Koroku virus | TRUE | 1 | 0 | 0 | 1 | |
| Totiviridae | Emileo virus | TRUE | 1 | 0 | 0 | 1 | |
| Totiviridae | Gissa virus | TRUE | 1 | 0 | 0 | 1 | |
| Totiviridae | Totivirus-like Culex mosquito virus 1 | FALSE | 1 | 0 | 1 | 0 |
-
*Bold text rows highlight viruses previously detected in California (Chandler et al., 2015 and Sadeghi et al., 2018).
-
Table 1—source data 1
Detailed information on the 70 viral genomes recovered in this study.
- https://cdn.elifesciences.org/articles/68353/elife-68353-table1-data1-v2.csv
-
Table 1—source data 2
Blast alignment information on each of the isolates of the 70 viral genomes identified by homology.
- https://cdn.elifesciences.org/articles/68353/elife-68353-table1-data2-v2.tsv
Additional files
-
Supplementary file 1
Summary of West Nile Virus (WNV) and St. Louis encephalitis virus (SLEV) surveillance during the mosquito sample collection period.
- https://cdn.elifesciences.org/articles/68353/elife-68353-supp1-v2.xlsx
-
Transparent reporting form
- https://cdn.elifesciences.org/articles/68353/elife-68353-transrepform-v2.docx
Download links
A two-part list of links to download the article, or parts of the article, in various formats.
Downloads (link to download the article as PDF)
Open citations (links to open the citations from this article in various online reference manager services)
Cite this article (links to download the citations from this article in formats compatible with various reference manager tools)
Single mosquito metatranscriptomics identifies vectors, emerging pathogens and reservoirs in one assay
eLife 10:e68353.
https://doi.org/10.7554/eLife.68353


