Markov state models of proton- and pore-dependent activation in a pentameric ligand-gated ion channel
- Science for Life Laboratory and Swedish e-Science Research Center, Department of Applied Physics, KTH Royal Institute of Technology, Sweden
- Science for Life Laboratory, Department of Biochemistry and Biophysics, Stockholm University, Sweden
Figures
Figure 1
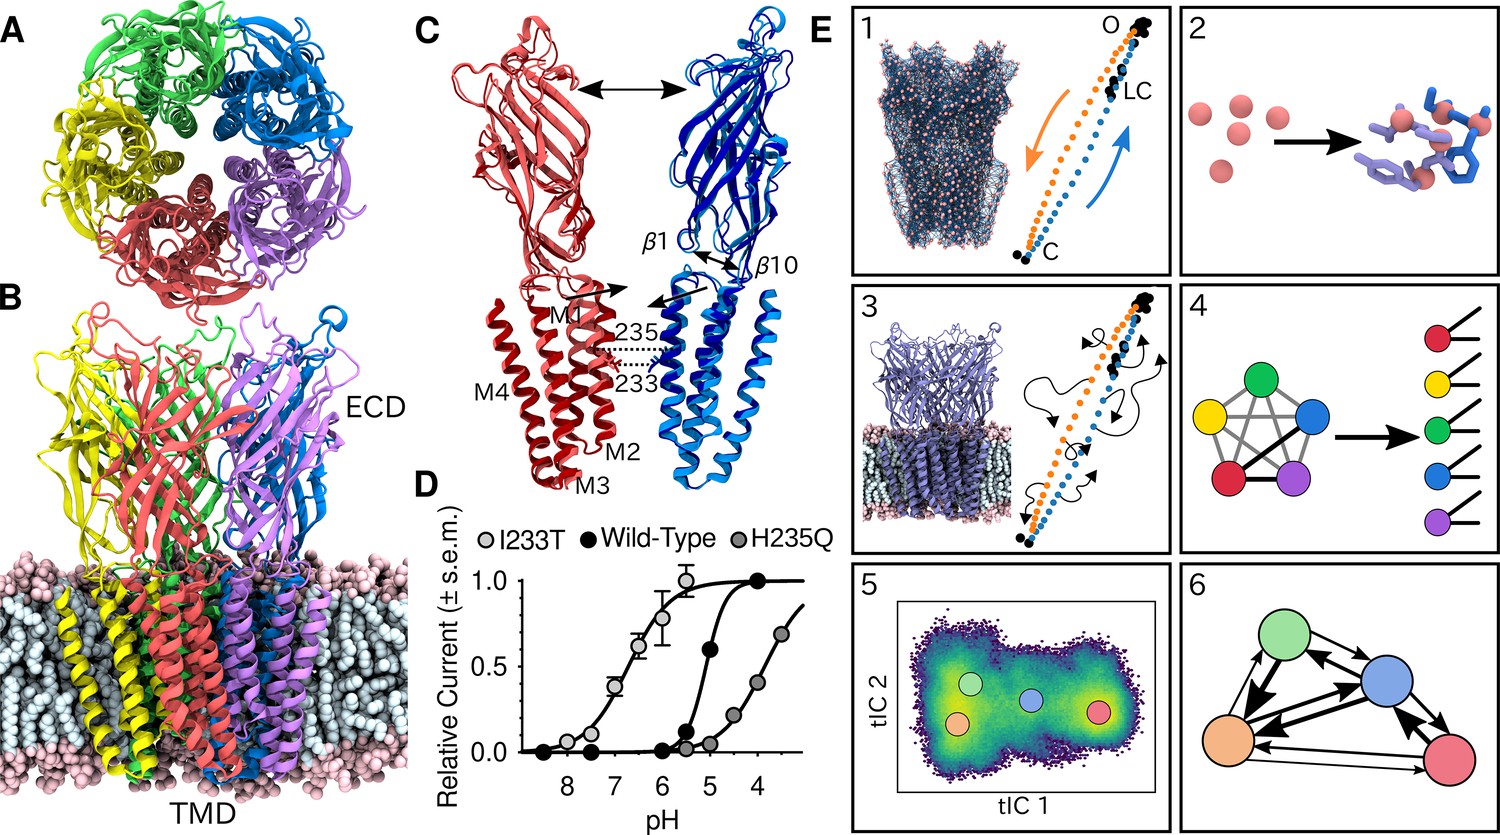
Global architecture of GLIC, electrophysiology data and computational methodology.
GLIC in an open conformation shown from (A) the top and (B) the side in a POPC lipid bilayer. (C) Two opposing subunits highlighting the pore of the channel. Light colors represent the open conformation (PDB ID 4HFI) and dark colors the closed one (PDB ID 4NPQ). Arrows indicate important gating motions - the tilting of the M2 helices, beta expansion and ECD spread. Residues I233 and H235 on the pore-lining M2 helices were mutated in both simulations and electrophysiology experiments. (D) Electrophysiology data for wild-type GLIC, the gain-of-function I233T variant and the loss-of-function H235Q variant. (E) Simulation methodology: the eBDIMS method provides (1) coarse-grained seed structures along the transition pathway followed by (2) reconstruction of the atomistic detail. Atomistic structures were then (3) embedded in lipid bilayers and massively parallel unrestrained MD launched. Analysis involves (4) a feature transformation to account for the symmetry of the pentamer, followed by (5) dimensionality reduction with tICA and (6) MSM construction.
Figure 2 with 4 supplements
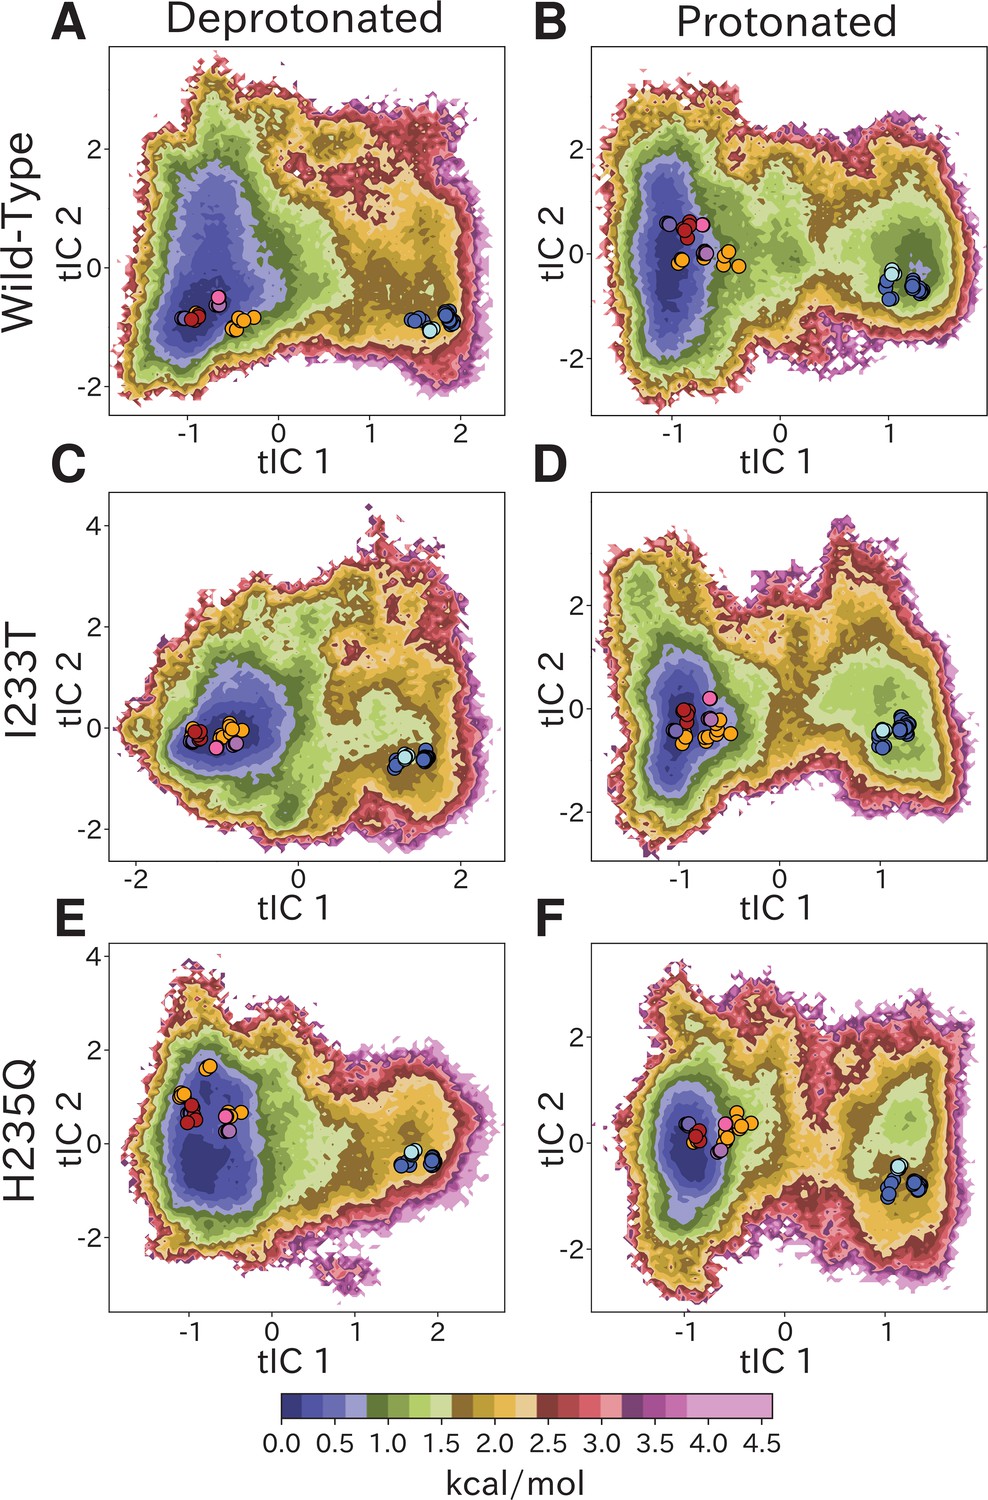
Free-energy landscapes capture shifts upon protonation and mutation.
Free-energy landscapes projected onto the first two tICA coordinates for (A) deprotonated wild-type, (B) protonated wild-type, (C) deprotonated I233T mutant, (D) protonated I233T mutant, (E) deprotonated H235Q mutant, and (F) protonated H235Q mutant. Dots indicate experimental structures, with red representing closed X-ray structures at pH 7 (PDB ID 4NPQ), orange locally closed X-ray structures (PDB IDs 3TLS, 5MUO, 4NPP(B)), light blue modulated states (PDB ID 5J0Z) and blue open states (PDB IDs 4HFI, 3EAM, 3P4W, 4IL4, 3UU5, 4NPP(A)). Pink, magenta, and purple dots indicate closed cryo-EM structures at pH 7, 5, and 3 (PDB IDs 6ZGD, GZGJ, GZGK) respectively. Less than 100% of the channels are expected to adopt an open state even under protonated conditions (B, D, F). At protonated conditions the H235Q mutation results in an 'open'-state free-energy minimum distinct from experimental open structures (F).
Figure 2—figure supplement 1
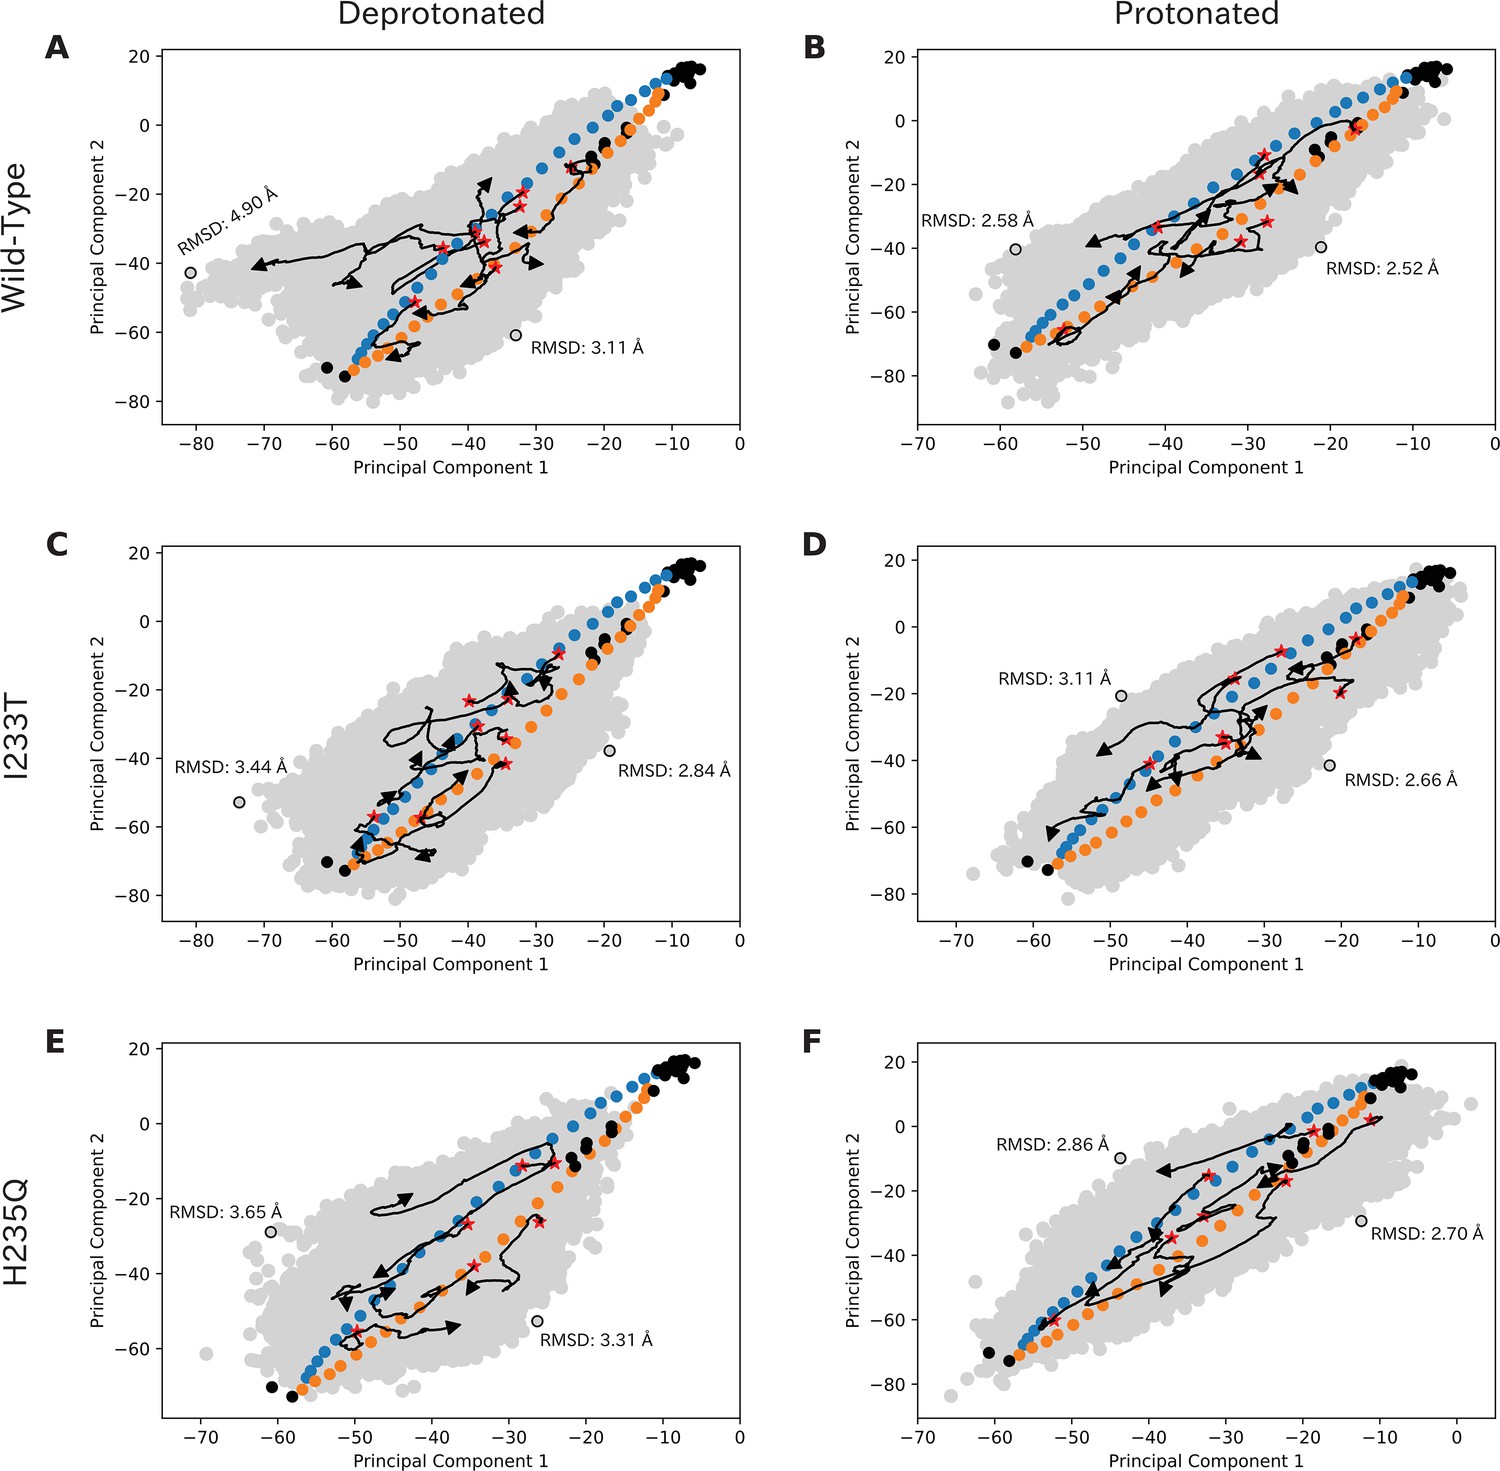
Simulations sample the initial transition pathway broadly.
Simulations sample the initial transition pathway broadly. Simulation seeds, experimental structures and overall sampling projected onto principal component space for deprotonated wild-type (A), protonated wild-type (B), deprotonated I233T (C), protonated I233T (D), deprotonated H235Q (E), and protonated H235Q (F). Blue and yellow dots represent initial seeds obtained from an eBDIMS pathway, black dots indicate experimental structures, and the gray surface represent overall sampling from the simulations. A few trajectories with large distances between the starting (red star) and end position (arrowhead) have been highlighted as black arrows. The level of sampling orthogonal to the initial pathway has been quantified as RMSDs compared to the closed conformation of the initial pathway. Principal component one represents blooming motions of particularly the ECD, while Principal component two represent twisting and tilting motions of TMD and ECD.
Figure 2—figure supplement 2
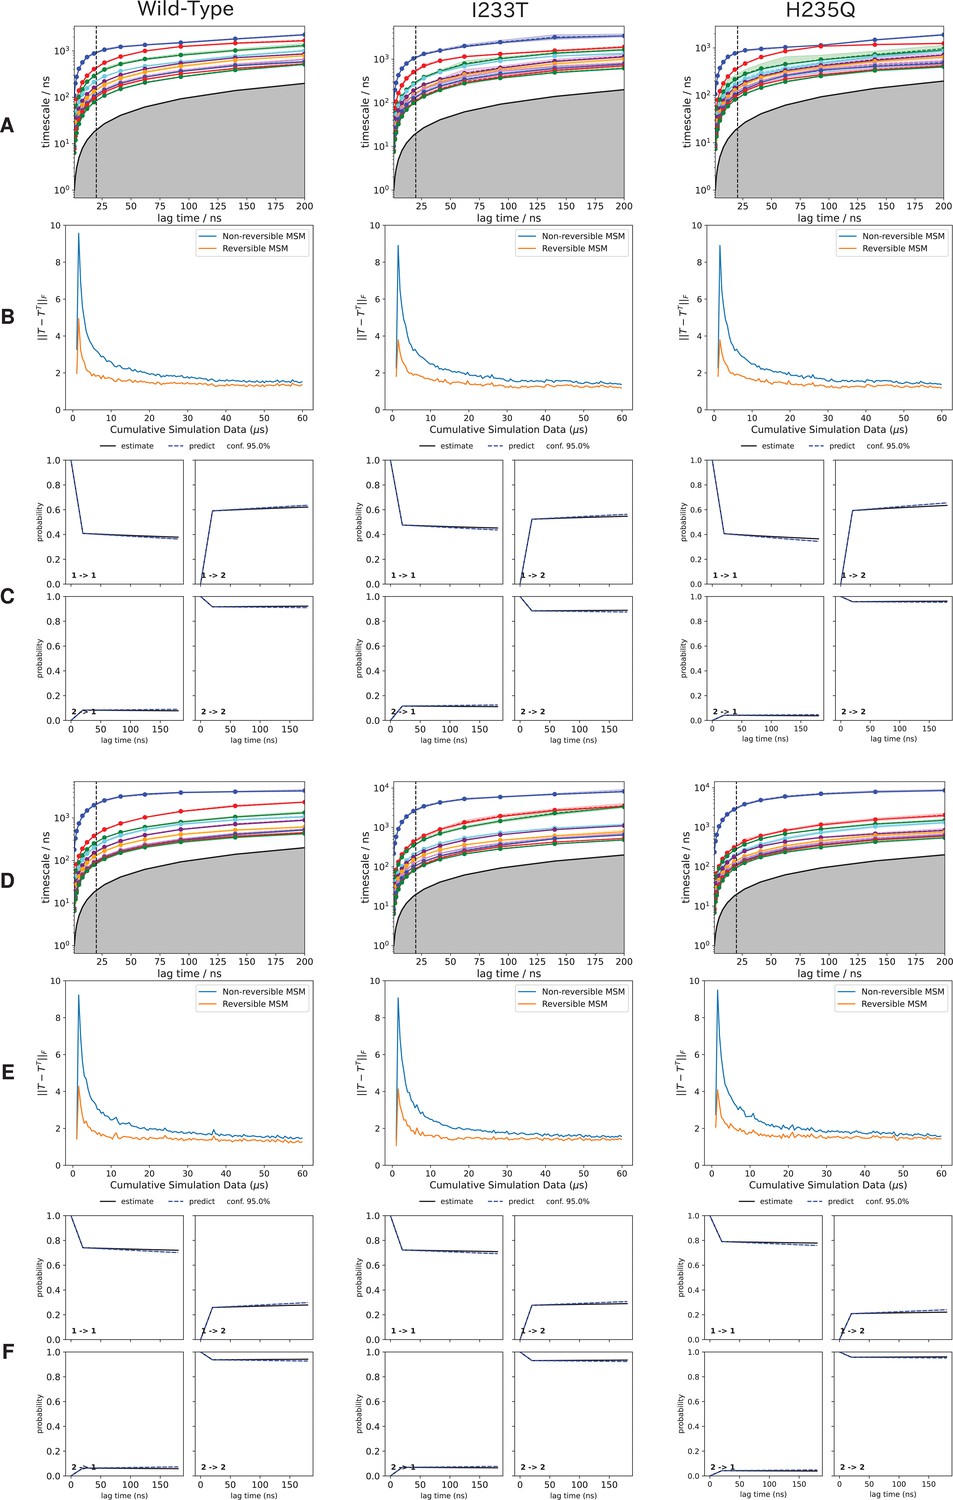
Assessment of convergence and sampling of the MSMs.
Assessment of convergence and sampling of the MSMs. The first 10 implied timescales representing the 10 slowest processes of the MSM for (A) deprotonated and (D) protonated system. The vertical dotted line represents the selected MSM lag time, chosen as the smallest lag time where the implied timescales have leveled out. Chapman-Kolmogorov tests of each two-state model (Figure 3) for (B) deprotonated and (E) protonated systems. The level of symmetry of the transition probability matrix (T) for both symmetrized and non-symmetrized models as a function of the amount of sampling, for (C) deprotonated and (F) protonated systems. As the sampling increases the correction needed for to generate the symmetrized model becomes smaller. Since the curves do not reach zero the sampling is not perfectly reversible, but to achieve that orders of magnitude more sampling would likely be needed.
Figure 2—figure supplement 3
Variational optimization for selection of hyperparameters.
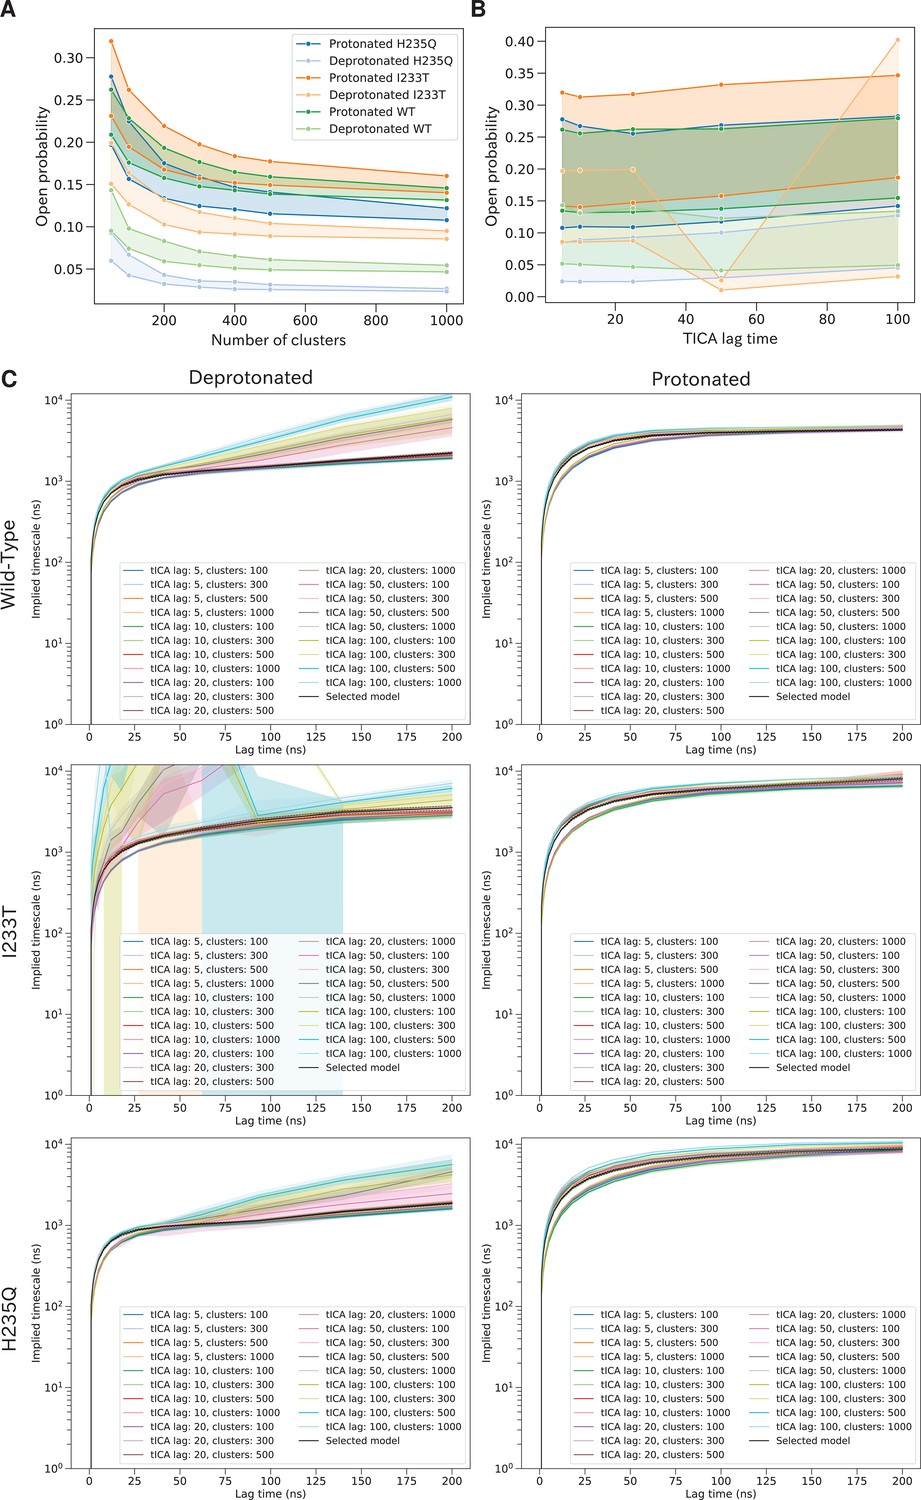
Variational optimization of the slowest timescale enables selection of hyperparameters. Open probabilities for all two-state models as a function of the number of microstate clusters (A). The width of each line represents possible hyperparameter combinations, including tICA lag times up to 25 ns together with commute or kinetic mappings. A total of 300 clusters were selected at the 'elbow' of the plot to avoid overfitting. Open probabilities for all two-state models as a function of tICA lag times (B). The width of each line represents possible hyperparameter combinations, including number of microstate clusters and commute or kinetic mappings. The results are consistent for all four datasets up to tICA lag time of at least 25 ns. The slowest timescale calculated for different combinations of hyperparameters (C) The black line represent the selected final model.
Figure 2—figure supplement 4
Vector representation of the two tICA coordinates.
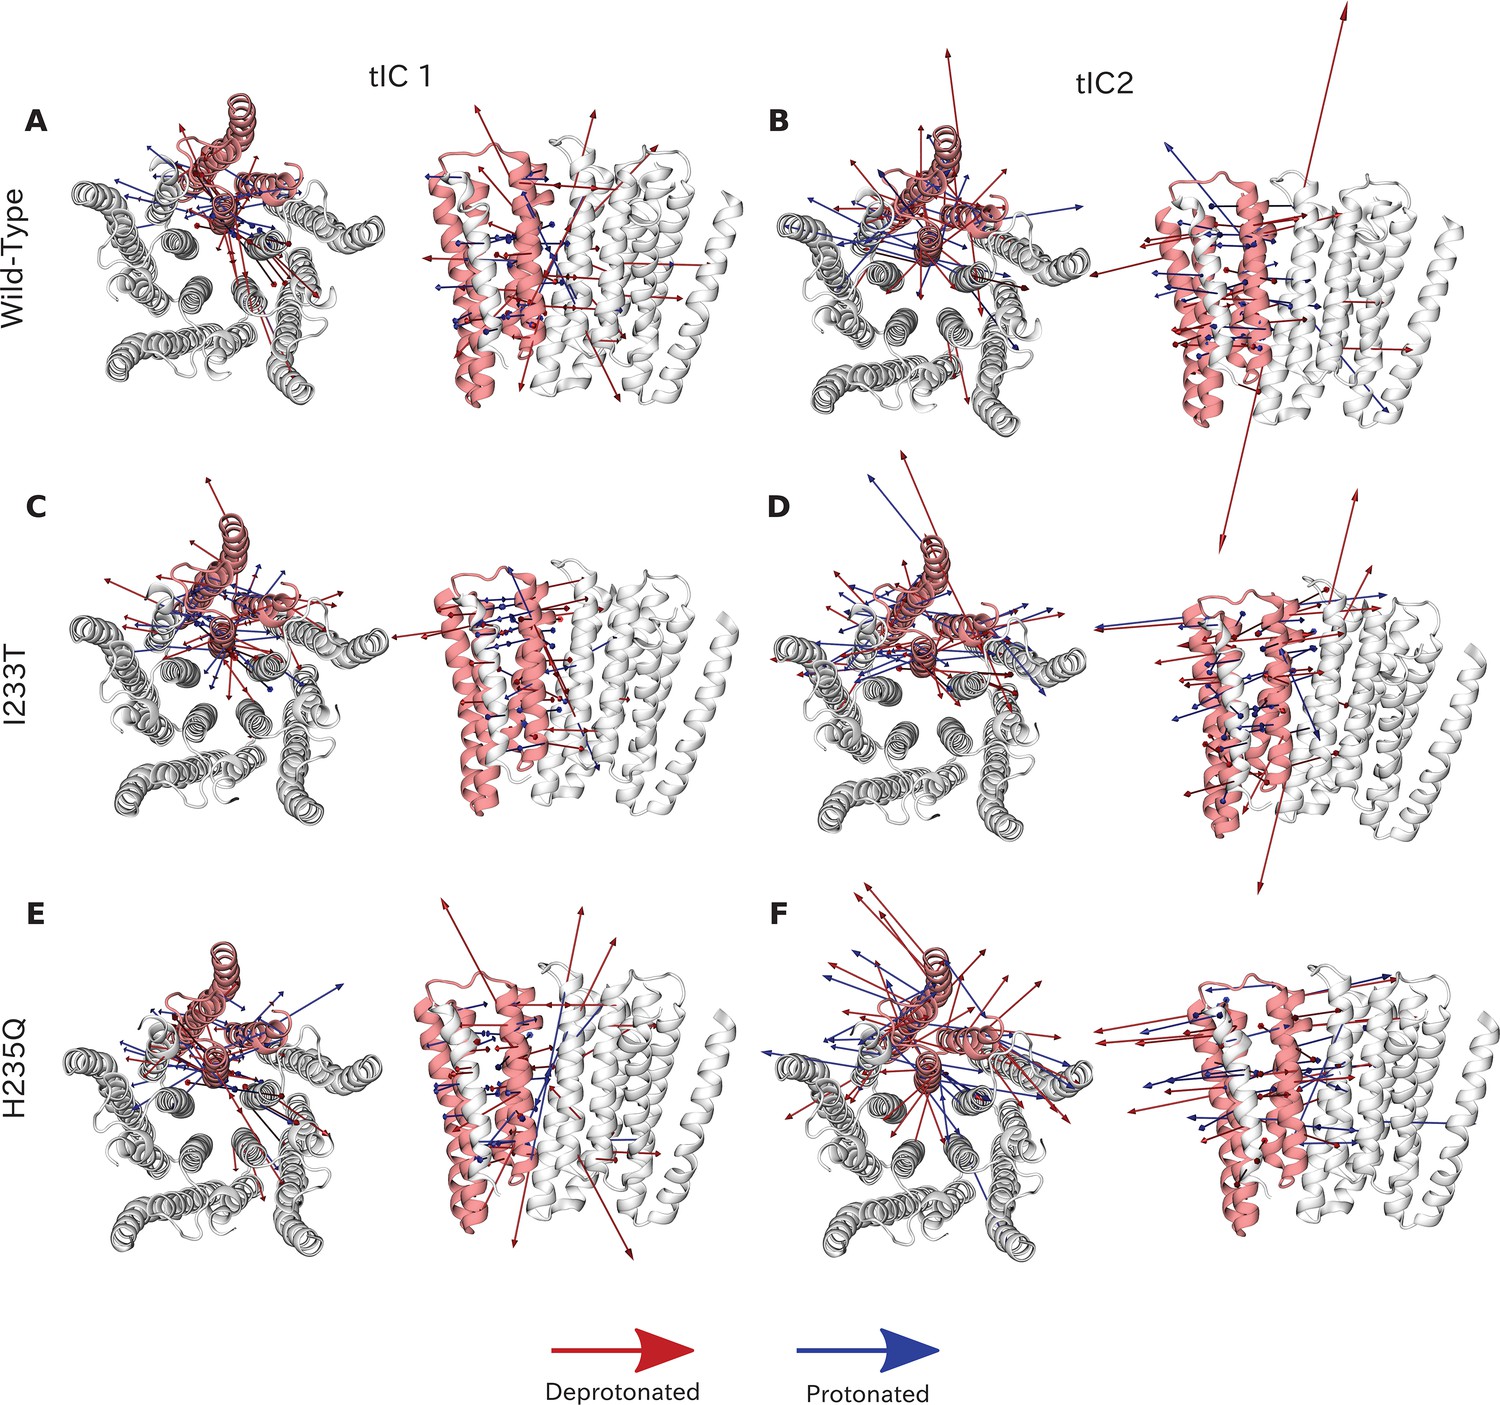
Vector representation of the two tICA coordinates. The 20 largest eigenvector components of the two tICA coordinates projected onto the GLIC transmembrane domain. TIC 1 is overall more focused on interactions around the M2 helices for both wild-type (A), I233T (C) and H235Q (E), while the tIC 2 eigenvectors are more interspersed between all of the transmembrane helices for both wild-type (B), I233T (D) and H235Q (F). Red arrows represent deprotonated datasets and blue protonated datasets for each phenotype. Note that the magnitude of these arrows represent the slowness of the motion, and the direction is parallel to the distance feature used as input for tICA.
Figure 3 with 3 supplements

Two-state clustering distinguishes metastable open and closed states.
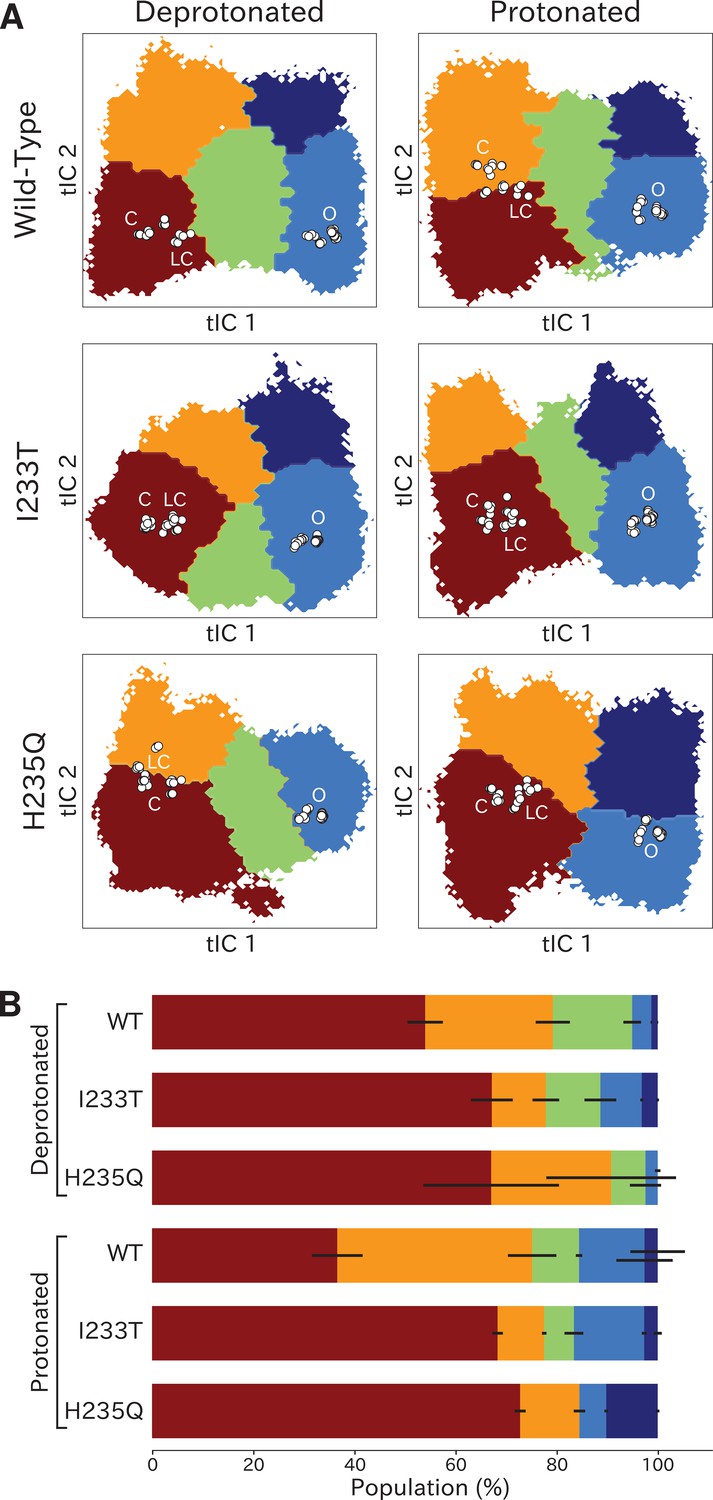
(A) Two metastable states separated by the highest free energy barrier, with red representing closed-like states and blue open-like states. White dots indicate experimental structures, with labels marking closed (C), locally closed (LC) and open (O) clusters. (B) Populations of the closed (red) and open (dark blue) macrostates, with populations of hydrated conformations (>20 water molecules in the pore) marked in lighter blue. Protonated conditions consistently decreased closed-like and increased open-like populations, albeit to less than 100%. Relative to wild-type, the I233T substitution decreased closed-like populations, while H235Q decreased open-like populations, and even more so the population of hydrated conformations. Relative changes in open population reflect shifts in functional activity in Figure 1. (C) Transition rates (arrows) with numbers representing mean first passage times of crossing the highest free energy barrier. Transition rates to the closed state consistently decreased under protonated versus deprotonated conditions. In deprotonated conditions, the I233T mutation increased the rate of opening, while the H235Q mutation decreased opening rates in both conditions. (D) Hydration of the transmembrane pore. Side panels show the population of states with different hydration levels. The pore can be seen hydrating or dehydrating when crossing the main free energy barrier (white). The I233T mutation resulted in higher levels of hydration in both open and closed states, while the H235Q mutation was less hydrated in the open state.
Figure 3—figure supplement 1
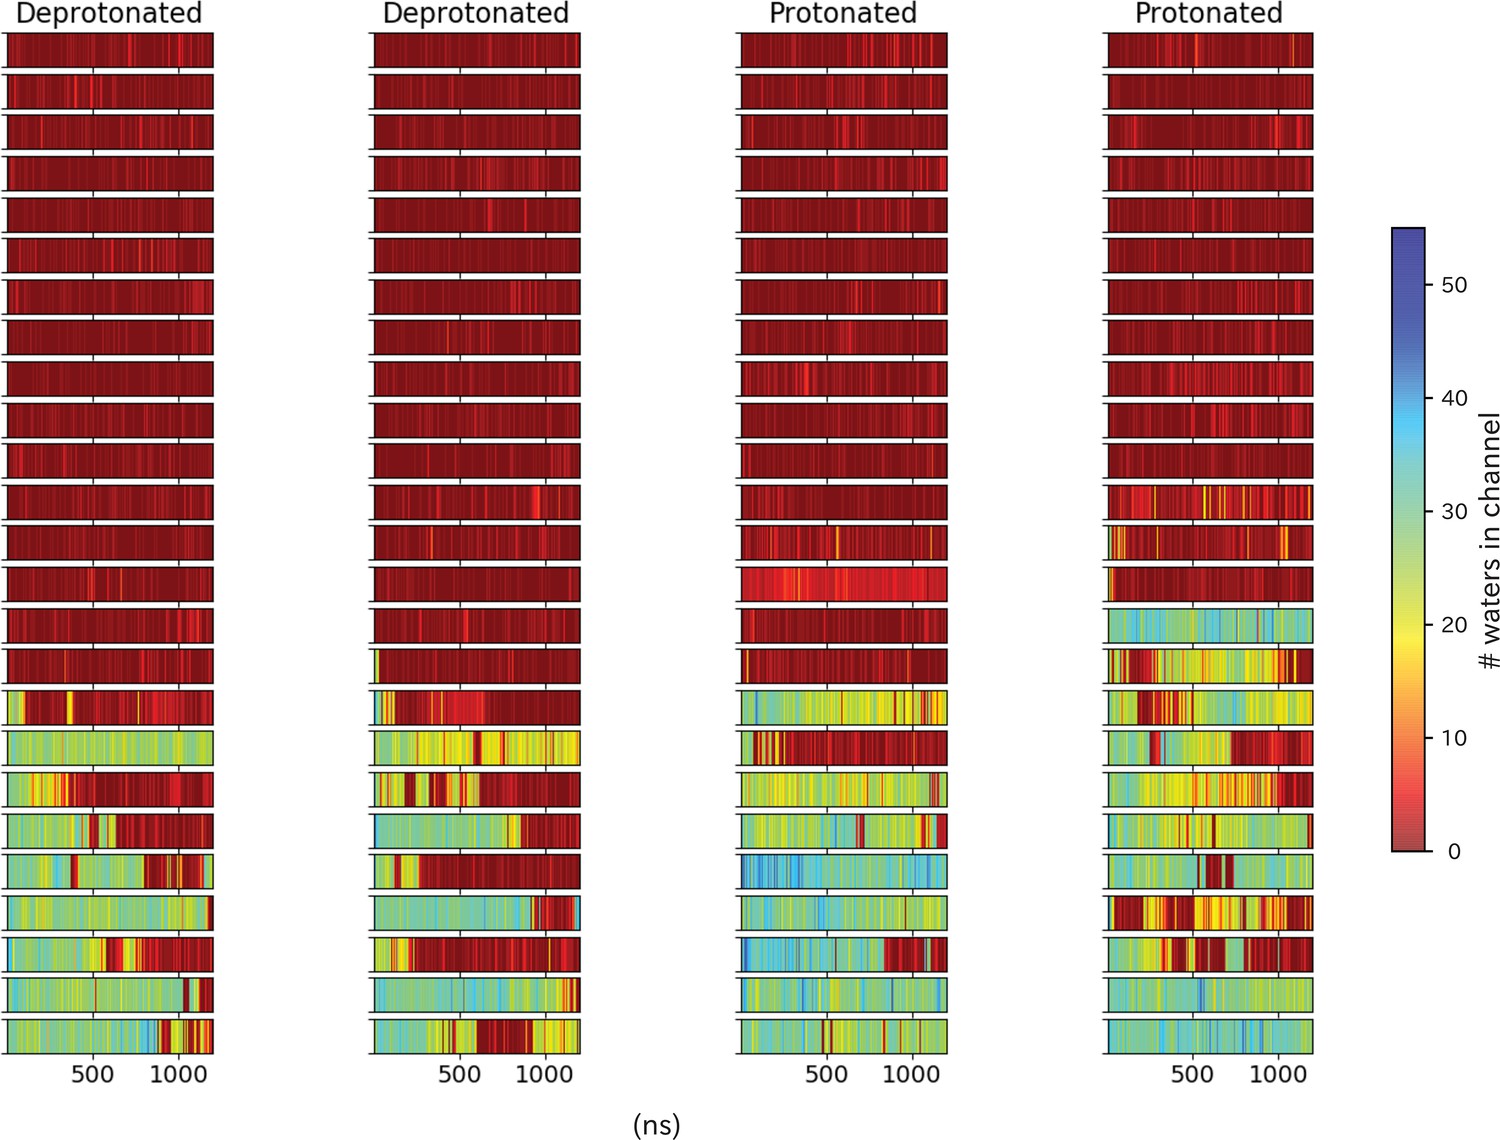
Pore hydration in wild-type GLIC simulations.
Hydration of all 100 wild-type simulations, where each row represents one simulation with frames on the x-axis.The simulations have been grouped based on location of the starting seed in the transition, with open-like seeds at the bottom and closed-like seeds at the top.
Figure 3—figure supplement 2
Pore hydration in I233T mutant GLIC simulations.
Hydration of all 100 I233T simulations, where each row represents one simulation with frames on the x-axis. The simulations have been grouped based on location of the starting seed in the transition, with open-like seeds at the bottom and closed-like seeds at the top.
Figure 3—figure supplement 3

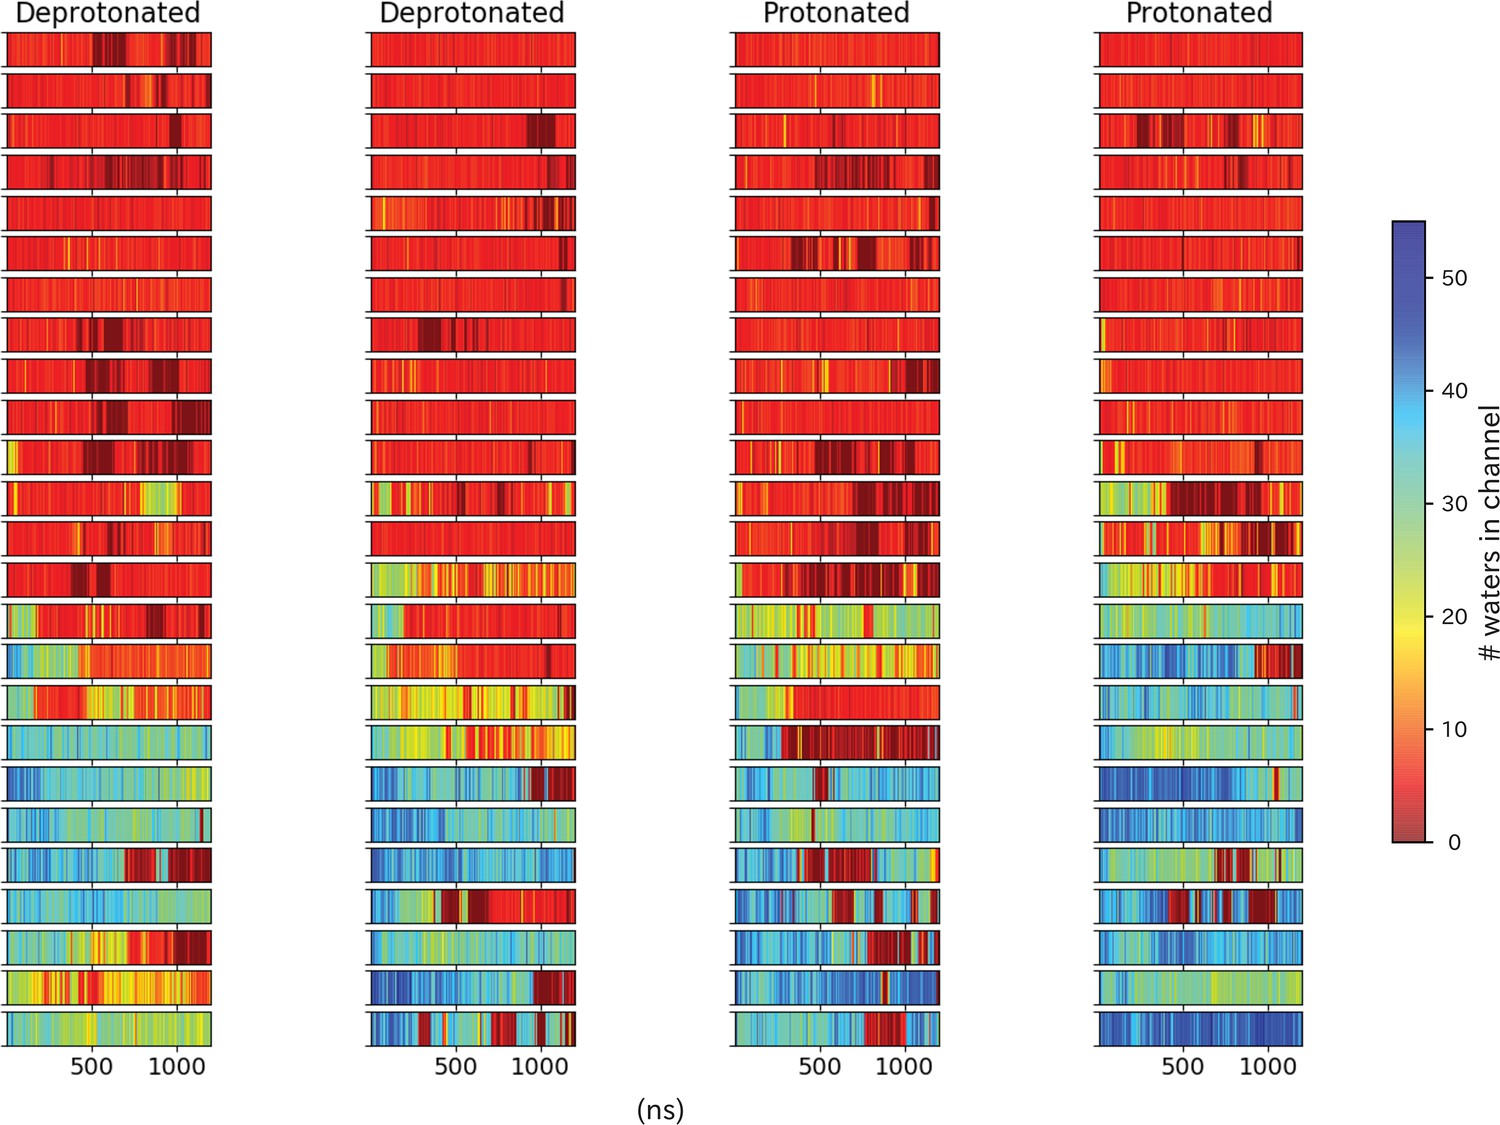
Pore hydration in H235Q mutant GLIC simulations.
Hydration of all 100 H235Q simulations, where each row represents one simulation with frames on the x-axis. The simulations have been grouped based on location of the starting seed in the transition, with open-like seeds at the bottom and closed-like seeds at the top.
Figure 4
Higher order clustering of the GLIC free-energy landscapes.
(A) Each free-energy landscape can be further clustered into models with four or five macrostates that – despite not being metastable– allow for more fine-grained structural analysis of the energy landscape. White dots represent experimental structures marking closed (C), locally closed (LC) and open (O) clusters, respectively. (B) Populations for each macrostate. The different regions will be referred to as: red - State I, orange - State II, green - State III, light blue - State IV, and dark blue - State V. Conformations sampled from these states can be accessed at doi:10.5281/zenodo.5500174.
Figure 5 with 11 supplements
Probability distributions of a few variables proposed to be important in GLIC gating.
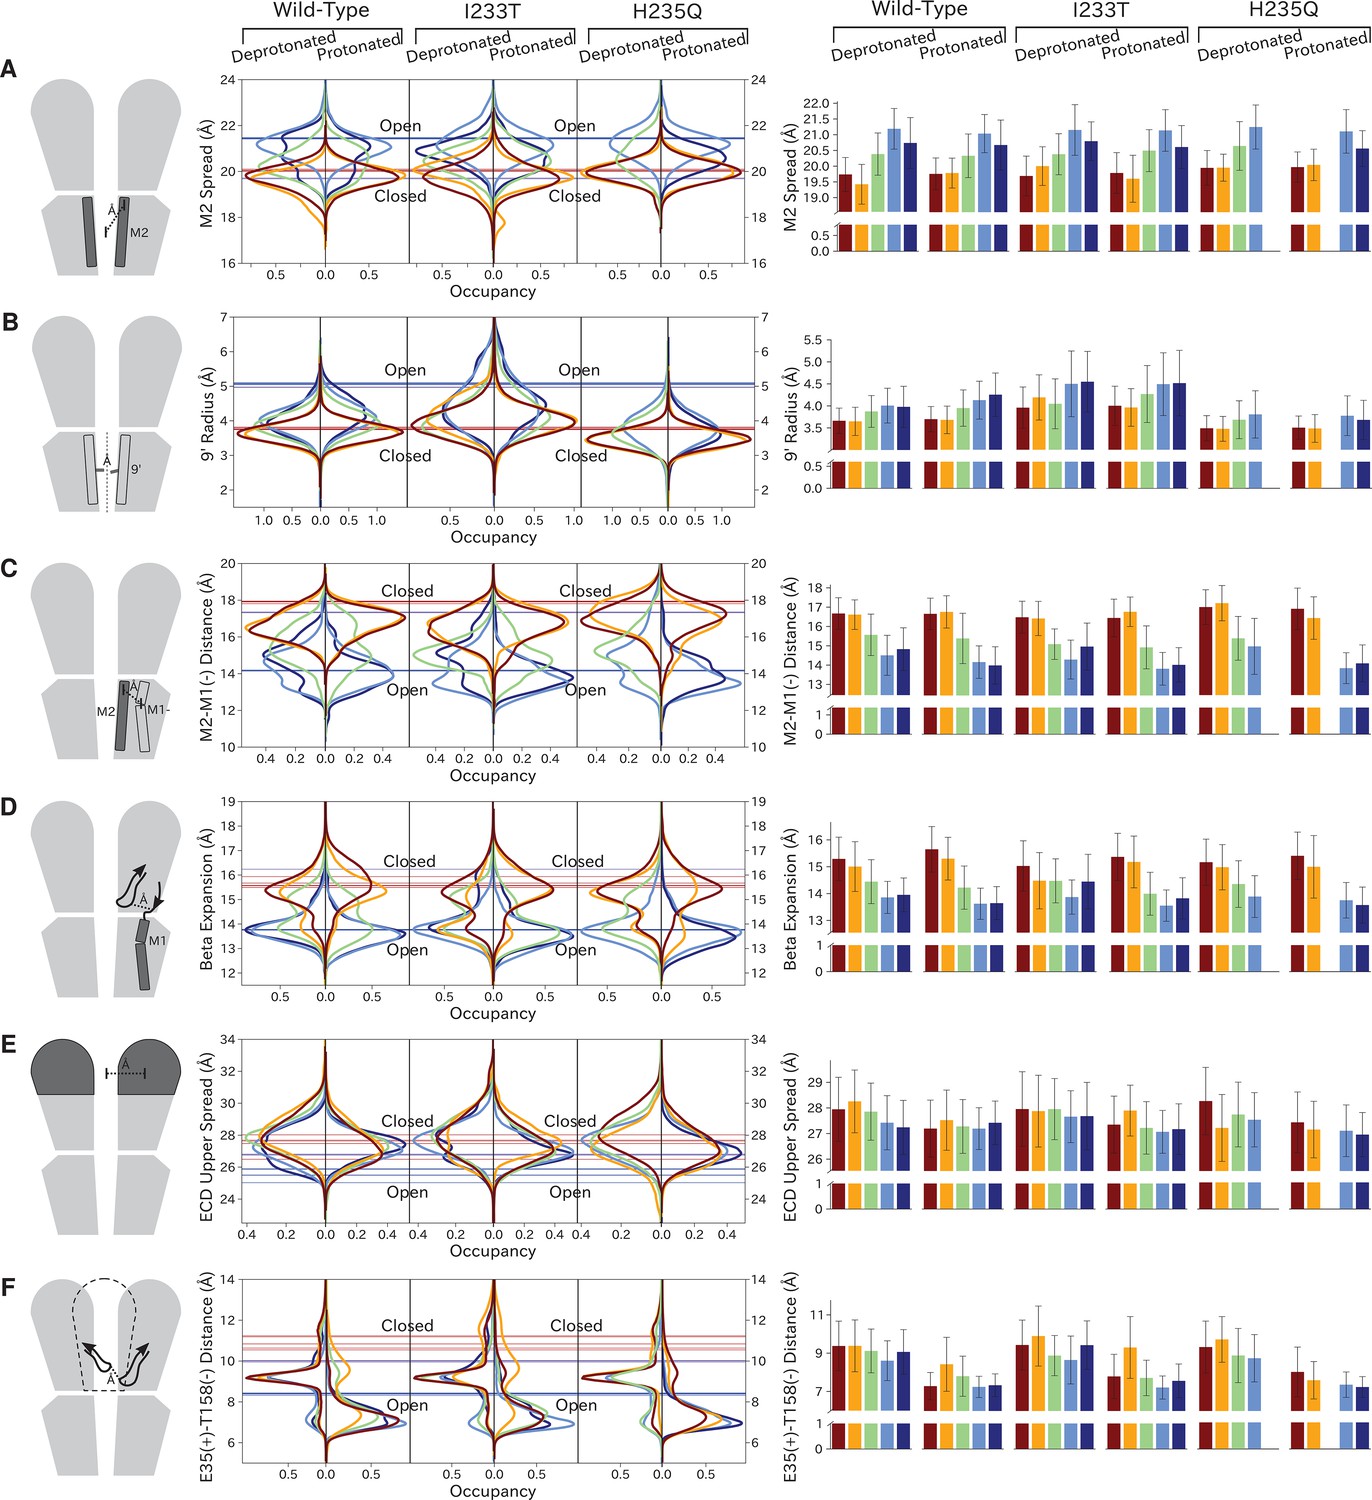
The left-most cartoons illustrate the definition of each variable, while data is presented as probability distributions with means and standard deviations plotted as bars. Colors represent the macrostates in Figure 4, and blue, red and purple horizontal lines represent the experimental structures 4HFI (Sauguet et al., 2013), 4NPQ (Sauguet et al., 2014) and 6ZGK (Rovšnik et al., 2021), respectively. The spread of the pore-lining M2 helices (A, Figure 5—figure supplement 3) is captured by the open and closed macrostates, with intermediate states taking intermediate values. However, the open-state minimum is more contracted for the protonated H235Q variant (state V). The radius from the pore center to the 9’ hydrophobic gate (B, Figure 5—figure supplement 4) captures clear differences between the three variants, where the I233T mutant has a more expanded pore than wild-type while the pore of H235Q is more contracted. The distance between the pore-lining M2 helix and the M1 helix of the neighboring subunit (C, Figure 5—figure supplement 5) is also correctly represented by the open and closed macrostates, with State III taking intermediate values. The beta expansion (D, Figure 5—figure supplement 6) yields distributions with expectation values of closed and open states aligning well with the experimental structures, while the intermediate state produces a bimodal distribution. Interestingly, the probability distributions of the closed-like states of the I233T mutation at deprotonated conditions show increased biomodality as well. The upper spread of the extracellular domain (ECD) (E, Figure 5—figure supplement 7) does not result in a clear separation of the macrostates, but a smaller pH-dependent shift can be observed. The Cα distance between E35 and T158 (F, Figure 5—figure supplement 8) of primary and complementary subunits, respectively, capture large pH-dependent shifts in for all macrostates.
Figure 5—figure supplement 1
Distributions of variables proposed to be important in GLIC gating.
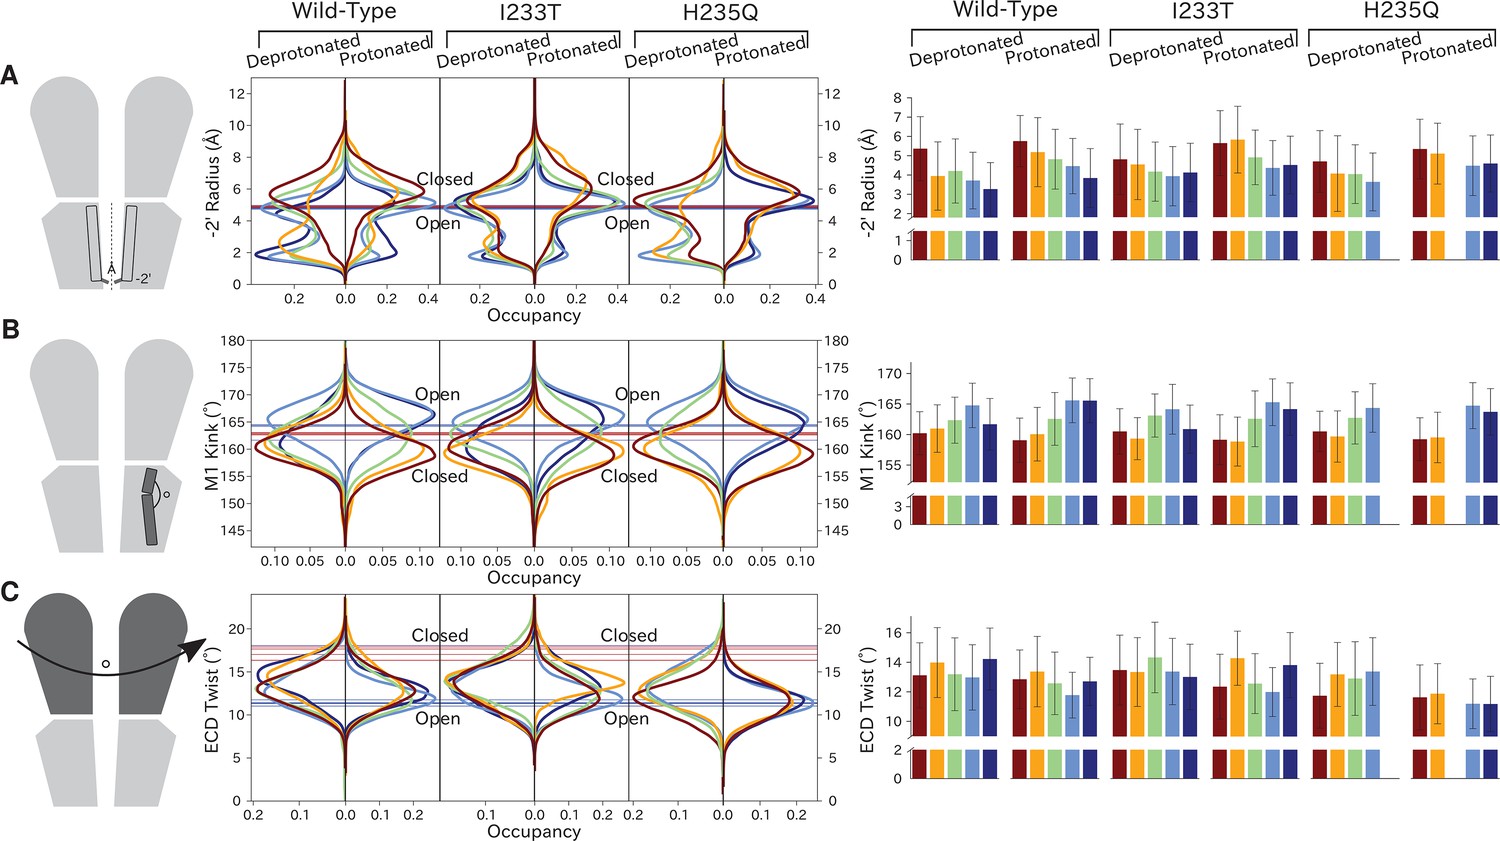
Probability distributions of a few variables proposed to be important in GLIC gating. The left-most cartoons illustrate the definition of each variable, while data is presented as four probability distributions with means and standard deviations plotted as bars. Colors represent the different states in 4, and blue, red and purple horizontal lines represent the experimental structures 4HFI (Sauguet et al., 2013), 4NPQ (Sauguet et al., 2014) and 6ZGK (Rovšnik et al., 2021), respectively. The radius between the pore and the −2’ gate (A, Figure 5—figure supplement 9) is lower in the open states for all datasets, although the values for the closed and open experimental structures are the same. Kinking of the M1 helix is more pronounced when approaching the closed state (B, Figure 5—figure supplement 10). The twisting of the extracellular domain (C, Figure 5—figure supplement 11) does not result in a clear separation of the different states, but a small pH-dependent shift can be observed.
Figure 5—figure supplement 2
ECD spread and twist values show rapid adaption in response to pH.
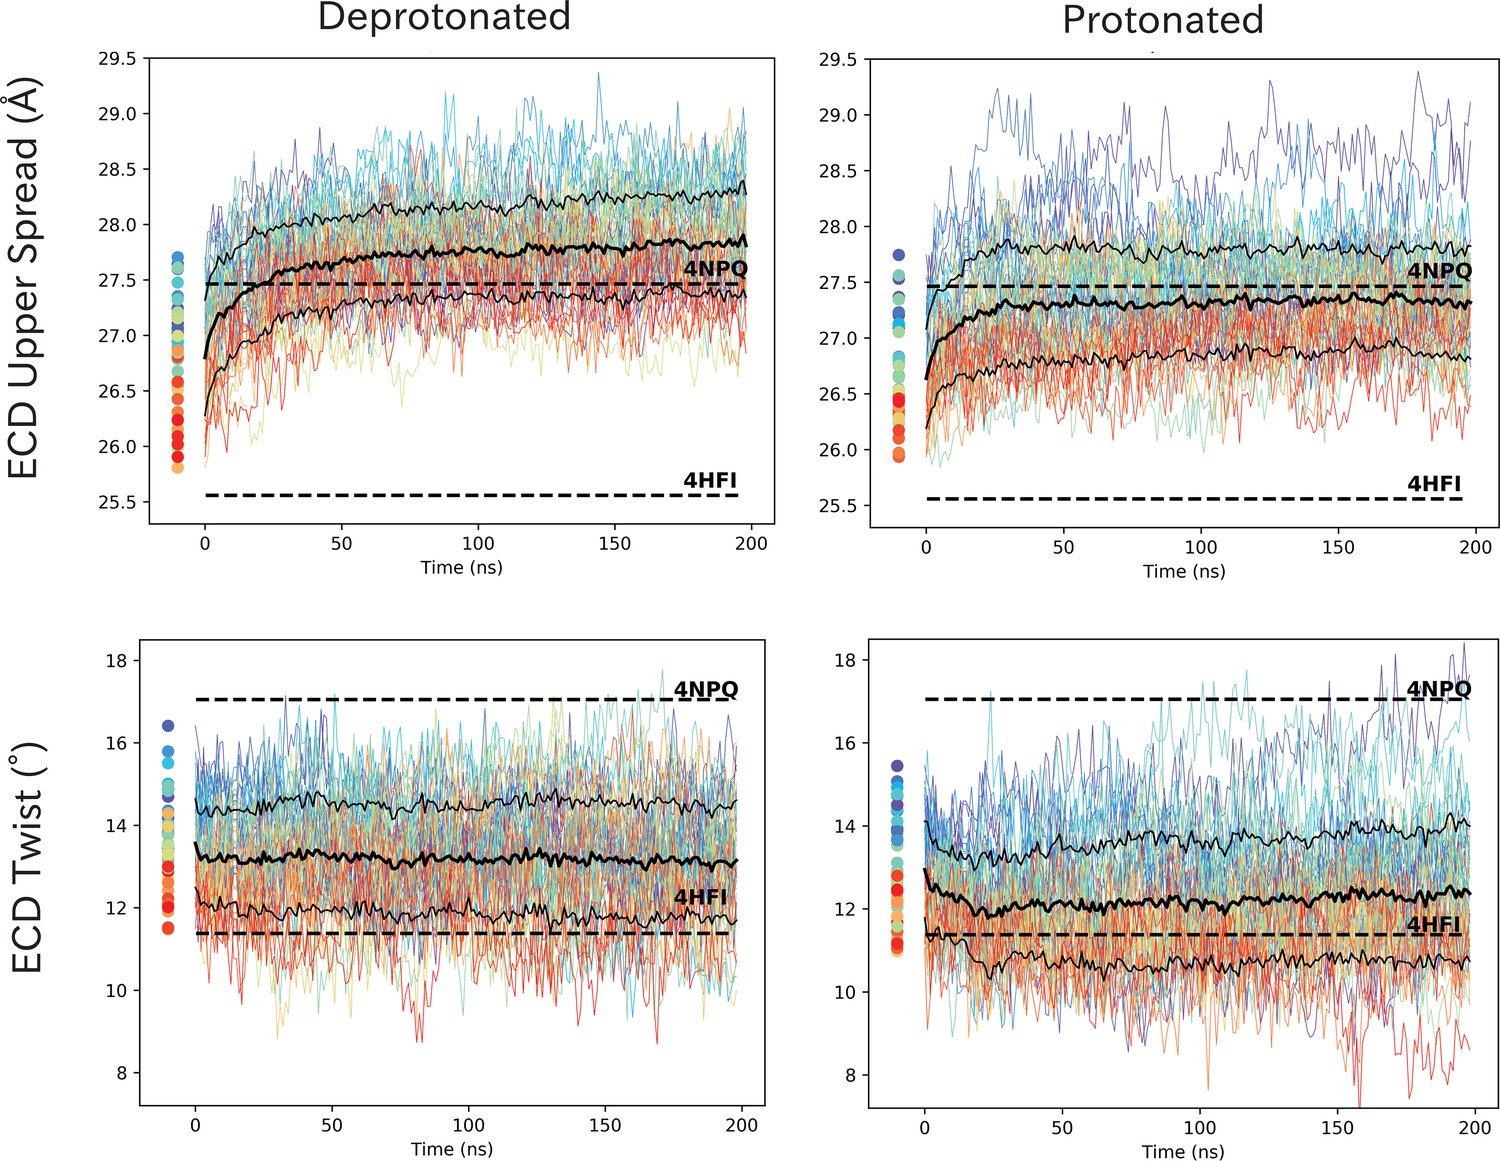
ECD spread and twist values show rapid adaption in response to pH. Time series of ECD spread and twist values for wild-type GLIC at protonated and deprotonated conditions. Initial simulation seeds are marked as dots left of the curves and colors indicate staring seed conformation, where red represent open-like conformations and blue closed-like conformations. The solid black line represents the average of the 50 curves, and dashed lines the standard deviations. Dashed horizontal lines represent the closed (4NPQ) and open (4HFI) X-ray structures.
Figure 5—figure supplement 3
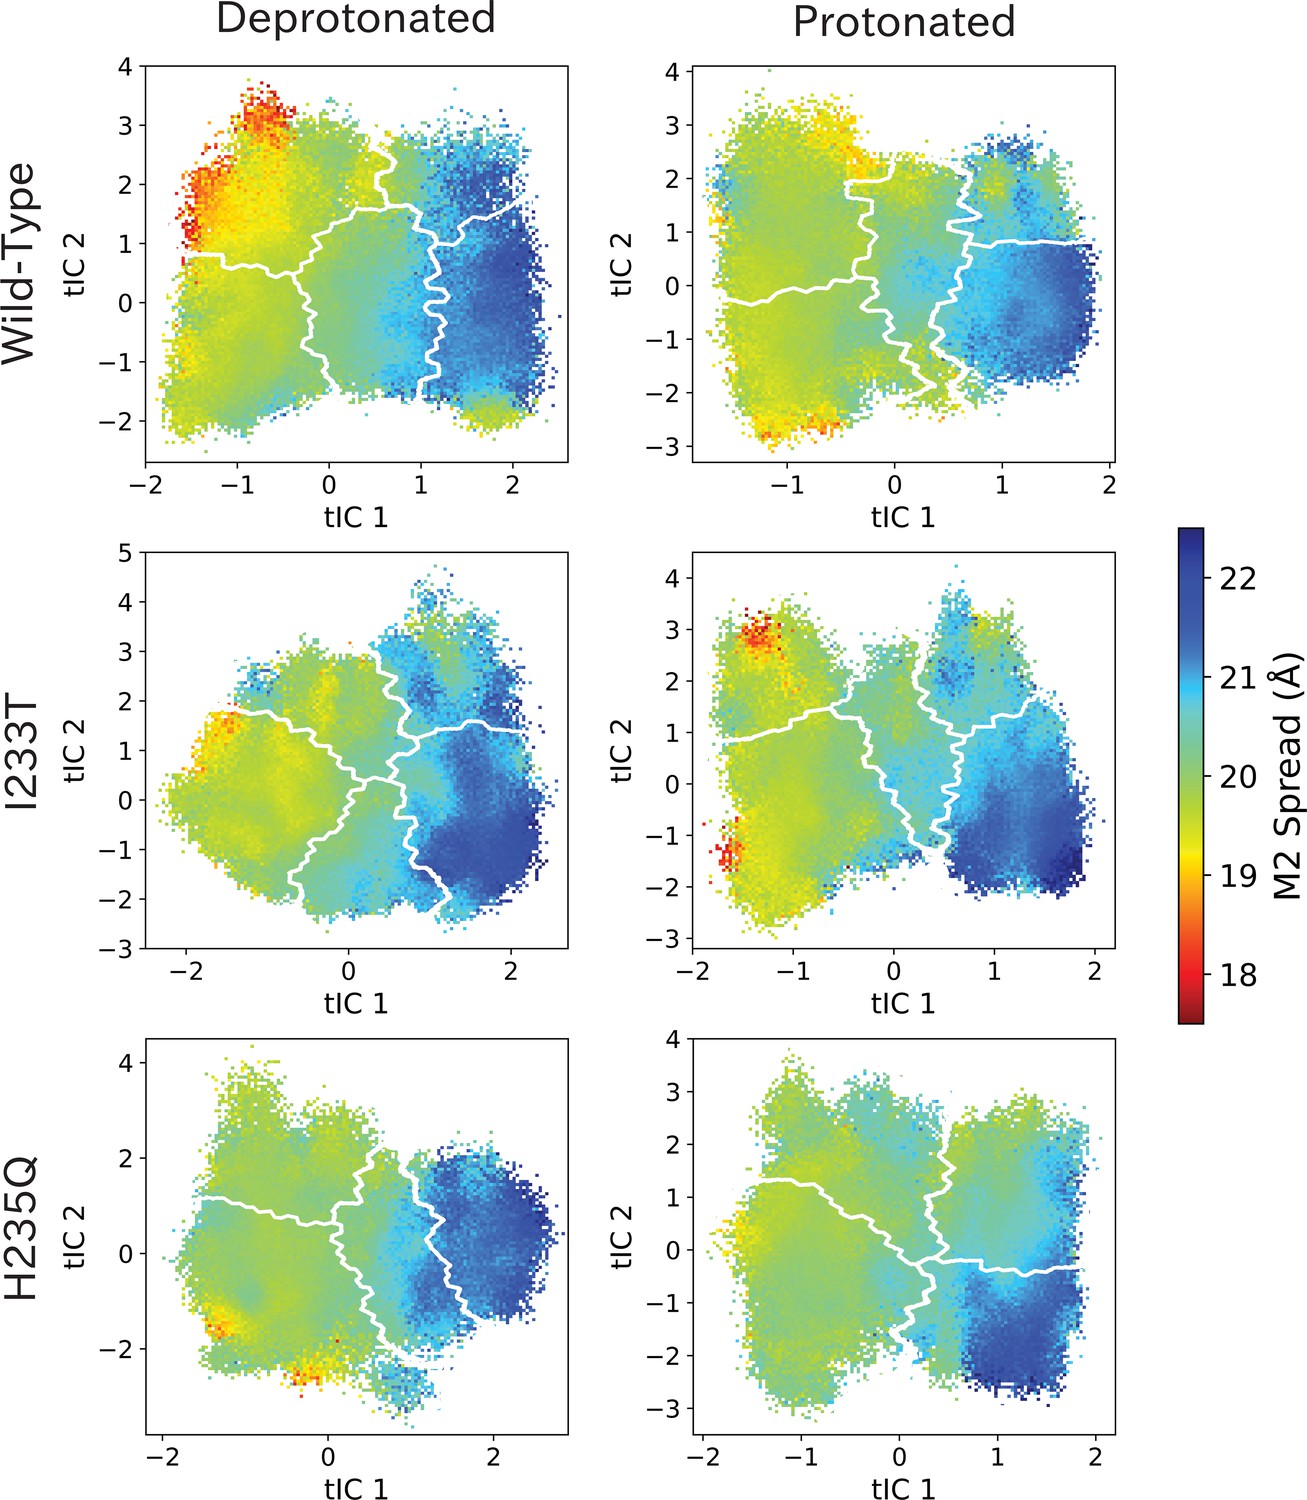
M2 spread values projected onto the first two tICs.
M2 spread values projected onto the first two tICs. Line contours represent the macrostates in Figure 4.
Figure 5—figure supplement 4
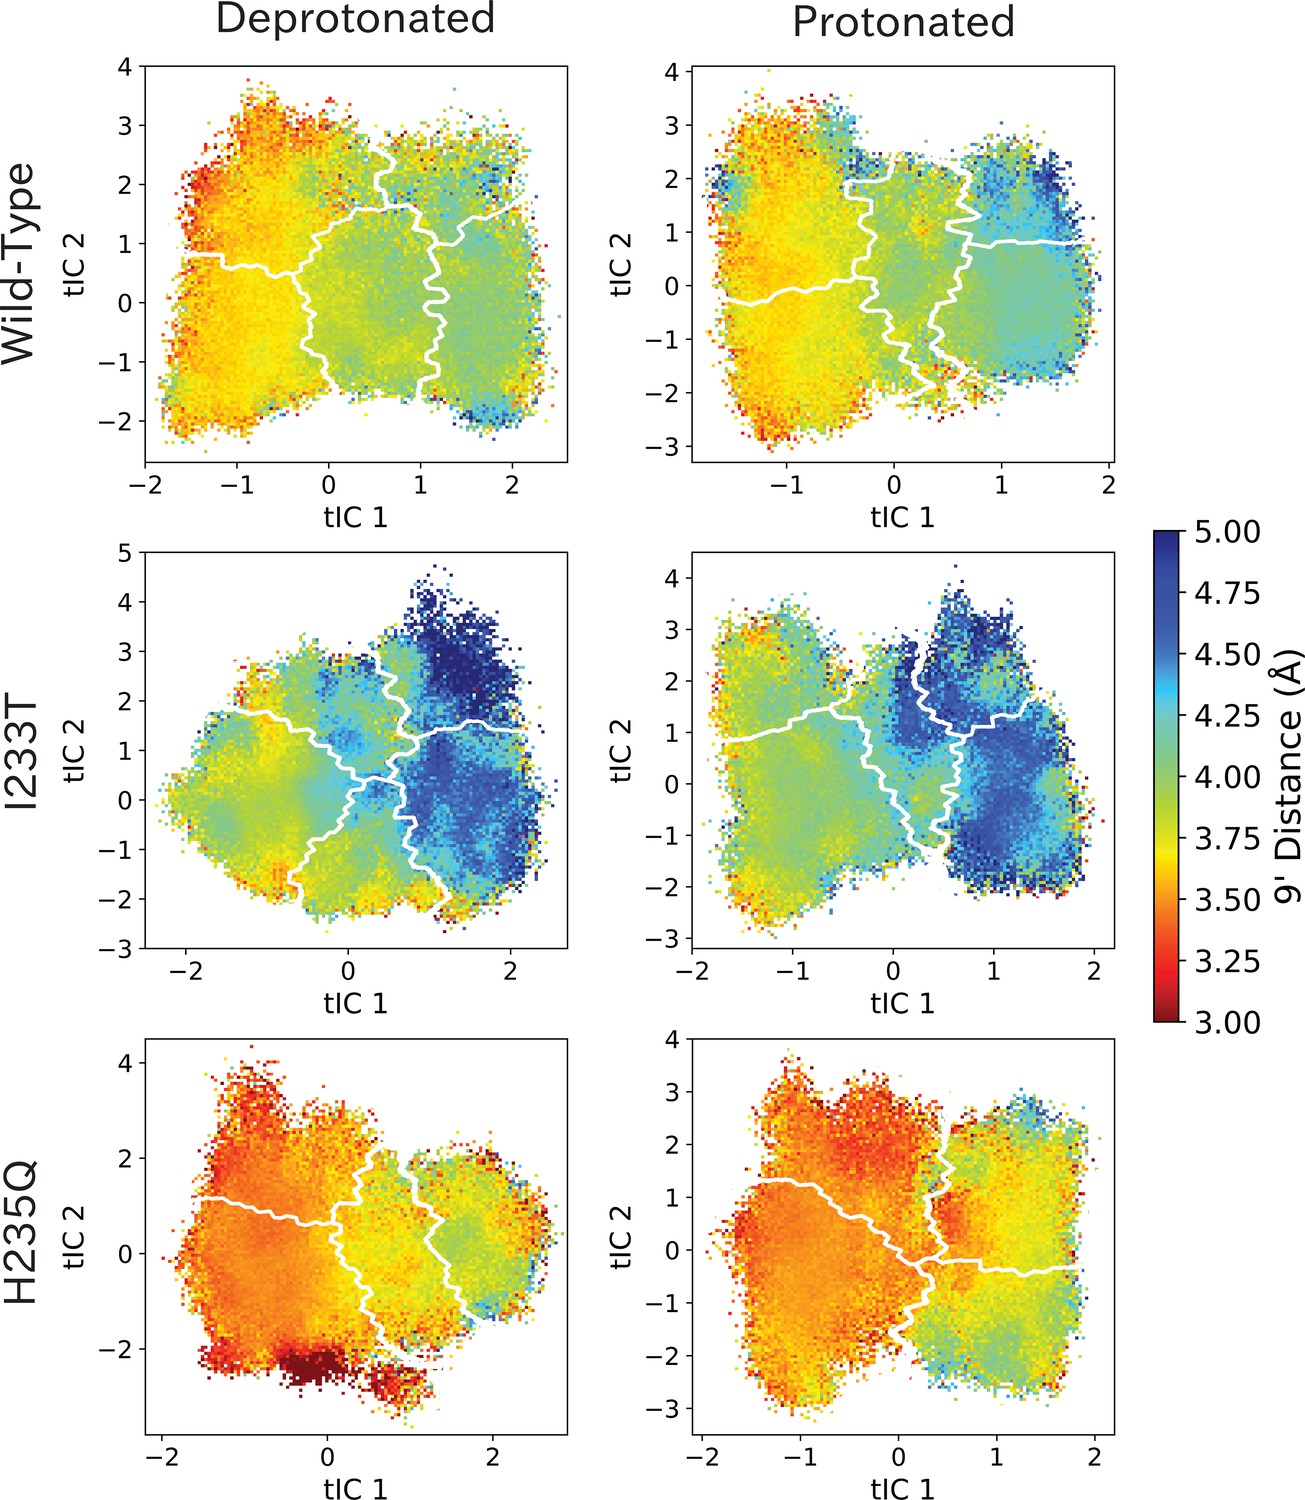
9’ distances projected onto the first two tICs.
9’ distances projected onto the first two tICs. Line contours represent the macrostates in Figure 4.
Figure 5—figure supplement 5
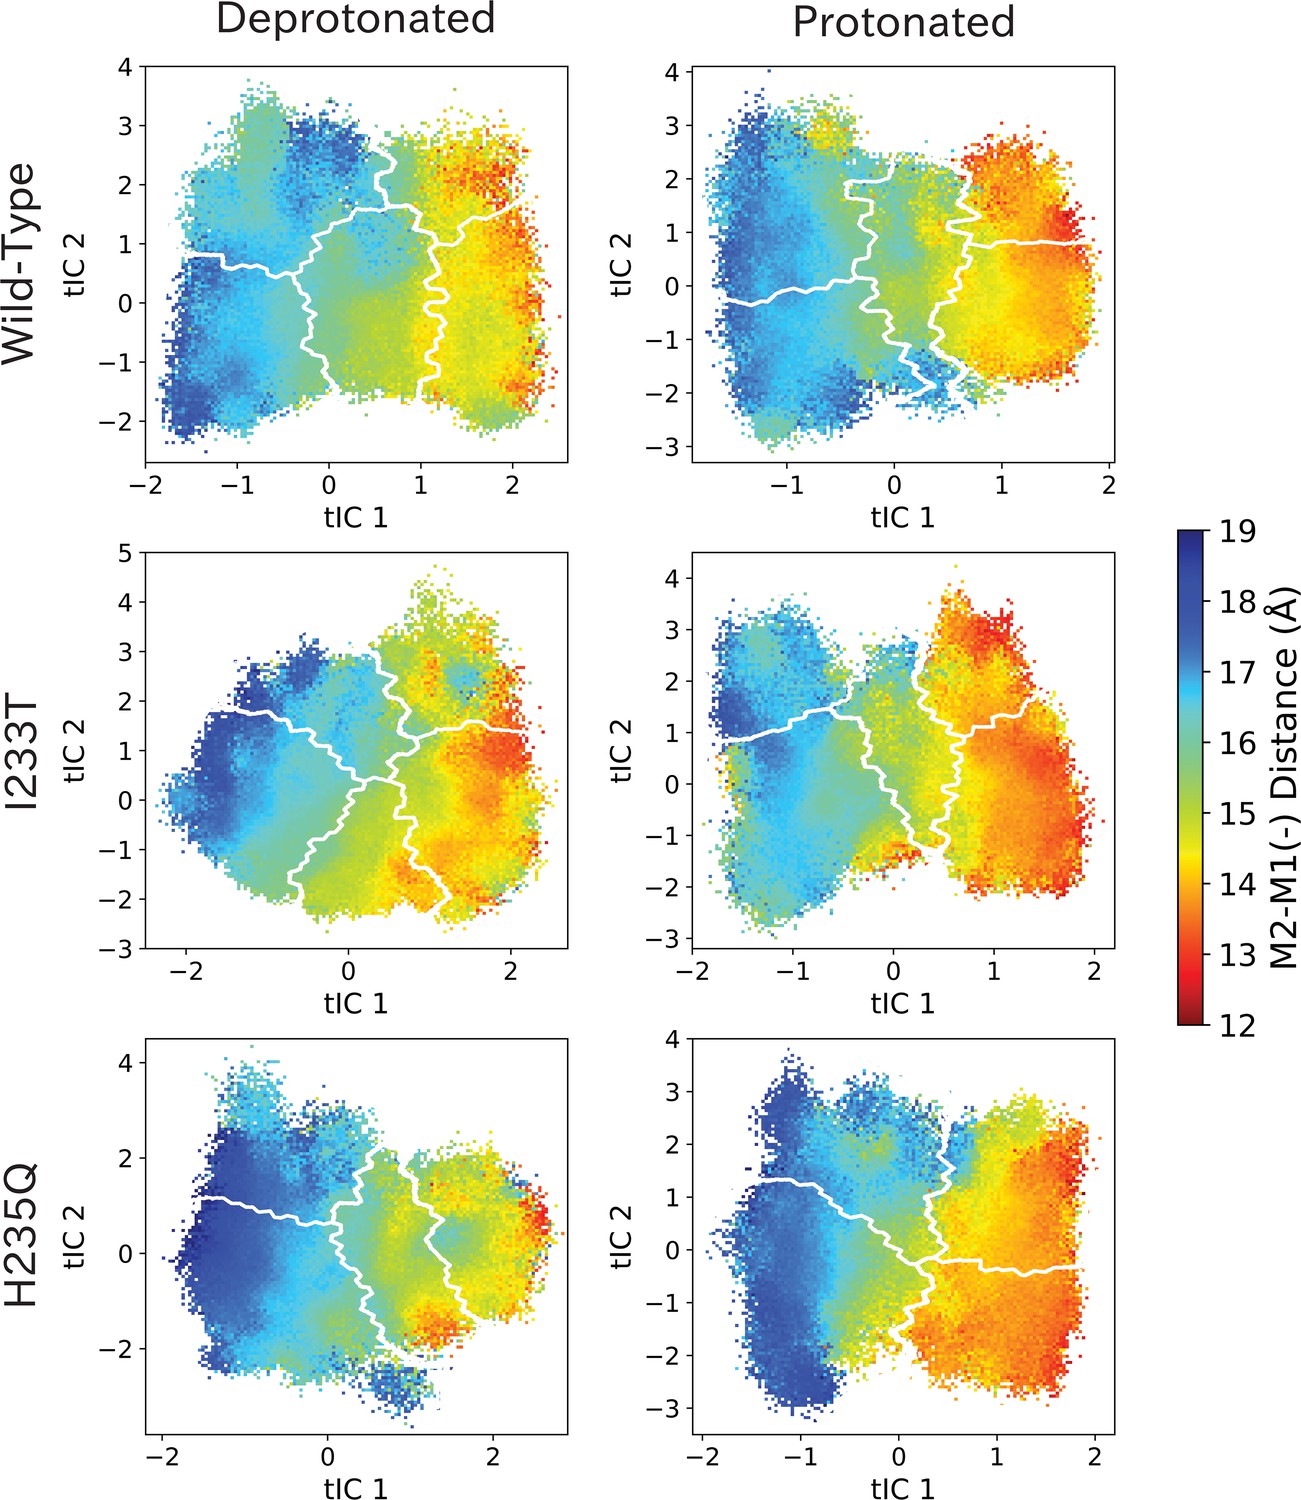
M2-M1(-) values projected onto the first two tICs.
M2-M1(-) values projected onto the first two tICs. Line contours represent the macrostates in Figure 4.
Figure 5—figure supplement 6
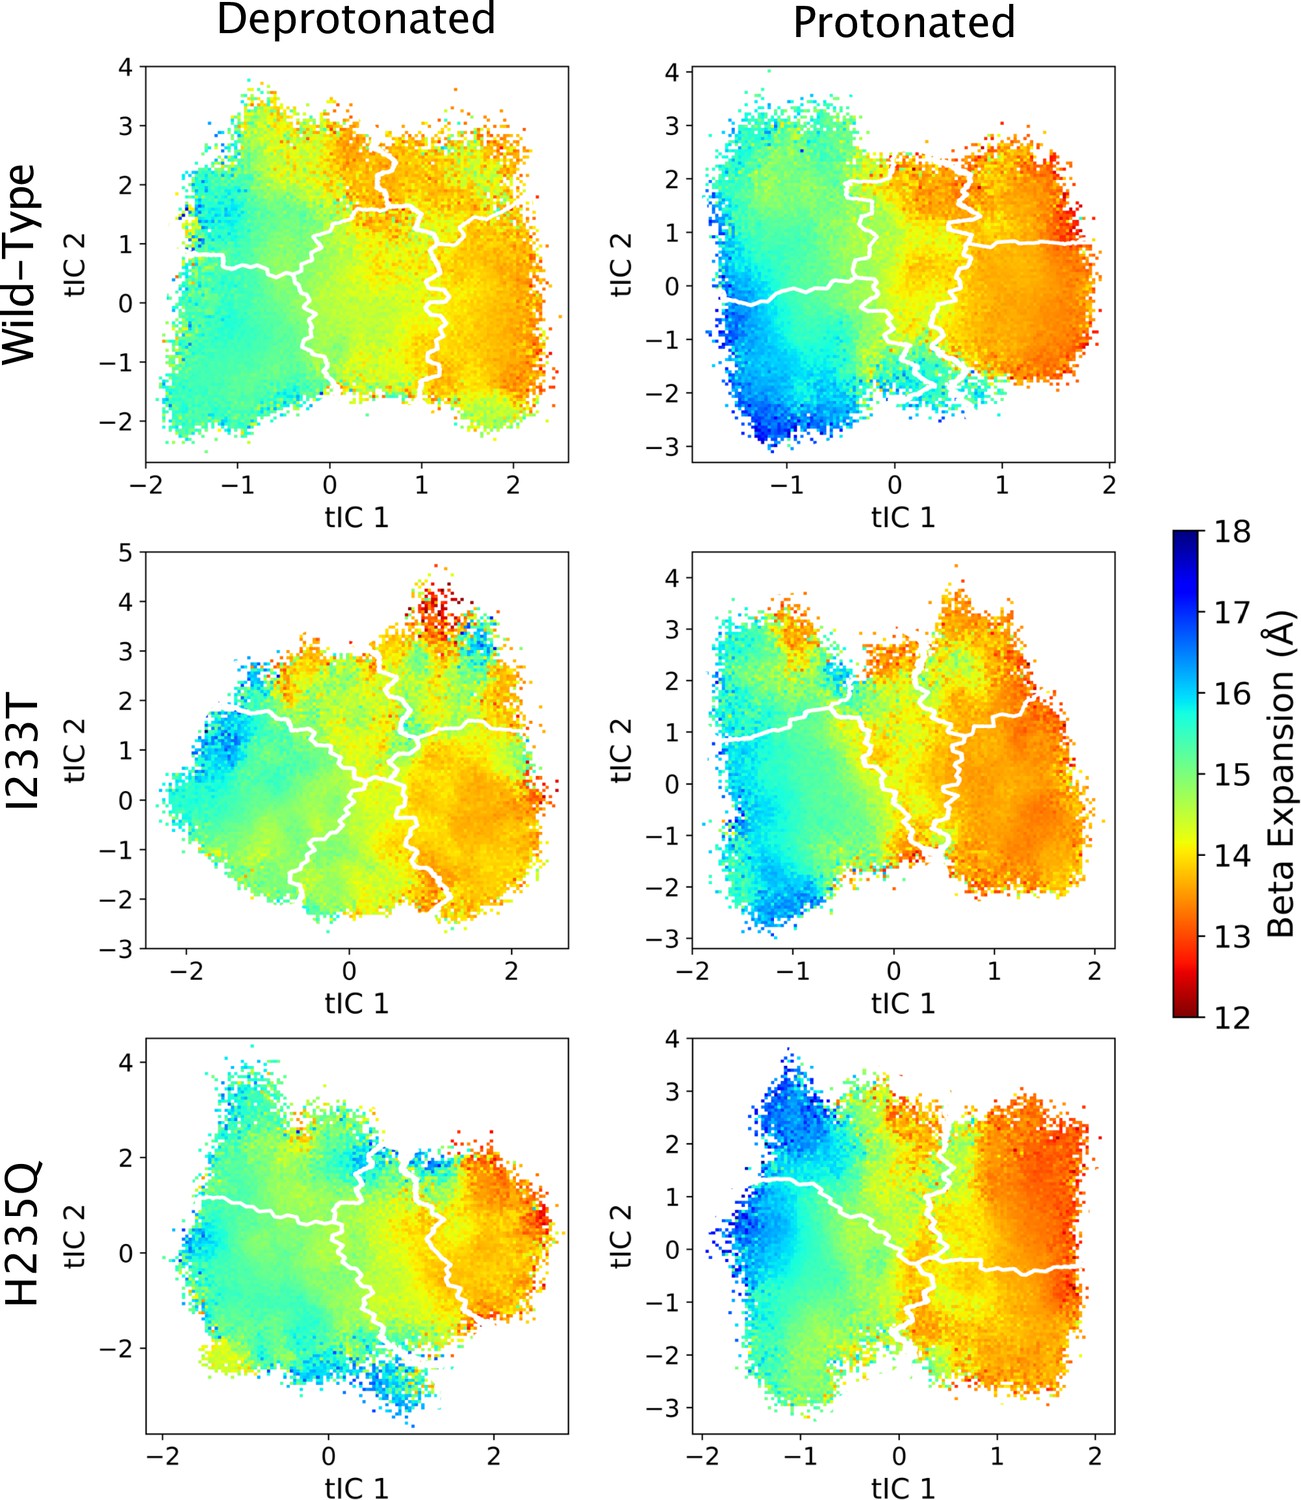
Beta expansion values projected onto the first two tICs.
Beta expansion values projected onto the first two tICs. Line contours represent the macrostates in Figure 4.
Figure 5—figure supplement 7
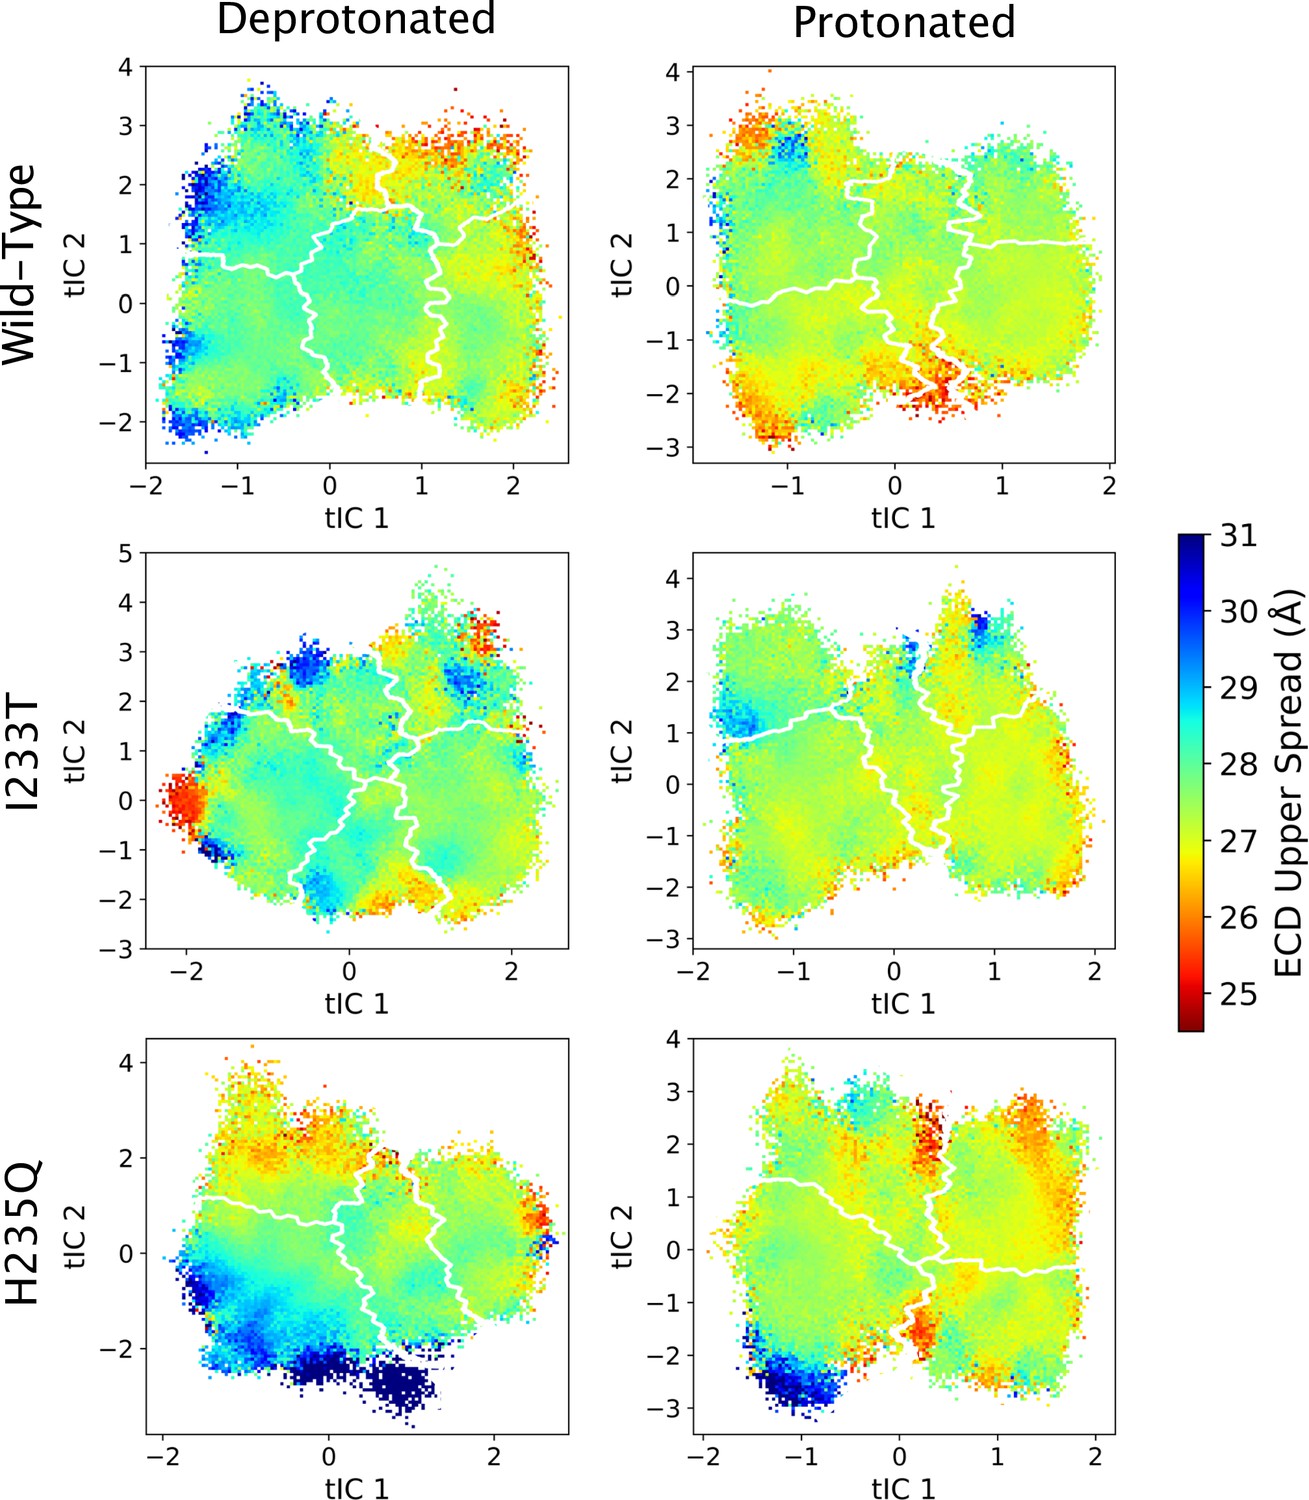
ECD upper spread values projected onto the first two tICs.
Line contours represent the macrostates in Figure 4.
Figure 5—figure supplement 8
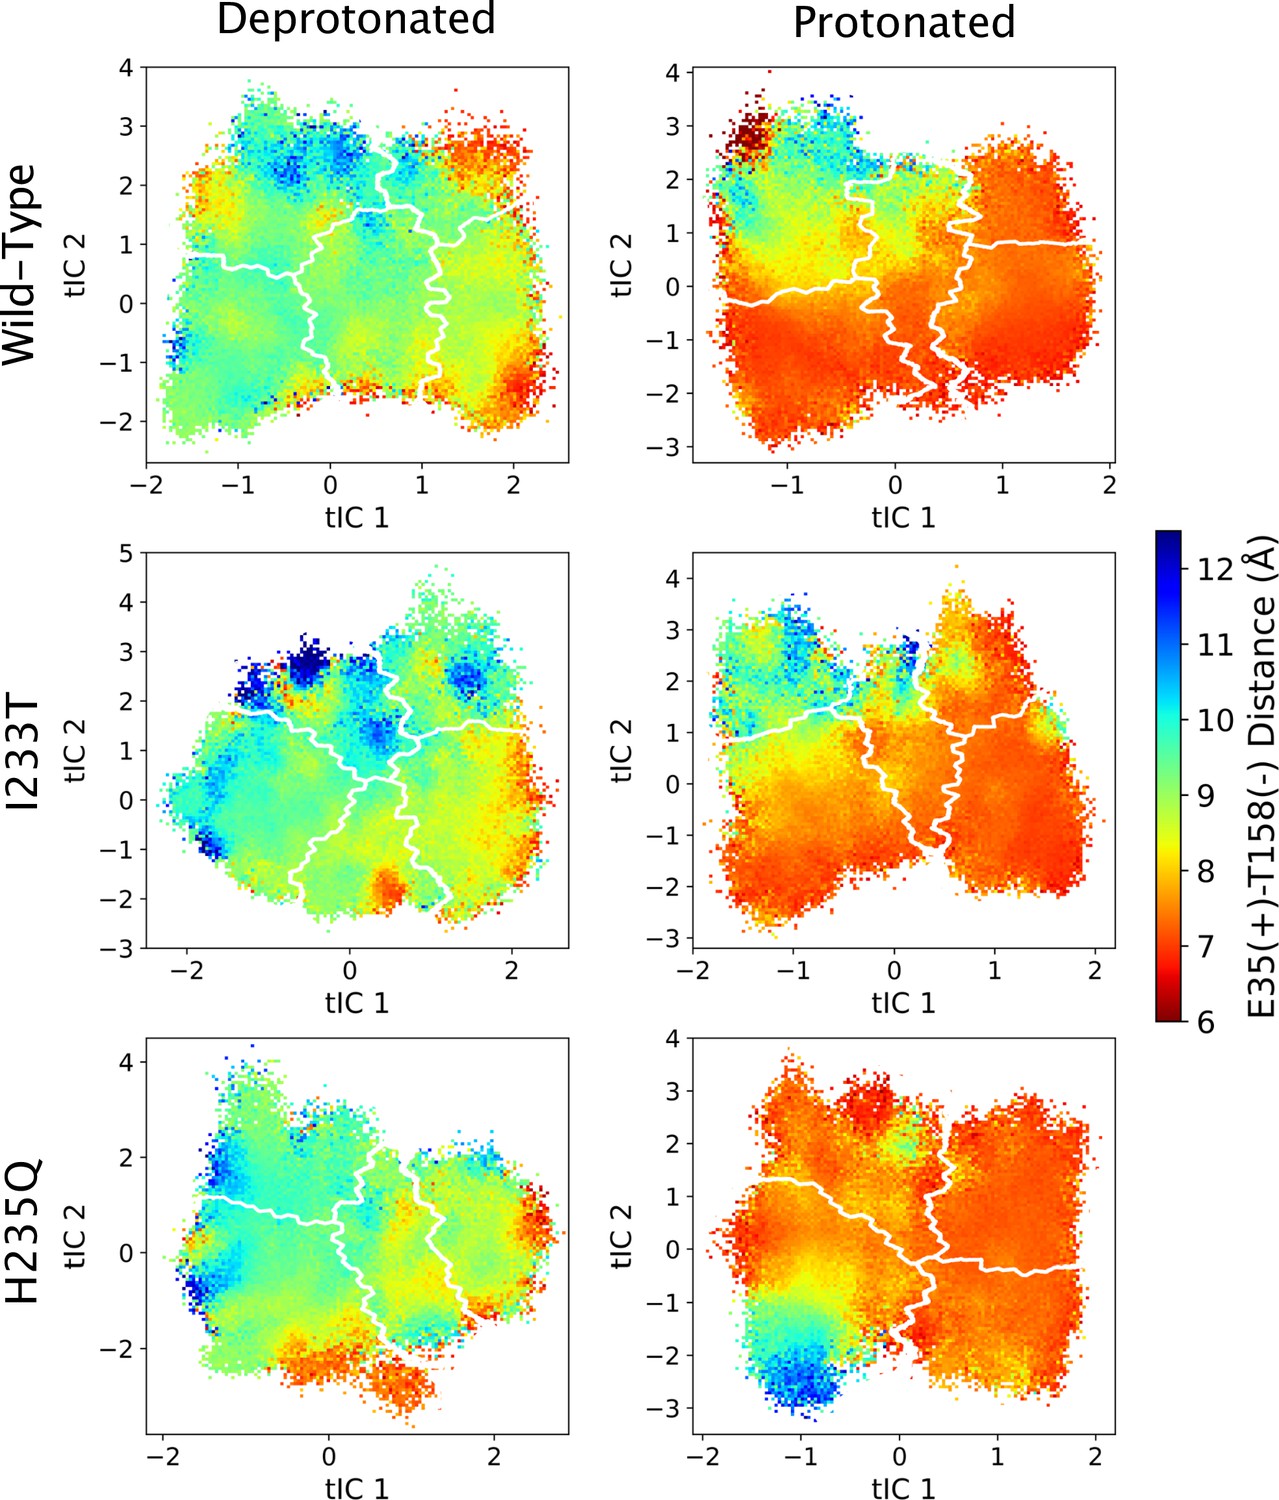
The distance between residues E35 and T158 projected onto the first two tICs.
Line contours represent the macrostates in Figure 4.
Figure 5—figure supplement 9
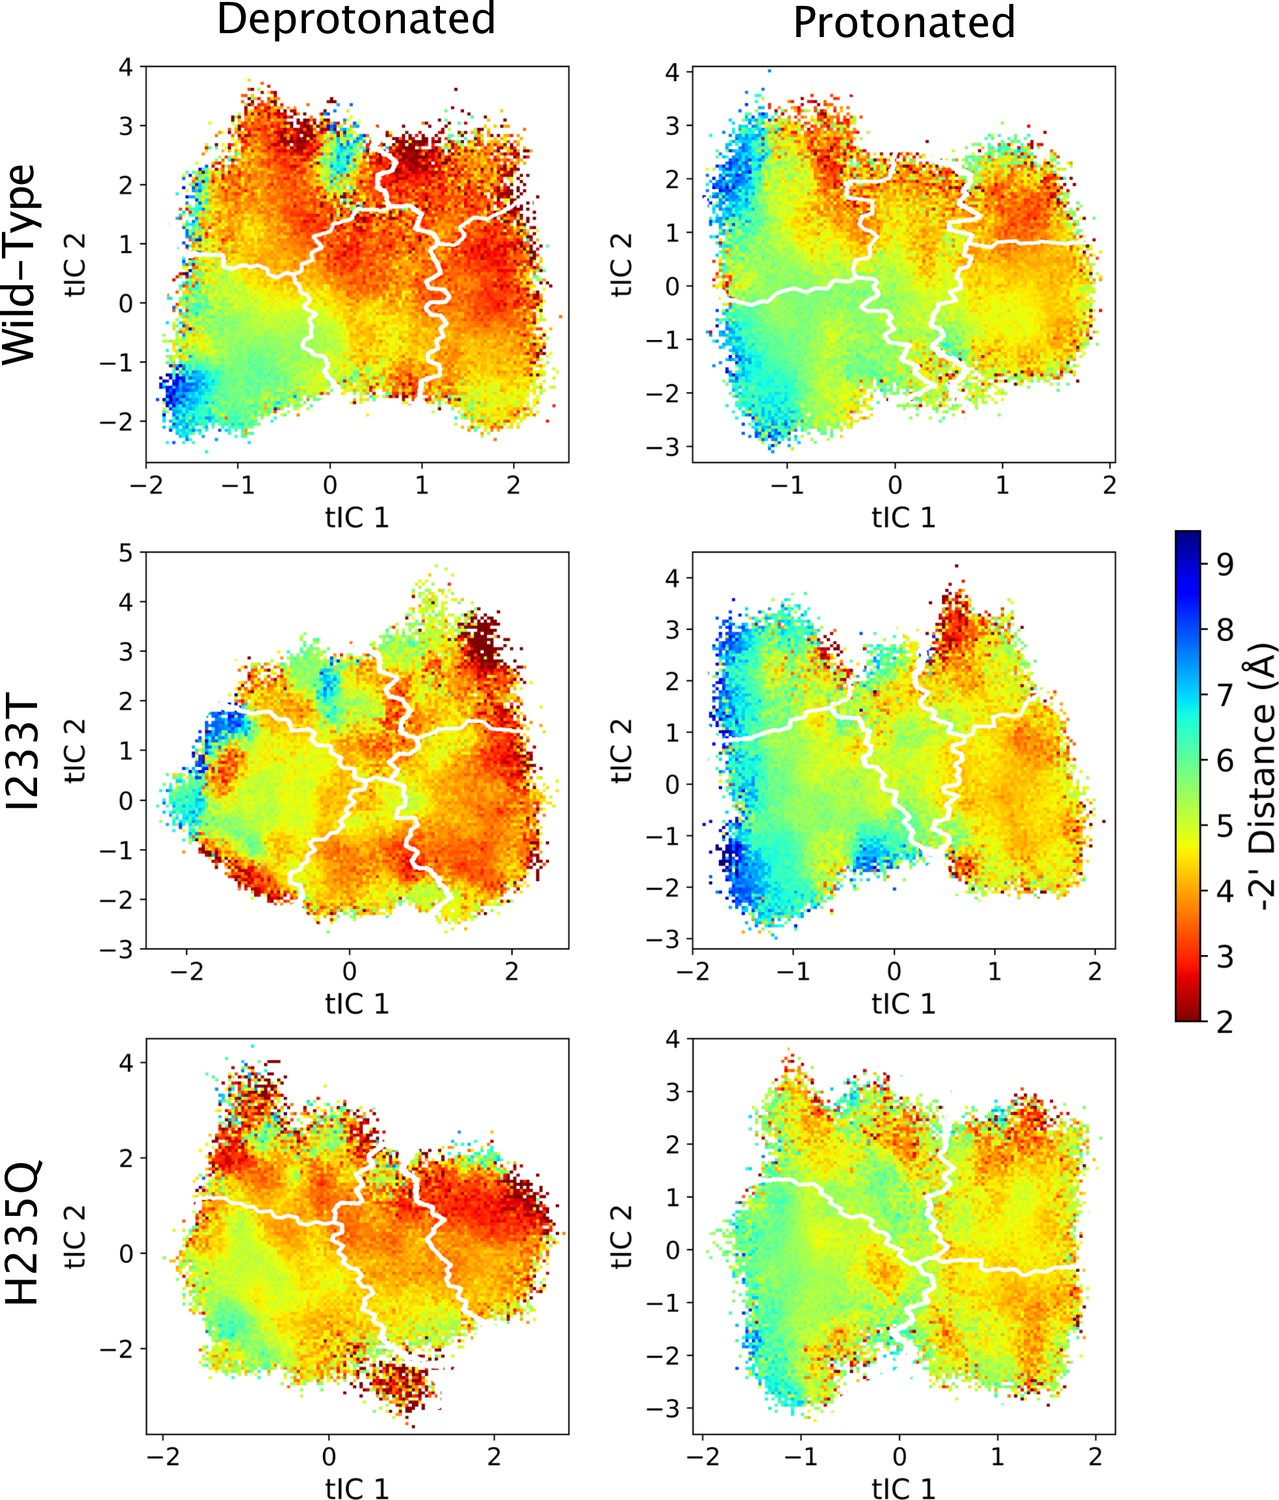
-2’ distances projected onto the first two tICs.
Line contours represent the macrostates in Figure 4.
Figure 5—figure supplement 10
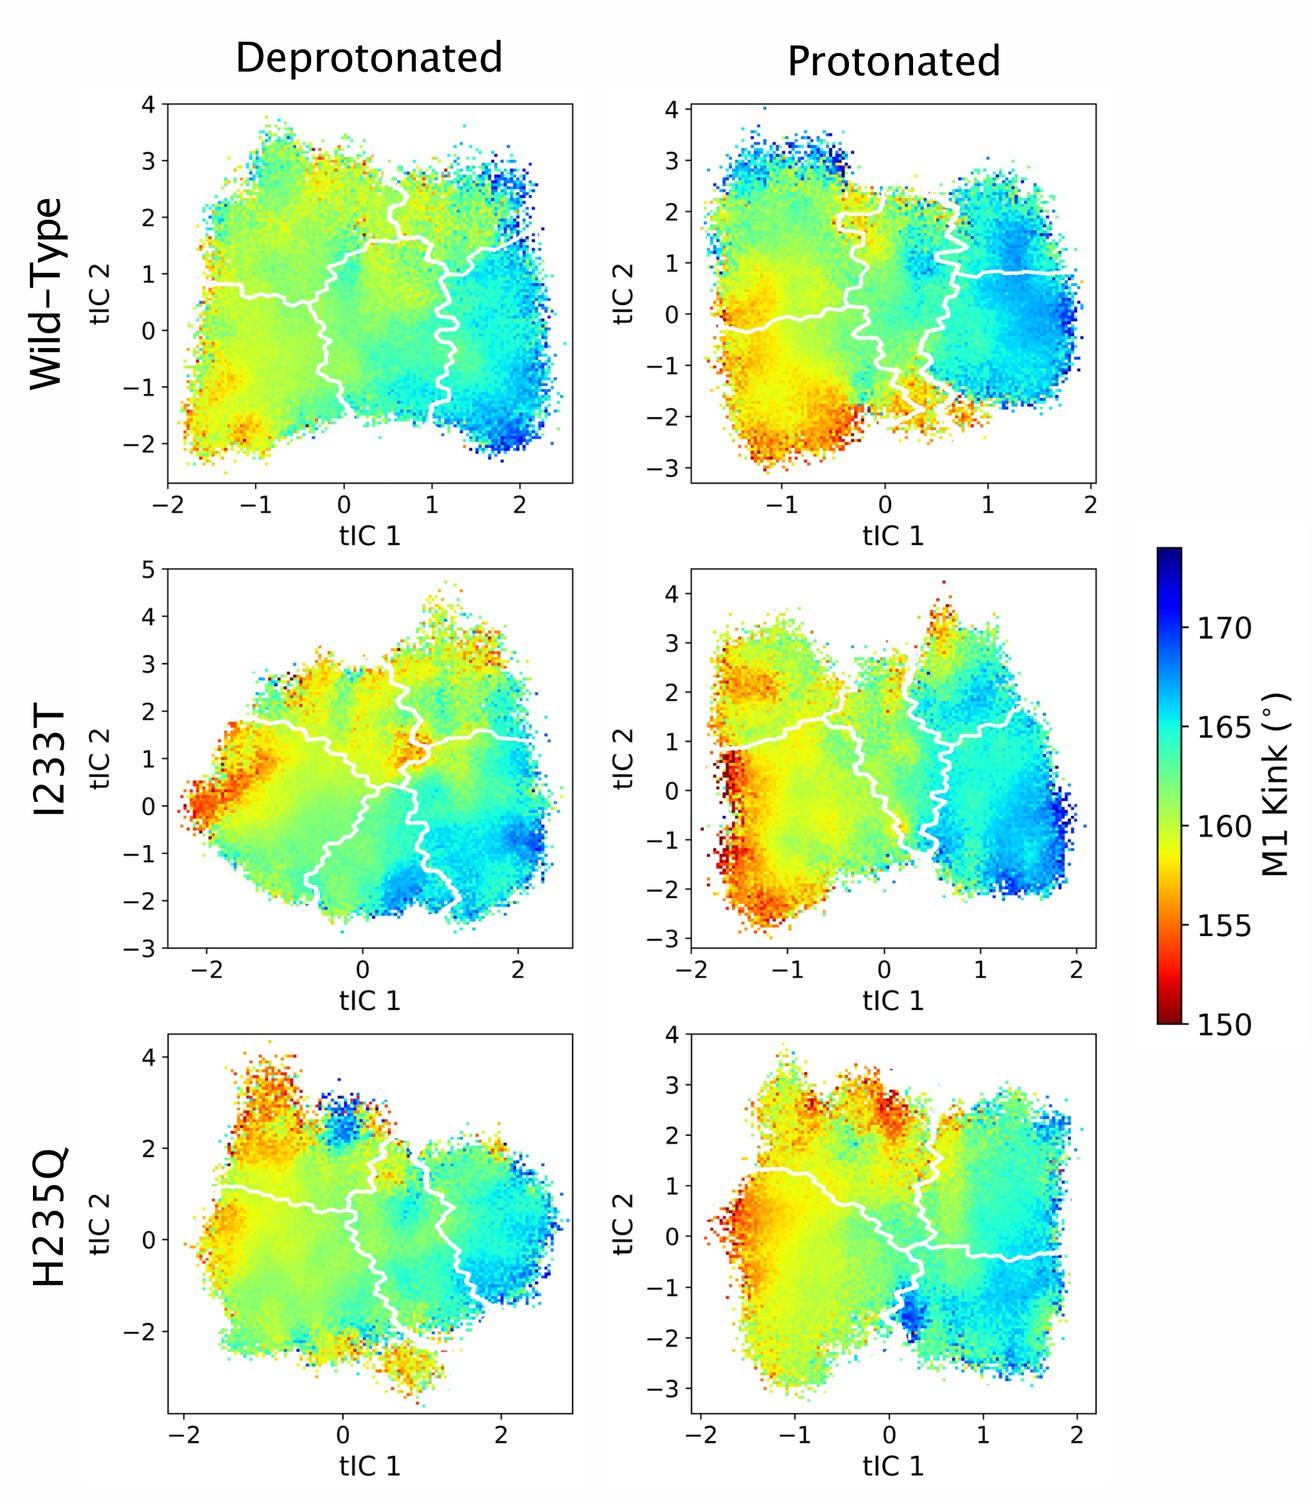
M1 kink values projected onto the first two tICs.
Line contours represent the macrostates in Figure 4.
Figure 5—figure supplement 11
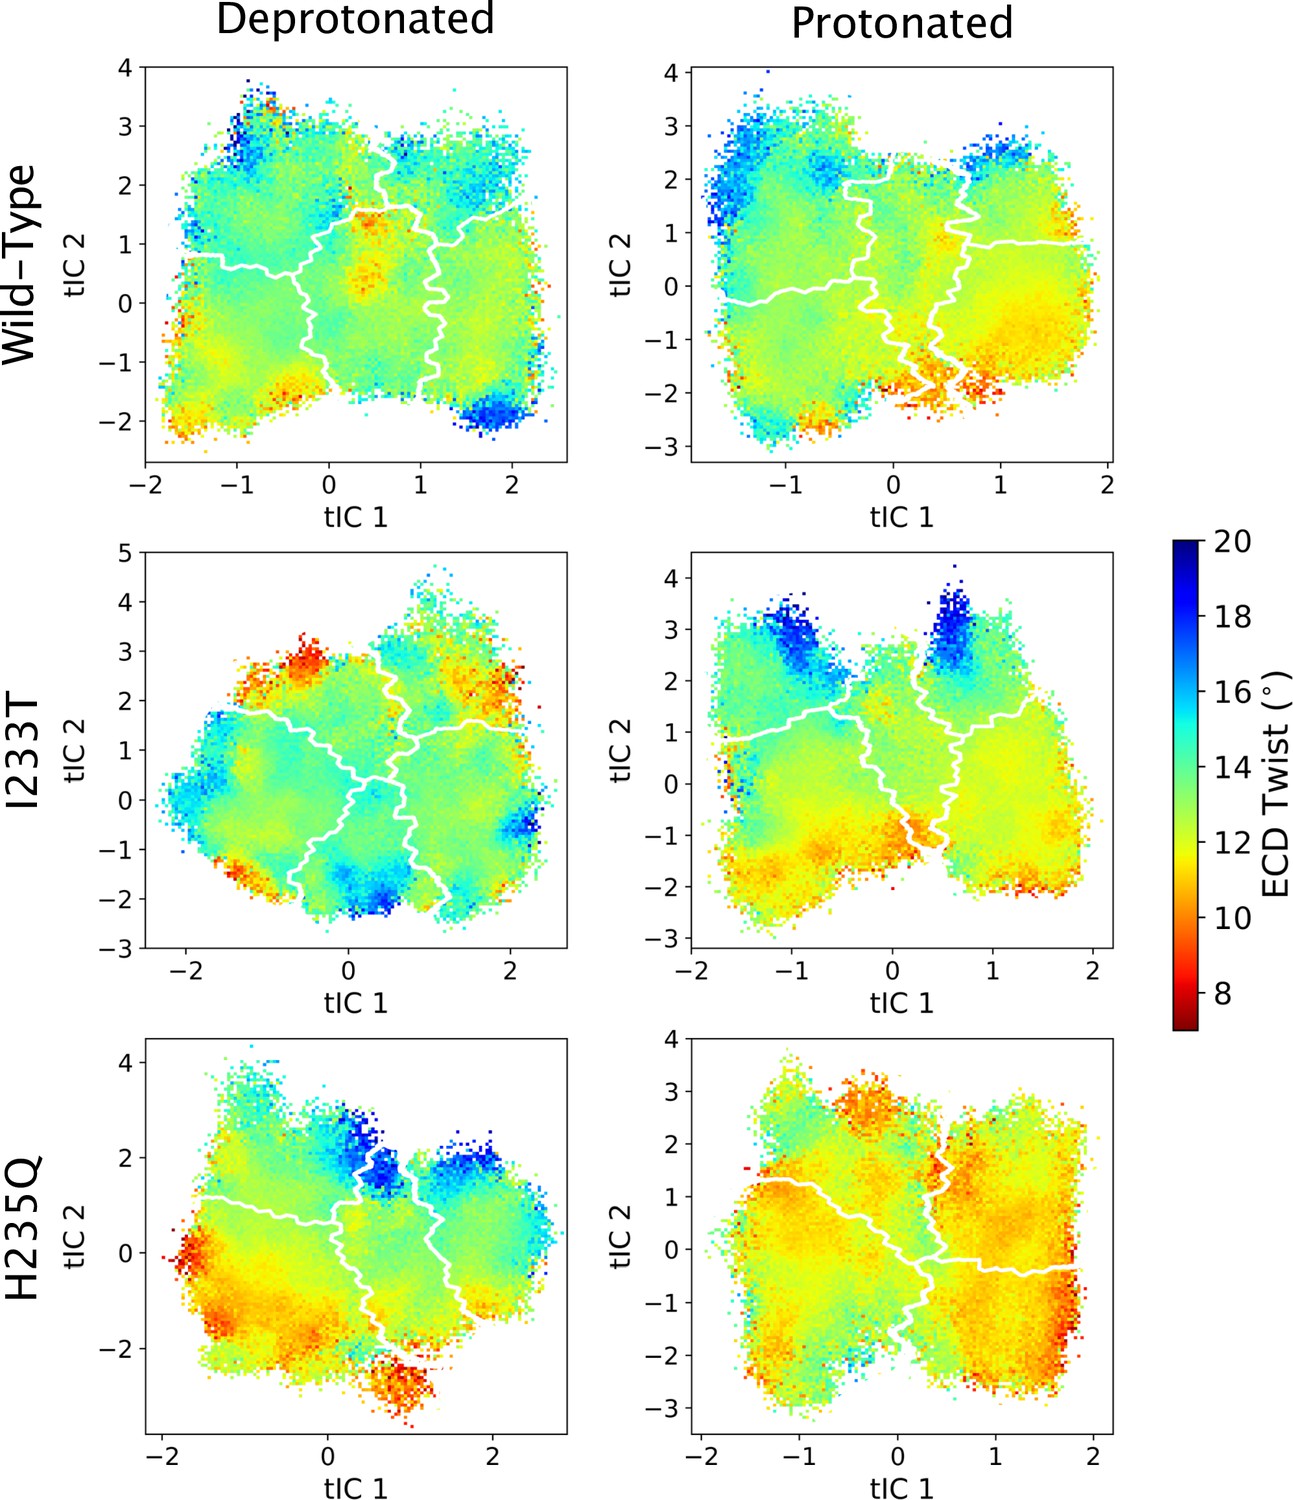
ECD twist values projected onto the first two tICs.
Line contours represent the macrostates in Figure 4.
Figure 6
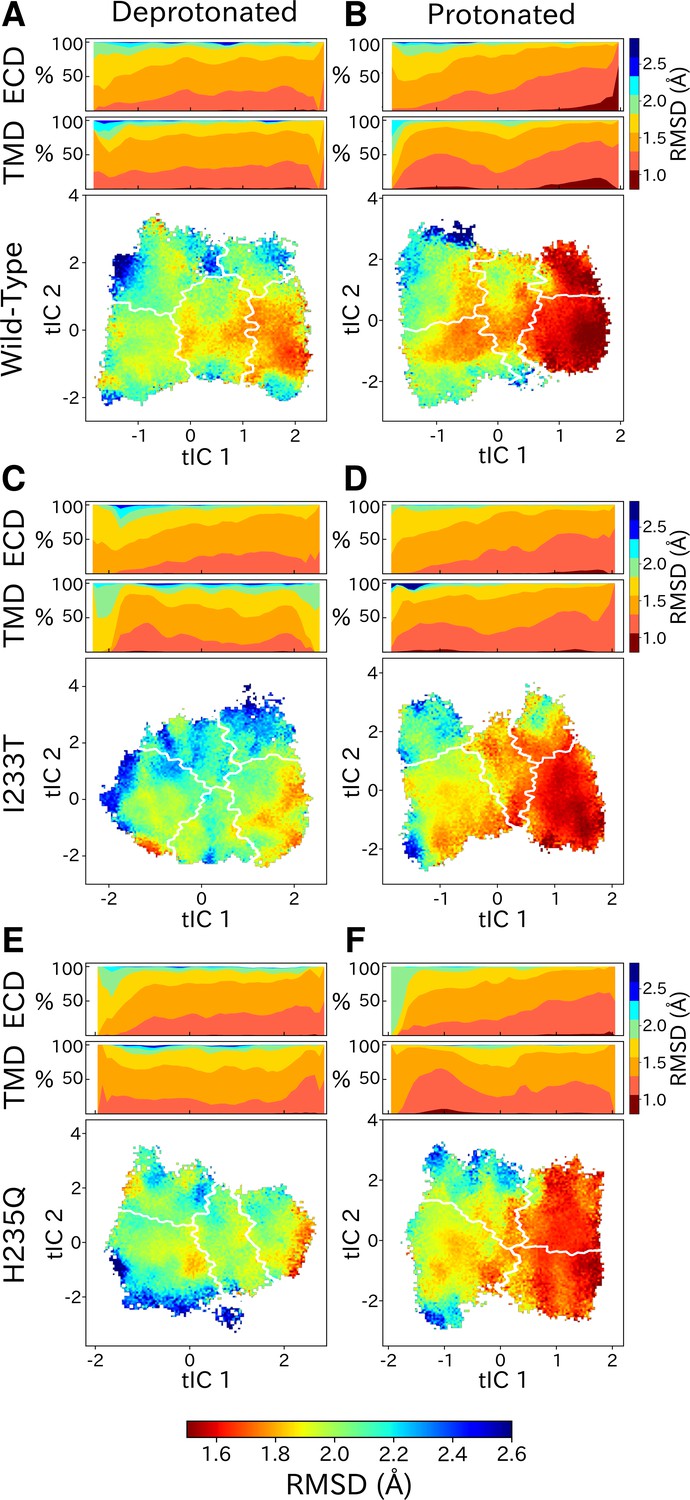
State- and protonation-dependent differences in ion channel symmetry.
Heatmaps show pairwise RMSDs between all subunits of the channel, measuring the conformational symmetry of the pentamer. The two top bars show pairwise RMSDs of the transmembrane (TMD) and extracellular (ECD) domains separately, represented as stacked histograms along tIC 1. At deprotonated conditions wild-type (A) and the two mutations I233T (C) and H235Q (E) show decreased levels of symmetry in both TMD, ECD and overall. At protonated conditions wild-type (B), the I233T (D), and H235Q mutations (F) display high levels of symmetry in the open state coming from both ECD and TMD. Notably, the symmetry of the ECD is decreasing during channel closure and total closed state symmetry is coming mainly from the TMD.
Figure 7
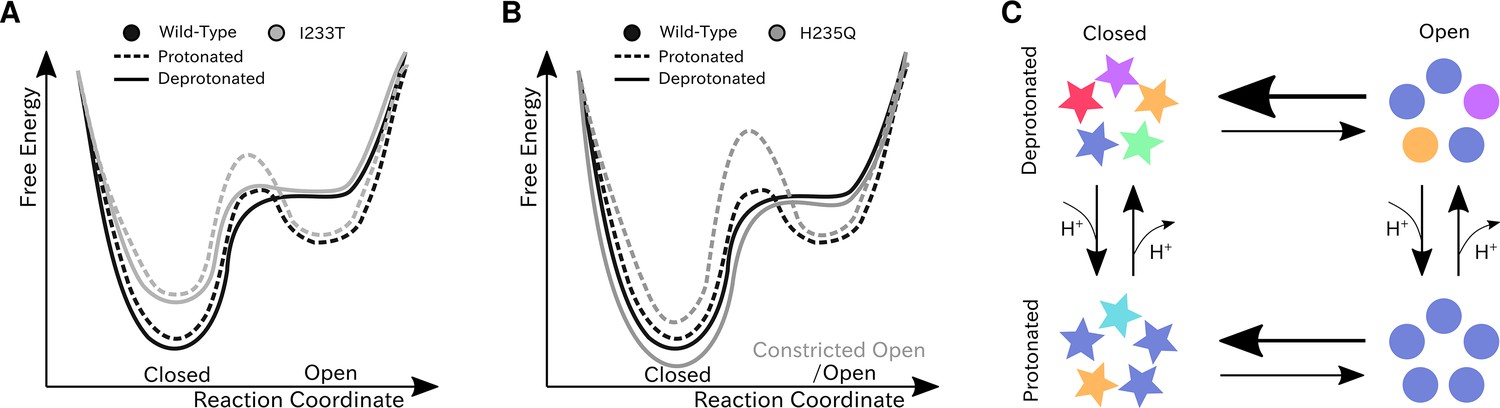
Proposed models for the free energy landscape and symmetrization in GLIC gating.
Sketches of the free-energy landscapes for protonated and deprotonated (A) wild-type and I233T variants, and (B) wild-type and H235Q variants. An open-state free energy well is formed when the channel is protonated, but only a small fraction of channels will be open at any point. The I233T mutation destabilizes the closed state (A), while the H235Q mutation results in open channels being trapped in a state with a more constricted pore behind a higher energy barrier (B). (C) Conformational symmetries of GLIC are affected by the protonation state. Upon protonation the open state displays a high level of symmetry, which is reduced to an intermediate level in the closed state. When deprotonated, the open state achieves an intermediate level of symmetry, which is reduces to low levels of symmetry in the closed state. This suggests that protonation is important for symmetrization of the open state.
Additional files
Download links
A two-part list of links to download the article, or parts of the article, in various formats.
Downloads (link to download the article as PDF)
Open citations (links to open the citations from this article in various online reference manager services)
Cite this article (links to download the citations from this article in formats compatible with various reference manager tools)
Markov state models of proton- and pore-dependent activation in a pentameric ligand-gated ion channel
eLife 10:e68369.
https://doi.org/10.7554/eLife.68369


