Preexisting memory CD4 T cells in naïve individuals confer robust immunity upon hepatitis B vaccination
- Laboratory of Experimental Hematology (LEH), Vaccine and Infectious Disease Institute, University of Antwerp, Belgium
- Antwerp Unit for Data Analysis and Computation in Immunology and Sequencing, University of Antwerp, Belgium
- Adrem Data Lab, Department of Mathematics and Computer Science, University of Antwerp, Belgium
- Biomedical Informatics Research Network Antwerp, University of Antwerp, Belgium
- Department of Medical Genetics, University of Antwerp, Belgium
- Centre for Health Economics Research & Modeling Infectious Diseases, Vaccine & Infectious Disease Institute (VAXINFECTIO), University of Antwerp, Belgium
- Department of Clinical Microbiology, Antwerp University Hospital, Belgium
- Department of Immunology, St. Jude Children's Research Hospital, United States
- Center for Cell Therapy and Regenerative Medicine, Antwerp University Hospital, Belgium
- Histocompatibility and Immunogenetic Laboratory, Rode Kruis-Vlaanderen, Belgium
- Centre for the Evaluation of Vaccination (CEV), Vaccine and Infectious Disease Institute, University of Antwerp, Belgium
- Antwerp Center for Translational Immunology and Virology (ACTIV), Vaccine and Infectious Disease Institute, University of Antwerp, Belgium
- Department of Paediatrics, Antwerp University Hospital, Belgium
Figures
Figure 1 with 1 supplement
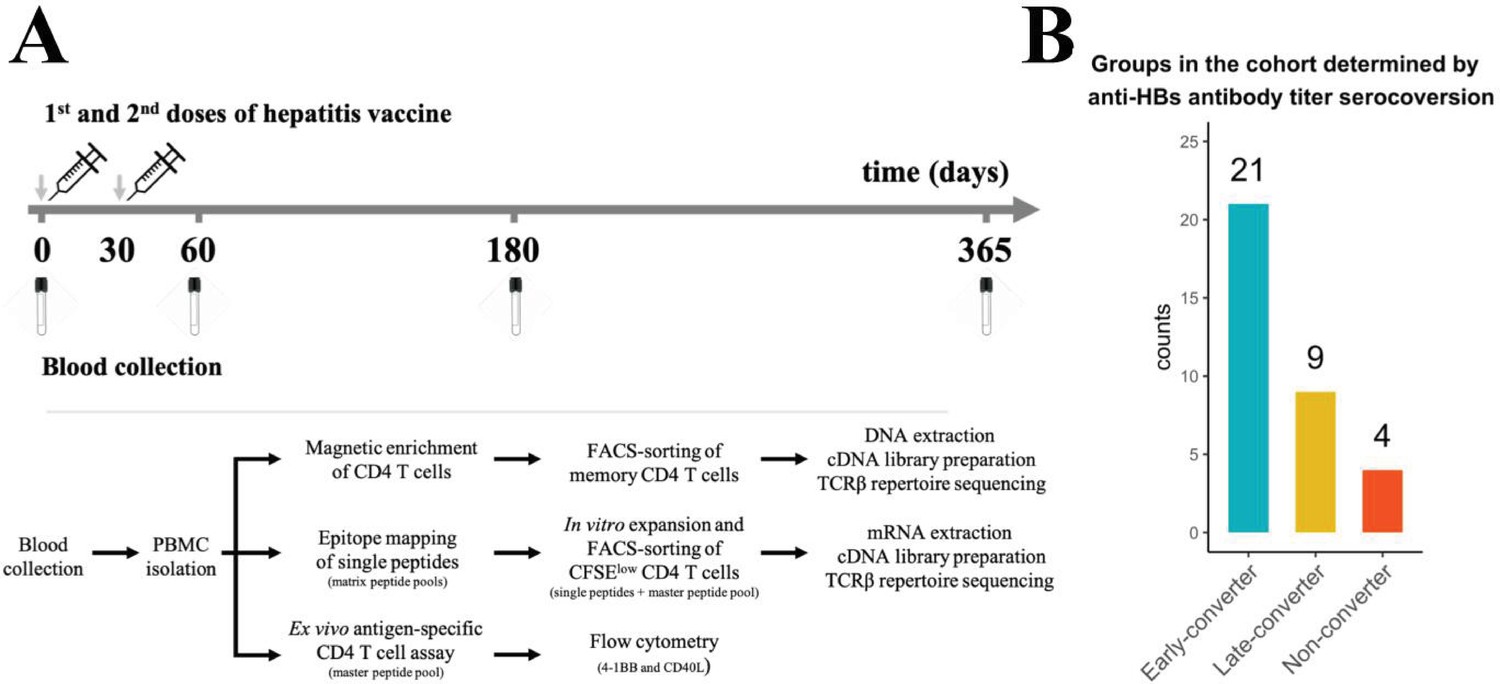
Hepatitis B vaccination (Engerix-B) study design.
(A) Hepatitis B (Engerix-B) vaccination and experimental design. (Top) Timeline of vaccination and blood collection. (Bottom) Memory CD4 T cells were magnetically enriched and FACS-sorted from two time points (day 0 and day 60) for TCRβ repertoire sequencing. Peptide matrix pools were used to map CD4 T cell epitopes of the vaccine from peripheral blood mononuclear cells (PBMCs) collected at day 60 and to select single peptides. After 7 days of in vitro expansion, single peptide-specific and master peptide pool-specific CFSElow CD4 T cells from PBMCs collected at day 60 were FACS-sorted in two technical replicates for TCRβ repertoire sequencing. PBMCs collected at days 0, 60, 180, and 365 were stimulated with the master peptide pool (HBsAg) and assessed for converse expression of 4-1BB and CD40L by flow cytometry. (B) Vaccinee cohort can be classified into three groups as determined by anti-hepatitis B surface (anti-HBs) titer over four times points. Early-converters seroconverted at day 60, late-converters seroconverted at day 180 or day 365, and non–converters did not have an anti-HBs titer higher than 10 IU/ml at any of the time points.
Figure 1—figure supplement 1

Serological memory to hepatitis B vaccine and vaccinee groups within the cohort.
(A) Anti-hepatitis B surface (anti-HBs) titer of vaccinees over four times points, faceted by groups of early-, late-, and non-converters. An anti-HBs titer above 10 IU/ml was considered protective. Early-converters seroconverted at day 60, late-converters seroconverted at day 180 or day 365, and non–converters did not have an anti-HBs titer higher than 10 IU/ml at any of the time points. (B) Cytomegalovirus (CMV), Epstein-Barr virus (EBV), and herpes simplex virus (HSV) seropositivity in the three groups of the cohort as determined by serum IgG antibodies to CMV, EBV viral-capsid antigen (EBV-VCA), and HSV-1 and -2 using sandwich ELISA. (C) Age of vaccinees per group. Statistical significance was indicated with ns p > 0.05, *p ≤ 0.05, **p ≤ 0.01, ***p ≤ 0.001, ****p ≤ 0.0001.
Figure 2 with 1 supplement

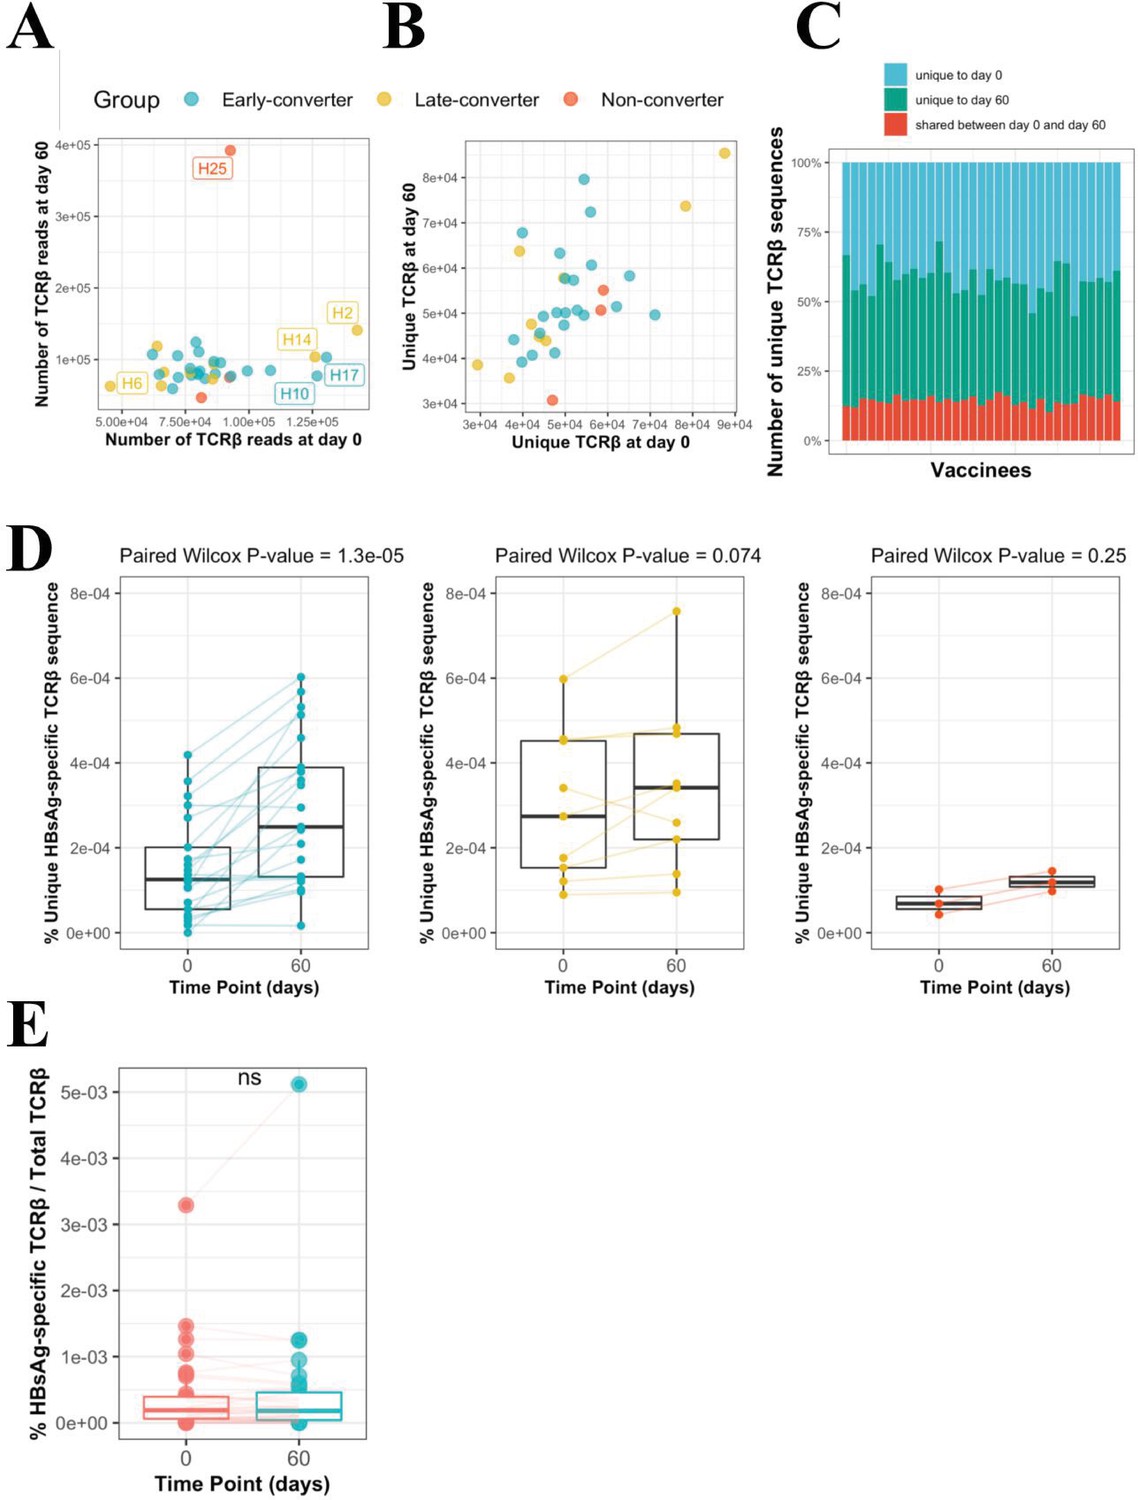
CD4 T cell memory T cell receptor β (TCRβ) repertoire and vaccine-specific TCRβ clonotypes.
(A) Comparison of the memory CD4 TCRβ repertoire diversity, as shown by breadth (number of unique TCRs) and entropy (Shannon equitability index) between day 0 and day 60. Indices are available in Figure 2—source data 1. (B) Frequency of unique vaccine-specific TCRβ sequences out of total sequenced TCRβ sequences between two time points for all vaccinees colored by group. Frequencies are available in Figure 2—source data 2. (C) Sequenced CD4+ TCR memory repertoire of vaccinee H35 at day 60. Each TCR clonotype is represented by a node. TCRs are connected by an edge if their Hamming distance is one. Only clusters with at least three TCRs are shown. TCR clonotypes in red are the vaccine-specific TCRβ sequences that were not present prior to vaccination. (D) Frequency of vaccine-specific TCRβ sequences within memory CD4 T cell repertoire normalized by number of HBsAg-specific TCRβ sequences found for each vaccinee at time point 60. Frequencies are available in Figure 2—source data 3.
-
Figure 2—source data 1
Breadth and entropy of T cell receptor β (TCRβ) repertoire.
Breadth (number of unique TCRs) and entropy (Shannon equitability index) of the memory CD4 TCRβ repertoire at two time points, day 0 and day 60.
- https://cdn.elifesciences.org/articles/68388/elife-68388-fig2-data1-v3.csv
-
Figure 2—source data 2
Frequency of unique hepatitis B surface antigen (HBsAg)-specific T cell receptor β (TCRβ) sequences.
Frequency of unique HBsAg-specific TCRβ sequences out of unique total TCRβ sequences in the memory CD4 T cell repertoire at two time points, day 0 and day 60.
- https://cdn.elifesciences.org/articles/68388/elife-68388-fig2-data2-v3.csv
-
Figure 2—source data 3
Frequency of normalized hepatitis B surface antigen (HBsAg)-specific T cell receptor β (TCRβ) sequences.
Frequency of vaccine-specific TCRβ sequences within memory CD4 T cell repertoire normalized by number of HBsAg-specific TCRβ sequences found for each vaccinee at day 60.
- https://cdn.elifesciences.org/articles/68388/elife-68388-fig2-data3-v3.csv
Figure 2—figure supplement 1
CD4 T cell memory T cell receptor β (TCRβ) repertoire and vaccine-specific TCRβ clonotypes.
(A) Scatter plot of the DNA-based TCRβ reads for each vaccinee at each time point. (B) Scatter plot of number of unique TCRβ amino acid sequences for each vaccinee at each time point, where the shape denotes the response as based on antibody titer. (C) Overview of unique TCRβ amino acid sequences in the memory CD4 T cell repertoire of each vaccinee. The bottom blue bar denotes those TCR sequences that were found at both time points. The green and red bars denote the number of unique TCR sequences at each time point. The total bar height thus represents the total number of unique memory CD4 T cell clonotypes sequences for a specific vaccinee. (D) Frequency of unique HBsAg-specific TCRβ sequences out of total sequenced TCRβ sequences between two time points for all vaccinees colored and faceted by group. (E) Change in frequency (clone read count/total counts) of those HBsAg-specific CD4 T cells present at both time points. The (ns) mark denotes a non-significant paired Wilcoxon signed-rank test (p-value = 0.7577). (F) Receiver operating characteristic (ROC) curve using Rhbs to differentiate between age-matched early-converters and late-converters in a leave-one-out cross-validation at day 0. Age-matching was accomplished retaining only samples in the age range 40–55. A Wilcoxon test was used to confirm that there was no difference in age distributions between early- and late-converters (p-value = 0.60, mean EC = 44.5 years, mean LC 45.1 years). Diagonal line denotes a random classifier. Reported is the area under the curve (AUC) and its 95% confidence interval.
Figure 3 with 1 supplement
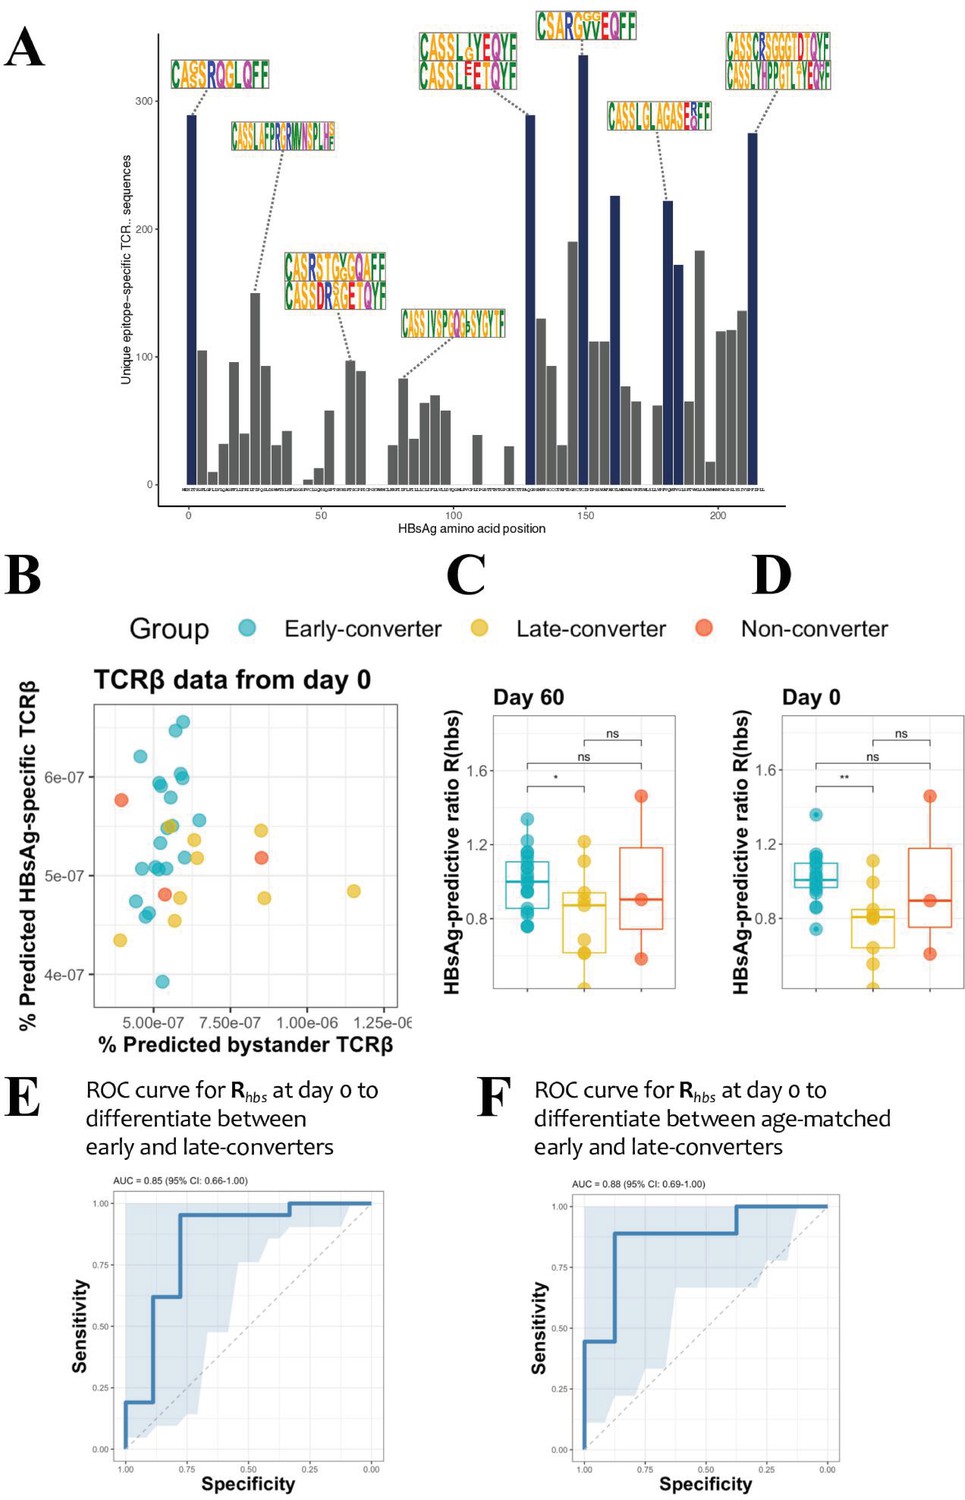
Hepatitis B surface antigen (HBsAg) peptide-specific T cell receptor β (TCRβ) identification and predictive potential of Rhbs.
(A) Overview of the detected HBsAg epitope-specific TCRβ sequences. Each bar corresponds to unique TCRβ sequences found against a single 15mer HBsAg peptide, with 11 amino acid overlap to each subsequent peptide. Bars in blue denote those epitopes for which 10 or more volunteers had a strong T cell reaction. Motif logos on top of bars denote a sampling of the most common TCRβ amino acid sequence motifs for those epitopes. (B) Scatter plot with the frequency of predicted HBsAg epitope-specific and bystander TCRβ sequences at day 60. These make up respectively the numerator and denominator of the HBsAg-predictive ratio, Rhbs. Predictions done as a leave-one-out cross-validation. Each circle represents a vaccinee with the color denoting the response group (blue: early-converter, yellow: late-converter, red: non-converter). (C) HBsAg-predictive ratio, Rhbs, when calculated on the memory CD4 TCRβ repertoires at day 60. (D) HBsAg-predictive ratio, Rhbs, when calculated on the memory CD4 TCRβ repertoires at day 0. (E) Receiver operating characteristic (ROC) curve using Rhbs to differentiate between early-converters and late-converters in a leave-one-out cross-validation at day 0. Reported is the area under the curve (AUC) and its 95% confidence interval. Data for B, C, D, and E are available in Figure 3—source data 1. (F) ROC curve using Rhbs to differentiate between age-matched early-converters and late-converters in a leave-one-out cross-validation at day 0. Age-matching was accomplished retaining only samples in the age range 40–55. A Wilcoxon test was used to confirm that there was no difference in age distributions between early- and late-converters (p-value = 0.60, mean EC = 44.5 years, mean LC 45.1 years). Diagonal line denotes a random classifier. Reported is the area under the curve (AUC) and its 95% confidence interval.
-
Figure 3—source data 1
Hepatitis B surface antigen (HBsAg)-predictive ratio (Rhb) data.
Frequency of predicted HBsAg epitope-specific and bystander T cell receptor β (TCRβ) sequences; and HBsAg-predictive ratio, Rhbs, calculated on the memory CD4 TCRβ repertoires at two time points, day 0 and day 60.
- https://cdn.elifesciences.org/articles/68388/elife-68388-fig3-data1-v3.csv
Figure 3—figure supplement 1
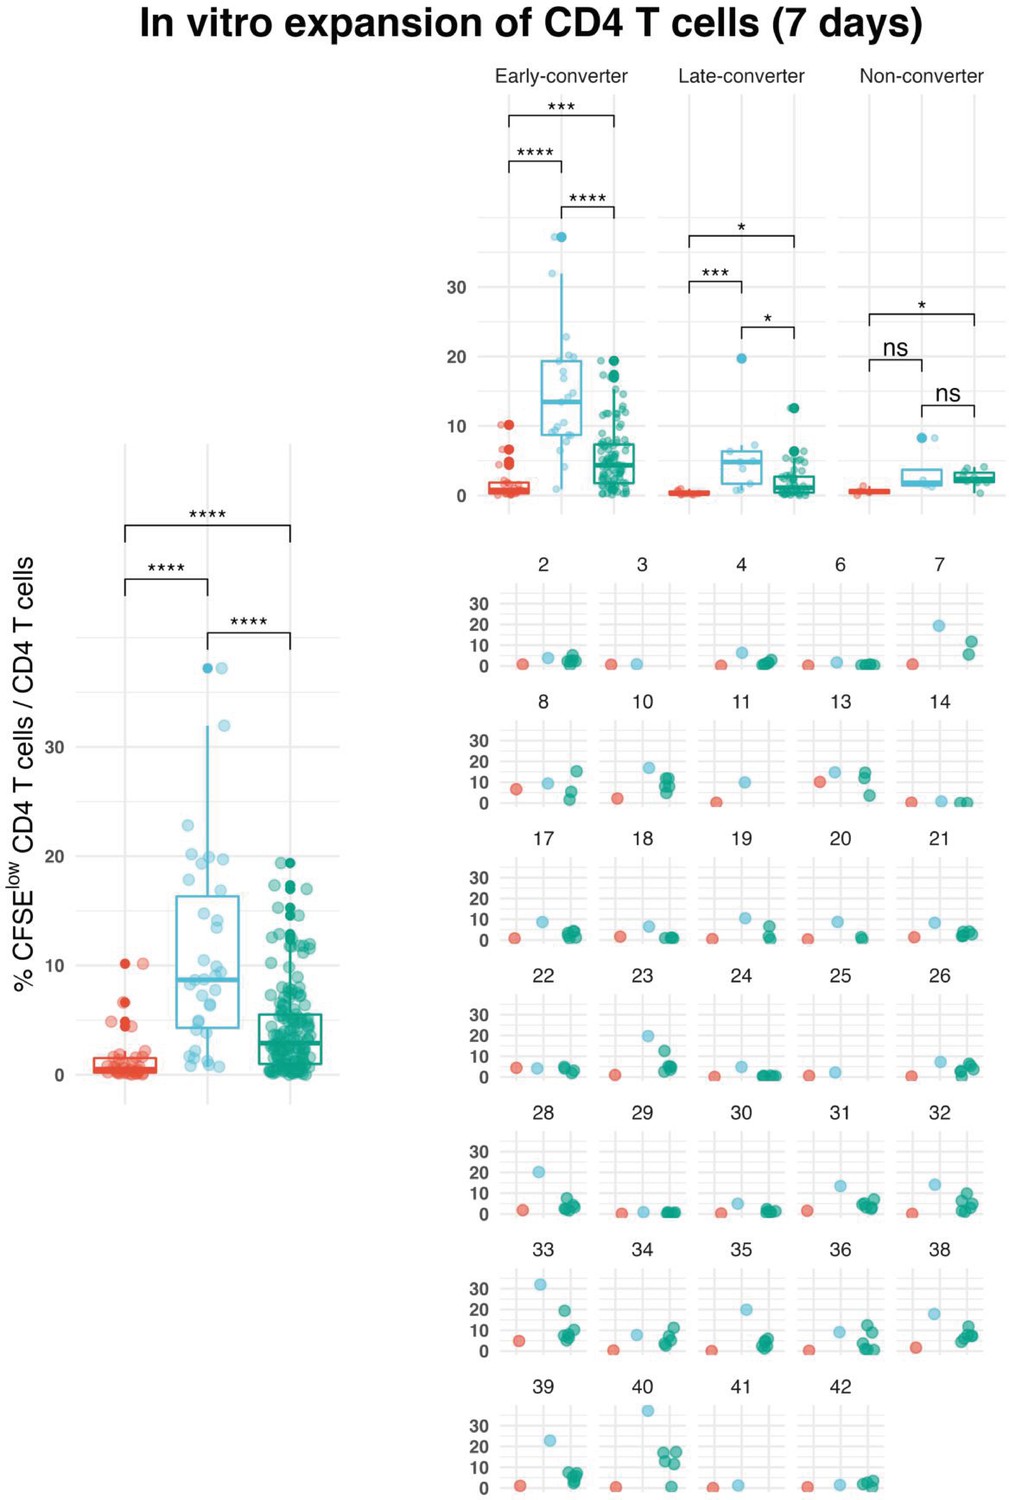
Overview of the outcome of in vitro expansion experiments.
Shown is the frequency of CFSElow CD4 T cells out of total CD4 T cells for all vaccinees, vaccinees per group and for each vaccinee. Peripheral blood mononuclear cells from day 60 were labeled with carboxyfluorescein succinimidyl ester (CFSE) and stimulated with a pool of peptides spanning hepatitis B (HB) surface antigen (HBsAg) (peptide pool) and single peptides selected based on epitope mapping of the entire antigen (single peptide). After day 7 of in vitro expansion, cells were stained with antibodies to surface markers (CD3, CD4, and CD8) that enable gating on viable CD4 T cells. CFSE intensity was used to identify and sort CFSElow cells for T cell receptor (TCR) repertoire analysis of antigen-specific CD4 T cells.
Figure 4 with 4 supplements
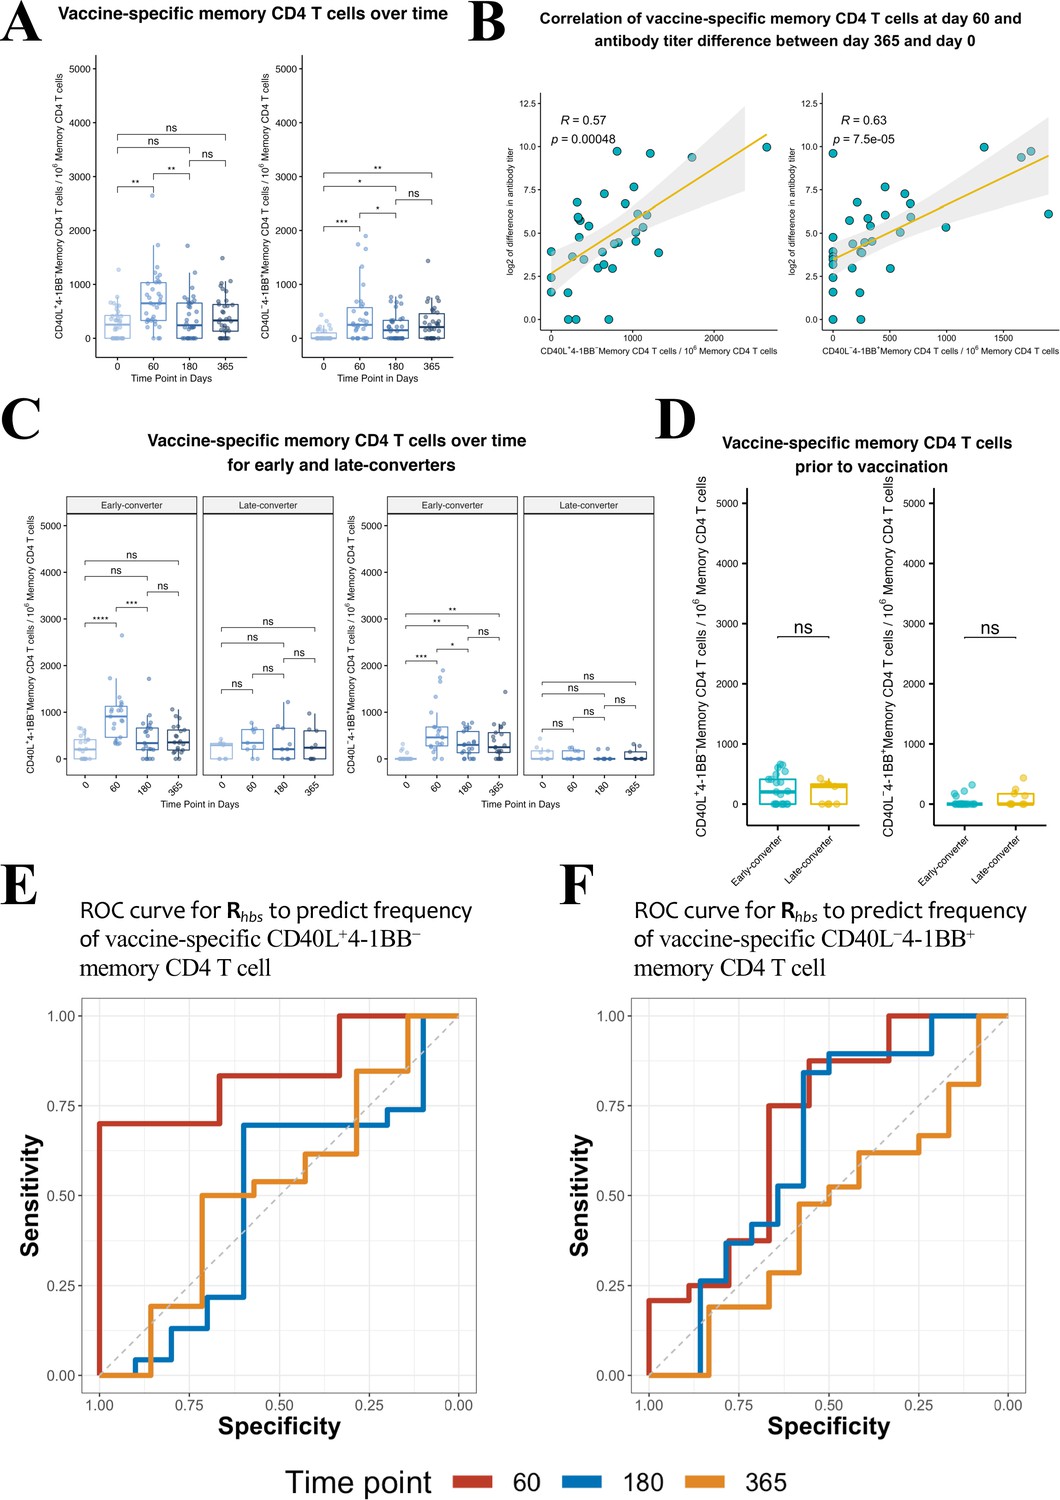
Hepatitis B vaccine induces a vaccine-specific CD40L+4-1BB− and CD40L−4-1BB+ memory CD4 T cell response in early-converter vaccinees.
Peripheral blood mononuclear cells (PBMCs) from vaccinees were stimulated with 2 μg/ml of the master peptide pool (hepatitis B surface antigen [HBsAg]) and assessed for converse expression of 4-1BB and CD40L by flow cytometry on days 0, 60, 180, and 365. Shown is number of vaccine-specific memory CD4 T cells out of 106 memory CD4 T cells after subtraction of responses in negative control. (A) Aggregate analysis from vaccinees (including early-, late-, and non-converters) showing a peak of vaccine-specific CD40L+4-1BB− and CD40L−4-1BB+ memory CD4 T cell at day 60 (day 60 after first dose of the vaccine and day 30 after second dose), declining thereafter. Shown are numbers of vaccine-specific memory CD4 T cells out of 106 memory CD4 T cells. (B) Correlation between the difference in antibody titer between day 365 and day 0 and vaccine-specific CD40L+4-1BB− and CD40L−4-1BB+ memory CD4 T cell at day 60. (C) Aggregate analysis from early- and late-converter vaccinees showing a significant induction of vaccine-specific CD40L+4-1BB− and CD40L−4-1BB+ memory CD4 T cell in early-converters and lack thereof in late-converters. (D) Aggregate analysis from early- and late-converter vaccinees showing no significant differences in vaccine-specific CD40L+4-1BB− and CD40L−4-1BB+ memory CD4 T cell at day 0. Data for A, B, C, and D are available in Figure 4—source data 1. (E) Receiver operating characteristic (ROC) curves for Rhbs from day 0 data in a leave-one-out cross-validation compared to the frequency of vaccine-specific CD40L+4-1BB− memory CD4 T cell out of 106 memory CD4 T cells for each vaccinee at time points 60 (area under the curve [AUC] = 0.84), 180 (AUC = 0.56), and 365 (AUC = 0.57). (F) Receiver operating characteristic (ROC) curves for Rhbs from day 0 data in a leave-one-out cross-validation compared to the frequency of vaccine-specific CD40L−4-1BB+ memory CD4 T cell out of 106 memory CD4 T cells for each vaccinee at time points 60 (AUC = 0.62), 180 (AUC = 0.56), and 365 (AUC = 0.52). Statistical significance was indicated with ns p > 0.05, *p ≤ 0.05, **p ≤ 0.01, ***p ≤ 0.001, ****p ≤ 0.0001 rs, Spearman’s correlation coefficient, −1≤ rs ≤ 1; rs and p-value by Spearman’s correlation test.
-
Figure 4—source data 1
Ex vivo T cell assay and serological data.
Numbers of vaccine-specific CD40L+4-1BB− and CD40L−4-1BB+ memory CD4 T cell out of 106 memory CD4 T cells and antibody titers at the four time points, days 0, 60, 180, and 365.
- https://cdn.elifesciences.org/articles/68388/elife-68388-fig4-data1-v3.csv
Figure 4—figure supplement 1
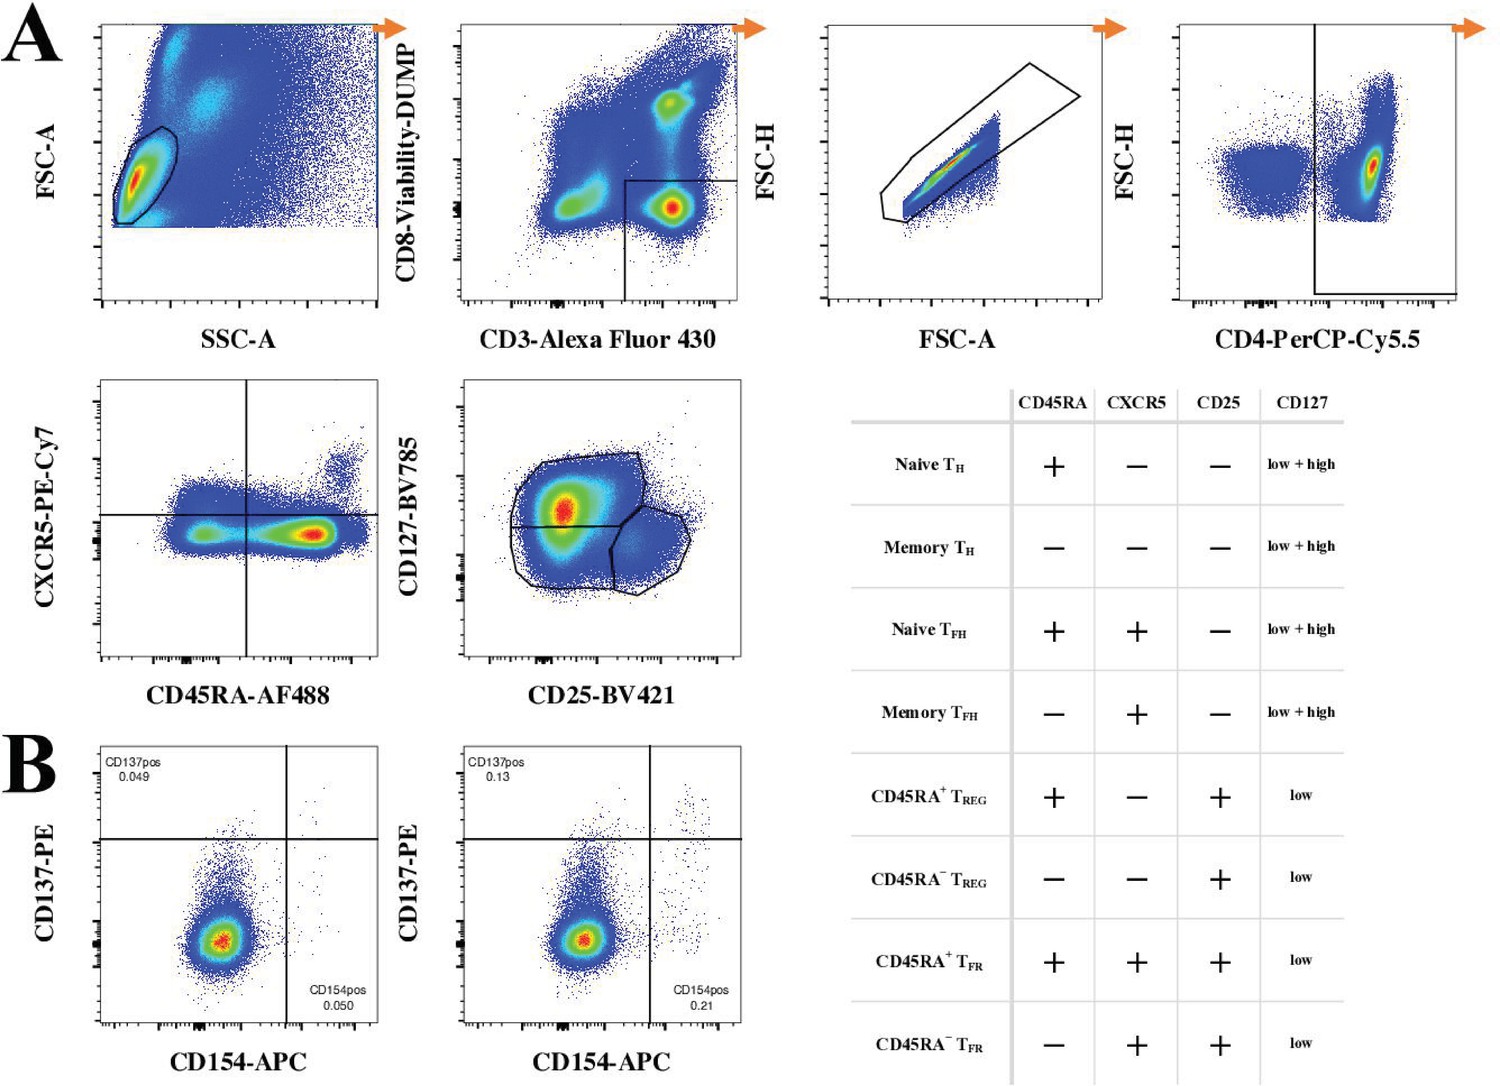
Gating strategy of ex vivo T cell phenotyping of vaccine-specific T cells.
(A) Gating strategy started by a lymphocyte gate, followed by gating on viable CD3+CD8− T cells. Doublets were excluded using doublet discrimination (area against the height of forward scatter pulse) before gating on CD4+ T cells. Next, CD45RA, CXCR5, CD25, and CD127 were used to identify main subsets of CD4 T cells using Boolean gates as specified in the accompanying table. (B) Shown an example of gating for CD154 (CD40L) and CD137 (4-1BB) for cells left unstimulated (left) and cells stimulated with a master peptide pool (right) for an early-converter vaccinee at day 60.
Figure 4—figure supplement 2
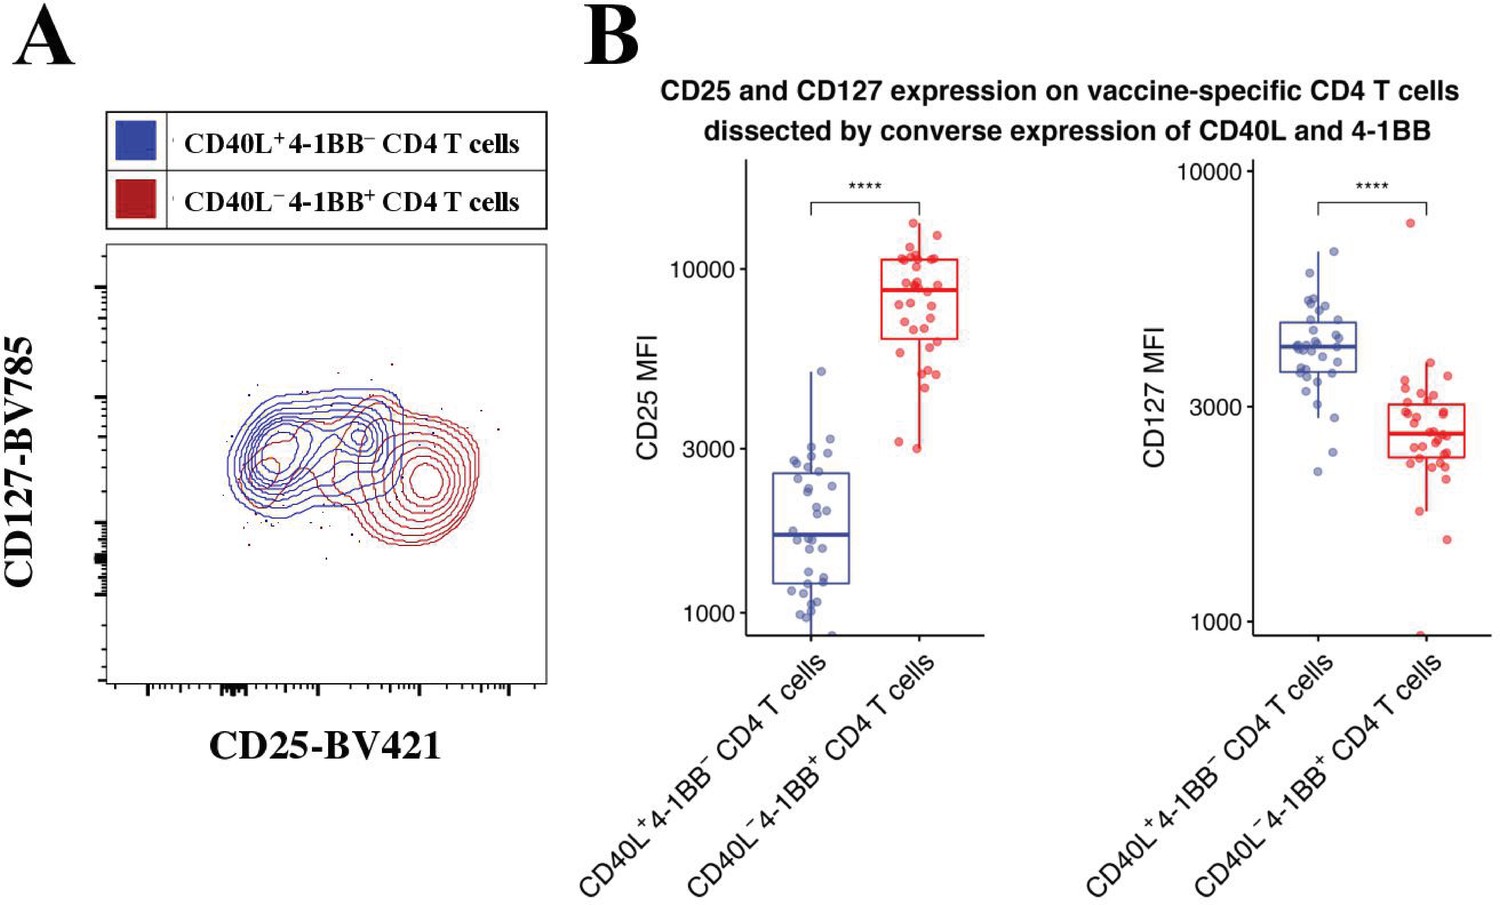
CD40L+4-1BB− and CD40L−4-1BB+ CD4 T cells have a TCON and TREG phenotype, respectively.
Peripheral blood mononuclear cells (PBMCs) from vaccinees were stimulated with 2 μg/ml of a pool of peptides of hepatitis B surface antigen (HBsAg) and assessed for converse expression of 4-1BB and CD40L by flow cytometry. (A) CD40L+4-1BB− and CD40L−4-1BB+ CD4 T cells from day 60 were gated on and then overlaid in a contour plots of CD25 versus CD127 to assess TCOV and TREG phenotype. (B) Summary plot of median fluorescence intensity (MFI) of CD25 and CD127 for all vaccinees. Wilcoxon signed-rank with paired analysis; statistical significance was indicated with ****p ≤ 0.0001.
Figure 4—figure supplement 3

Relationship between serological memory and memory CD4 T cell response to the vaccine.
Correlation between the difference in antibody titer between day 365 and day 0 and vaccine-specific CD40L+4-1BB− and CD40L−4-1BB+ memory CD4 T cell at day 60 colored by vaccinee group and labeled with vaccinee ID. rs, Spearman’s correlation coefficient, −1≤ rs ≤ 1; rs and p-value by Spearman’s correlation test.
Figure 4—figure supplement 4
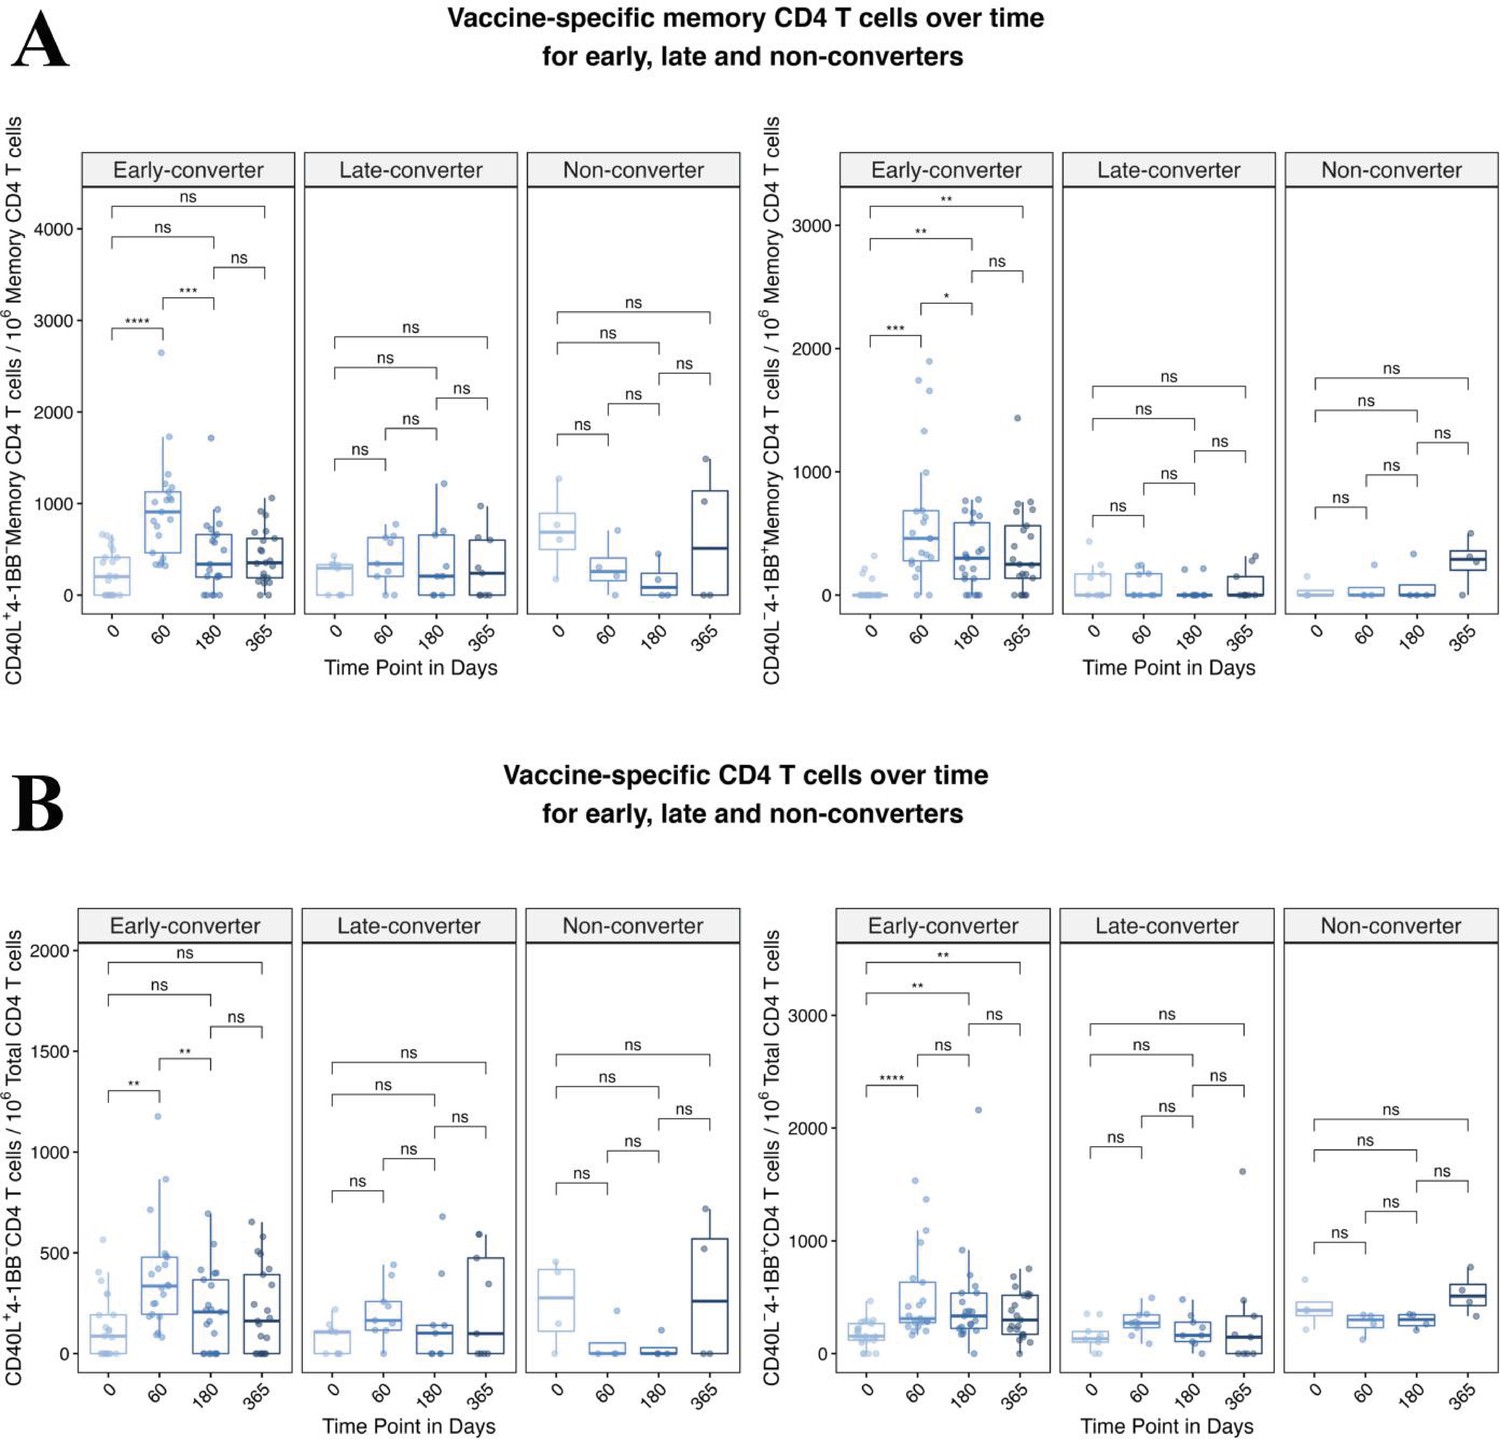
Hepatitis B vaccine induces a vaccine-specific CD4 T cell response in early-converter vaccinees.
Peripheral blood mononuclear cells (PBMCs) from vaccinees were stimulated with 2 μg/ml of a pool of peptides of hepatitis B surface antigen (HBsAg) and assessed for converse expression of 4-1BB and CD40L by flow cytometry on days 0, 60, 180, and 365. (A) Aggregate analysis from early-, late-, and non-converter vaccinees showing a significant induction of vaccine-specific CD40L+4-1BB− and CD40L−4-1BB+ memory CD4 T cell in early-converters and lack thereof in late and non-converters. Shown are numbers of vaccine-specific memory CD4 T cells out of 106 memory CD4 T cells after subtraction of responses in negative control (see Materials and methods for details). (B) Aggregate analysis from early-, late-, and non-converter vaccinees showing a significant induction of vaccine-specific CD40L+4-1BB− and CD40L−4-1BB+ CD4 T cell in early-converters and lack thereof in late and non-converters. Shown are numbers of vaccine-specific CD4 T cells out of 106 CD4 T cells after subtraction of responses in negative control (see Materials and methods for details).
Figure 5 with 1 supplement
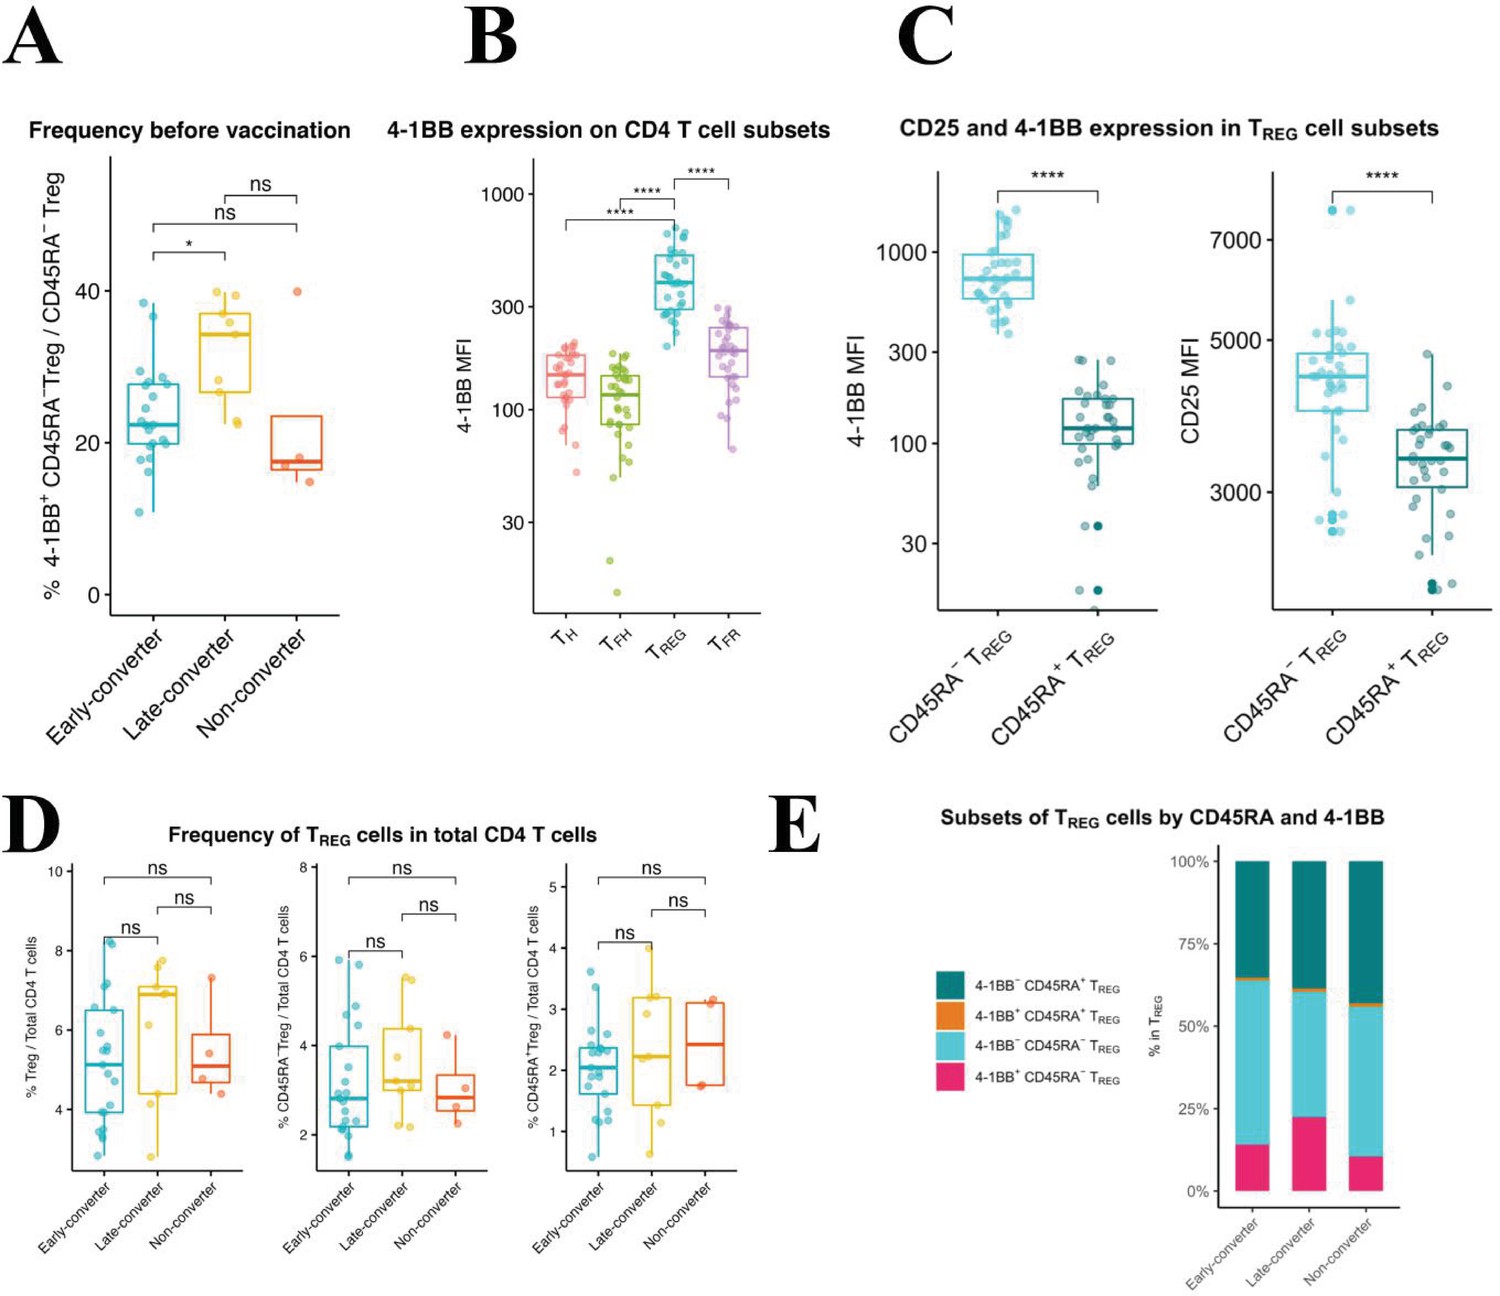
An expanded 4-1BB+CD45RA− TREG cells within TREG compartment is a prominent feature in late-converters prior to vaccination.
Peripheral blood mononuclear cells (PBMCs) from vaccinees at day 0 (prior to vaccination) were phenotyped for expression of markers of TREG. (A) Aggregate analysis of 4-1BB+CD45RA− TREG within CD45RA− TREG CD4 T cells in early- and late- and non-converter vaccinees before vaccination. (B) Aggregate analysis of the median fluorescence intensity of 4-1BB in TH, cTFH, TREG, and cTFR cells before vaccination. (C) Aggregate analysis of the median fluorescence intensity of 4-1BB (left panel) and CD25 (right panel) in CD45RA− TREG and CD45RA+ TREG cells before vaccination. Data for A, B, and C are available in Figure 5—source data 1. (D) Frequency of TREG, CD45RA− TREG, and CD45RA+ TREG cells within total CD4 T cells in early-, late-, and non-converter vaccinees before vaccination. (E) Composition of TREG compartment as determined by expression of 4-1BB and CD45RA in early-, late-, and non-converter vaccinees before vaccination. Statistical significance was indicated with ns p > 0.05, *p ≤ 0.05, **p ≤ 0.01, ***p ≤ 0.001, ****p ≤ 0.0001.
-
Figure 5—source data 1
Frequency of 4-1BB+CD45RA− TREG cells and median fluorescence intensity data.
Frequency of 4-1BB+CD45RA− TREG within CD45RA− TREG CD4 T cells, and median fluorescence intensity of 4-1BB in TH, cTFH, TREG, and cTFR cells, and of 4-1BB and CD25 in CD45RA− TREG and CD45RA+ TREG cells before vaccination.
- https://cdn.elifesciences.org/articles/68388/elife-68388-fig5-data1-v3.csv
Figure 5—figure supplement 1

An expanded 4-1BB+CD45RA− TREG cells within TREG compartment is a prominent feature in late-converters prior to vaccination.
Aggregate analysis of the frequency of 4-1BB+CD45RA− TREG within CD45RA− TREG CD4 T cells in early-, late-, and non-converter vaccinees at days 0, 60, 180, and 365. Statistical significance was indicated with ns p > 0.05, *p ≤ 0.05, **p ≤ 0.01, ***p ≤ 0.001, ****p ≤ 0.0001.
Author response image 1

Tables
Key resources table
| Reagent type (species) or resource | Designation | Source or reference | Identifiers | Additional information |
|---|---|---|---|---|
| Antibody | CD3-BV510 (SK7) (mouse monoclonal) | BioLegend | Cat# 344828 | FACS (1/20 per test) |
| Antibody | CD3-PerCP (BW264/56) (mouse monoclonal) | Miltenyi Biotec | Cat# 130-113-131 | FACS (1/50 per test) |
| Antibody | CD4-APC (REA623) (recombinant antibodies, REAfinity) | Miltenyi Biotec | Cat# 130-113-222 | FACS (1/50 per test) |
| Antibody | CD4-APC (RPA-T4) (mouse monoclonal) | BD Biosciences | Cat# 555349 | FACS (1/5 per test) |
| Antibody | CD4-PerCP/Cy5.5 (RPA-T4) (mouse monoclonal) | BioLegend | Cat# 300530 | FACS (1/20 per test) |
| Antibody | CD8-VioGreen (REA734) (recombinant antibodies, REAfinity) | Miltenyi Biotec | Cat# 130-110-684 | FACS (1/50 per test) |
| Antibody | CD8-Pacific Orange (3B5) (mouse monoclonal) | Invitrogen | Cat# MHCD0830 | FACS (1/20 per test) |
| Antibody | CD8-APC/Cy7 (SK1) (mouse monoclonal) | BioLegend | Cat# 344714 | FACS (1/20 per test) |
| Antibody | CD40L-PE (5C8) (mouse monoclonal) | Miltenyi Biotec | Cat# 130-092-289 | FACS (1/10 per test) |
| Antibody | CXCR5-PE-Cy7 (MU5UBEE) (mouse monoclonal) | eBioscience | Cat# 25-9185-42 | FACS (7/100 per test) |
| Antibody | CD45RA-AF488 (HI100) (mouse monoclonal) | BioLegend | Cat# 304114 | FACS (1/20 per test) |
| Antibody | CD45RO-PE (UCHT1) (mouse monoclonal) | BD Biosciences | Cat# 555493 | FACS (1/5 per test) |
| Antibody | CD25-BV421 (M-A251) (mouse monoclonal) | BioLegend | Cat# 356114 | FACS (1/20 per test) |
| Antibody | CD127-BV785 (A019D5) (mouse monoclonal) | BioLegend | Cat# 351330 | FACS (1/20 per test) |
| Antibody | CD137-PE (4B4-1) (mouse monoclonal) | BioLegend | Cat# 309804 | FACS (1/20 per test) |
| Antibody | CD154-APC (5C8) (mouse monoclonal) | Miltenyi Biotec | Cat# 130-113-603 | FACS (3/100 per test) |
| Antibody | Anti-CD40 (HB14) (mouse monoclonal) | Miltenyi Biotec | Cat# 130-094-133 | Assay (1 µg/ml) |
| Antibody | Anti-CD28 (CD28.2) (mouse monoclonal) | BD Biosciences | Cat# 556620 | Assay (1 μg/ml) |
| Peptide, recombinant protein | Single peptides of HBsAg | JPT Peptide Technologies | Customized | 54 single peptides |
| Peptide, recombinant protein | Peptide matrix pools of HBsAg | JPT Peptide Technologies | Customized | A set of 15 matrix pools each with 7–8 peptides |
| Peptide, recombinant protein | Master peptide pool of HBsAg | JPT Peptide Technologies | Customized | A pool of 54 single peptides |
| Commercial assay or kit | CD4 MicroBeads | Miltenyi Biotec | Cat# 130-045-101 | |
| Commercial assay or kit | DNA/RNA Shield | Zymo Research | Cat# R1100-50 | |
| Commercial assay or kit | Quick-DNA Microprep kit | Zymo Research | Cat# D3020 | |
| Commercial assay or kit | ImmunoSEQ hsTCRB sequencing kit | Adaptive Biotechnologies | ||
| Commercial assay or kit | Quick-RNA Microprep kit | Zymo Research | Cat# R1050 | |
| Commercial assay or kit | QIAseq Immune Repertoire RNA Library kit | Qiagen | Cat# 333705 | |
| Commercial assay or kit | Qubit dsDNA HS Assay | Thermo Fisher Scientific | Cat# Q32854 | |
| Software, algorithm | FlowJo version 10.5.3 | Tree Star | RRID:SCR_002865 | |
| Software, algorithm | immunoSEQ analyzer (v2) | Adaptive Biotechnologies | ||
| Software, algorithm | TCRex web-based | (Gielis et al., 2019), https://tcrex.biodatamining.be/ | ||
| Software, algorithm | R | https://www.r-project.org | RRID:SCR_001905 | |
| Software, algorithm | RStudio | http://www.rstudio.com/ | RRID:SCR_000432 | |
| Software, algorithm | ggplot2 (V3.3.2) | (Wickham, 2016) https://ggplot2.tidyverse.org/ | RRID:SCR_014601 | |
| Software, algorithm | ggpubr (V0.2.5) | https://CRAN.R-project.org/package=ggpubr | RRID:SCR_021139 | |
| Software, algorithm | rstatix (0.7.0) | https://CRAN.R-project.org/package=rstatix | RRID:SCR_021240 | |
| Other | Sytox blue | Invitrogen | Cat# S34857 | FACS (1/500 per test) |
| Other | Fixable viability dye Zombie NIR | BioLegend | Cat# 423106 | FACS (1/50 per test) |
| Other | Carboxyfluorescein succinimidyl ester (CFSE) | Invitrogen | Cat# C34554 | 2 µM staining solution |
| Other | Engerix-B | GlaxoSmithKline | 20 μg | |
| Other | Varicella zoster virus (VZV) lysate | Microbix Biosystem | Cat# EL-03–02 | Viral lysate, assay (4 µg/ml) |
Author response table 1
| Median of antibody titer over time | ||||
|---|---|---|---|---|
| Status | Time_Point | Antibody_titre_median | ||
| Early-converter | 0 | 2 | ||
| Early-converter | 60 | 82.23 | ||
| Early-converter | 180 | 167.7 | ||
| Early-converter | 365 | 62.01 | ||
| Statistical analysis | ||||
| group1 | group2 | p | p.adj | p.adj.signif |
| 0 | 60 | 9.54E-07 | 4.77E-06 | **** |
| 60 | 180 | 0.785 | 1 | ns |
| 180 | 365 | 9.54E-07 | 4.77E-06 | **** |
| 0 | 180 | 9.54E-07 | 4.77E-06 | **** |
| 0 | 365 | 9.54E-07 | 4.77E-06 | **** |
Additional files
-
Supplementary file 1
List of 54 single peptides, each 15 amino acid (AA) long with an 11-AA overlap spanning the 226 AAs along the small S protein of hepatitis B (HB) surface antigen (HBsAg).
- https://cdn.elifesciences.org/articles/68388/elife-68388-supp1-v3.xlsx
-
Supplementary file 2
Overview of the single peptides tested for each vaccinee in the carboxyfluorescein succinimidyl ester (CFSE) assay.
- https://cdn.elifesciences.org/articles/68388/elife-68388-supp2-v3.xlsx
-
Transparent reporting form
- https://cdn.elifesciences.org/articles/68388/elife-68388-transrepform1-v3.docx
Download links
A two-part list of links to download the article, or parts of the article, in various formats.
Downloads (link to download the article as PDF)
Open citations (links to open the citations from this article in various online reference manager services)
Cite this article (links to download the citations from this article in formats compatible with various reference manager tools)
Preexisting memory CD4 T cells in naïve individuals confer robust immunity upon hepatitis B vaccination
eLife 11:e68388.
https://doi.org/10.7554/eLife.68388


