Fine-tuned repression of Drp1-driven mitochondrial fission primes a ‘stem/progenitor-like state’ to support neoplastic transformation
- Department of Genetics, University of Alabama at Birmingham, United States
- Departments of Pathology, University of Alabama at Birmingham, United States
- Department of Cell Development and Integrative Biology, University of Alabama at Birmingham, United States
- Departments of Pathology, Surgery, Genetics and Cell and Developmental Biology, University of Alabama at Birmingham, United States
Figures
Figure 1 with 1 supplement
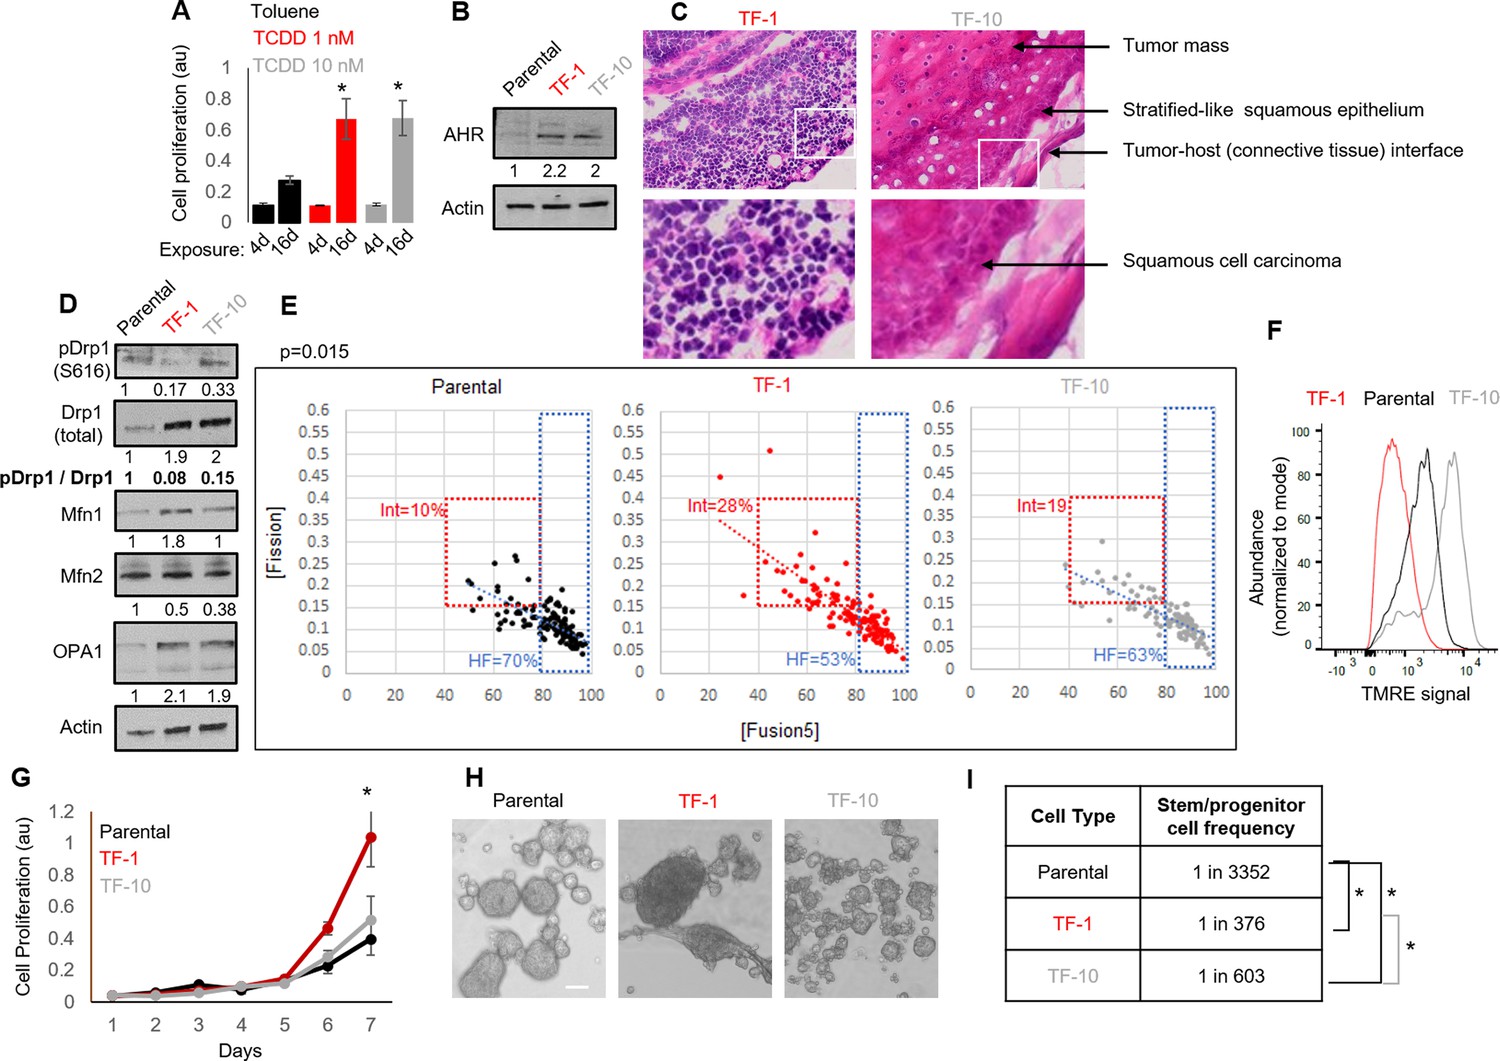
Establishment of a mild carcinogen transformed keratinocyte model that maintains abundant self-renewing/proliferating cells and repressed Drp1 activity.
(A) Cell proliferation assay (quantified by crystal violet staining) after 4 or 16 days exposure to TCDD (1 or 10 nM) or Toluene (10 nM) vehicle control. (B) Immunoblot analyses of AHR and actin (loading control) in the absence of TCDD. (C) Representative micrographs (40 X) of H&E stained sections of tumor xenografts; zoom of boxed region shown in the bottom panels. (D) Immunoblot analyses of mitochondrial fission/fusion proteins with actin as loading control. (E) Dot plot of [Fission] and [Fusion5] obtained from confocal micrographs of Mitotracker green stained cells; numbers denote the percentage of cells in the colored boxes with p value from Chi-Square test (N > 90 cells in each group); representative images in Figure 1—figure supplement 1E. (F) Flowcytometric histogram plots of TMRE intensity of stained cells. (G) Quantification of cell proliferation assay (as in A) over 7 days in the absence of TCDD. (H) Representative micrograph showing spheroids formed when 104 cells of each group were maintained in low attachment plate in the presence of stem cell medium. (I) ELDA based quantification of spheroid forming frequency in each cell population. * signifies p value of < 0.05 in T test (A,G) and ELDA (I); scale bar depicts 100 μm (H); numbers under immunoblots denote quantification of band intensities normalized by that of Actin.
Figure 1—figure supplement 1
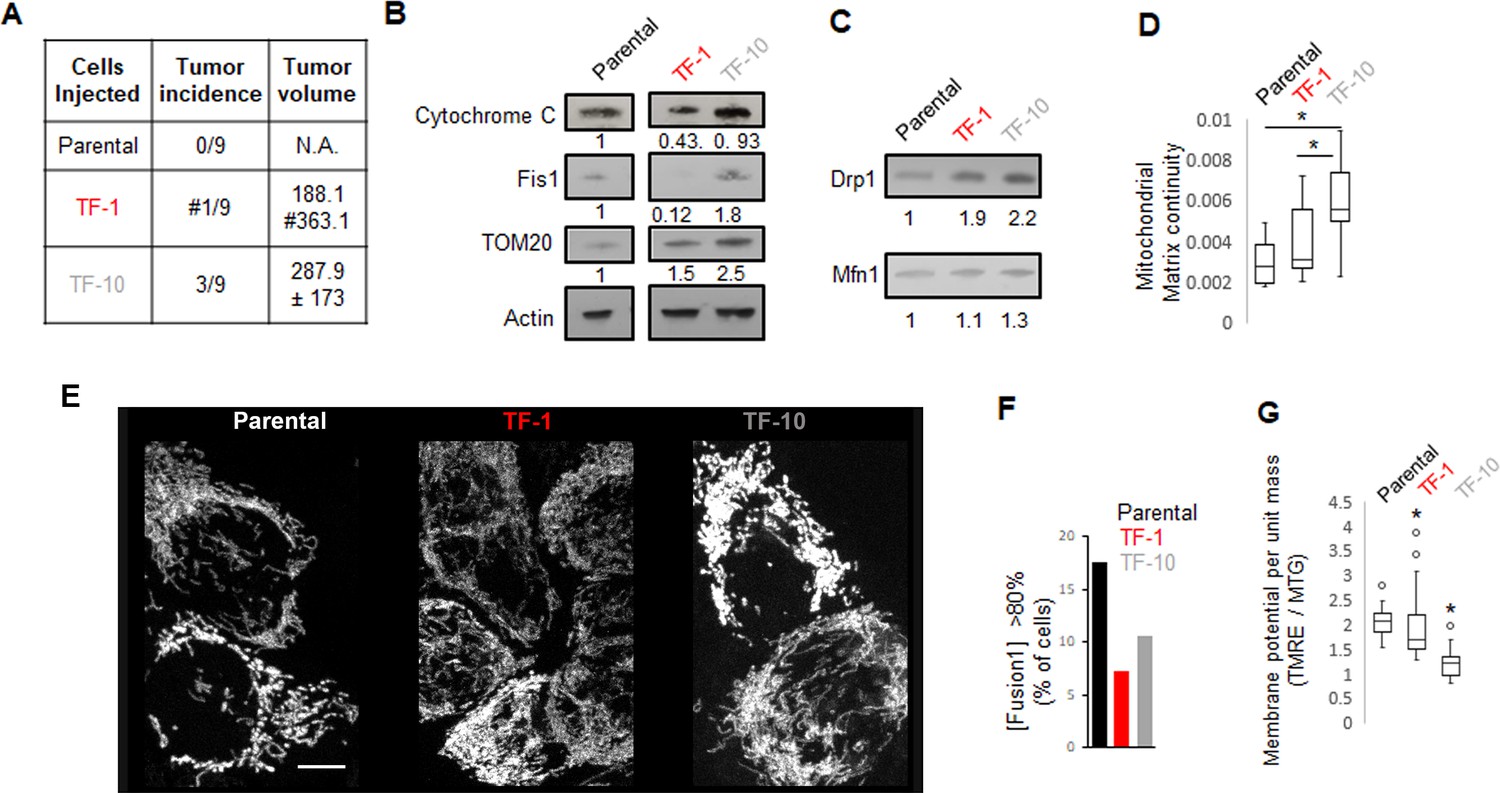
Further characterization of Parantal, TF-1 and TF-10 HaCaT cells.
A) Quantification of incidence and volume of xenograft tumors; # indicates presence of a distant tumor. (B) Immunoblot analyses of specific mitochondrial proteins with actin as loading control. (C) Immunoblot analyses of Drp1 and Mfn1. (D) Assessment of mitochondrial matrix continuity from live cell pulse chase assay in cells expressing mito-PSmO. (E) Maximum intensity projection of confocal optical sections of representative cells expressing mito-PSmO. (F) Bar graph signifying percentage of cells with >80 [Fusion1]. (G) Quantification of mitochondrial membrane potential per unit mass from confocal micrographs of cells co-stained with TMRE and Mitotracker green. scale bar depicts 10 μm; * signifies p value of < 0.05 in KW test (D, G).
Figure 2 with 1 supplement

Drp1-repressed-TF-1 transformed keratinocyte population maintains an expanded sub-population of slow-cycling cells expressing elevated stem/progenitor cell markers.
(A) UMAP plot of scRNA-seq derived clusters (0–5) in individual cell population (top); pie chart of the percentage distribution of the clusters (bottom, p value from Chi-Square test); color coded arrows mark the clusters with unique reciprocal abundance in TF-1 cells. (B) Violin plots depicting expression of specific stem/progenitor cell markers in the clusters identified in (A); box outlines the KRT15-hi Cluster 3. (C) Normalized Enrichment Scores (NES) of functional pathways identified by GSEA of marker genes of Clusters 0–4 (Figure 2—source data 2) and by overrepresentation analyses for Cluster 5 (* represents categories including mtDNA genes); functional categories defined by majority of the leading-edge genes are in parentheses, while clusters are arranged based on trajectory analyses (open arrows) (see Figure 2—figure supplement 1F). (D) Violin plots depicting expression of key cell cycle regulators in the clusters identified in (A); the functional category of genes identified in (C) is included in the cluster identity, while box outlines the KRT15-hi Cluster. (E) Distribution of G2-M and S scores obtained from gene expression analyses of cell cycle predictive genes. (F) Feature plot of G2-M and S scores obtained from (E); color coded arrows as in (A). (G) Bar plot showing fraction of cells in G2-M, S and G0/G1, computed from (E) in the functionally categorized clusters; inset shows G1 to S reciprocity of the clusters (color-coded arrows) with unique reciprocal abundance in TF-1 cells in (A).
-
Figure 2—source data 1
Cluster markers of Parental, TF-1 and TF-10 HaCaT cells.
- https://cdn.elifesciences.org/articles/68394/elife-68394-fig2-data1-v2.xlsx
-
Figure 2—source data 2
GSEA of cluster markers of Parental, TF-1 and TF-10 HaCaT cells.
- https://cdn.elifesciences.org/articles/68394/elife-68394-fig2-data2-v2.xlsx
Figure 2—figure supplement 1
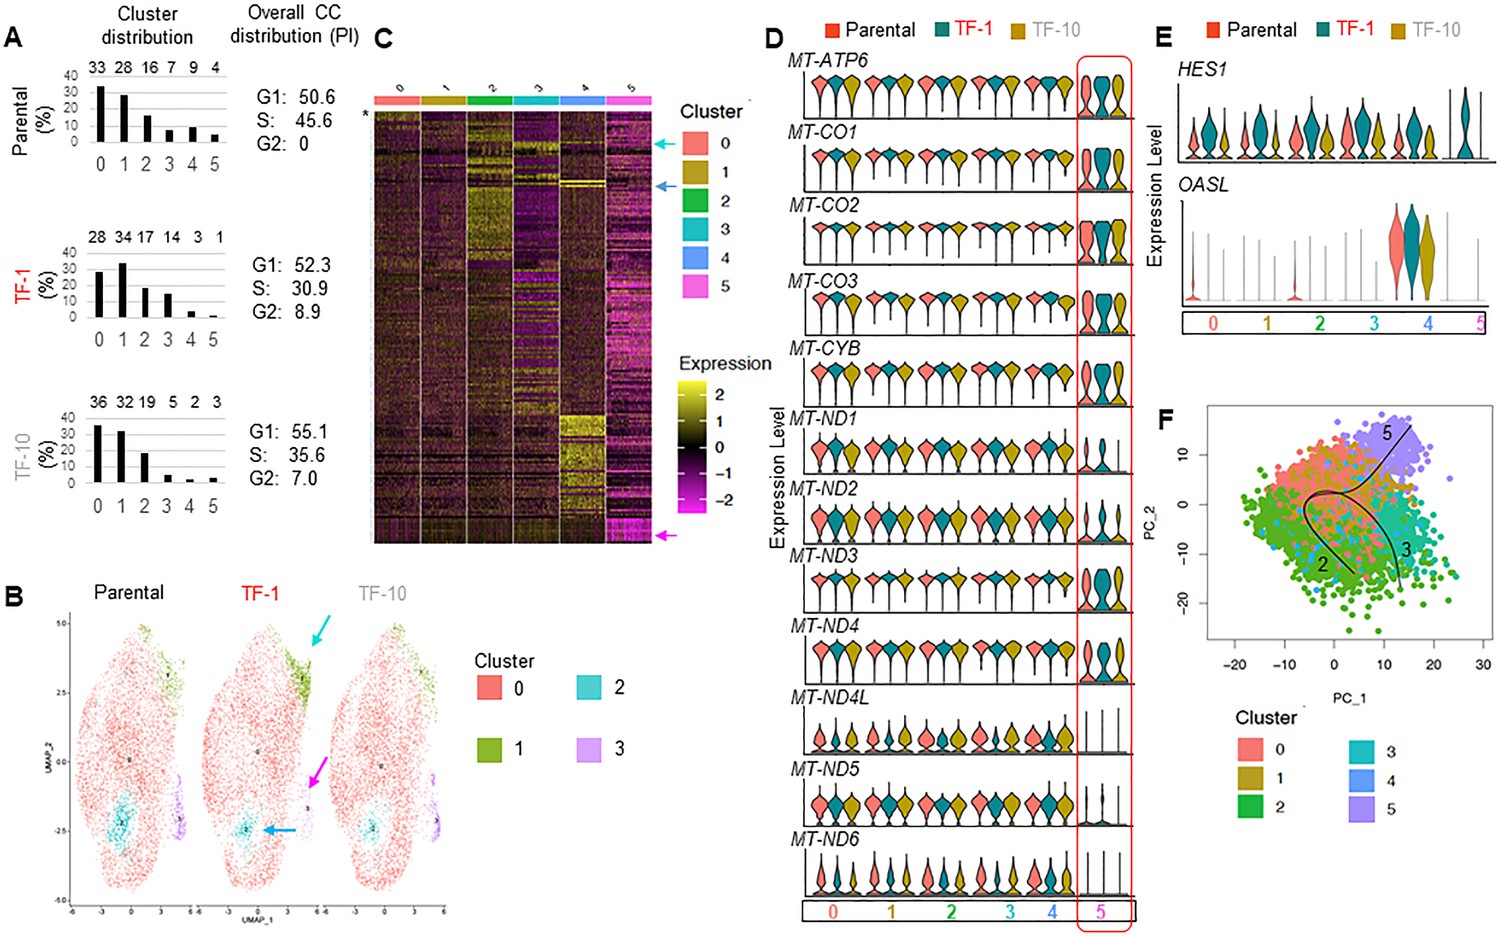
Further sc-RNAseq analyses of Parental, TF-1 and TF-10 HaCaT cells.
(A) Numbers on bar plot showing the percentage distribution of the clusters (0–5) in each of the cell populations identified by scRNA-seq analyses (left); numbers show cell cycle distribution from flowcytometry analyses of PI stained cells in the corresponding population (right). (B) UMAP plot of scRNA-seq derived clusters (0–3) obtained with minimum cluster resolution; color coded arrows point the major change in cluster distribution in transformed cells. (C) Heat map of statistically significant marker genes (LFC ≥1.5folds, p-adjusted <0.0001) for the color-coded clusters (0–5); color-coded arrows point to the top most marker gene in the three clusters that have different distribution between the Parental and transformed populations; color index shows log fold change; * marks the Histone gene cluster. (D) Violin plots depicting expression of the mt-DNA genes in the designated scRNA-seq-derived cell clusters. (E) Violin plots depicting expression of HES1 and OASL genes in designated scRNA-seq-derived cell clusters. (F) PCA plot of trajectory analyses of the scRNA-seq-derived cell clusters.
Figure 3 with 1 supplement
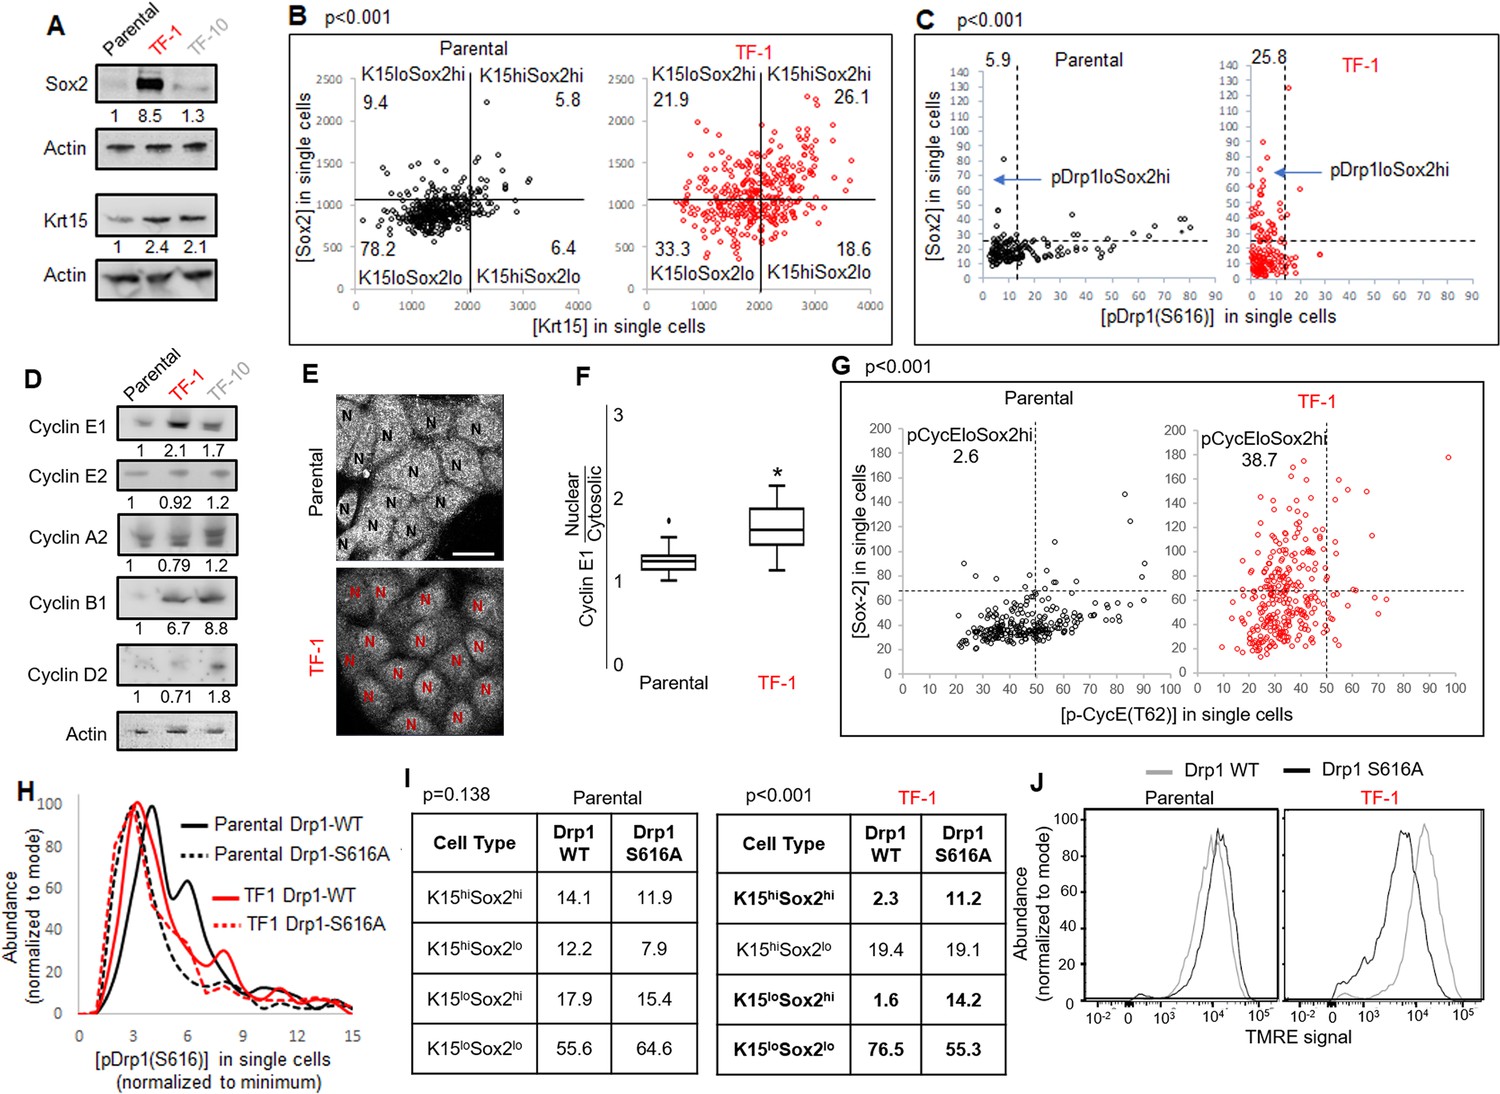
Fine-tuning Drp1 by reducing its S616 phosphorylation sustains a [Sox2hi-Krt15hi] neoplastic stem/progenitor cell state in TF-1 keratinocytes with elevated Cyclin E levels.
(A) Immunoblot analyses of stem/progenitor cell markers with actin as loading control. (B) Dot plot of [Sox2] vs [Krt15] levels obtained from confocal micrographs of co-immunostained cells demarcating the four populations; N > 300 cells in each group. (C) Dot plot of [Sox2] and [pDrp1(S616)] levels obtained from confocal micrographs of co-immunostained cells demarcating the population of interest (arrow); N > 200 cells in each group. (D) Immunoblot analyses of major cyclins with actin as loading control. (E) Representative confocal micrographs of Cyclin E1 immunostaining; N depict the nucleus in each cell identified by DNA stain (not shown). (F) Box plot showing median and distribution of nuclear to cytosolic ratio of Cyclin E1 levels quantified from experiment described in (E); N > 180 cells in each group. (G) Dot plot of [Sox2] and [CyclinE1(pT62)] levels obtained from confocal micrographs of co-immunostained cells; N > 120 cells in each group. (H) Histogram plots obtained from quantification of pDrp1-S616 signal from confocal micrographs of immunostained Drp1 modified cells. (I) Table denoting abundance (%) of each population identified as in (B) in the Drp1 modified cells (see Figure 3—figure supplement 1D). (J) Flowcytometric histogram plots of TMRE staining intensity of Drp1 modified cells; cell numbers under immunoblots denote quantification of band intensities normalized to that of actin; dotted lines in dot plots represent signal threshold marking the quadrants (described in Materials and methods) with the numbers signifying the abundance (%) of each population and the p value of Chi-Square test mentioned; * signifies p value of < 0.05 in KW test (F).
Figure 3—figure supplement 1
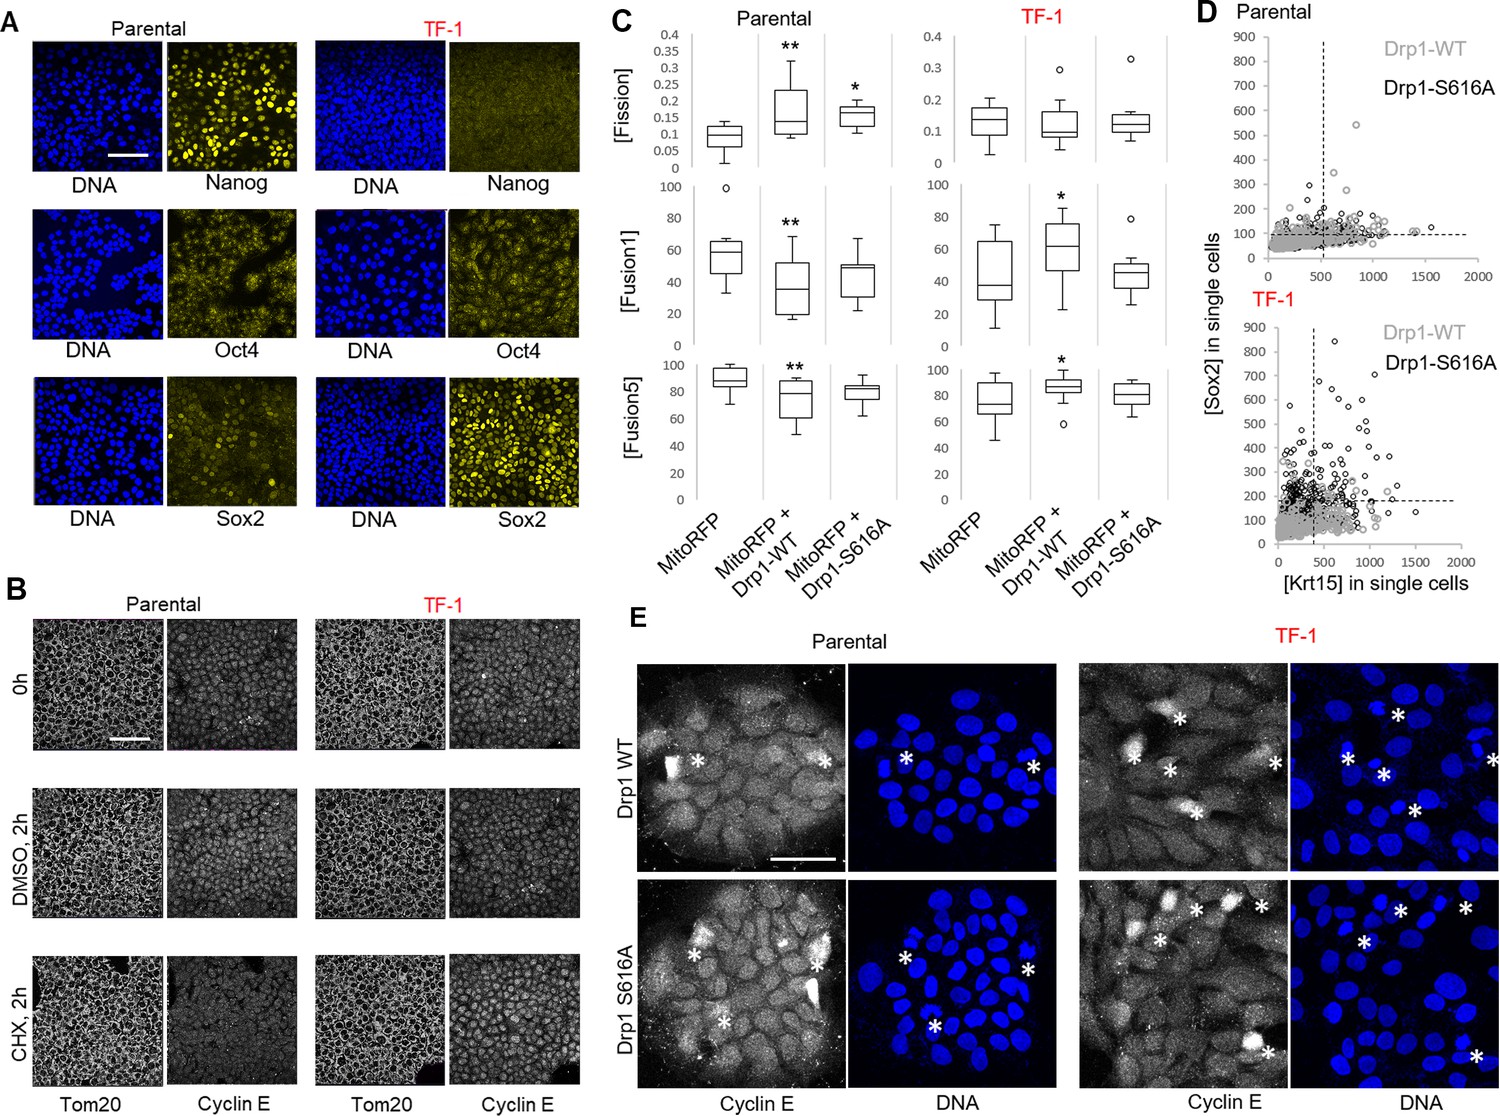
Further analyses of stem/progenitor cell markers, Cyclin E and mitochondrial properties in Parental and TF-1 HaCaT cells with or without genetic modification of Drp1.
(A) Representative confocal micrographs of immunostained cells showing endogenous expression of key embryonic stem cell markers; blue depicting nuclear DNA staining with Hoechst. (B) Representative confocal micrographs of cells showing endogenous expression of Tom20 and Cyclin E1 after 2 hr incubation with DMSO or Cycloheximide, with the pre-incubation time point (0 h) as control. (C) Box plot of [Fission], [Fusion5] and [Fusion1] in Parental and TF-1 cells transiently expressing mitoRFP and Drp1 wild type or mutant constructs. (D) Dot plot of [Sox2] and [Krt15] obtained from confocal micrographs of co-immunostained Parental or TF-1 cells with Drp1 modifications; dotted lines in dot plots represent signal threshold marking the quadrants. (E) Representative confocal micrographs of Drp1 modified Parental or TF-1 cells immunostained for Cyclin E; * mark mitotic cells identified as condensed nuclei by the DNA stain; scale bar depicts 100 μm; * and ** signify p value of < 0.05 and < 0.01, respectively, in KW test (C).
Figure 4 with 1 supplement
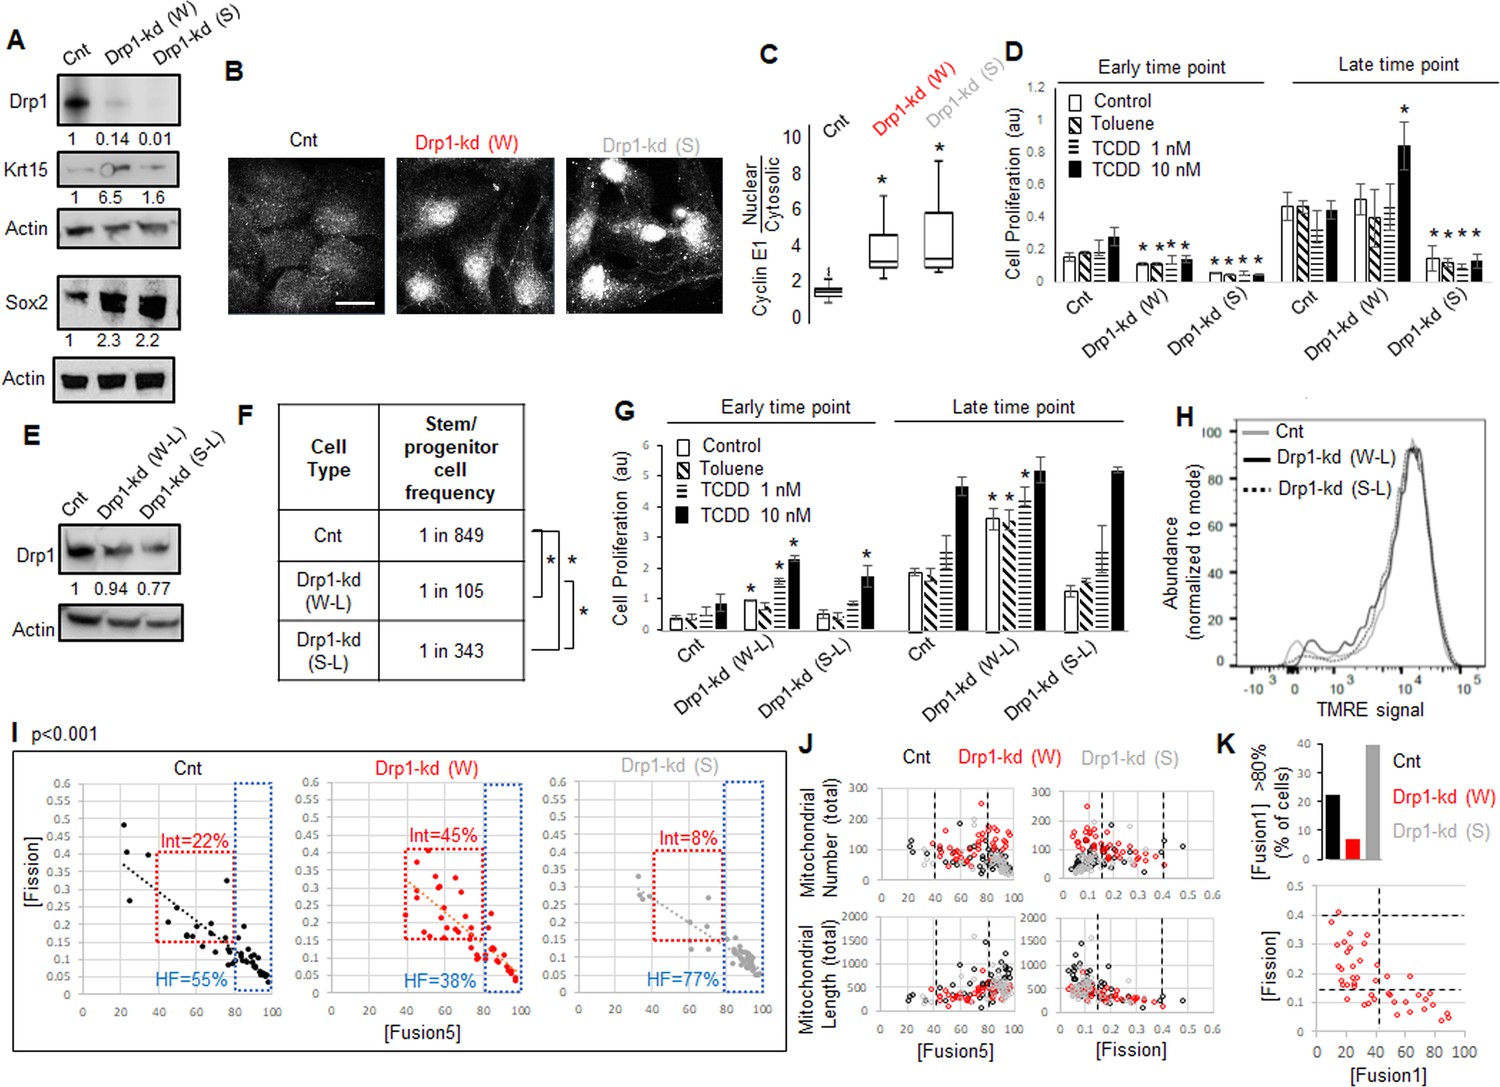
As opposed to more complete Drp1 repression, fine-tuned Drp1 repression sustains a [CyclinEhi-Sox2hi-Krt15hi] state, accelerates carcinogen-driven keratinocyte transformation, and maintains smaller fused mitochondria.
(A) Immunoblot analyses of control (Cnt), weaker (W) or stronger (S) Drp1 knockdown (kd) Parental cells, with actin as loading control. (B) Representative images of Cyclin E1 immunostaining in control or Drp1 knockdown Parental cells. (C) Box plot showing median and distribution of nuclear to cytosolic ratio of Cyclin E1 levels quantified from experiment described in (B). (D) Cell proliferation assay of control or Drp1 knockdown Parental cells after exposure to TCDD (1 nM or 10 nM) at an early (10d) and a late time point (17d) in the neoplastic transformation protocol; ‘Toluene’ is the vehicle control for TCDD and ‘Control’ is with no chemical. (E) Immunoblot analyses of Parental cells with control or reduced level of Drp1 knockdown with weak (W–L) or strong (S–L) DNM1L shRNAs, with actin as loading control. (F) ELDA based quantification of spheroid forming frequency of cells described in (E). (G) TCDD induced cell proliferation assay (as in D) of cells described in (E). (H) Flowcytometric histogram plots of TMRE staining of cells described in (E). (I) Dot plot of [Fission] and [Fusion5] obtained from confocal micrographs of Mitotracker green stained live control or Drp1 knockdown Parental cells described in (A); numbers denote the percentage of cells in colored boxes with p value from Chi-Square test (N > 40 cells in each group); representative images in Figure 3—figure supplement 1D. (J) Dot plot of [Fission] or [Fusion5] of single cells (from I) with their total mitochondrial number and total mitochondrial length; lines represent the ranges of [Fission] and [Fusion5] to demarcate cell subpopulations in boxes in (I). (K) Bar graph signifying percentage of cells from (I) with >80 [Fusion1] metric (top); dot plot of [Fission] vs [Fusion1] of cells from (I) (bottom); cell numbers under immunoblots denote quantification of band intensities normalized to that of actin; * signifies p value of < 0.05 in KW test (C), T test (D,G) and ELDA (F); scale bar depicts 20 μm (B).
Figure 4—figure supplement 1
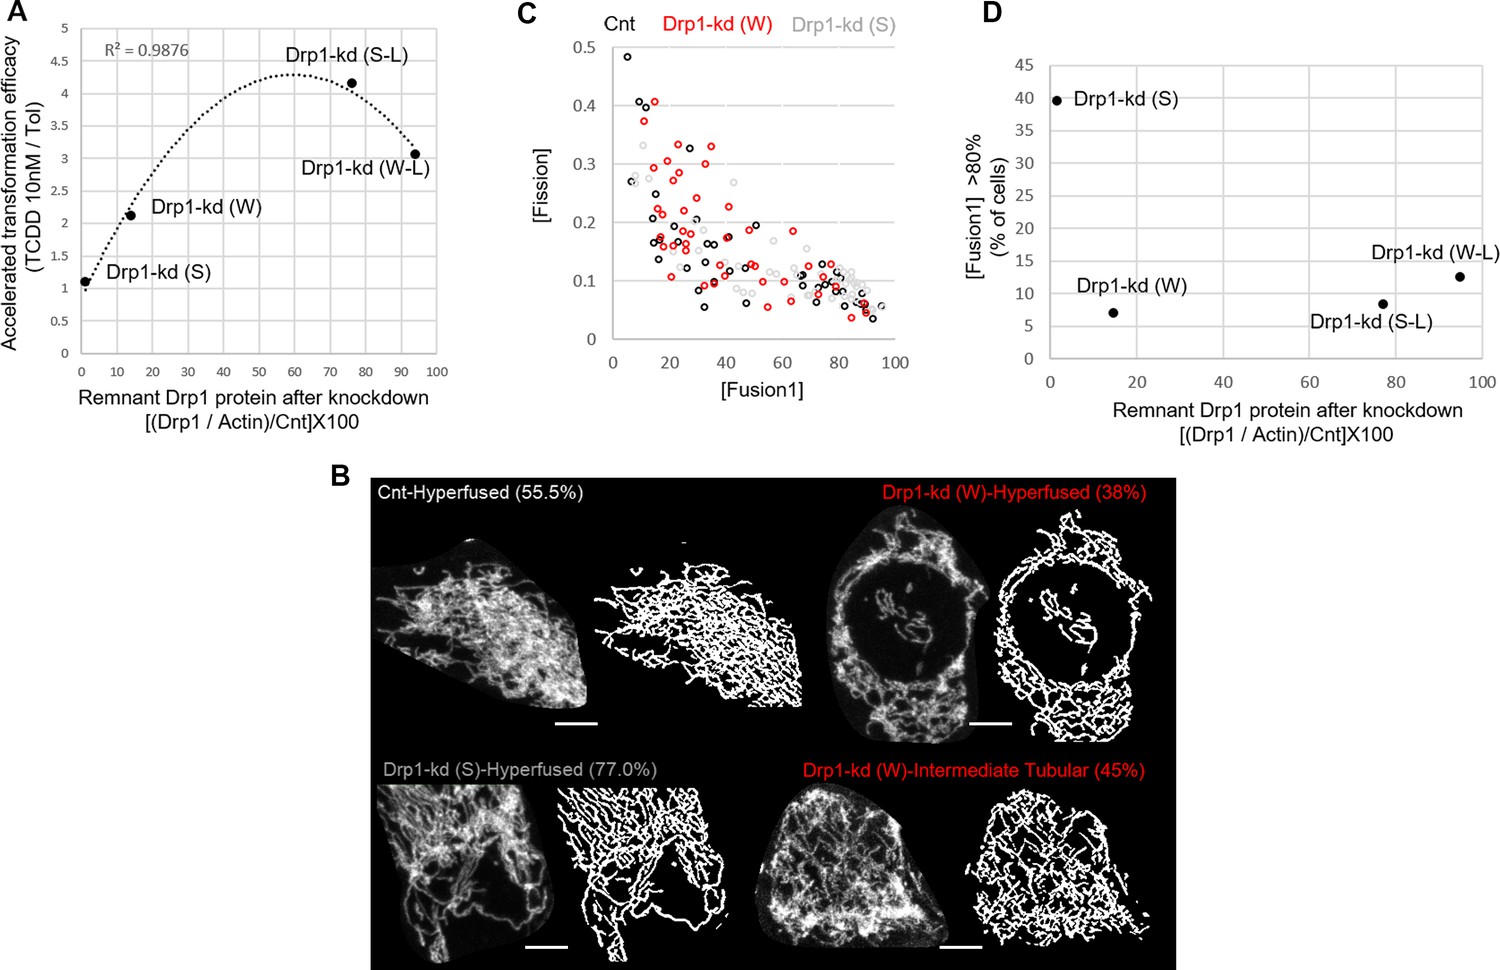
Further analyses of transformation efficacy and mitochondrial shape of Drp1 knockdown HaCaT cells.
(A) Dot plot of accelerated transformation efficacy vs remnant Drp1 protein after Drp1 knockdown with description of each data point; R2 value of the regression line mentioned. (B) Representative maximum intensity projections (MIP) of confocal optical sections (micrograph) and the corresponding MitoGraph generated binary images (binary) for quantifying [Fission] and [Fusion1/5] metrics of control and Drp1 knockdown Parental cells; the cells represent populations in colored boxes in Figure 4I while the number depicts their abundance in percentage; Scale bar depicts 15 μm. (C) Dot plot of [Fission] vs [Fusion1]. (D) Dot plot of % cells with >80 [Fusion1] vs remnant Drp1 protein after Drp1 knockdown with description of each data point.
Figure 5 with 2 supplements
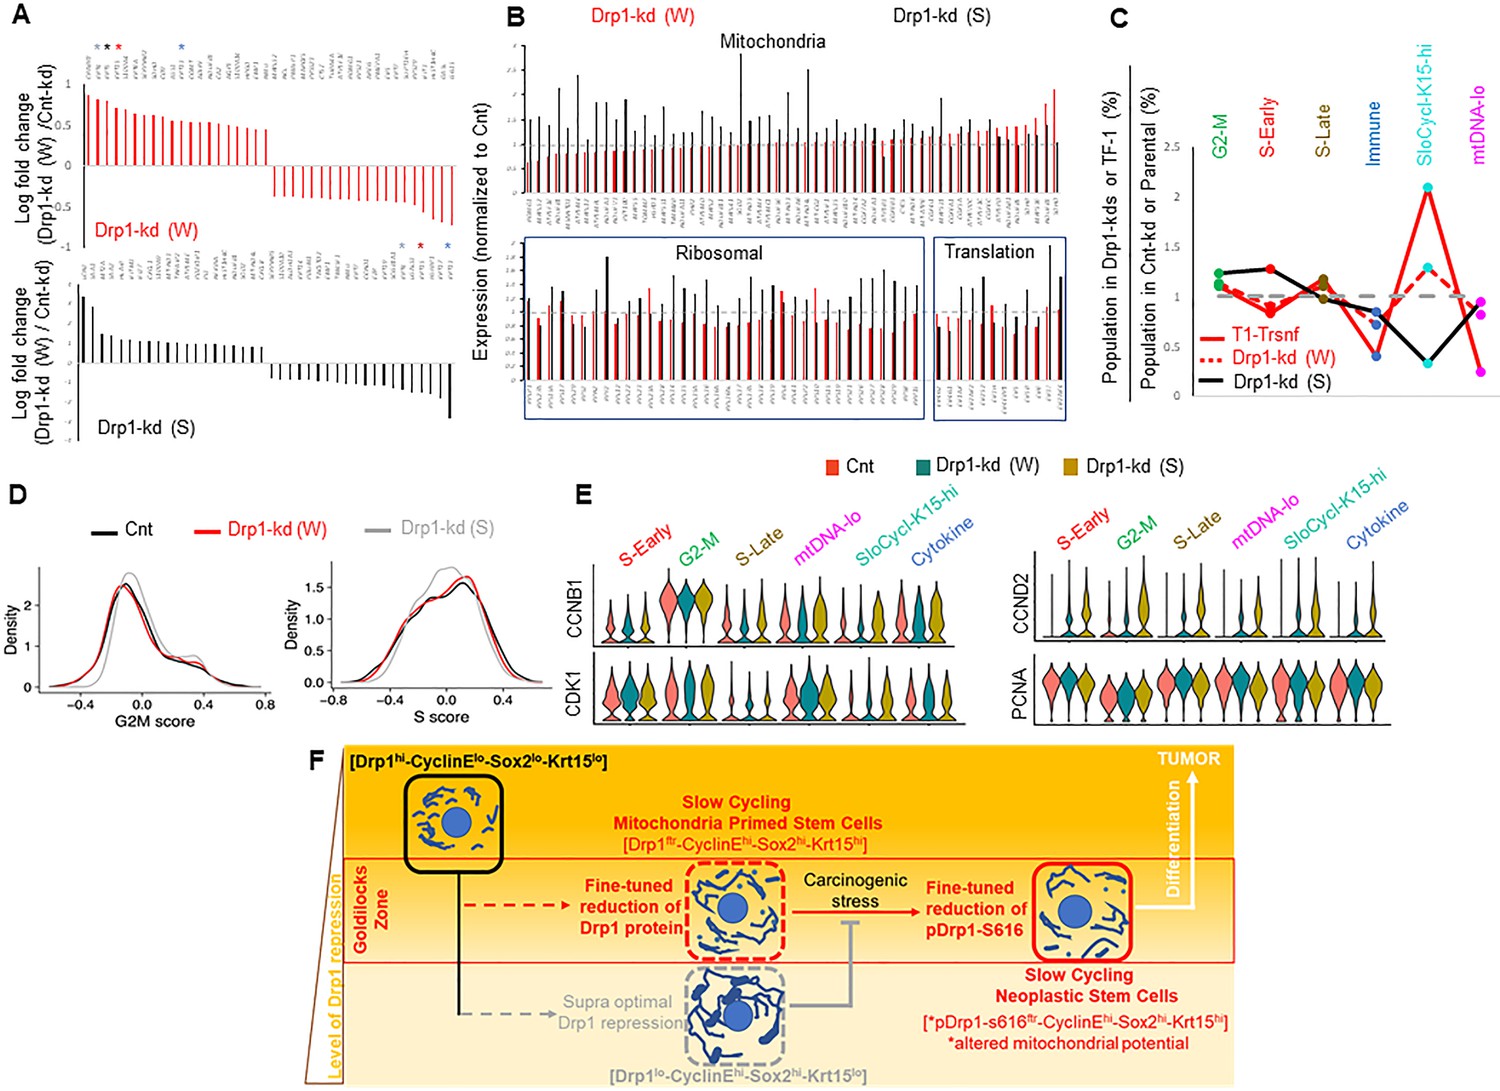
Fine-tuned Drp1 repression sustains transcriptomic profile similar to the neoplastic stem/progenitor cell enriched TF-1 population, which is suppressed by more complete Drp1 repression.
(A) Bar plots showing positive and negative log fold change values of top 20 genes in Parental cells with weaker (W) (Top) or stronger (S) (bottom) Drp1 knockdown with respect to control knockdown; 0 signifies no change and color coded * denote relevant KRT genes (larger figure in Figure 5—figure supplement 2A). (B) Bar plot showing ratio of absolute expression values of mitochondrial genes (top) and ribosomal or protein translation genes (bottom) in the Parental cells with Drp1 knockdown normalized to control knockdown; one signifies no change (larger figure in Figure 5—figure supplement 2B). (C) Line plot showing % population of Parental cells with Drp1 knockdown in the named scRNA-seq derived cell clusters, with respect to control knockdown. This is compared to the same in the TF-1 cells with respect to its control Parental population; gray dashed line signifies no change from respective controls. (D) Distribution of G2-M and S scores obtained from gene expression analyses of cell cycle predictive genes in Parental cells with Drp1 or control knockdown. (E) Violin plots depicting expression of key cell cycle genes in the designated scRNA-seq derived cell clusters in Parental cells with Drp1 or control knockdown. (F) Working model describing the key findings: a ‘goldilocks zone’ of fine- tuned Drp1 repression, achieved by reduction of protein levels or its S616 phosphorylation, maintains smaller fused mitochondrial networks and primes a stem/progenitor cell state to support carcinogenic transformation; more complete Drp1 repression sustains hyperfused mitochondria and prevents stem/progenitor cell state dependent neoplastic transformation.
-
Figure 5—source data 1
Cluster markers identified in Parental HaCaT cells expressing non-targeting, strong or weak Drp1 shRNA.
- https://cdn.elifesciences.org/articles/68394/elife-68394-fig5-data1-v2.xlsx
Figure 5—figure supplement 1
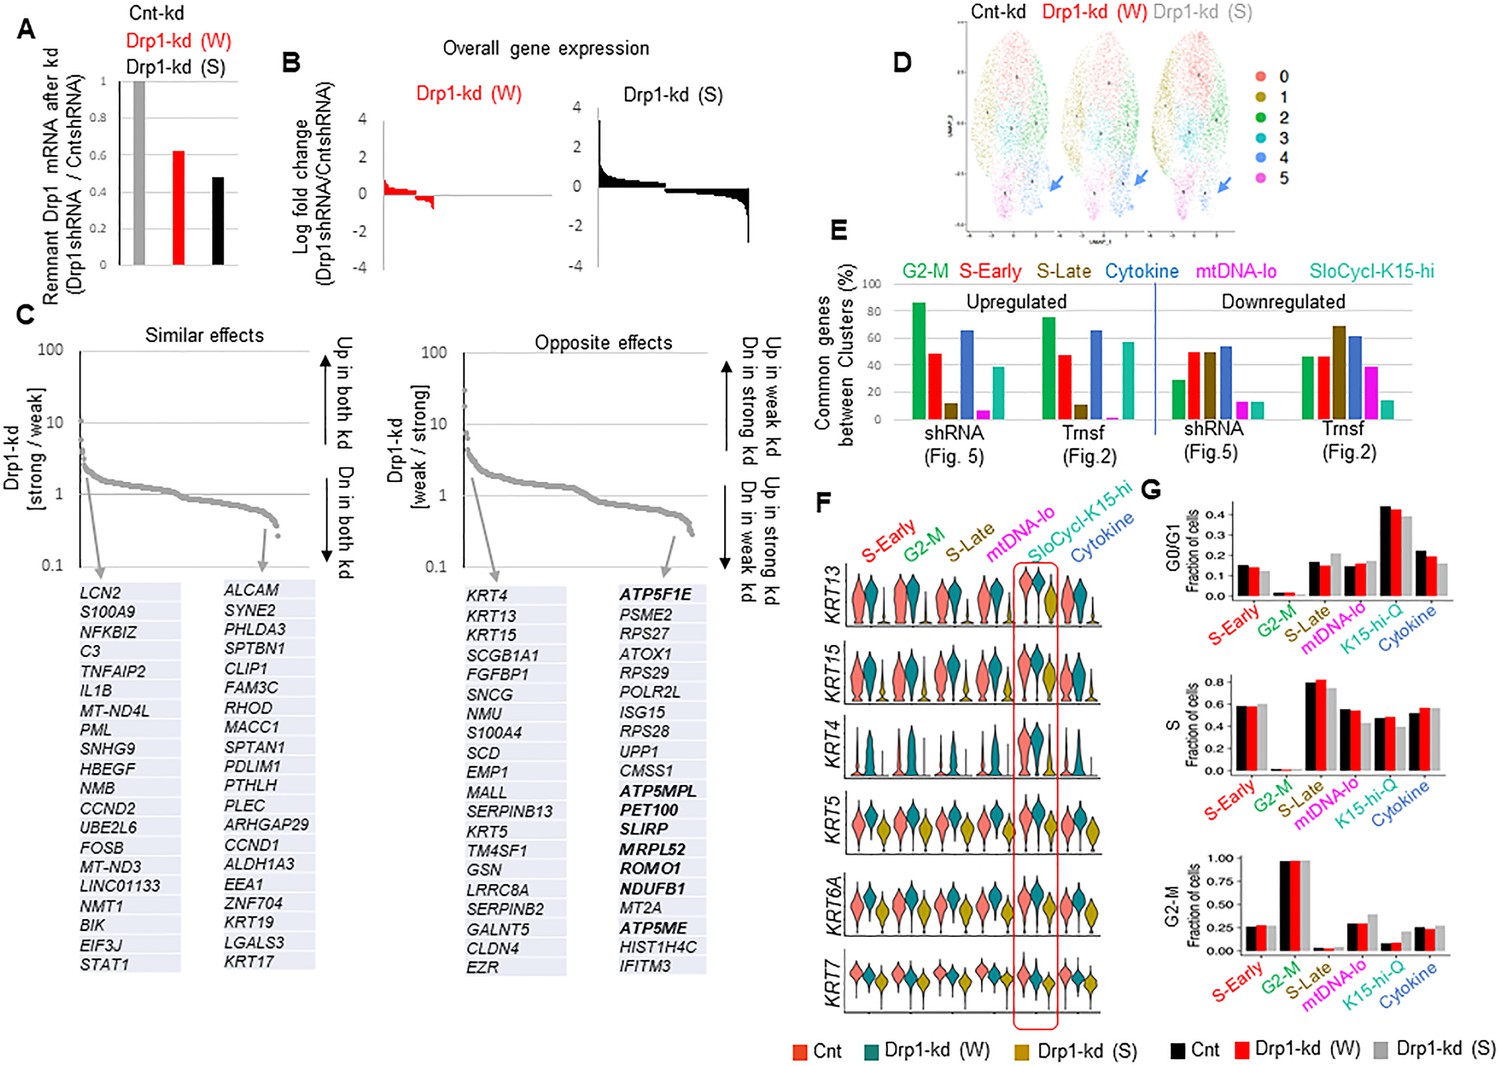
Further scRNA-seq analyses of Parental HaCaT cells expressing non-targeting shRNA, strong or weak Drp1 shRNA.
(A) Bar plot showing the knockdown efficiency of strong (S) or weak (W) DNM1L shRNA expressed as ratio of Drp1 transcript levels in the knockdown HaCaT and that of the cells expressing the non-targeted shRNA control. (B) Bar plot showing log fold change of overall gene expression of Drp1 knockdown Parental cells with respect to control knockdown. (C) Plots showing ratio of the expression of covered genes between the weak (W) or strong (S) Drp1 knockdown Parental cells; ‘Similar effects’ showing ratio of increase or decrease in the (S) Drp1 knockdown over the (W) Drp1 knockdown (back arrows in left panel), while opposite effects showing opposite trends in genes as labeled in the arrows (back arrows right panel); grey arrows point to the top 20 genes of each category. (D) UMAP plot of scRNA-seq based clusters (0–5) of control or Drp1 knockdown Parental cells; box outlines the SloCyc-K15-hi cluster (note color coding is not same as the one presented in Figure 2). (E) Bar plot showing percentage of statistically significant common genes (Upregulated or Downregulated) between color coded clusters obtained with the scRNA-seq data set of parental and transformed cells (Figure 2) and that of control or drp1 knockdown parental cells (Figure 4); same color coding is maintained between the two data sets. (F) Violin plots depicting expression of various KRT genes in the named scRNA-seq based cell clusters in the control and Drp1 knockdown Parental cells. (G) Bar plot showing fraction of cells in G2-M, S and G0/G1, computed from main Figure 5D, in the functionally categorized clusters in the control or Drp1 knockdown Parental cells.
Figure 5—figure supplement 2
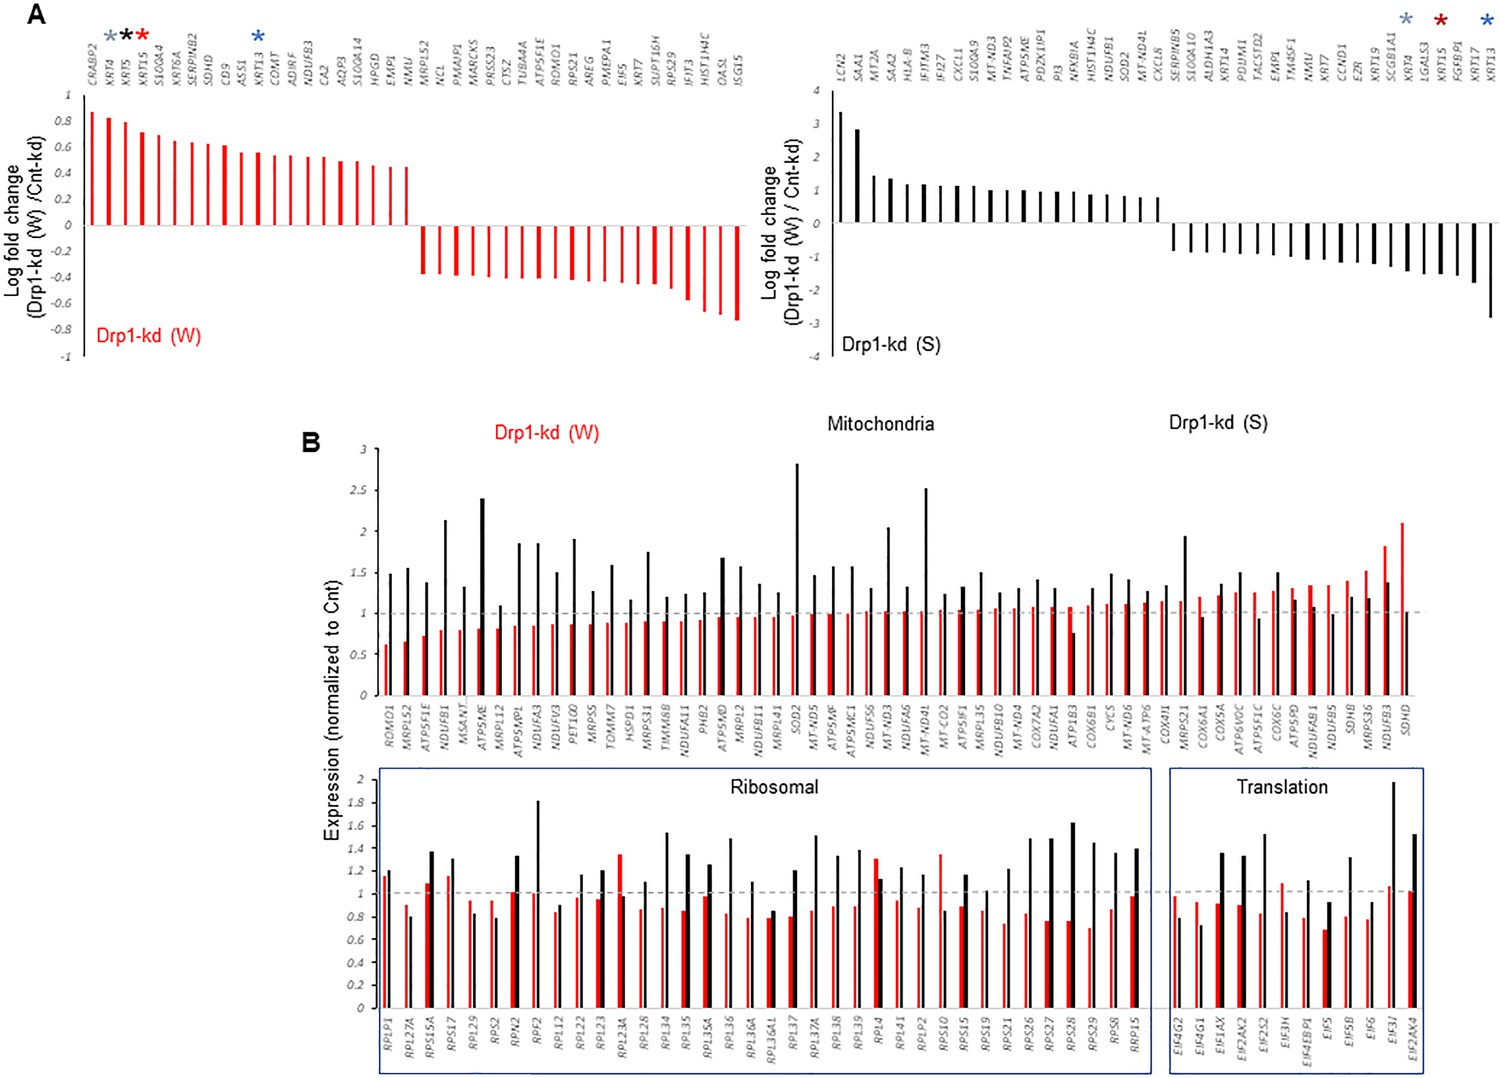
Enlarged Figure 5A and B with legible gene names.
Tables
Key resources table
| Reagent type (species) or resource | Designation | Source or reference | Identifiers | Additional information |
|---|---|---|---|---|
| Strain, strain background (Mouse, female) | Athymic Nude mice | Jackson Lab | RRID:IMSR_JAX:002019 | |
| Cell line (Human) | HaCaT | M.AtharPMID:27725709 | Gift | Originally obtained from AddexBioTechno-logies |
| Recombinant DNA reagent | pBABE-hDrp1(plasmid) (Human) | PMID:25658204 | Gift | Dr. Jerry ChipuK Lab |
| Recombinant DNA reagent | pBABE-hDrp1S616A(plasmid) (Human) | PMID:25658204 | Gift | Dr. Jerry ChipuK Lab |
| Recombinant DNA reagent | pBABE-hDrp1S616D(plasmid) (Human) | PMID:25658204 | Gift | Dr. Jerry ChipuK Lab |
| Recombinant DNA reagent | Human DNM1L shRNA1(plasmid) | DharmaconPMID:26446260 | Dharmacon Clone: TRCN0000001099 | Our previous publication |
| Recombinant DNA reagent | Human DNM1L shRNA2(plasmid) | PMID:26446260 | Dharmacon Clone: TRCN0000001097 | Our previous publication |
| Recombinant DNA reagent | Non-targeted shRNA control(plasmid) | PMID:26446260 | Sigma SHC016 | Our previous publication |
| Recombinant DNA reagent | pCMX-mito-PSmOrange(fluorescent protein reporter) | PMID:30910831 | Available from us on request. | Our previous publication |
| Antibody | Drp1(Mouse, Clone 8/DLP1) | BD Transduction | 611,112RRID:AB_398423 | WB (1:1000)IF (1:100) |
| Antibody | pDrp1 S616(Rabbit, clone D9A1) | Cell Signaling | 4,494RRID:AB_11178659 | WB (1:1000)IF (1:100) |
| Antibody | Cyclin Sampler(Mouse or Rabbit monoclonal) | Cell Signaling | 9,869RRID:AB_1903944 | WB (1:1000)IF (1:100) |
| Antibody | Actin(Mouse, clone Ab5) | BD Transduction | 612656 RRID:AB_2289199 | WB (1:10000) |
| Antibody | Sox2(Mouse, clone 030–678) | BD Pharmingen | 561,469RRID:AB_10694256 | WB (1:500)IF (1:100) |
| Antibody | HSP60(Mouse, clone 24/HSP60) | BDTransduction | 611,563RRID:AB_399009 | IF (1:200) |
| Antibody | pCyclin E- T62(Rabbit polyclonal) | Cell Signaling | 4,136RRID:AB_2071080 | IF (1:50) |
| Antibody | Fis1(Mouse, clone B-5) | SantaCruz | sc-376447 | WB (1:1000) |
| Antibody | TOM20(Mouse, clone D8T4N) | Cell Signaling | 42,406RRID:AB_2687663 | WB (1:5000)IF (1:200) |
| Antibody | MFN2(Rabbit, clone7H42L13) | ThermoFisher | 702,768 | WB (1:1000) |
| Antibody | MFN1(Rabbit, clone D6E2S) | Cell Signaling | 14,739RRID:AB_2744531 | WB (1:1000) |
| Antibody | Opa1(Mouse, clone 1E8-1D9) | ThermoFisher | MA5-16149RRID:AB_11153569 | WB (1:1000) |
| Antibody | AHR(Mouse, cloneRPT1) | ThermoFisher | MA1-514RRID:AB_2273723 | WB (1:1000) |
| Antibody | CytochromeC(Rabbit polyclonal) | Cell Signaling | 4,272RRID:AB_2090454 | WB (1:1000) |
| Antibody | Cytokeratin15(Rabbit, cloneEPR1614Y) | Abcam | ab52816RRID:AB_869863 | WB (1:2000)IF (1:200) |
| Chemical compound, drug | TCDD | Sigma | 48,599 | Solution in Toluene |
| Software, algorithm | MitoGraph v2.1 | PMID:30910831PMID:25640425 | https://github.com/vianamp/MitoGraph (Viana, 2020) | Rafelski lab; freely available |
| Chemical compound, drug | Fluoromount G | Southern Biotech | 0100–01 | |
| Other | FuGENE 6(Transfection Reagent) | Promega | E2691 | |
| Other | Lipofectamine 3,000(Transfection Reagent) | Invitrogen | L3000001 | |
| Other | sc-RNAseq data generated here in | This paper | Gene expression omnibusGSE171772 | Raw, analyzed and meta data deposited in Gene expression omnibus |
| Software, algorithm | Cell Ranger | 10 X Genomics | RRID:SCR_017344 | |
| Software, algorithm | Seurat | https://satijalab.org/seurat/get_started.html | RRID:SCR_016341 | Freely available |
Additional files
Download links
A two-part list of links to download the article, or parts of the article, in various formats.
Downloads (link to download the article as PDF)
Open citations (links to open the citations from this article in various online reference manager services)
Cite this article (links to download the citations from this article in formats compatible with various reference manager tools)
Fine-tuned repression of Drp1-driven mitochondrial fission primes a ‘stem/progenitor-like state’ to support neoplastic transformation
eLife 10:e68394.
https://doi.org/10.7554/eLife.68394


