EPHX1 mutations cause a lipoatrophic diabetes syndrome due to impaired epoxide hydrolysis and increased cellular senescence
- Sorbonne Université-Inserm UMRS_938, Centre de Recherche Saint-Antoine (CRSA), France
- Institute of Cardiometabolism and Nutrition (ICAN), CHU Pitié-Salpêtrière - Saint-Antoine, Assistance Publique-Hôpitaux de Paris (AP-HP), France
- Department of Entomology and Nematology, and UC Davis Comprehensive Cancer Center, University of California, Davis, United States
- Department of Pediatrics, Columbia University Irving Medical Center, United States
- Deparment of Medicine, Columbia University Irving Medical Center, United States
- Service de Génétique Clinique, Hôpital Necker-Enfants Malades, AP-HP, France
- Goryeb Children’s Hospital, Atlantic Health Systems, Morristown Memorial Hospital, United States
- Service de Diabétologie-Métabolisme, Hôpital Pitié-Salpêtrière, AP-HP, France
- Sorbonne Université-Inserm UMRS_1269, France
- Centre National de Référence des Pathologies Rares de l’Insulino-Sécrétion et de l’Insulino-Sensibilité (PRISIS), Service de Diabétologie et Endocrinologie de la Reproduction, Hôpital Saint-Antoine, AP-HP, France
- Laboratoire commun de Biologie et Génétique Moléculaires, Hôpital Saint-Antoine, AP-HP, France
Figures
Figure 1 with 3 supplements
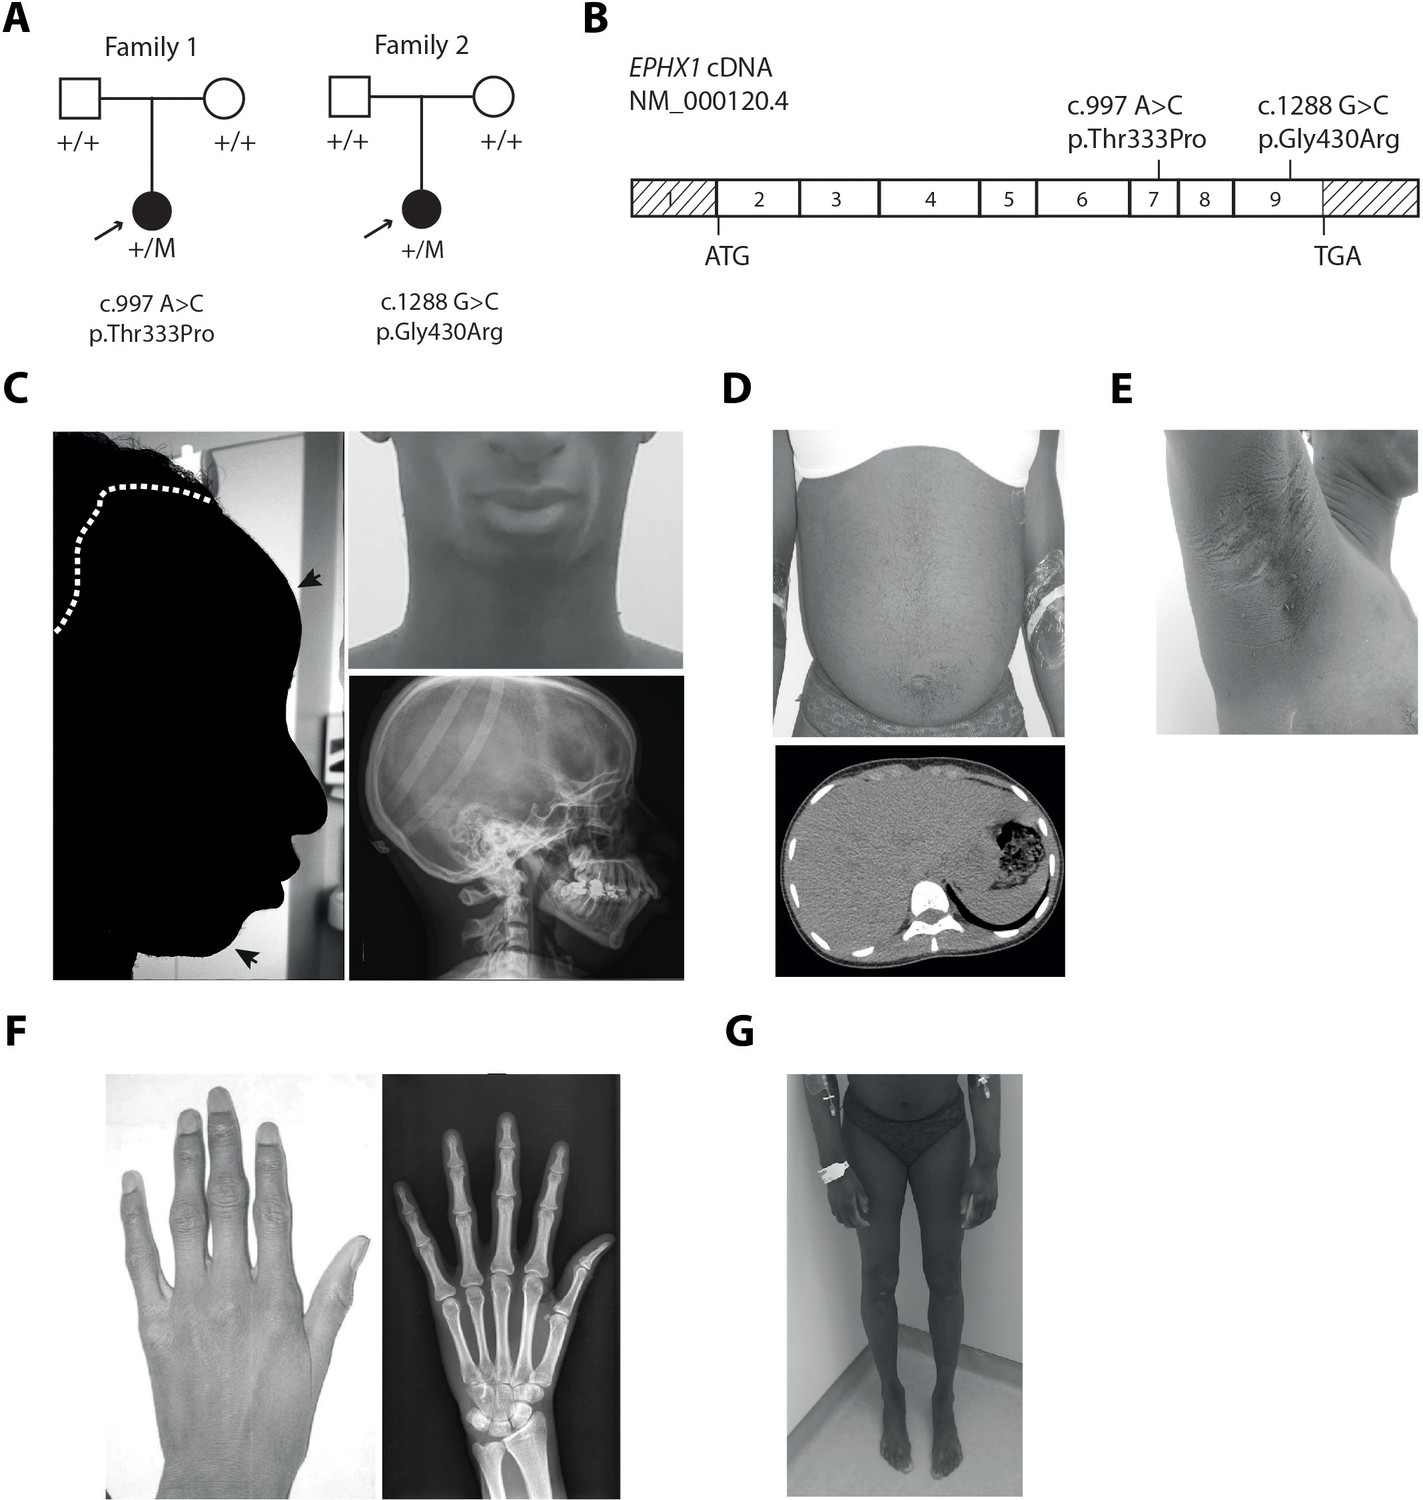
EPHX1 pathogenic variants in a newly characterized lipoatrophic diabetes syndrome.
(A) Genealogical trees and segregation analysis for the two EPHX1 variants identified in this study. Arrows indicate probands. p.Thr333Pro and p.Gly430Arg were absent from both parents of each proband, indicating that they occurred de novo. +, normal allele; M, mutant allele. (B) Schematic of EPHX1 transcript displaying the location of the two variants identified. (C) Characteristics of the patient’s head. Left: Black shadow of the patient’s profile over a grayscale photo. Black arrows point to frontal bossing and retrognathism. The white dotted line indicates the base of the scalp showing high hair line. Top right: Front photo of the patient’s face showing lipoatrophy and retrognathism. Bottom right: Profile radiography of the skull showing teeth misalignments and mandibulo-facial dysostosis. (D) Top: Frontal photo of the patient’s abdomen showing prominent abdomen with umbilical herniation and hirsutism. Bottom: axial computed tomography slice of the abdomen showing hepatomegaly and liver steatosis. (E) Picture of the armpit showing acanthosis nigricans and molluscum pendulum. (F) Picture (left) and radiography (right) of the left-hand showing arachnodactyly with tapered fingers and thickening of proximal interphalangeal joints. (G) Front picture of the legs showing distal lipoatrophy.
Figure 1—figure supplement 1
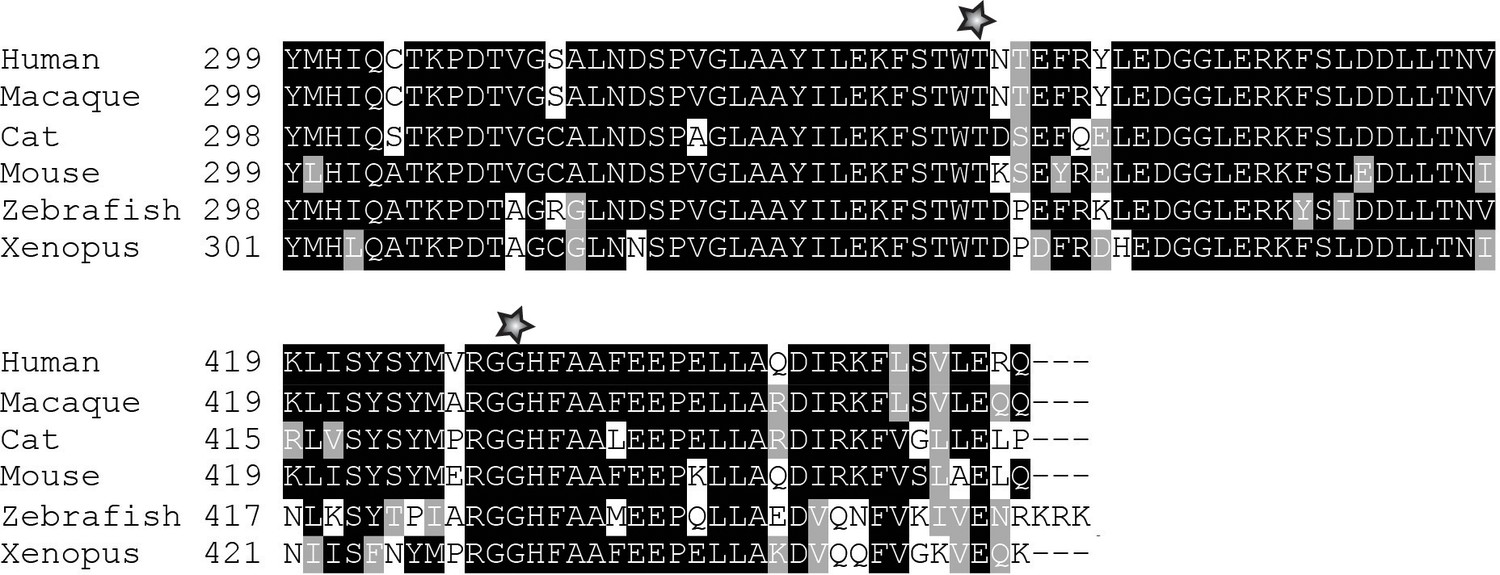
Partial protein alignment of human EPHX1 across species.
Partial protein alignment of human EPHX1 (GenBank accession NP_001129490.1) with corresponding sequences in other species: macaque, NP_001245016.1; cat, XP_011289115.1; mouse, NP_034275.1; zebrafish, NP_957362.1; Xenopus, NP_001121449.1. Residues Thr333 and Arg430 are indicated by a star. Black shading indicates identical residues, and gray shading indicates semi-conserved residues.
Figure 1—figure supplement 2

Fat distribution and body composition in patient 1.
(A) Dual-energy x-ray absorptiometry (DXA)-scan showing the bone mineral content (blue), lean tissues (red), and a major lack of fat (yellow). (B) Comparison of whole body measures of fat percentage in patient 1 to reference values from the National Health and Nutrition Examination Survey (NHANES), which partitioned dataset by gender and ethnicity (Kelly et al., 2009). The position of patient 1 (age: 25 years; total body % fat: 15.8; Z-score: −2.8) is indicated by a red cross. (C) Total and segmental body composition. Comparison to a normal young adult population is expressed as T-score. Comparison to an age-matched normal population is expressed as Z-score. BMC: bone mineral content. (D) Adipose indices.
Figure 1—figure supplement 3
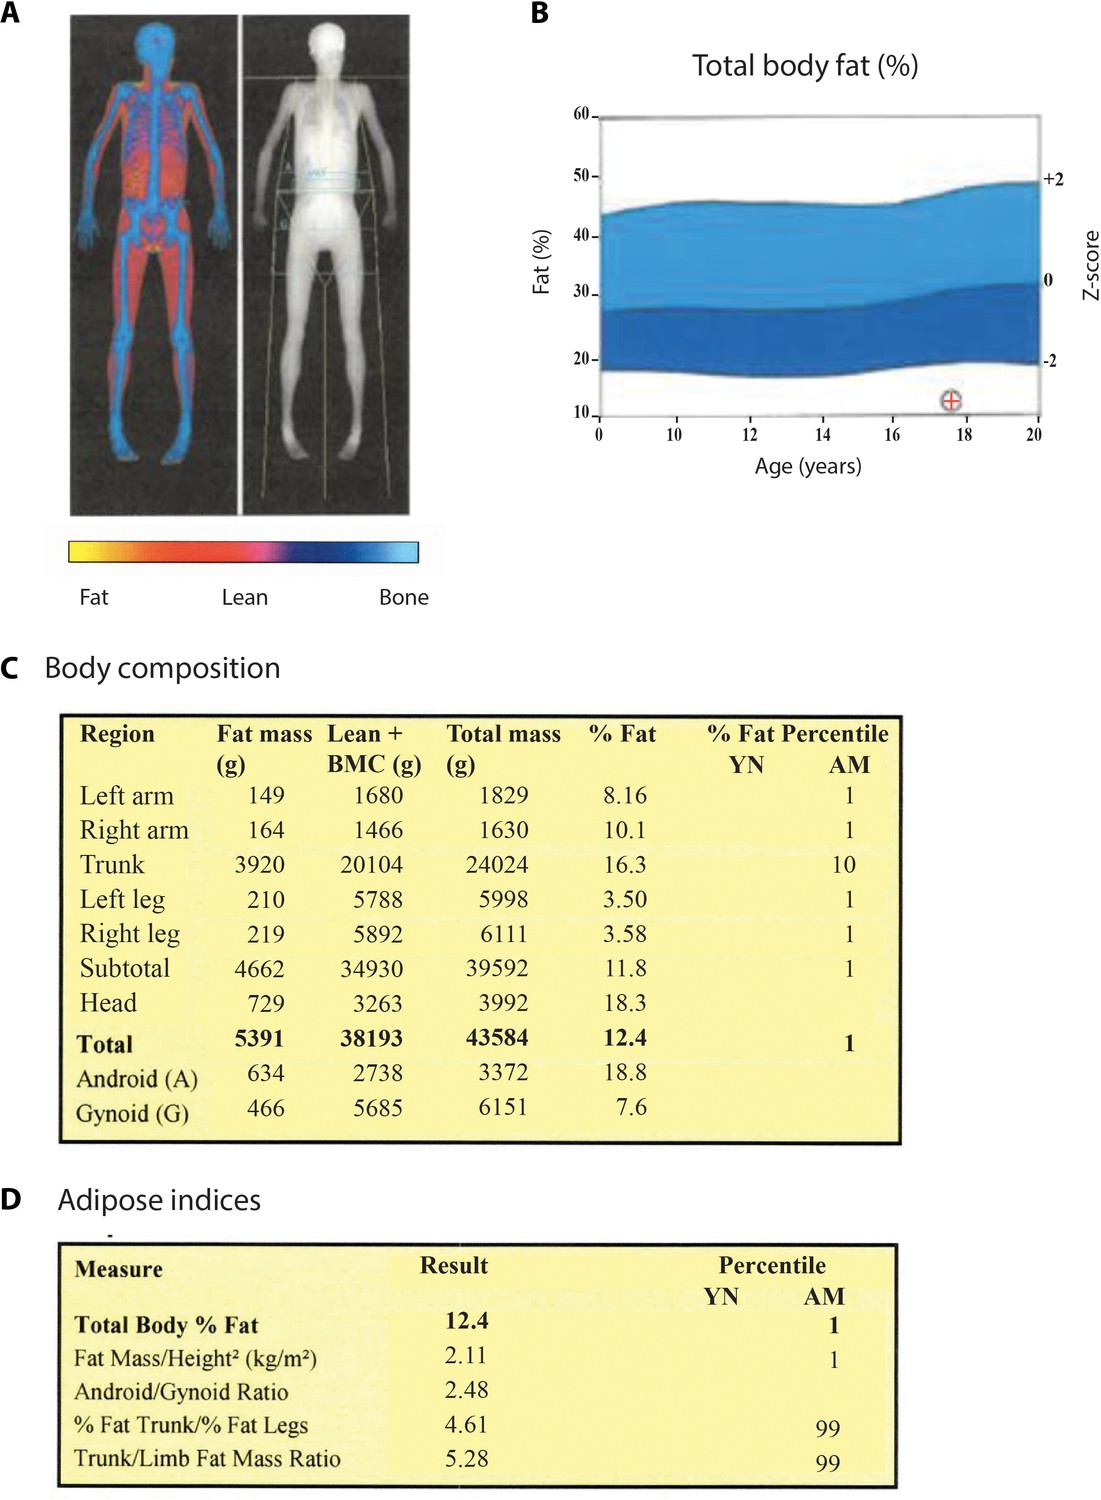
Fat distribution and body composition in patient 2.
(A) DXA-scan showing the bone mineral content (blue), lean tissues (red), and a major lack of fat (yellow). (B) Comparison of whole body measures of fat percentage in patient 2 to reference values from the National Health and Nutrition Examination Survey (NHANES), which partitioned dataset by gender and ethnicity (Kelly et al., 2009). The position of patient 2 (age: 17 years; total body % fat: 12.4) is indicated by a red cross. (C) Total and segmental body composition. BMC: bone mineral content. YN: young normal; AM: age matched. (D) Adipose indices.
Figure 2 with 2 supplements
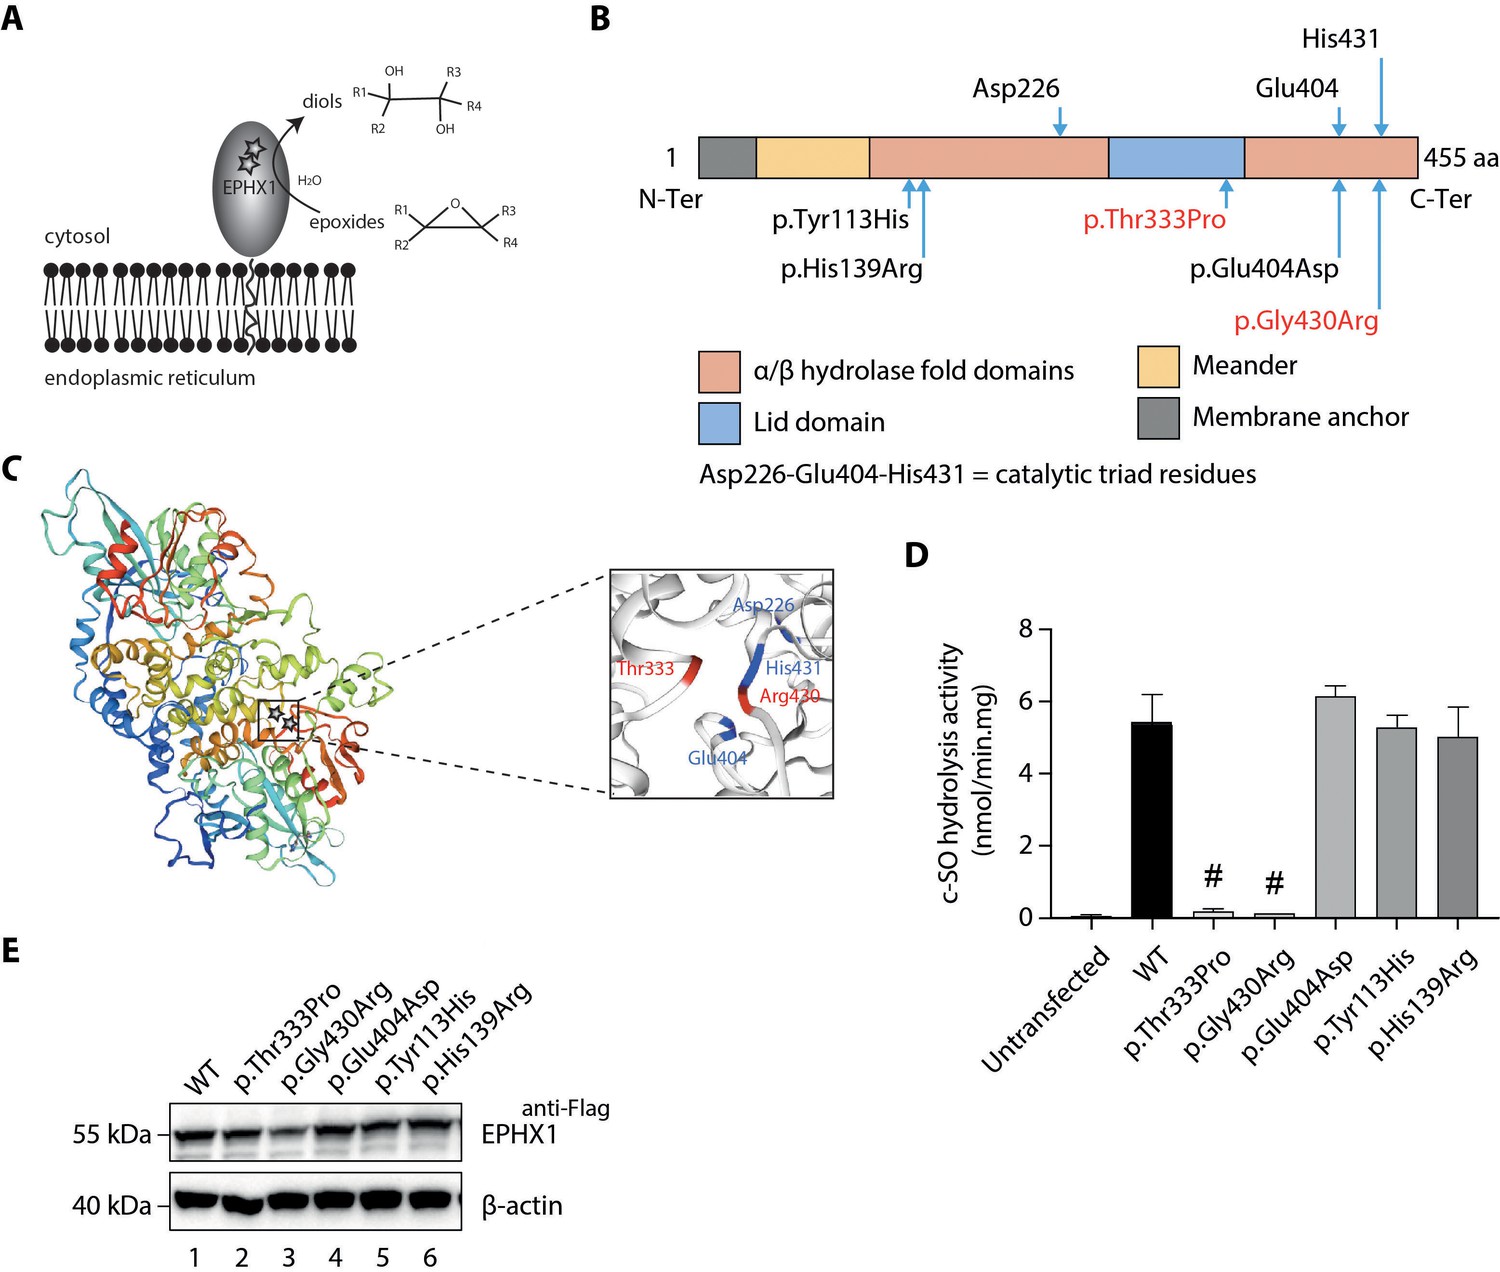
Loss of EPHX1 hydrolysis activity due to the p.Thr333Pro and p.Gly430Arg variants.
(A) Schematic representation of the EPHX1 protein, showing its sub-cellular localization and function. Epoxide hydrolases open three membered cyclic ethers, known as epoxides, by the addition of water to yield 1,2-diols. The location of the amino acids affected by the missense variants identified in this study are indicated by stars. (B) Schematic representation of the variants used in functional tests. Residues of the catalytic triad are shown above the protein structure. Variants used in functional assays are depicted below. Variants identified in patients are displayed in red. (C) Model of the 3D structure of EPHX1, based on the quaternary structure of the closely homologous EH enzyme from the Aspergillus niger fungus (Zou et al., 2000). On the left panel, the location of the two variants identified in patients are indicated by a star. On the right panel, the two variants found in patients are depicted in red and the three key residues of the catalytic site in blue. (D) c-SO (cis-stilbene oxide) hydrolysis assay performed in HEK 293 cells transiently expressing Flag-tagged wild-type (WT) and mutated forms of human EPHX1, as indicated. Results are expressed as means ± SEM of three independent biological experiments, each of them being performed in duplicates. # indicates that hydrolysis activity of EPHX1 carrying the p.Thr333Pro and p.Gly430Arg de novo variants was abolished, compared with WT and other variants. (E) Western blot analysis aimed at controlling the expression of WT and mutant forms of EPHX1 in protein extracts used in c-SO hydrolysis assays presented in (D), using antibodies as indicated. Numbers on the left correspond to molecular weight markers (kDa). Western blot images are representative of two independent experiments.
Figure 2—figure supplement 1
Oxylipin profiling in patient 1.
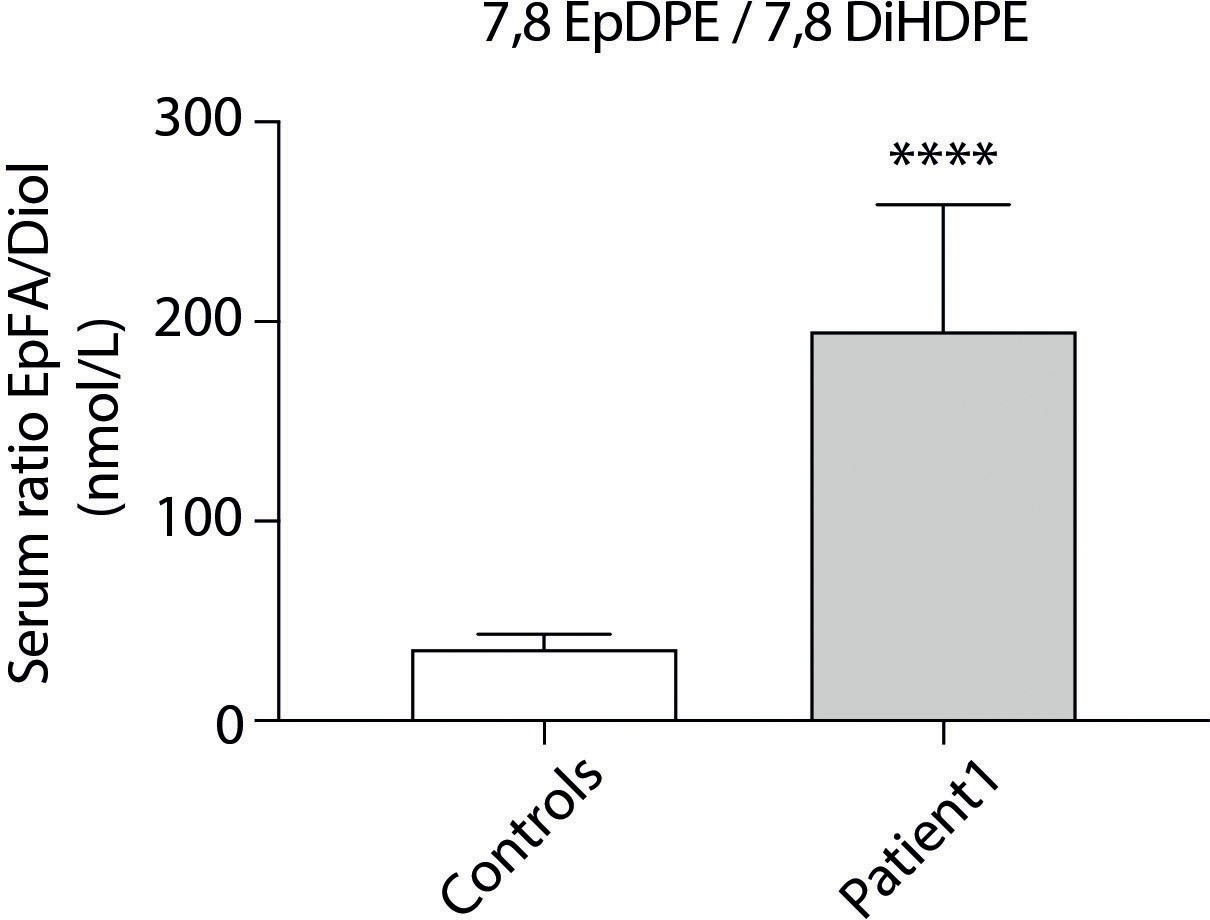
A panel of epoxy fatty acids (EpFAs) dervived from arachidonic acid, linoleic acid, eicosapentaenoic acid, and docosahexaenoic acid was investigated, together with their corresponding diols. Nine measurements were performed in plasma samples from patient 1 collected on different days and 11 sex- and age-matched control women with normal BMI. Ratios between EpFA products and diol substrates were calculated showing increased levels of 7,8 epoxydocosapentaenoic acid (EpDPE) and decreased levels of 7,8 dihydroxydocosapentaenoic acid (7,8 DIHDPE) in patient 1, as compared to controls. Results are expressed as means ± SEM.
Figure 2—figure supplement 2
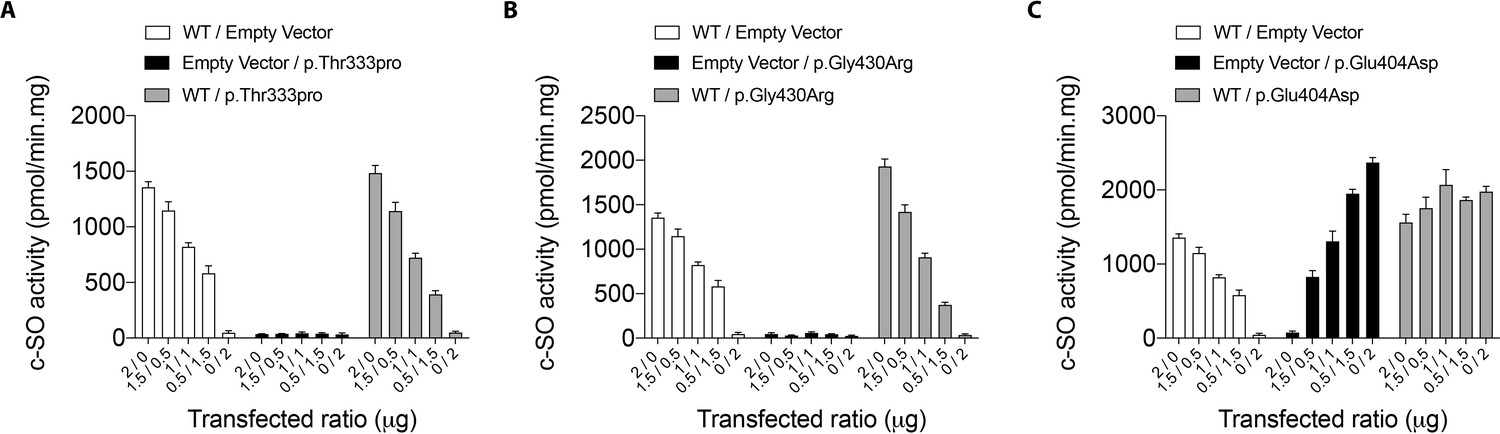
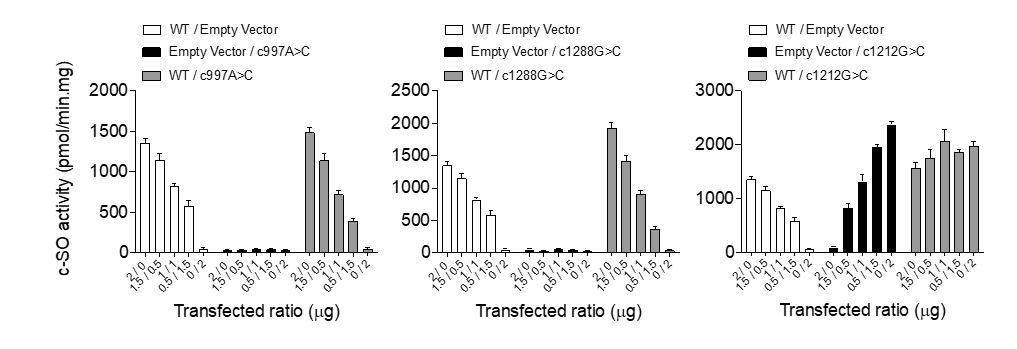
cis-stilbene oxide (c–SO) hydrolysis activity of co-expressed WT and mutant EPHX1 isoforms.
HEK 293 cells co-expressing WT EPHX1 (hEPHX1WT) and hEPHX1Thr333Pro (A), or hEPHX1Gly430Arg (B), or hEPHX1Glu404Asp (C) in varying ratios did not reveal a dominant negative effect of pathogenic variants. WT and mutant EPHX1 isoforms were also expressed alone, the total amount of transfected DNA being kept constant using an empty vector. Results are expressed as means ± SEM of four independent biological experiments.
Figure 3
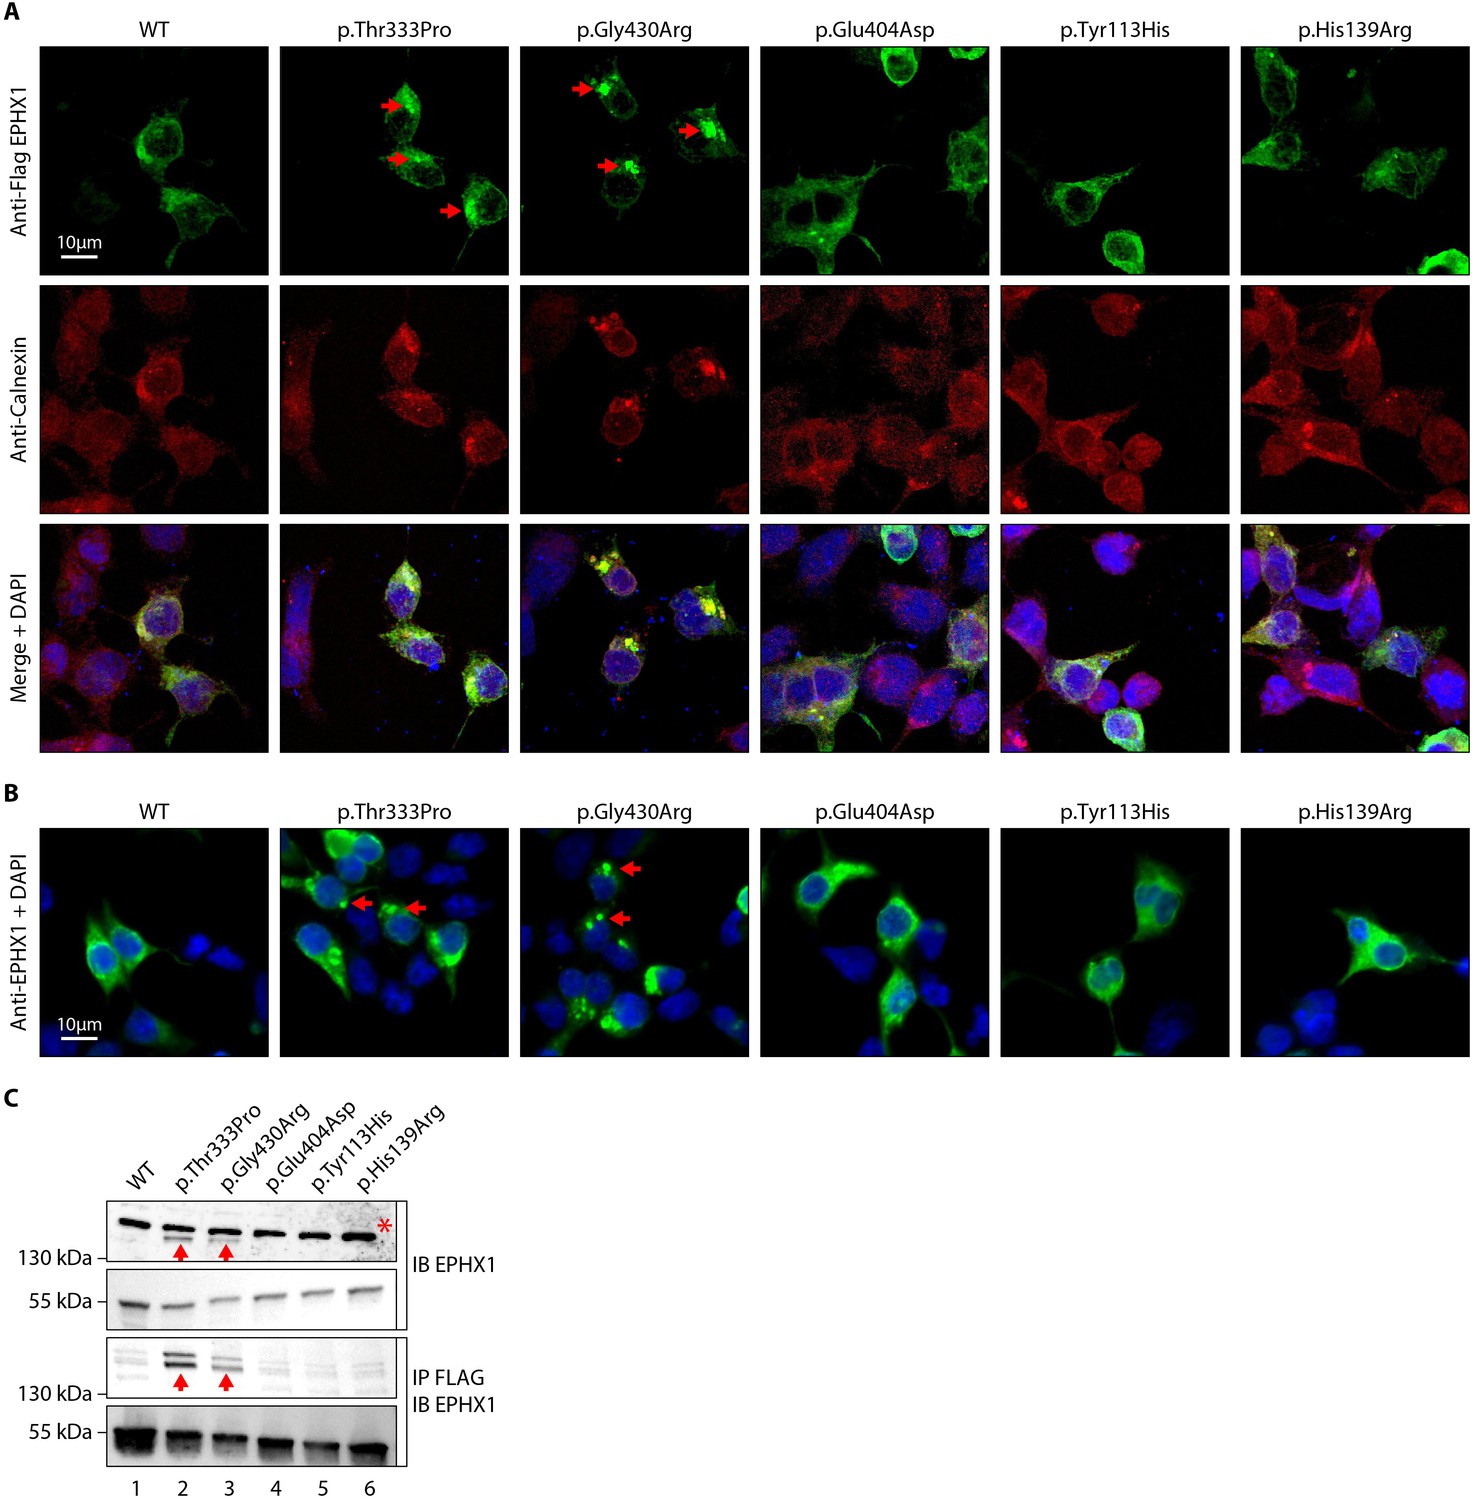
The p.Thr333Pro and p.Gly430Arg variants induce the formation of EPHX1 higher-order complexes within the endoplasmic reticulum.
(A) HEK 293 cells transiently expressing Flag-tagged wild-type (WT) and mutated isoforms of human EPHX1 were grown on coverslips, fixed, permeabilized, and stained with an anti-Flag antibody followed by an anti-Calnexin antibody. They were then incubated with Alexa Fluor 594- and 488-conjugated secondary antibodies and visualized by confocal microscopy. Nuclei were counterstained with DAPI (blue). Red arrows point to EPHX1 higher-order complexes. Representative pictures of three independent experiments are presented. Scale bar is 10 μm. (B) Immunofluorescence staining of HEK 293 cells transiently expressing WT and mutated isoforms of human EPHX1 using an anti-EPHX1 antibody and visualized using an Alexa Fluor 488-conjugated goat anti-rabbit secondary antibody. Nuclei were counterstained with DAPI (blue). Representative pictures of two independent experiments are presented. Scale bar is 10 μm. (C) HEK 293 cells were transiently transfected with Flag-tagged WT and mutated isoforms of human EPHX1. Whole-cell extracts were prepared 24 hr later, immunoprecipitated with an anti-Flag antibody and analyzed by western blotting using an anti-EPHX1 antibody. The formation of EPHX1 higher-order complexes in the presence of the p.Thr333Pro and p.Gly430Arg variants is shown by red arrows. The asterisk indicates a non-specific band present only in direct immunoblotting using anti-EPHX1 antibody. Numbers on the left correspond to molecular weight markers (kDa). Western blot images are representative of three independent experiments.
Figure 4 with 5 supplements
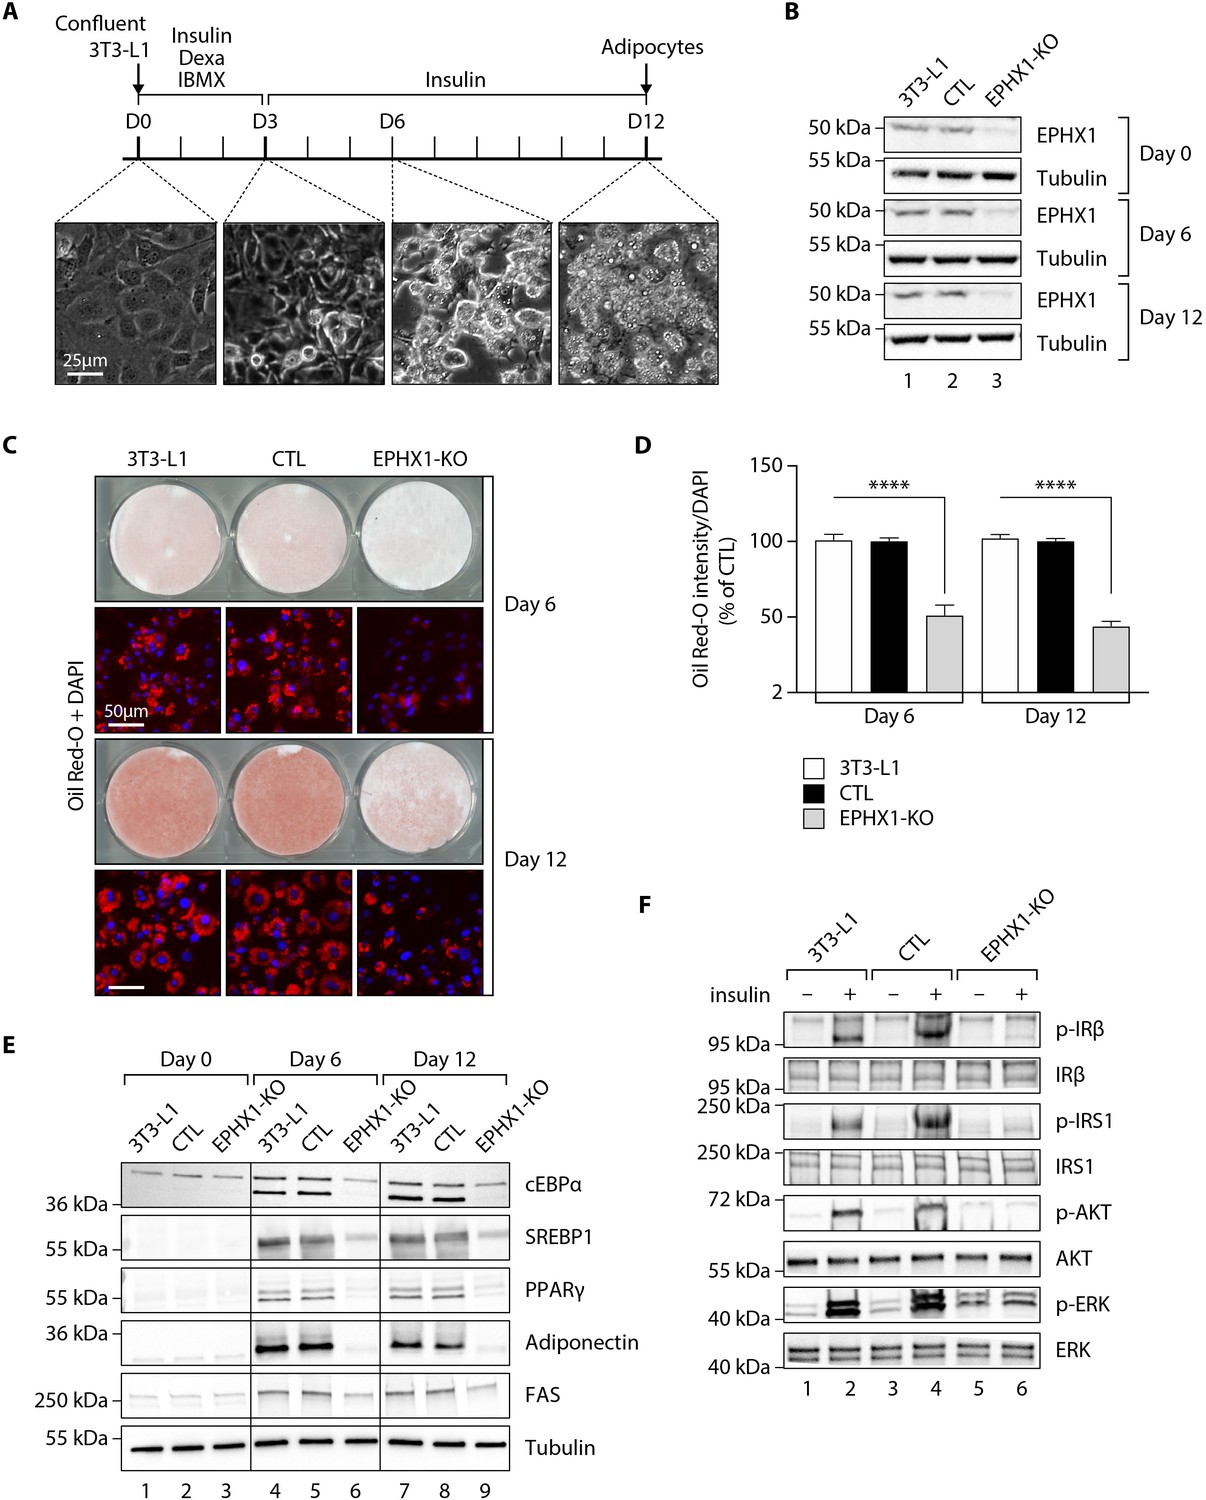
Ephx1 deficiency suppresses adipocyte differentiation of 3T3-L1 cells and alters insulin signaling.
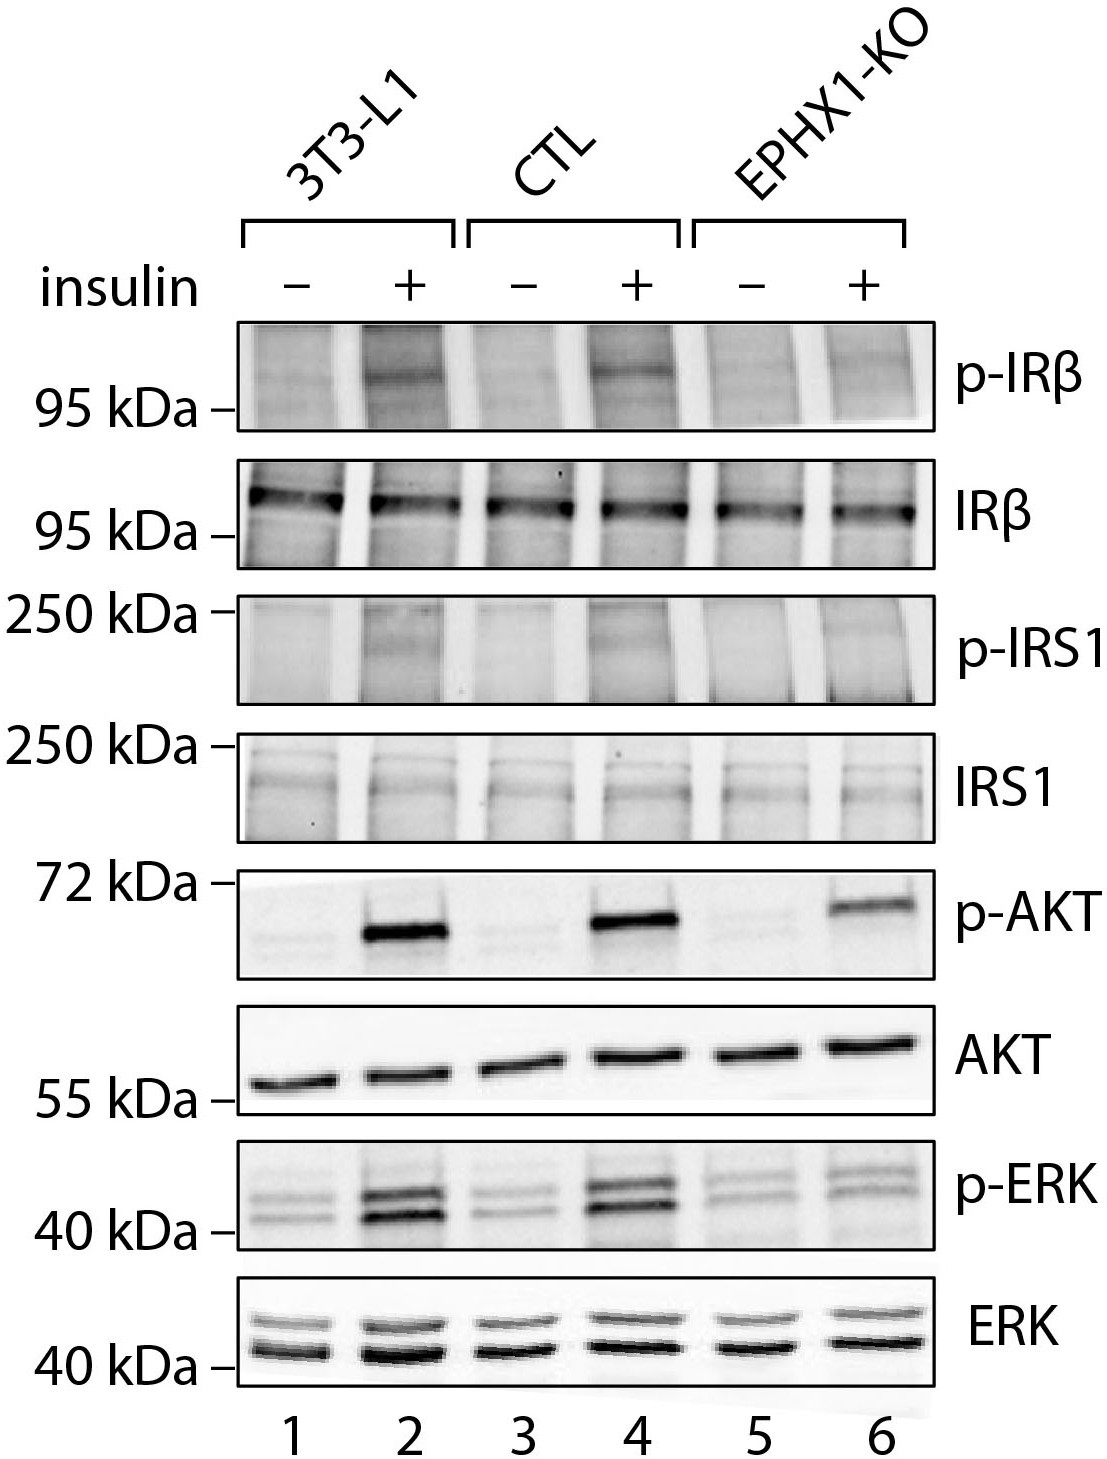
Data were obtained in 3T3-L1 pre-adipocytes from ATCC, 3T3-L1 cells with a CRISPR-Cas9-mediated Ephx1-knockout (KO), and 3T3-L1 cells transfected with a Cas9/scramble gRNA plasmid corresponding to control (CTL) cells. (A) Timeline representation of the 3T3-L1 pre-adipocyte differentiation process using a hormonal cocktail. Dexa: dexamethasone; IBMX: 3-isobutyl-1-methylxanthine; D0–D12: Day 0 to Day 12. (B) Validation of Ephx1 KO in 3T3-L1 pre-adipocytes and study of its expression during adipocyte differentiation. Numbers on the left correspond to molecular weight markers (kDa). Western blot images are representative of three independent experiments. (C) Adipocyte differentiation assessed by Oil Red O lipid staining. 3T3-L1 pre-adipocytes were studied during adipocyte differentiation for 12 days. First and third lines: Pictures of dishes stained by Oil Red O. Images are representative of three independent experiments. Second and fourth lines: representative images of fluorescence microscopy after staining of intracellular lipids (Oil Red O, red) and nuclei (DAPI, blue). Images are representative of five independent experiments. (D) Quantification of Oil Red O fluorescence normalized to DNA content (DAPI). Results are expressed as means ± SEM of five independent experiments. ****p<0.0001. p-values were determined by analysis of variance (ANOVA) with Kruskal–Wallis post hoc multiple comparison test. (E) Protein expression of adipocyte markers obtained by western blotting during in vitro adipocyte differentiation of 3T3-L1 pre-adipocytes. Numbers on the left correspond to molecular weight markers (kDa). Western blot images are representative of three independent experiments. PPARγ: peroxisome proliferator-activated receptor gamma; C/EBPα: CCAAT/enhancer-binding protein alpha; SREBP-1c: sterol regulatory element-binding protein-1c; FAS: fatty acid synthase. (F) Activation of insulin signaling in 3T3-L1 pre-adipocytes after 10 days of adipocyte differentiation. The 3T3-L1 cells from ATCC, CTL, and Ephx1-KO cells were deprived of serum for 6 hr, stimulated with 20 nM insulin for 5 min or left untreated, and subjected to immunoblotting with antibodies against total and phospho-insulin receptor β-subunit (IRβ), insulin receptor substrate-1 (IRS1), AKT, and extracellular-regulated kinase (ERK)1/2. Numbers on the left correspond to molecular weight markers (kDa). Western blot images are representative of three independent experiments.
Figure 4—figure supplement 1
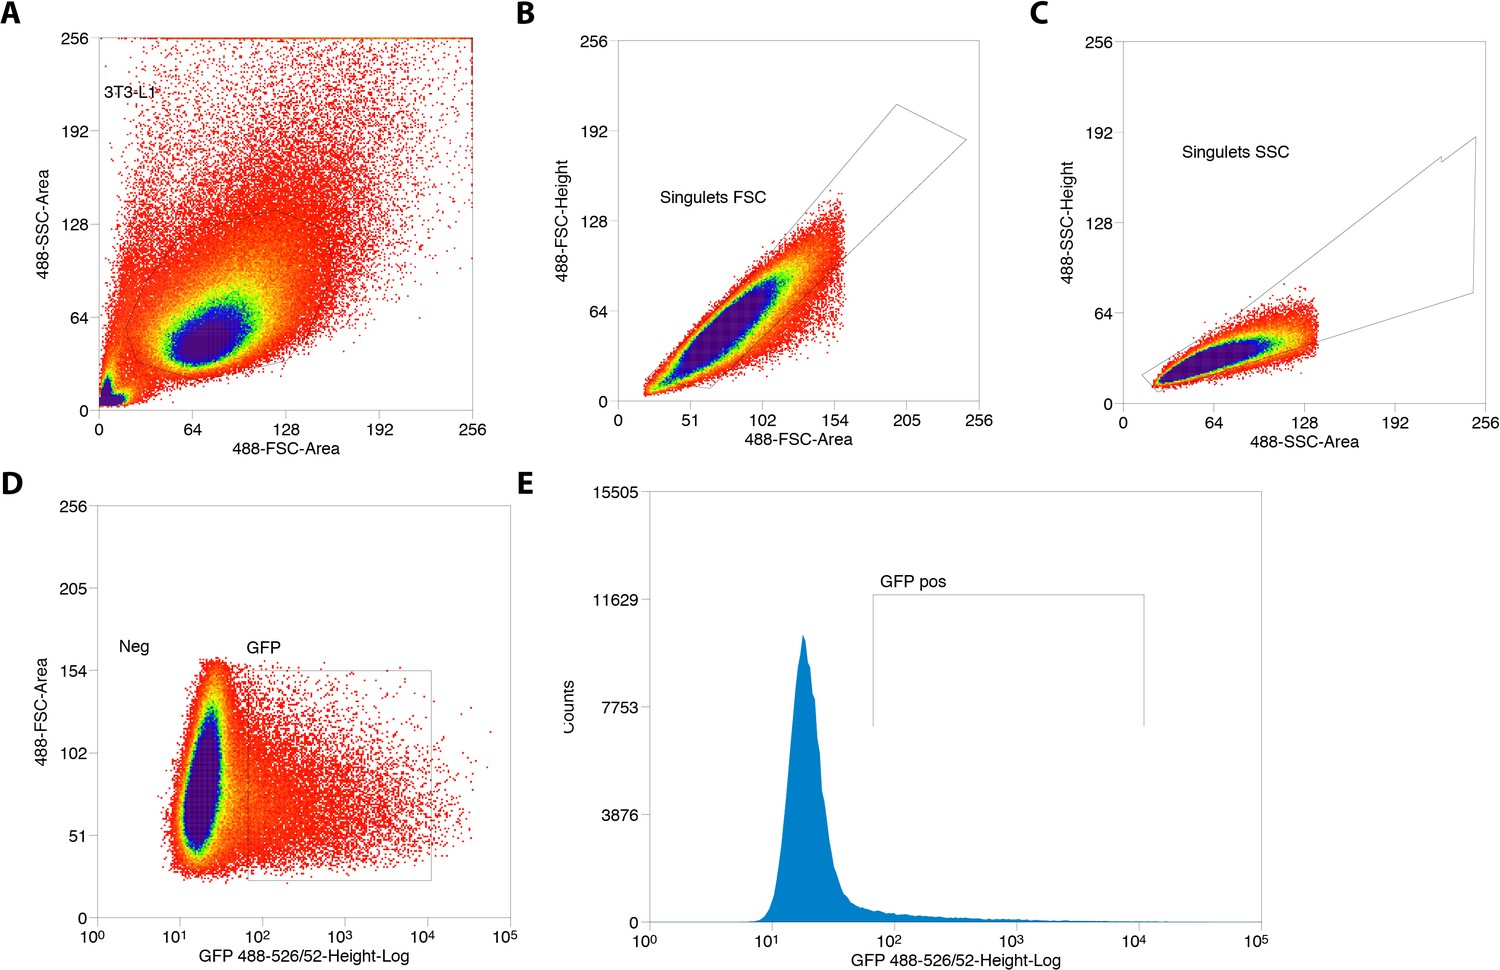
Sorting of GFP+ 3T3-L1 pre-adipocytes transfected with Cas9/scramble gRNA expression vector.
(A) Gate based of light scattering forward area and side area was first established on all particles detected graph. (B–C) Two sequential doublet exclusion gating were performed on 3T3-L1 gate. (D–E) Two representative graphs of GFP+ cells. The sorting was performed on GFP+ gate (3T3-L1/doublet exclusion) of the forward area and 488-526/52 height-Log and frequencies of GFP+ cells are depicted.
Figure 4—figure supplement 2
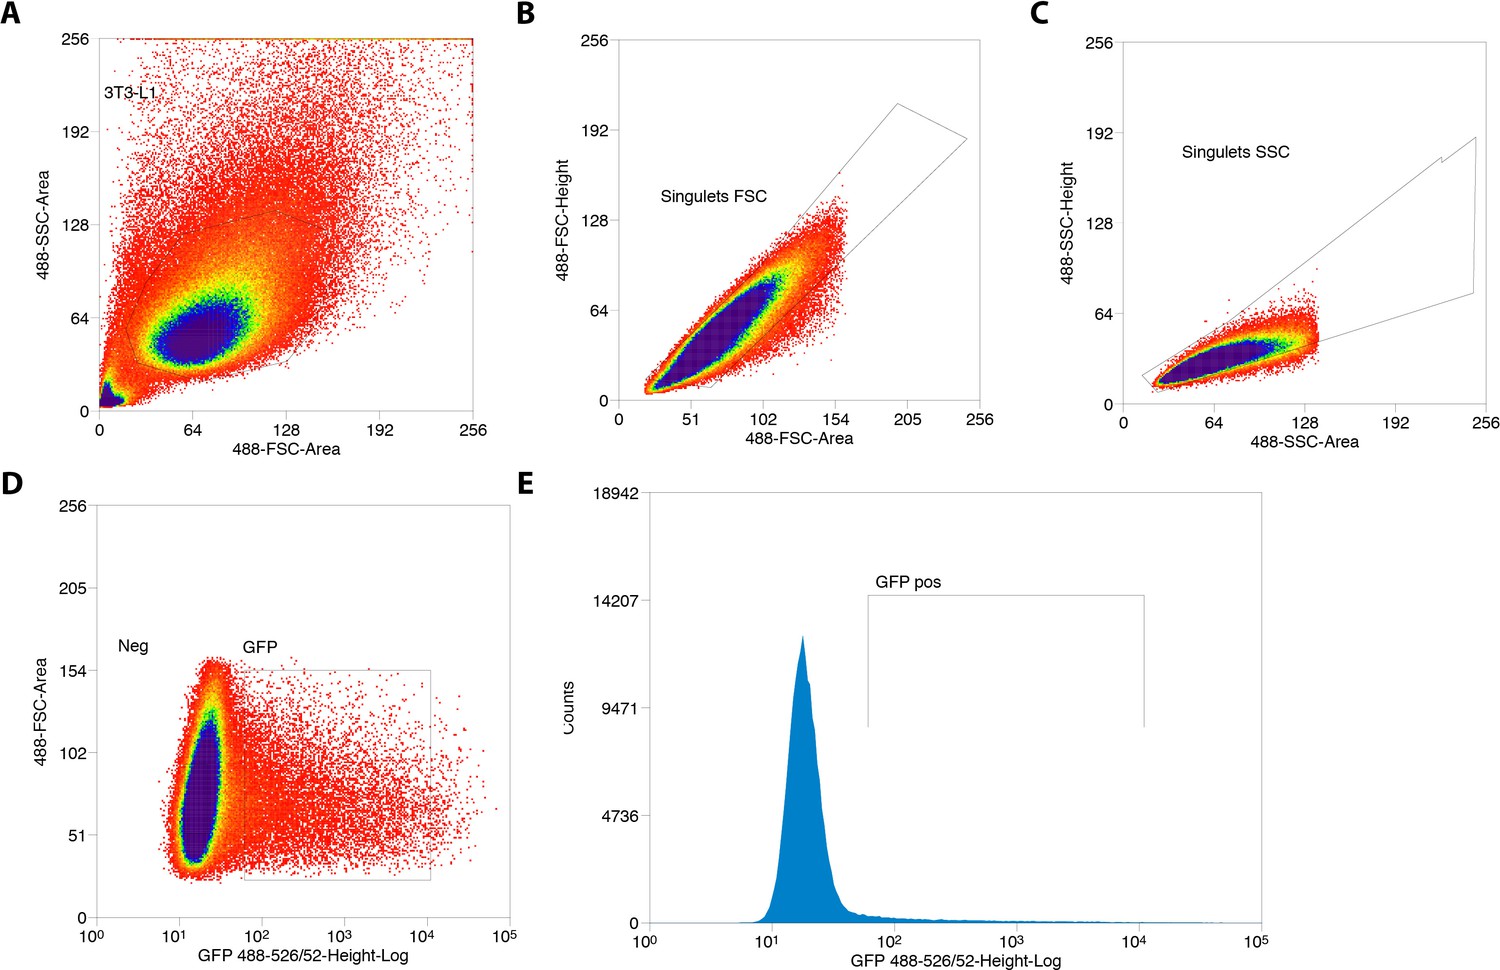
Sorting of GFP+ 3T3-L1 pre-adipocytes transfected with Cas9/Ephx1 gRNA expression vector.
(A) Gate based of light scattering forward area and side area was first established on all particles detected graph. (B–C) Two sequential doublet exclusion gating were performed on 3T3-L1 gate. (D–E) Two representative graphs of GFP+ cells. The sorting was performed on GFP+ gate (3T3-L1/doublet exclusion) of the forward area and 488-526/52 height-Log and frequencies of GFP+ cells are depicted.
Figure 4—figure supplement 3
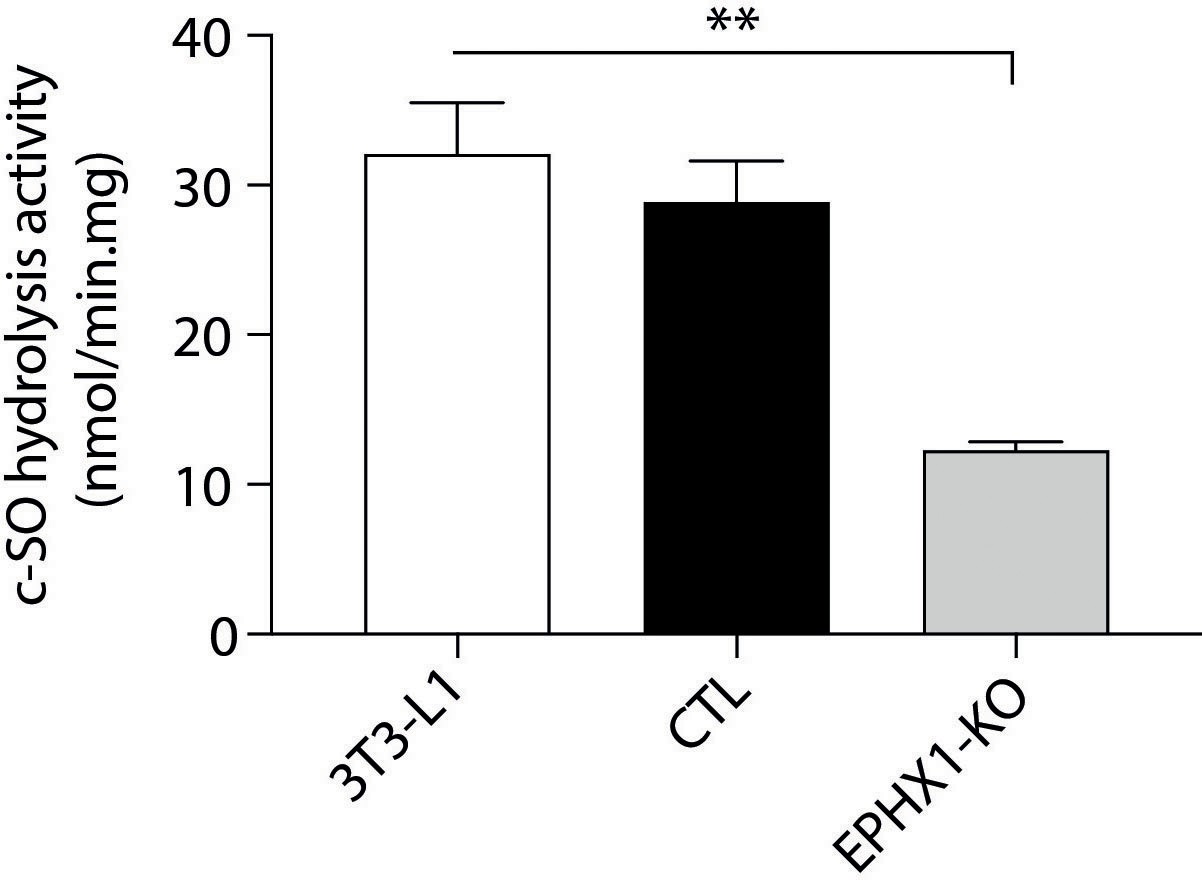
cis-stilbene oxide (c–SO) hydrolysis assay performed in 3T3-L1 cells.
3T3-L1: WT pre-adipocytes; CTL: 3T3-L1 transfected with Cas9/scramble gRNA; EPHX1-KO: 3T3-L1 transfected with a Cas9/gRNA targeting Ephx1 exon 6. Results are expressed as means ± SEM of three independent biological experiments.
Figure 4—figure supplement 4
Activation of insulin signaling in 3T3-L1 undifferentiated pre-adipocytes.
The 3T3-L1 cells from ATCC, CTL, and Ephx1-KO cells were subjected to immunoblotting with antibodies against total and phospho-insulin receptor β-subunit (IRβ), insulin receptor substrate-1 (IRS1), AKT, and extracellular-regulated kinase (ERK)1/2. Numbers on the left correspond to molecular weight markers (kDa). Western blot images are representative of three independent experiments.
Figure 4—figure supplement 5
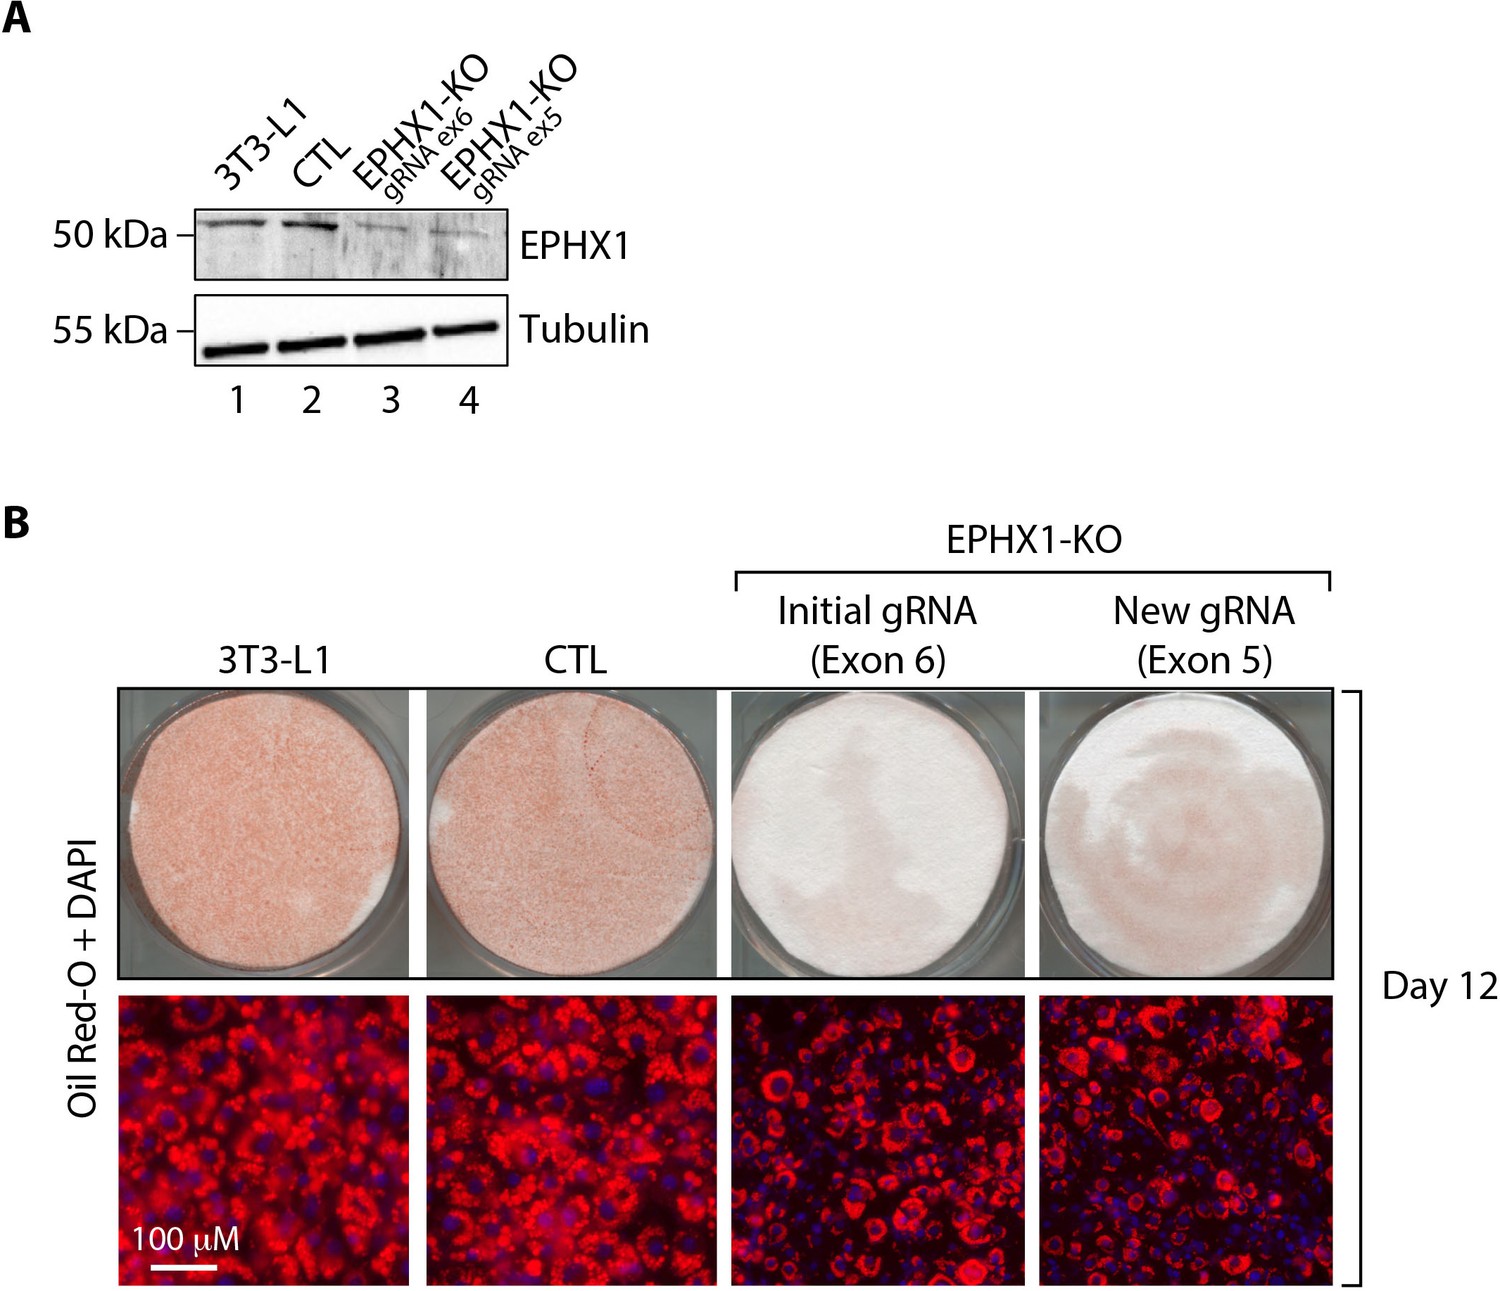
Validation of the effect of Ephx1 KO in 3T3-L1 pre-adipocytes with a Cas9/gRNA targeting exon 5.
(A) Validation of the CRISPR-Cas9 KO by western blot analysis. Numbers on the left correspond to molecular weight markers (kDa). Western blot images are representative of three independent experiments. (B) Effect of Ephx1 KO on adipocyte differentiation assessed by Oil Red O lipid staining. 3T3-L1 pre-adipocytes were studied during adipocyte differentiation for 12 days. First line: Pictures of dishes stained by Oil Red O. Images are representative of three independent experiments. Second line: representative images of fluorescence microscopy after staining of intracellular lipids (Oil Red O, red) and nuclei (DAPI, blue). Images are representative of three independent experiments.
Figure 5
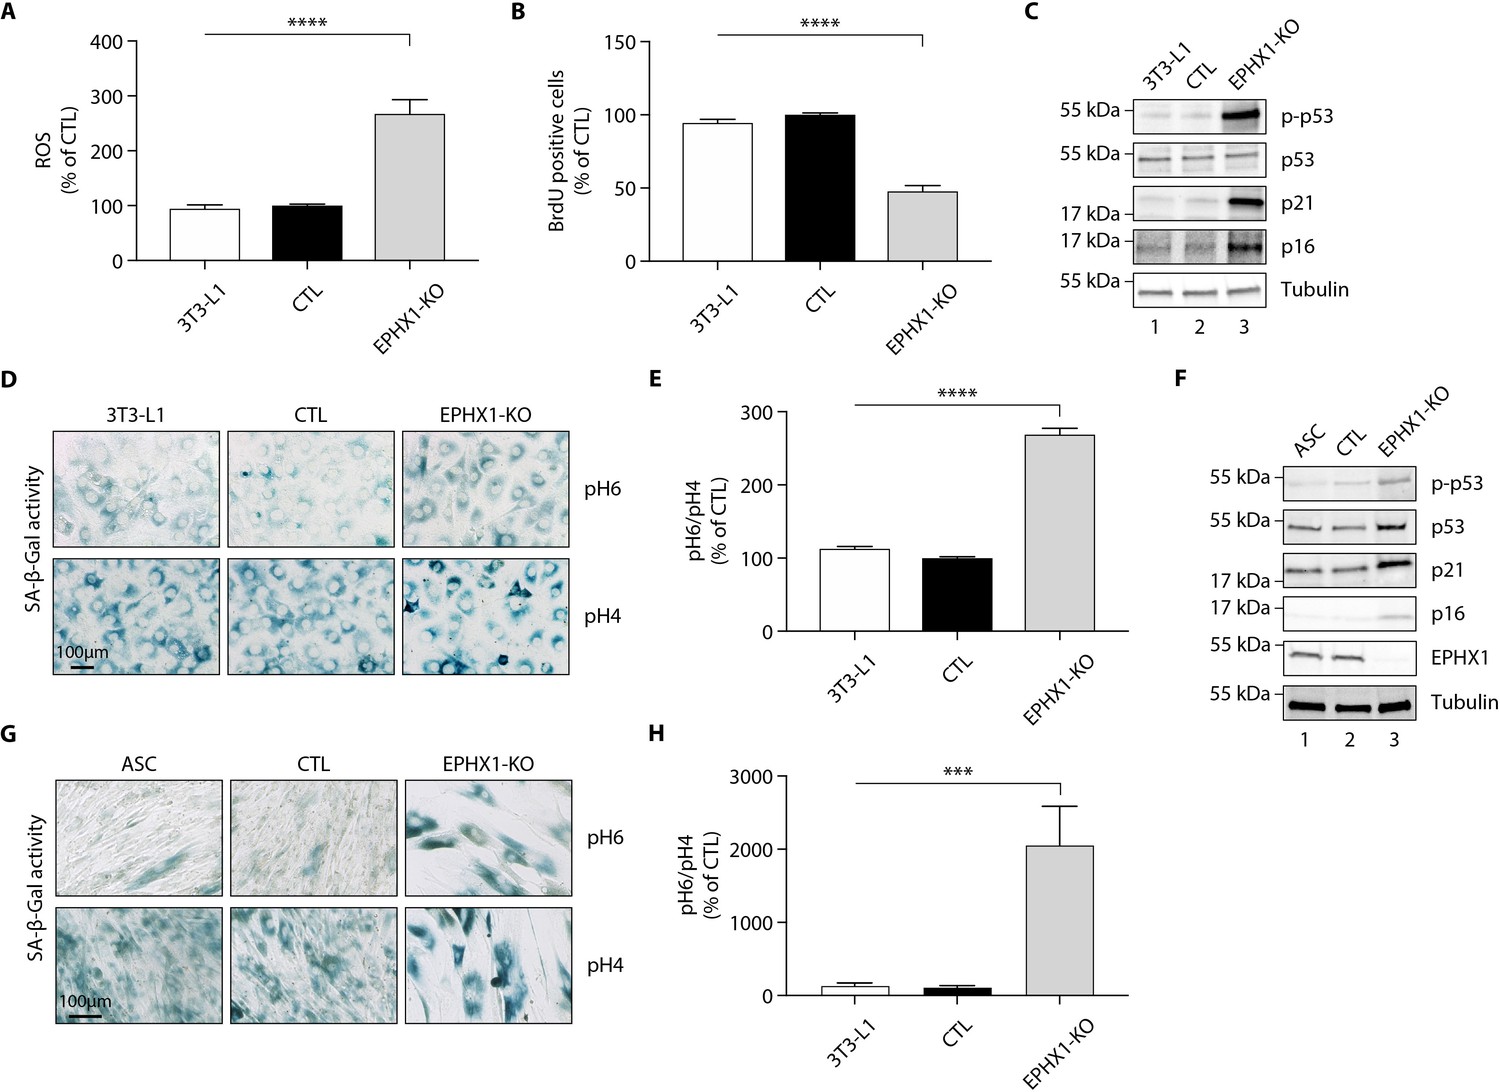
Ephx1 deficiency causes oxidative stress and cellular senescence in murine 3T3-L1 pre-adipocytes and human ASCs.
Data were obtained in 3T3-L1 pre-adipocytes from ATCC, as well as ASCs isolated from a sub-cutaneous abdominal adipose tissue biopsy from a control woman of the same sex and age as patient 1 and normal BMI. CRISPR-Cas9-mediated EPHX1-knockout (KO) was obtained in the two cell types. Cells transfected with a Cas9/scramble gRNA plasmid were used as control (CTL). Differences between the three cell lines were determined by analysis of variance (ANOVA) with Bonferroni’s post hoc multiple comparison test. All results are expressed as means ± SEM of three independent experiments. (A–E) refer to 3T3-L1 cells. (F–H) refer to ASC cells. (A) Reactive oxygen species (ROS) production assessed by oxidation of 5–6-chloromethyl-2,7-dichlorodihydro-fluorescein diacetate (CM-H2DCFDA) in 3T3-L1 pre-adipocytes. Results were normalized to DNA content measured by DAPI. ****p<0.0001. (B) Evaluation of cellular proliferation by BrDU incorporation. ****p<0.0001. (C) Evaluation of cellular senescence by western blotting using antibodies against the indicated proteins. Numbers on the left correspond to molecular weight markers (kDa). (D) Representative immunofluorescence images of senescence (SA-β-gal) after staining at pH4 and pH6. Scale bar is 100 μm. (E) The SA-β-gal staining ratio at pH 6.0/pH 4.0 was calculated. ****p<0.0001. (F) Validation of EPHX1 KO in the ASC model and evaluation of expression of several cellular senescence markers by western blotting. Numbers on the left correspond to molecular weight markers (kDa). (G) Representative immunofluorescence images of senescence (SA-β-gal) after staining at pH4 and pH6. Scale bar is 100 μm. (H) The SA-β-gal staining ratio at pH 6.0/pH 4.0 was calculated. ***p<0.001; ****p<0.0001.
Figure 6 with 2 supplements
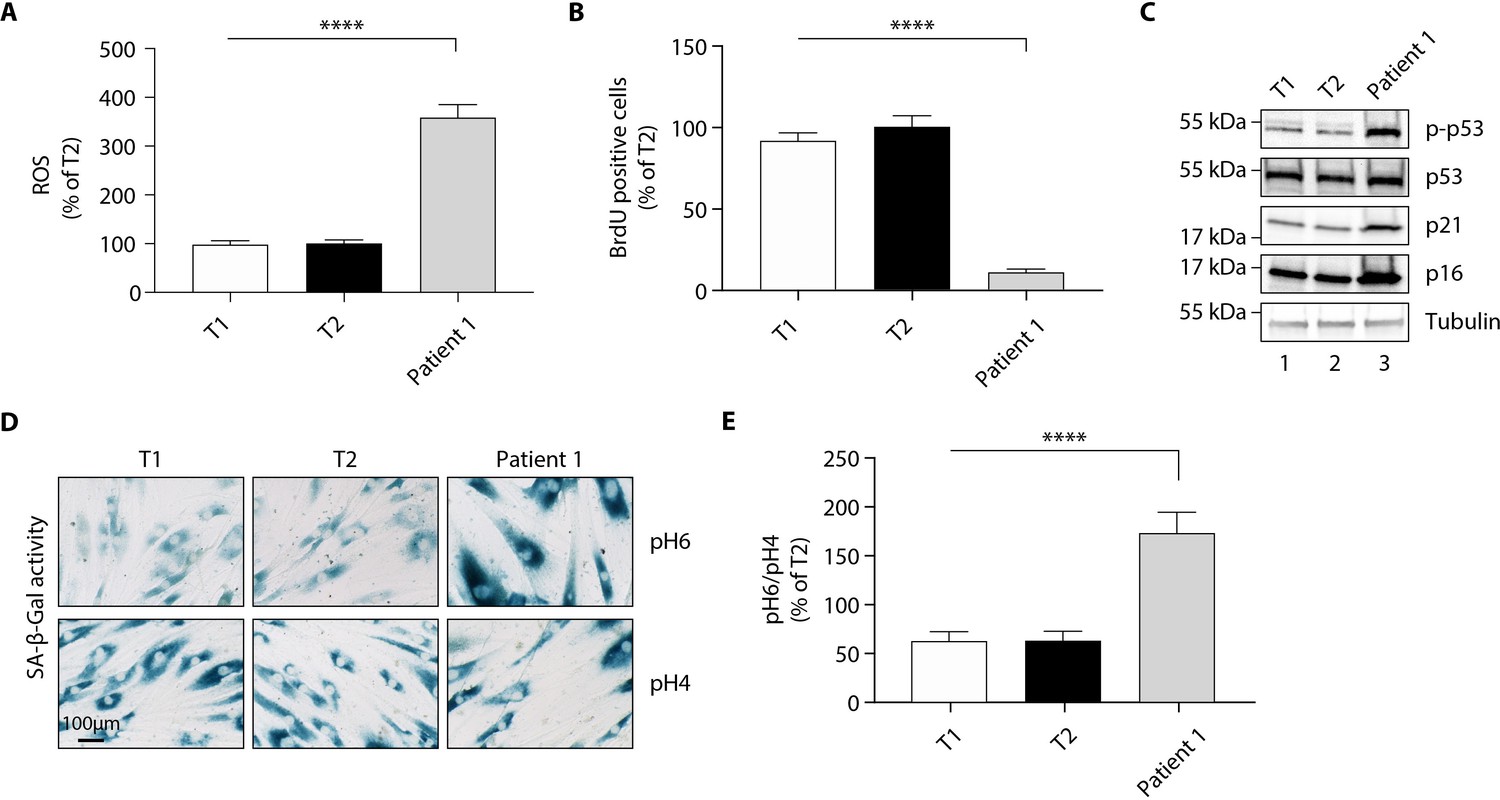
The p. Thr333Pro variant causes oxidative stress and cellular senescence in patient 1-derived fibroblasts.
Data were obtained using cultured fibroblasts from skin biopsies of two normal individuals (T1 and T2) and patient 1. Differences between the three fibroblast cultures were determined by analysis of variance (ANOVA) with Bonferroni’s post hoc multiple comparison test. All results are expressed as means ± SEM of three independent experiments. (A) Reactive oxygen species (ROS) production assessed by oxidation of 5–6-chloromethyl-2,7-dichlorodihydro-fluorescein diacetate (CM-H2DCFDA) in fibroblasts derived from T1, T2, and patient 1. Results were normalized to DNA content measured by DAPI. ****p<0.0001. (B) Evaluation of cellular proliferation by BrDU incorporation. ****p<0.0001. (C) Evaluation of cellular senescence by western blotting using antibodies against the indicated proteins. Numbers on the left indicate molecular weight markers (kDa). (D) Representative immunofluorescence images of senescence (SA-β-gal) after staining at pH4 and pH6. Scale bar is 100 μm. (E) The SA-β-gal staining ratio at pH 6.0/pH 4.0 was calculated. ****p<0.0001.
Figure 6—figure supplement 1
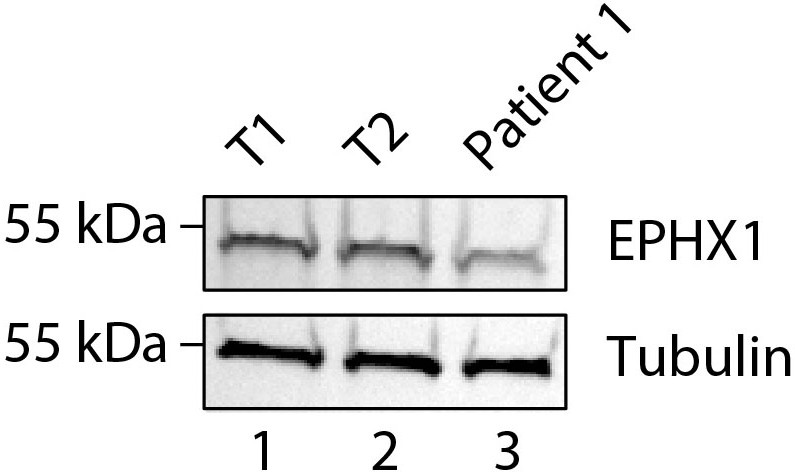
Expression of EPHX1 in primary fibroblasts from patient 1.
EPHX1 expression was evaluated by western blotting in cultured fibroblasts from patient 1 and 2 controls (T1 and T2). Tubulin was used as a loading control.
Figure 6—figure supplement 2
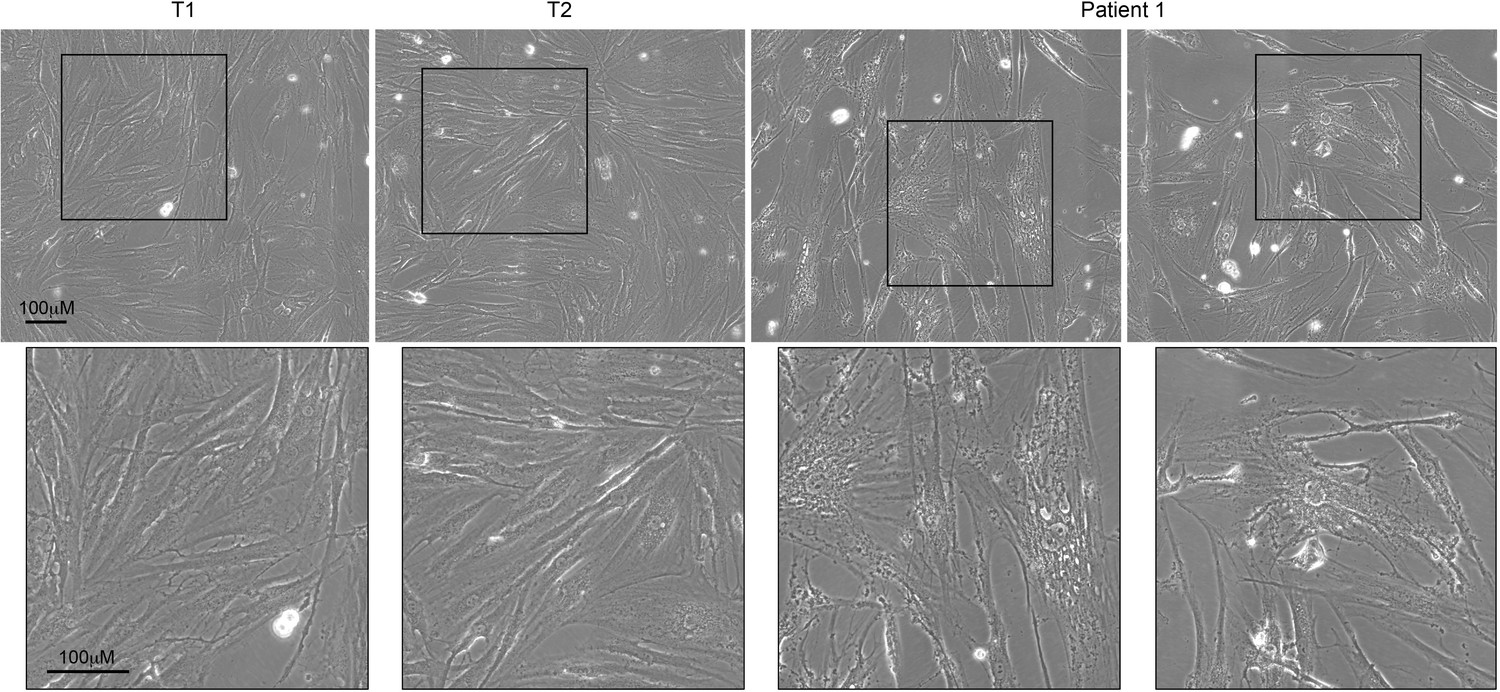
Comparative morphology analysis of primary fibroblasts from patient 1 and controls.
Fibroblasts from patient 1 and 2 controls (T1 and T2) were cultured and observed at a low passage number. Patient 1-derived fibroblasts exhibited abnormal morphology compared with controls, as shown by their enlarged size and irregular shape. The bottom panel displays magnifications of the framed areas of the top panel.
Author response image 1
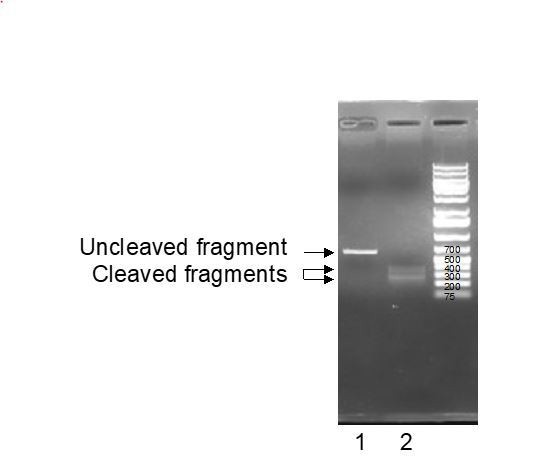
Line 1: untreated EPHX1 PCR fragments; Line 2: EPHX 1 PCR fragments trated with gRNA and recombinant Cas9 enzyme.
Author response image 2
Tables
Table 1
Clinical and biological features in patients with EPHX1 de novo variants.
Unless otherwise specified, information corresponds to that collected during the last consultation. ALP: alkaline phosphatase; ALT: alanine aminotransferase; AST: aspartate aminotransferase; DXA: dual X-ray absorptiometry; EEG: electroencephalogram; GGT: gamma glutamyl transpeptidase; MRI: magnetic resonance imaging; Na: not available; N: normal value.
| Patient 1 | Patient 2 | |
|---|---|---|
| General characteristics | ||
| Origin | Sub-Saharan Africa | Western Europe |
| Age (years) | 25 | 17 |
| Sex | Female | Female |
| Height (m) | 1.62 | 1.63 |
| Weight (kg) | 53 | 45.2 |
| Body mass index (kg/m2) | 20.2 | 17.0 |
| Birth | ||
| At term | Yes | Yes |
| Intrauterine growth retardation | No | No |
| Dysmorphic features | ||
| Microcephaly | −1.5 SD at birth −2.5 at 18 years | No |
| Triangular-shaped face | Yes | Yes |
| Irregular and high hair line | Yes | Yes |
| Frontal bossing | Yes | Yes |
| Mid face hypoplasia | No | Yes |
| Retrognathism | Yes | No |
| Mandibulo-facial dysostosis | Yes | Yes |
| Teeth misalignments | Yes | Na |
| Arachnodactyly | Yes | Na |
| Metabolic manifestations | ||
| Lipoatrophy | Face, upper, and lower limbs | Face |
| Total fat mass evaluated by DXA (%) | 15.8% Z-score: −2.8 | 12.4% Z-score: −3.8 |
| Serum leptin levels (N < 28 for BMI < 25 kg/m2) | 4 ng/mL | 3 ng/mL |
| Serum adiponectin levels (N: 3.6–9.6 mg/L) | 0.5 mg/L | 0.3 mg/L |
| Insulin resistance | Yes, Acanthosis nigricans (back, armpits, neck) Insulin requirement: up to 15 IU/kg/day before metreleptin therapy | Yes, fasting insulin: 284 pmol/L (N < 70 pmol/L) |
| Diabetes (Glycemia - N < 7 mmol/L) | Since the age of 12 Fasting glycemia: 44 mmol/L at diagnosis | No |
| Liver manifestations | Hepatomegaly, steatosis, fibrosis, liver inflammation, elevated levels of AST, ALT, ALP, and GGT | Fat infiltrate, elevated levels of AST, ALT, and GGT |
| Hypertriglyceridemia (mmol/L) (TG – N < 1.7 mmol/L) | Yes, TG: 2.66 mmol/L | Yes, TG: 21.9 mmol/L |
| Gynecological features | Clitoromegaly during childhood, oligomenorrhea | No |
| Hyperandrogenism (Testosterone – N: 0.3–1.5 nmol/L) | Generalized hirsutism, steroidogenesis alterations including high testosterone levels (16.9 mmol/L) | Na |
| Spine bone densitometry | T-score: −2.5 SD Z-score: −2.5 SD | Na |
| Neurological signs | ||
| Bilateral sensorineural hearing loss | Since the age of 6 years and requiring hearing aids | Since birth and requiring cochlear implants |
| Developmental delay | Delay in language onset, moderate intellectual disability | No |
| Brain MRI/EEG | Normal | Normal |
| Axonal neuropathy | Since the age of 17 years Decrease in osteo-tendinous reflexes (achilles, lower limbs) EMG abnormalities | No |
| Pes cavus | Yes | Na |
| Cardiac and musculoskeletal signs | ||
| Cardiovascular symptoms | No | No |
| Muscular hypertrophy | Yes | No |
| Joint stiffness | Yes (hands, feet) | No |
| Other symptoms | ||
| Ocular signs | Bilateral cataract, Peri-corneal colored ring, Diabetic retinopathy | No |
| T-cell lymphocytosis (Lymphocytes – N: 1–4.8 G/L) | Yes, 11.4 G/L CD3+, CD8+, cD57+ | Na |
| Hyperkeratosis | Yes (hands, feet) | No |
Table 2
Evolution of metabolic markers in patient 1 over a period of 6 months of metreleptin treatment.
For data before treatment, values are given as the ranges observed over the last past 3 years. AST: aspartate aminotransferase, ALT: alanine aminotransferase, ALP: alkaline phosphatase, GGT: gamma glutamyl transpeptidase.
| Before metreleptin | After 3 month metreleptin therapy (5 mg/day) | After 6 month metreleptin therapy (7.5 mg/day) | |
|---|---|---|---|
| Anthropometric markers | |||
| Weight | 53 | 51 | 50 |
| BMI | 20.2 | 19.4 | 18.9 |
| Glucose homeostasis | |||
| HbA1c (%) (N: 4–6%) | 11.6–16.5 | 7.9 | 7.3 |
| Liver assessment | |||
| AST (IU/L) N: 17–27 IU/L | 83–120 | 57 | 54 |
| ALT (IU/L) N: 11–26 IU/L | 81–148 | 50 | 59 |
| ALP (IU/L) N: 35–105 IU/L | 100–110 | 92 | 102 |
| GGT (IU/L) N: 8–36 IU/L | 170–320 | 58 | 67 |
| Steatosis (SteatoTest) | Low-grade (S1) | Not detectable (S0) | Low grade (S1) |
| Fibrosis (FibroTest) | Intermediate grade (F1–F2) | Not detectable (F0) | Not detectable (F0) |
| Necrotic and inflammatory activity (ActiTest) | Intermediate grade (A1–A2) | very low grade (A0–A1) | Low grade (A1) |
| Lipid profile | |||
| Triglycerides (mmol/L) (N: 0.4–1.7 mmol/L) | 1.3–2.7 | 2.0 | 1.6 |
| Insulin requirement | |||
| Human insulin (daily doses – IU/kg) | 2.9 | 2 | 1.65 |
Key resources table
| Reagent type (species) or resource | Designation | Source or reference | Identifiers | Additional information |
|---|---|---|---|---|
| Cell line (Homo sapiens) | HEK 293 | ATCC | CRL-1573 | Embryonic kidney |
| Cell line (Mus musculus) | 3T3-L1 | ATCC | CL-173 | The cells undergo a pre-adipose to adipose like conversion as they progress from a rapidly dividing to a confluent state |
| Primary fibroblasts | T1 | Pr. Fève lab at CRSA, Paris | N/A | Non-obese and non-diabetic female, skin biopsy |
| Primary fibroblasts | T2 | Pr. Fève lab at CRSA, Paris | N/A | Non-obese and non-diabetic female, skin biopsy |
| Primary fibroblasts | Patient 1 | Pr. Fève lab at CRSA, Paris | N/A | Patient 1, female, skin biopsy |
| Adipose stem cells | ASCs | Pr. Fève lab at CRSA, Paris | N/A | Female, from subcutaneous abdominal adipose tissue |
| Antibody | Anti-adiponectin | Thermo Fisher Scientific | Cat# MA1-054 | WB (1:1000) |
| Antibody | Anti-AKT | Santa Cruz Biotechnology | Cat# sc-8312 | WB (1:1000) |
| Antibody | Anti β-actin | Sigma Aldrich | Cat# A2228 | WB (1:10,000) |
| Antibody | Anti-Calnexin | ENZO Life Science | Cat# ADO-SPA-860 | IF (1:200) |
| Antibody | Anti-C/EPBα | Protein Tech | Cat# 18311-1-1P | WB (1:1000) |
| Antibody | Anti-EPHX1 | Novus | Cat# NBP1-3301 | WB (1:1000) - IF (1:1000) |
| Antibody | Anti-ERK | Cell Signaling Technology | Cat# 9102 | WB (1:1000) |
| Antibody | Anti-FAS | Cell Signaling Technology | Cat# 3180 | WB (1:1000) |
| Antibody | Anti-Flag | Origene | Cat# TA50011-100 | WB (1:1000) - IF (1:1000) - IP (1:200) |
| Antibody | Anti-IRΒ | Cell Signaling Technology | Cat# 3025 | WB (1:1000) |
| Antibody | Anti-IRS1 | Protein Tech | Cat# 17509–1-AP | WB (1:1000) |
| Antibody | Anti-P16 | Protein Tech | Cat# 10883–1-AP | WB (1:1000) |
| Antibody | Anti-P21 | Protein Tech | Cat# 10355–1-AP | WB (1:1000) |
| Antibody | Anti-P53 | Abcam | Cat# ab1101 | WB (1:1000) |
| Antibody | Anti-P-AKT | Santa Cruz Biotechnology | Cat# sc-7985-R | WB (1:1000) |
| Antibody | Anti-P-ERK | Cell Signaling Technology | Cat# 9101 | WB (1:1000) |
| Antibody | Anti-P-P53 | Abcam | Cat# ab38497 | WB (1:1000) |
| Antibody | Anti-PPARg | Protein Tech | Cat# 16643–1-AP | WB (1:1000) |
| Antibody | Anti-SREBP-1 | Santa Cruz Biotechnology | Cat# sc-366 | WB (1:1000) |
| Antibody | Anti-Tubulin | Protein Tech | Cat# 66031–1-lg | WB (1:10,000) |
| Antibody | Anti-P-Tyr | Santa Cruz Biotechnology | Cat# sc-7020 | WB (1:1000) |
| Antibody | Anti-rabbit-HRP | GE Healthcare | Cat# NA934V | WB (1:2000) |
| Antibody | Anti-mouse-HRP | GE Healthcare | Cat# NA931V | WB (1:2000) |
| Recombinant DNA reagent (plasmid) | pCMV-entry-Flag | Origene | Cat # PS100001 | |
| Recombinant DNA reagent (plasmid) | pCMV-EPHX1 WT-Flag or without Flag | This paper | N/A | Described in Materials and methods Publicly available (Addgene) |
| Recombinant DNA reagent (plasmid) | pCMV-EPHX1 c.337T>C -Flag or without Flag | This paper | N/A | Described in Materials and methods Publicly available (Addgene) |
| Recombinant DNA reagent (plasmid) | pCMV-EPHX1 c.416A>G -Flag or without Flag | This paper | N/A | Described in Materials and methods Publicly available (Addgene) |
| Recombinant DNA reagent (plasmid) | pCMV-EPHX1 c.997A>C -Flag or without Flag | This paper | N/A | Described in Materials and methods Publicly available (Addgene) |
| Recombinant DNA reagent (plasmid) | pCMV-EPHX1 c.1212G>C -Flag or without Flag | This paper | N/A | Described in Materials and methods Publicly available (Addgene) |
| Recombinant DNA reagent (plasmid) | pCMV-EPHX1 c.1288G>C -Flag or without Flag | This paper | N/A | Described in Materials and methods Publicly available (Addgene) |
| Recombinant DNA reagent (plasmid) | pSpCas9(BB)−2A-GFP (PX458) | Addgene | Cat# 48138 | A gift from Zhang lab |
| Recombinant DNA reagent (plasmid) | pLentiCRISPR v2 | Addgene | Cat# 52961 | A gift from Zhang lab |
| Software algorithm | FIJI software | NIH | N/A | |
| Software algorithm | GraphPad | Graphpad Software | N/A | |
| Software algorithm | Prism | Graphpad Software | N/A |
Author response table 1
| Number of mismatches | Potential off-target sequences (mismatches are in red and bold characters) | Locus of the off-target (gene / location) |
|---|---|---|
| 2 | TCTTAGTGAAGTGCTCCACCTAG | Zfhx3 / intron |
| 3 | TTTTAGAGAAGTTGACCACCTGG | Gdpgp1 / exon |
| 3 | TAATAGAGAAGTTCTCGACCTGA | Trpc7 / intron |
| 3 | TACTAGAGAAGTTCTCCAGCTGA | intergenic |
| 3 | TCTCAGCCAAGTTCTCCACCAAG | intergenic |
| 3 | TCTCAGACATGTTCTCCACCAAG | intergenic |
| 3 | TCTTGGAGAAGTTCTTCAACAGG | intergenic |
| 3 | TCTTAGATAATTTCTCAACCAGG | intergenic |
| 3 | TCTTAGAGAAGTTTACCACTAGG | intergenic |
| 3 | TCCTAGAGAATTCCTCCACCTGG | intergenic |
| 3 | CCTTGGAGATGTTCTCCACCCAG | Fign / intron |
| 3 | TCTAGGAGAAGTTCTCCACAAGG | intergenic |
| 3 | TCTTGGAGAAGTCCTTCACCTGG | intergenic |
| 3 | TGTTACAGAAGTTCTCAACCTGG | intergenic |
| 3 | TTTCAGAGAAGTTCTCTACCAGG | intergenic |
| 3 | GCTGAGAGAAGTTCTCCACAAGG | Clnk / intron |
Additional files
-
Source data 1
Uncropped and marked western blots seen in the different figures.
- https://cdn.elifesciences.org/articles/68445/elife-68445-data1-v1.zip
-
Source data 2
Uncropped and unedited western blots seen in the different figures.
- https://cdn.elifesciences.org/articles/68445/elife-68445-data2-v1.zip
-
Supplementary file 1
Characteristics of additional rare variants identified in patient 1 according to their mode of inheritance.
Variants with an allele frequency > 0.001 were not considered since their frequency is not compatible with the prevalence of this very rare disorder. The gnomAD database (https://gnomad.broadinstitute.org/) was used to determine the variant frequency in the general population. Expression profile were extracted from the GTex portal (https://www.gtexportal.org). Splice variants located outside of the canonical sites were not considered. The CADD (Combined Annotation Dependent Depletion) score was used for first scoring of variant deleteriousness (https://cadd-staging.kircherlab.bihealth.org/). A score > 20 argues for a pathogenic effect. Other bioinformatic tools of pathogenicity prediction were considered including SIFT, Polyphen2, MutationTaster, and REVEL. On each line, the arguments against the involvement of a given variant in the observed phenotype are indicated by an asterisk. Each variant can be excluded by at least two independent items. hmz: homozygous; htz: heterozygous; na: not applicable.
- https://cdn.elifesciences.org/articles/68445/elife-68445-supp1-v1.xlsx
-
Supplementary file 2
Characteristics of additional rare variants identified in patient 2 according to their mode of inheritance.
Variants with an allele frequency > 0.001 were not considered since their frequency is not compatible with the prevalence of this very rare disorder. The gnomAD database (https://gnomad.broadinstitute.org/) was used to determine the variant frequency in the general population. Expression profile were extracted from the GTex portal (https://www.gtexportal.org). Splice variants located outside of the canonical sites were not considered. The CADD (Combined Annotation Dependent Depletion) score was used for first scoring of variant deleteriousness (https://cadd-staging.kircherlab.bihealth.org/). A score > 20 argues for a pathogenic effect. Other bioinformatic tools of pathogenicity prediction were considered including SIFT, Polyphen2, MutationTaster, and REVEL. On each line, the arguments against the involvement of a given variant in the observed phenotype are indicated by an asterisk. Each variant can be excluded by at least two independent items. hmz: homozygous; htz: heterozygous; na: not applicable.
- https://cdn.elifesciences.org/articles/68445/elife-68445-supp2-v1.xlsx
-
Transparent reporting form
- https://cdn.elifesciences.org/articles/68445/elife-68445-transrepform-v1.docx
Download links
A two-part list of links to download the article, or parts of the article, in various formats.
Downloads (link to download the article as PDF)
Open citations (links to open the citations from this article in various online reference manager services)
Cite this article (links to download the citations from this article in formats compatible with various reference manager tools)
EPHX1 mutations cause a lipoatrophic diabetes syndrome due to impaired epoxide hydrolysis and increased cellular senescence
eLife 10:e68445.
https://doi.org/10.7554/eLife.68445


