Acid-base transporters and pH dynamics in human breast carcinomas predict proliferative activity, metastasis, and survival
- Department of Biomedicine, Aarhus University, Denmark
- Department of Pathology, Regionshospitalet Randers, Denmark
- Department of Surgery, Regionshospitalet Randers, Denmark
- Department of Clinical Genetics, University of Southern Denmark, Denmark
- Clinical Genome Center, University and Region of Southern Denmark, Denmark
- Department of Plastic and Breast Surgery, Department of Clinical Medicine, Aarhus University Hospital, Denmark
Figures
Figure 1 with 1 supplement
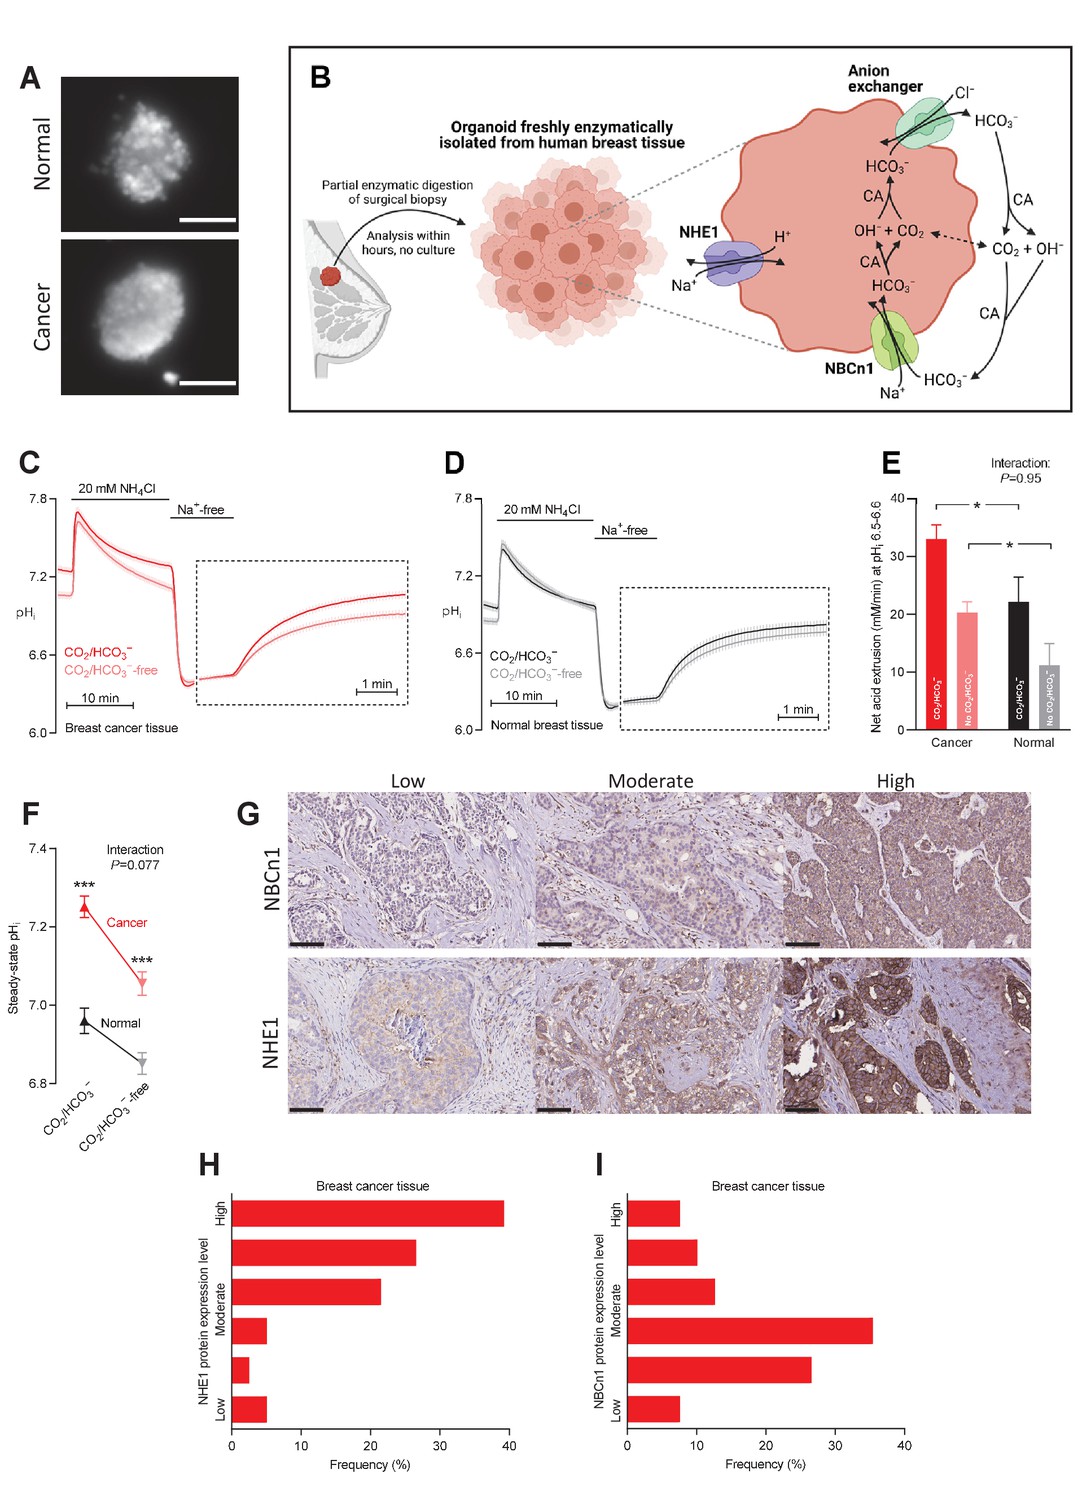
Cellular net acid extrusion in human breast cancer tissue and normal breast tissue relies on extracellular Na+ and is partially CO2/HCO3–-dependent consistent with the expression of Na+,HCO3– cotransporter NBCn1 and Na+/H+ exchanger NHE1.
Moreover, steady-state intracellular pH (pHi) and the capacity for net acid extrusion are elevated in human breast cancer tissue compared to normal breast tissue. (A) Exemplar fluorescence images of 2',7'-bis-(2-carboxyethyl)-5-(and-6)-carboxyfluorescein (BCECF)-loaded organoids freshly isolated from human breast cancer tissue (lower panel) and normal breast tissue (upper panel). The scale bars represent 100 µm. (B) Illustration of the experimental procedure for acute enzymatic isolation of organoids from human breast biopsies and a schematic showing the acid-base transporters involved in pHi control in breast cancer cells. The image was generated with Biorender.com. CA, carbonic anhydrase. (C,D) Traces of NH4+-prepulse-induced pHi dynamics in human breast cancer tissue (C, n=75–76) and normal breast tissue (D, n=48–49). The time scale within the dotted rectangles is expanded in order to improve resolution during the pHi recovery phase. (E) Cellular net acid extrusion activities in presence and nominal absence of CO2/HCO3– were calculated in the pHi range 6.5–6.6 for human breast cancer tissue and normal breast tissue (n=48–76). Figure 1—figure supplement 1 provides a detailed analysis of the net acid extrusion capacity as function of pHi. (F) Initial steady-state pHi in human breast cancer tissue (n=79–80) and normal breast tissue (n=49–50) in presence and nominal absence of CO2/HCO3–. (G–I) Representative immunohistochemical images (G) and summarized pathologist-scored protein expression data for NHE1 (H, n=79) and NBCn1 (I, n=79) in human breast carcinomas. The size bars represent 100 µm. Data in panels E and F were compared by mixed-effects analyses followed by Sidak’s multiple comparisons test. ‘Interaction’ reports whether the effect of CO2/HCO3– varies between breast cancer and normal breast tissue. *p<0.05, ***p<0.001 vs. normal breast tissue under similar conditions. Figure 1—source data 1 contains the data pertaining to this figure and the de-identified clinicopathological information used to stratify data in Figure 2, 3, 4, 5, 7 and 8 and Figure 2—figure supplement 1; this information is combined in the multiple linear and logistic regression analyses illustrated in Figure 6.
-
Figure 1—source data 1
Data file containing NBCn1 and NHE1 protein expression levels, steady-state intracellular pH (pHi) values, and net acid extrusion capacities linked to de-identified clinical and pathological patient characteristics.
Note that this source data file pertains to Figure 1 but it also contains the clinicopathological information used for stratification in Figures 2–5, 7, and 8, and Figure 2—figure supplement 1; for the multiple linear and logistic regression analyses in Figure 6; and for the plots in Figure 6—figure supplement 1.
- https://cdn.elifesciences.org/articles/68447/elife-68447-fig1-data1-v2.xlsx
Figure 1—figure supplement 1
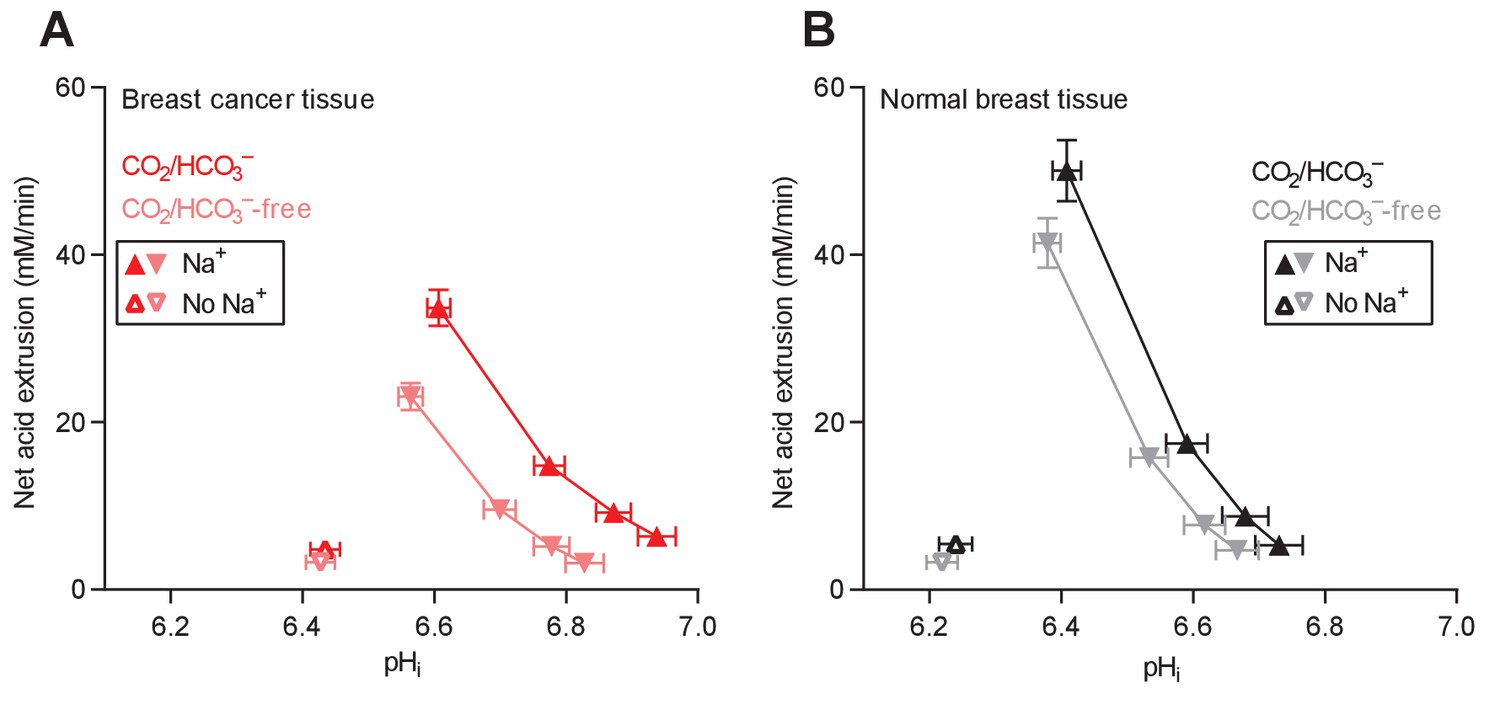
Cellular net acid extrusion activities in presence and nominal absence of CO2/HCO3– plotted as functions of intracellular pH (pHi) for human breast cancer tissue and normal breast tissue.
-
Figure 1—figure supplement 1—source data 1
Data file containing net acid extrusion capacities calculated at specified intracellular pH (pHi) levels and linked to de-identified clinical and pathological patient characteristics.
Note that this source data file pertains to Figure 1—figure supplement 1 but it also contains the clinicopathological information used for stratification in Figure 2—figure supplements 1 and 2, Figure 3—figure supplement 1, Figure 4—figure supplement 1, Figure 5—figure supplement 1, Figure 7—figure supplement 1, and Figure 8—figure supplement 1.
- https://cdn.elifesciences.org/articles/68447/elife-68447-fig1-figsupp1-data1-v2.xlsx
Figure 2 with 2 supplements
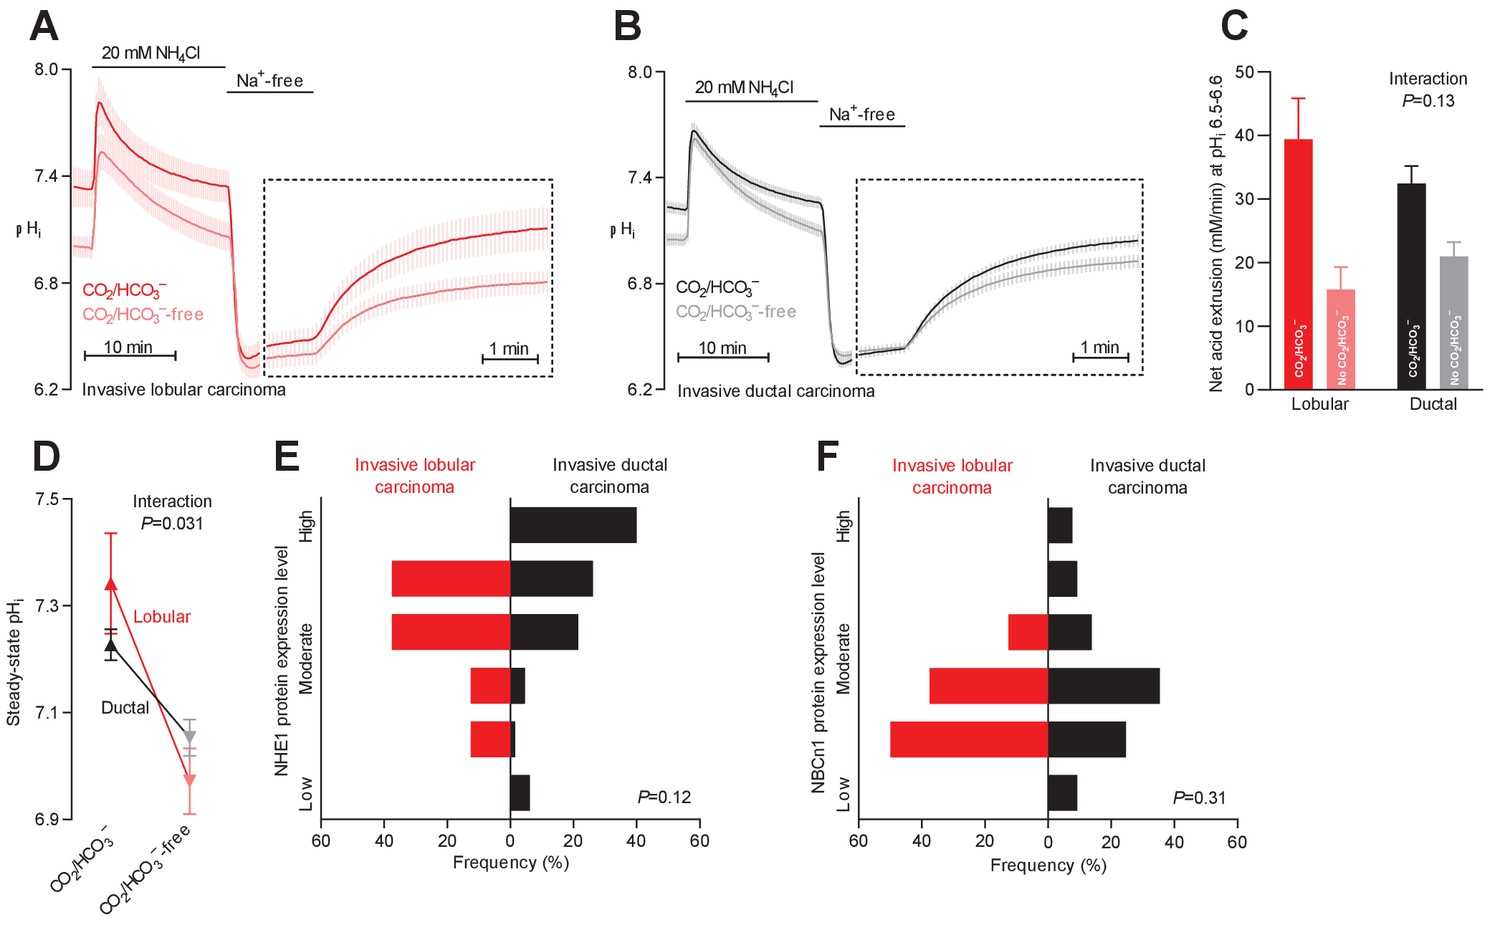
Na+,HCO3– cotransport is critical for cellular net acid extrusion and steady-state intracellular pH (pHi) in human invasive ductal and, particularly, lobular breast carcinomas.
(A,B) Traces of NH4+-prepulse-induced pHi dynamics in human invasive lobular (A, n=8–9) and ductal (B, n=60–62) breast carcinomas. The time scale within the dotted rectangles is expanded in order to improve resolution during the pHi recovery phase. (C) Cellular net acid extrusion activities in presence and nominal absence of CO2/HCO3– were calculated in the pHi range 6.5–6.6 for human invasive lobular and ductal breast carcinomas (n=8–62). Figure 2—figure supplement 2 provides a detailed analysis of the net acid extrusion capacity as function of pHi. (D) Initial steady-state pHi in human invasive lobular (n=9) and ductal (n=64–65) breast carcinomas in presence and nominal absence of CO2/HCO3–. Data in panels C and D were compared by mixed-effects analyses. ‘Interaction’ reports whether the effect of CO2/HCO3– varies between human invasive lobular and ductal breast carcinomas. (E,F) Summarized pathologist-scored, immunohistochemistry-based protein expression data for NHE1 (E) and NBCn1 (F) in human invasive lobular (n=8) and ductal (n=65) breast carcinomas. Protein expression in human invasive lobular and ductal breast carcinomas was compared by χ2 tests for trend. Figure 2—figure supplement 1 provides data from mucinous adenocarcinomas.
Figure 2—figure supplement 1
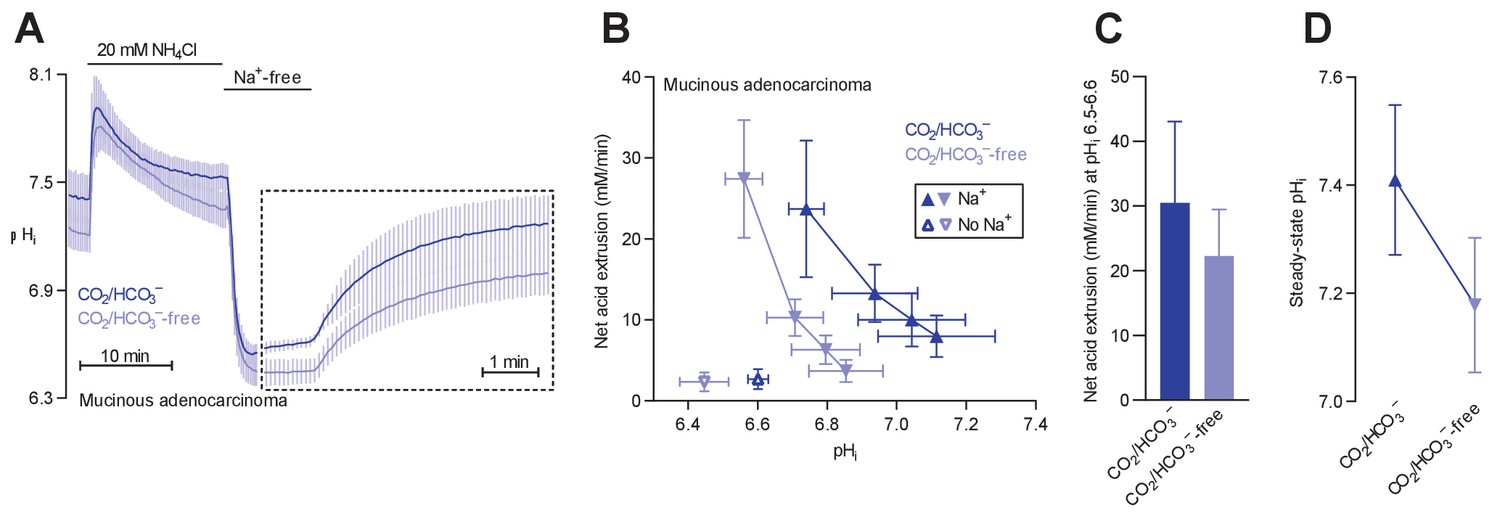
Na+/H+ exchange and Na+,HCO3– cotransport activity regulate intracellular pH (pHi) in mucinous adenocarcinomas.
(A) Traces of NH4+-prepulse-induced pHi dynamics in human mucinous adenocarcinomas (n=5). The time scale within the dotted rectangle is expanded in order to improve resolution during the pHi recovery phase. (B,C) Cellular net acid extrusion activities in human mucinous adenocarcinomas plotted as functions of pHi (B) and calculated for the pHi range 6.5–6.6 (C) in presence and nominal absence of CO2/HCO3– (n=5). (D) Initial steady-state pHi in human mucinous adenocarcinomas (n=5) in presence and nominal absence of CO2/HCO3–.
Figure 2—figure supplement 2
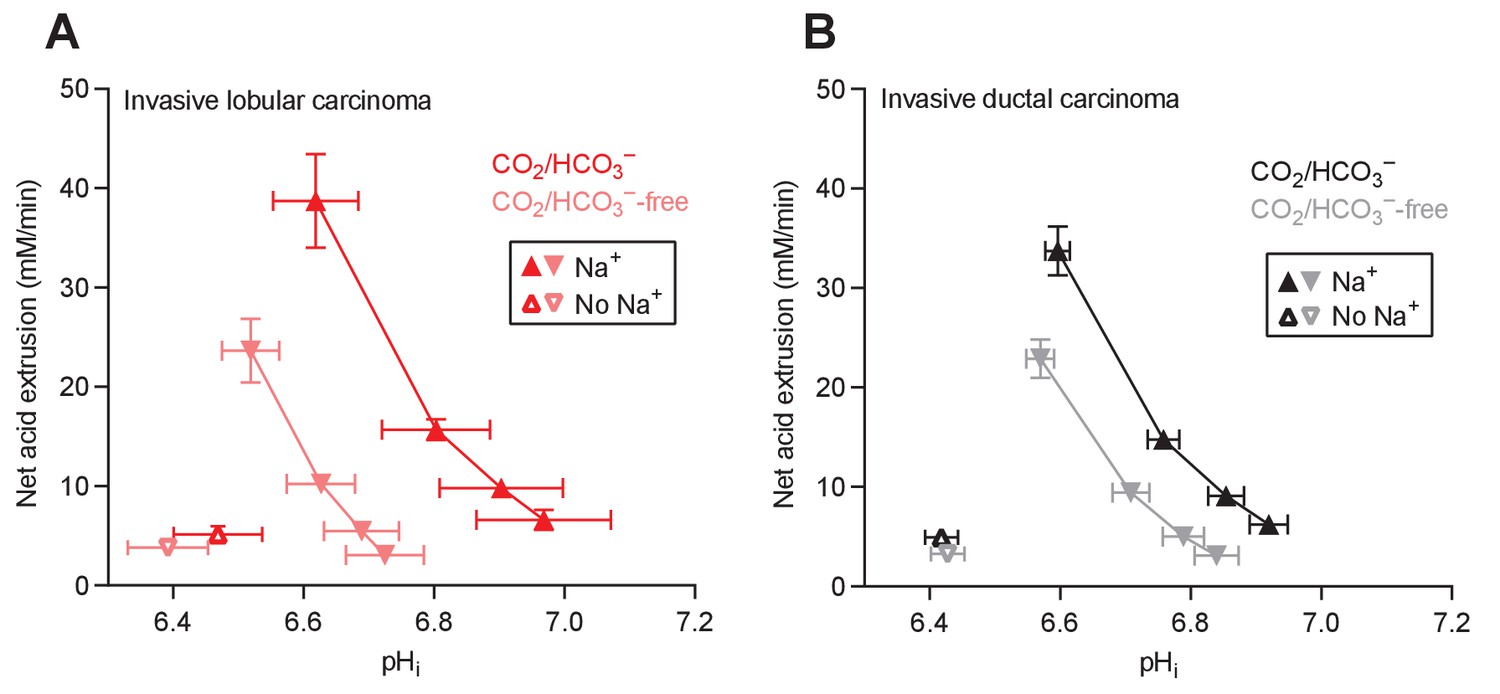
Cellular net acid extrusion activities in presence and nominal absence of CO2/HCO3– plotted as functions of intracellular pH (pHi) for human invasive lobular and ductal breast carcinomas.
(A) Invasive lobular primary breast carcinomas (n=8–9). (B) Invasive ductal primary breast carcinomas (n=60–62).
Figure 3 with 1 supplement

Steady-state intracellular pH (pHi) is elevated in human breast carcinomas of high malignancy grade due to cellular CO2/HCO3–-dependent net acid extrusion.
(A–C) Traces of NH4+-prepulse-induced pHi dynamics in human invasive ductal breast carcinomas of malignancy grades I (A, n=12–14), II (B, n=34), and III (C, n=14). The time scale within the dotted rectangles is expanded in order to improve resolution during the pHi recovery phase. (D) Cellular net acid extrusion activities in presence and nominal absence of CO2/HCO3– were calculated in the pHi range 6.5–6.6 for human invasive ductal breast carcinomas of malignancy grades I, II, and III (n=12–34). Figure 3—figure supplement 1 provides a detailed analysis of the net acid extrusion capacity as function of pHi. (E) Initial steady-state pHi in human invasive ductal breast carcinomas of malignancy grades I (n=14–15), II (n=35), and III (n=15) in presence and nominal absence of CO2/HCO3–. Data in panels D and E were compared by mixed-effects analyses and repeated-measures one-way ANOVA with post-test for linear trend. ‘Interaction’ reports whether the effect of CO2/HCO3– varies between human breast carcinomas of malignancy grades I, II, and III. (F, G) Summarized pathologist-scored, immunohistochemistry-based protein expression data for NHE1 (F, n=65) and NBCn1 (G, n=65) in human invasive ductal carcinomas stratified by malignancy grade. Protein expression in human breast carcinomas of malignancy grades I, II, and III was compared by χ2 tests.
Figure 3—figure supplement 1
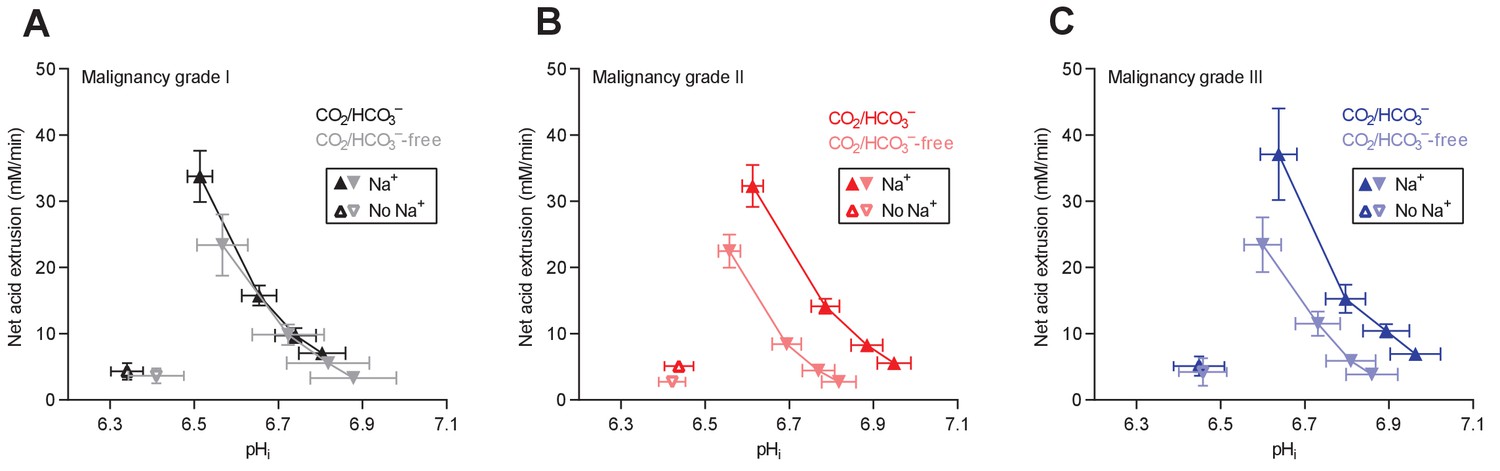
Cellular net acid extrusion activities in presence and nominal absence of CO2/HCO3– plotted as functions of intracellular pH (pHi) for human invasive ductal breast carcinomas of malignancy grades I, II, and III.
(A) Primary breast carcinomas of malignancy grade I (n=12–14). (B) Primary breast carcinomas of malignancy grade II (n=34). (C) Primary breast carcinomas of malignancy grade III (n=14).
Figure 4 with 1 supplement
Intracellular pH (pHi) is elevated in estrogen receptor-negative breast cancer.
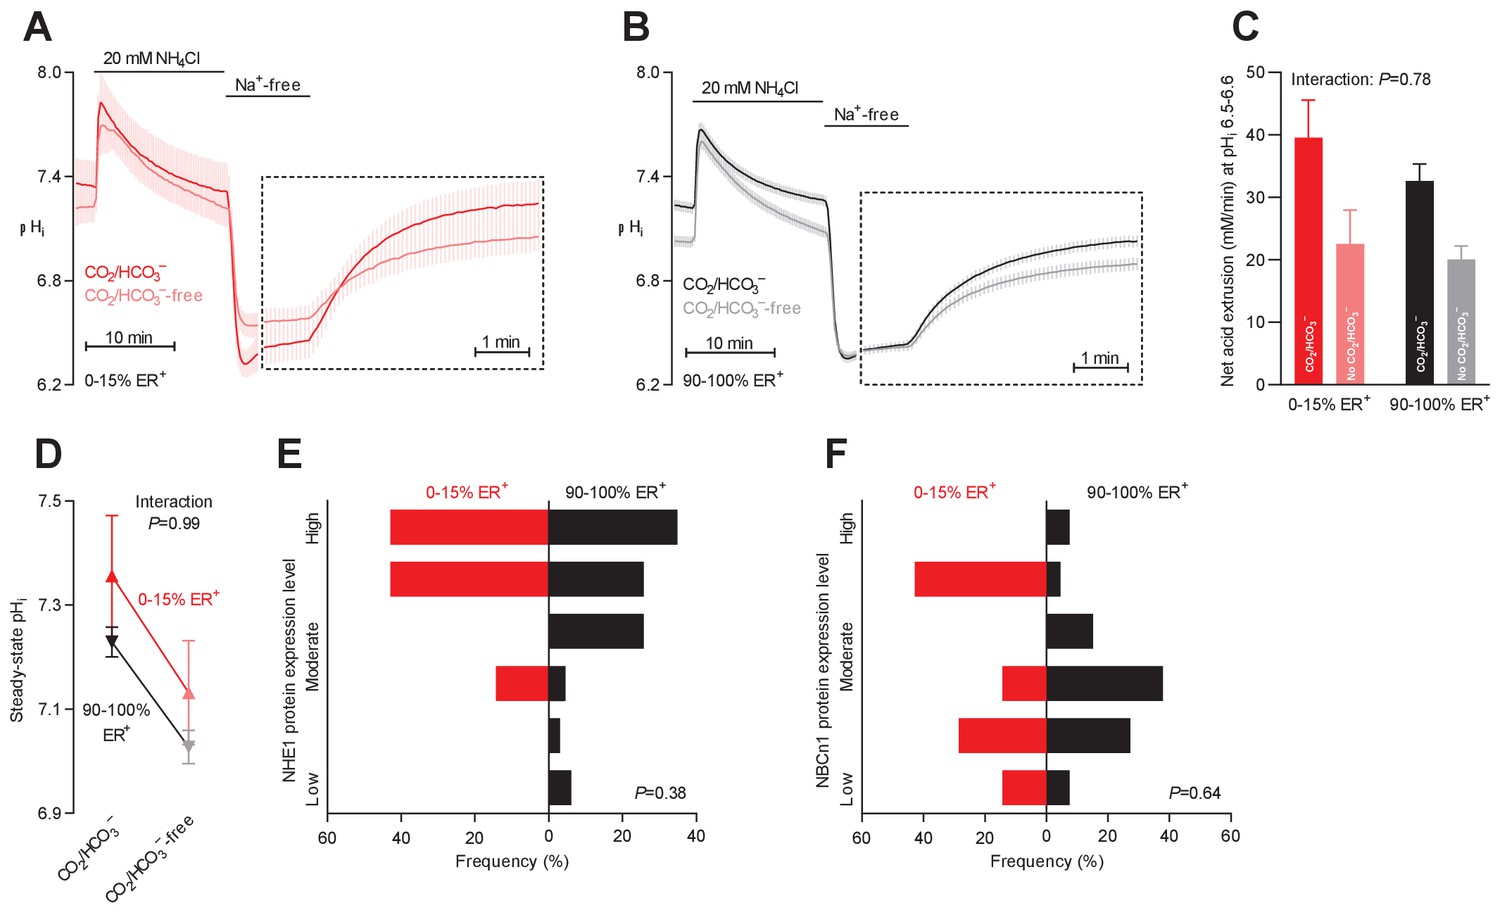
(A,B) Traces of NH4+-prepulse-induced pHi dynamics in human breast carcinomas stratified by estrogen receptor status (A: negative, n=6; B: positive, n=63–64). The time scale within the dotted rectangles is expanded in order to improve resolution during the pHi recovery phase. (C) Cellular net acid extrusion activities in presence and nominal absence of CO2/HCO3– were calculated in the pHi range 6.5–6.6 for human breast carcinomas stratified by estrogen receptor status (n=6–64). Figure 4—figure supplement 1 provides a detailed analysis of the net acid extrusion capacity as function of pHi. (D) Initial steady-state pHi in human estrogen receptor-negative (0–15% ER+, n=7–8) and -positive (90–100% ER+, n=66–67) breast carcinomas. Data in panels C and D were compared by mixed-effects analyses. ‘Interaction’ reports whether the effect of CO2/HCO3– varies between estrogen receptor-negative and -positive breast carcinomas. (E,F) Pathologist-scored, immunohistochemistry-based protein expression levels for NHE1 (E) and NBCn1 (F) in human breast carcinomas (n=73) stratified by estrogen receptor status. Protein expression in human estrogen receptor-negative and -positive breast carcinomas was compared by χ2 tests for trend.
Figure 4—figure supplement 1
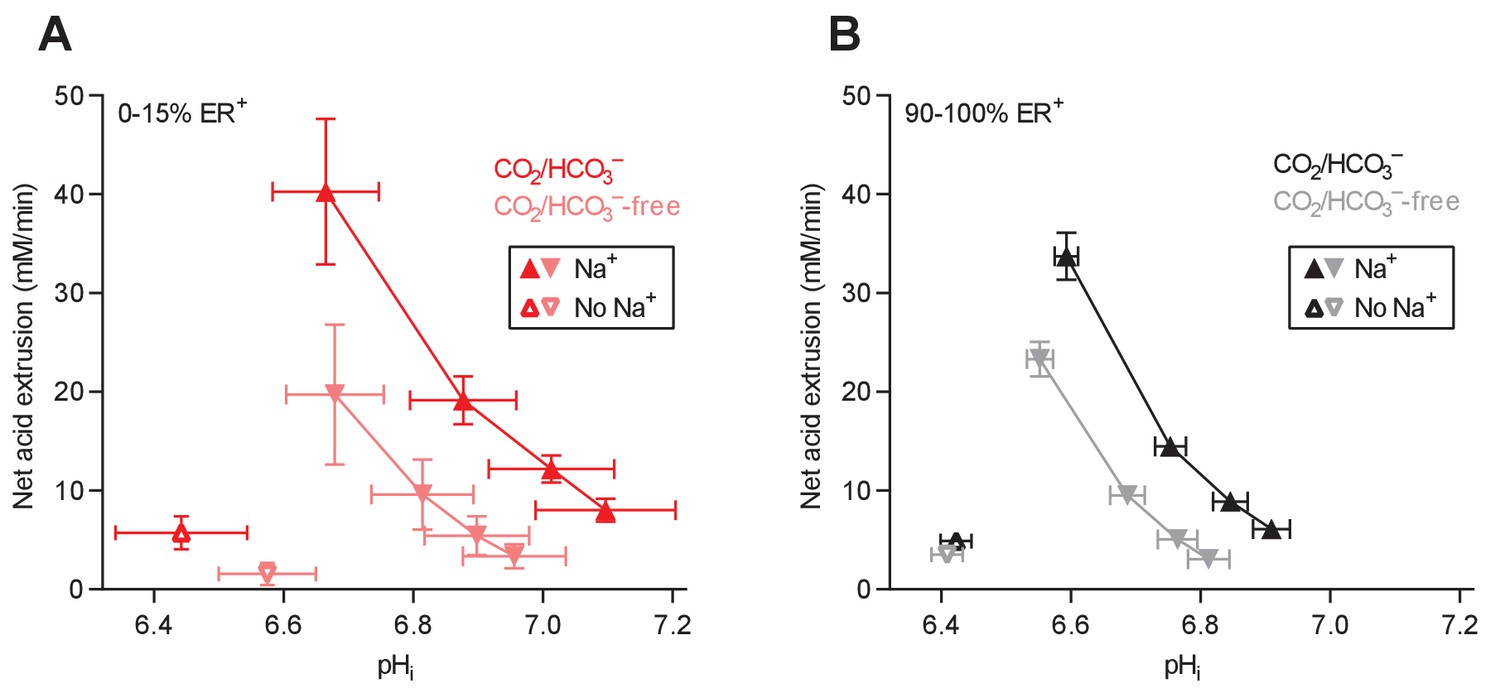
Cellular net acid extrusion activities in presence and nominal absence of CO2/HCO3– plotted as function of intracellular pH (pHi) for human breast carcinomas stratified by estrogen receptor status.
(A) Estrogen receptor-negative primary breast carcinomas (n=6). (B) Estrogen receptor-positive primary breast carcinomas (n=63–64).
Figure 5 with 1 supplement
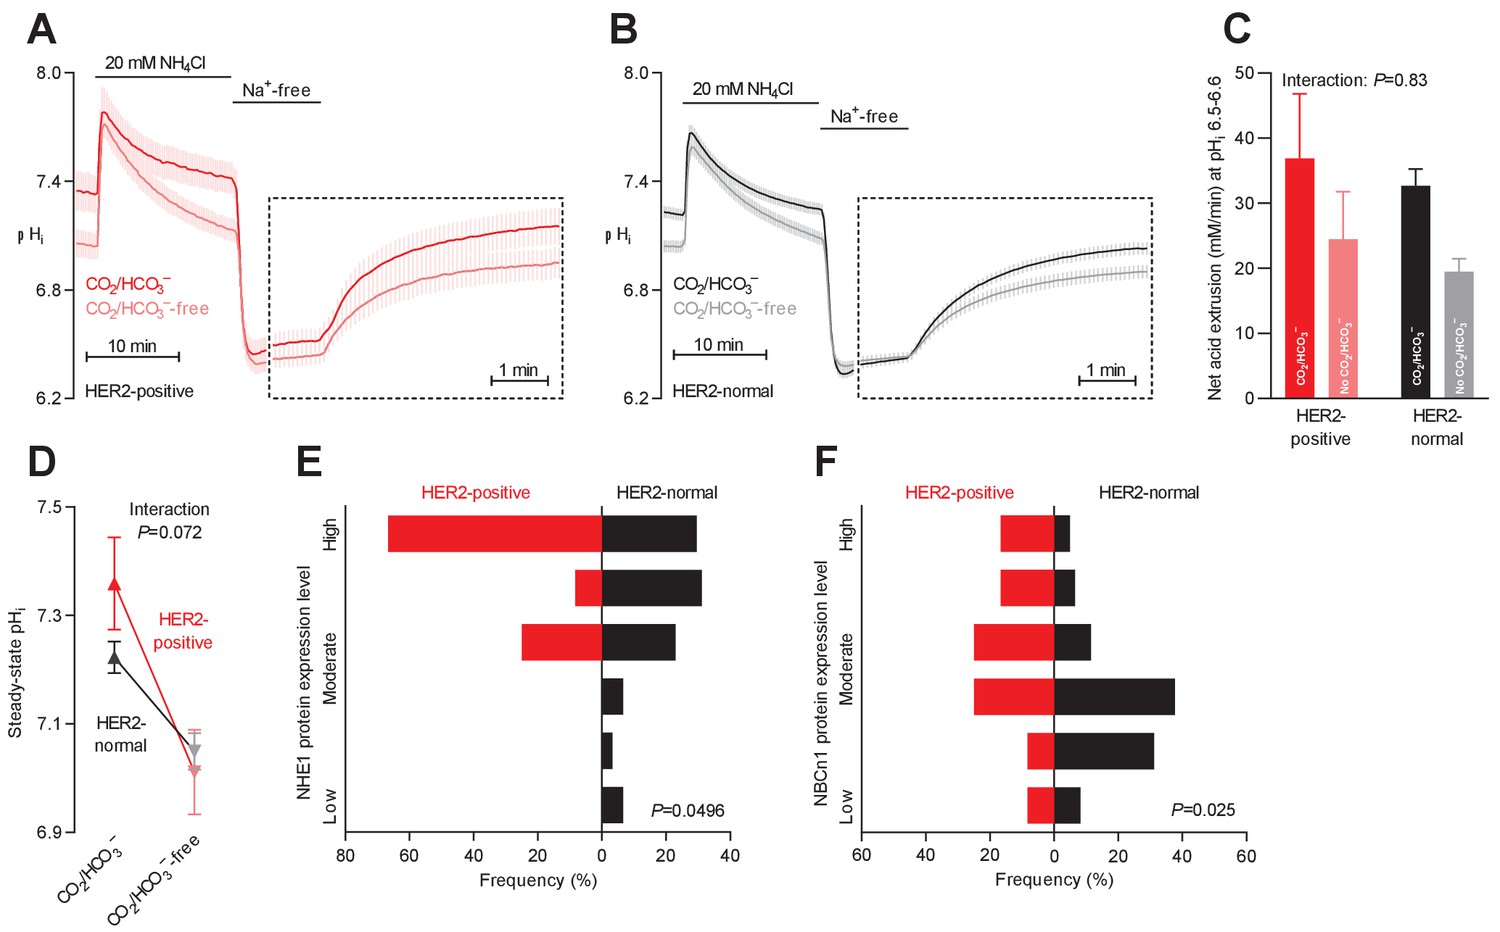
Protein expression of NHE1 and NBCn1 is elevated in HER2-positive human breast cancer.
(A,B) Traces of NH4+-prepulse-induced intracellular pH (pHi) dynamics in human HER2-positive (A, n=9–11) and HER2-normal (B, n=58–61) breast carcinomas. The time scale within the dotted rectangles is expanded in order to improve resolution during the pHi recovery phase. (C) Cellular net acid extrusion activities in the presence and nominal absence of CO2/HCO3– were calculated in the pHi range 6.5–6.6 for human breast carcinomas stratified by HER2 status (n=9–61). Figure 5—figure supplement 1 provides a detailed analysis of the net acid extrusion capacity as function of pHi. (D) Initial steady-state pHi in HER2-positive (n=10–11) and -normal (n=63) human breast carcinomas. Data in panels C and D were compared by mixed-effects analyses. ‘Interaction’ reports whether the effect of CO2/HCO3– varies between HER2-positive and -normal breast carcinomas. (E,F) Summarized pathologist-scored, immunohistochemistry-based protein expression data for NHE1 (E) and NBCn1 (F) in human breast carcinomas (n=73) stratified by HER2 status. Protein expression in human HER2-positive and -normal breast carcinomas was compared by χ2 tests for trend.
Figure 5—figure supplement 1
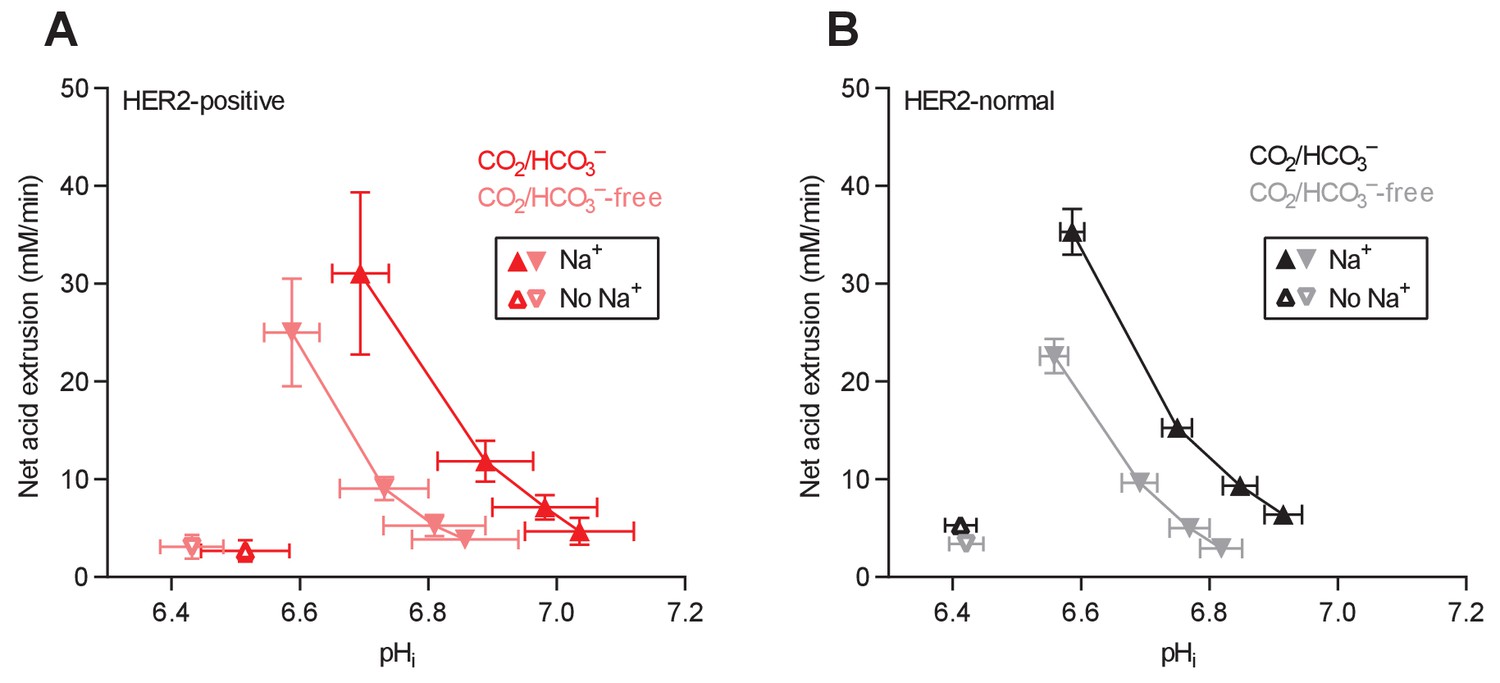
Cellular net acid extrusion activities in the presence and nominal absence of CO2/HCO3– plotted as functions of intracellular pH (pHi) for human breast carcinomas stratified by HER2 status.
(A) HER2-positive primary breast carcinomas (n=9–11). (B) HER2-normal primary breast carcinomas (n=58–61).
Figure 6 with 1 supplement
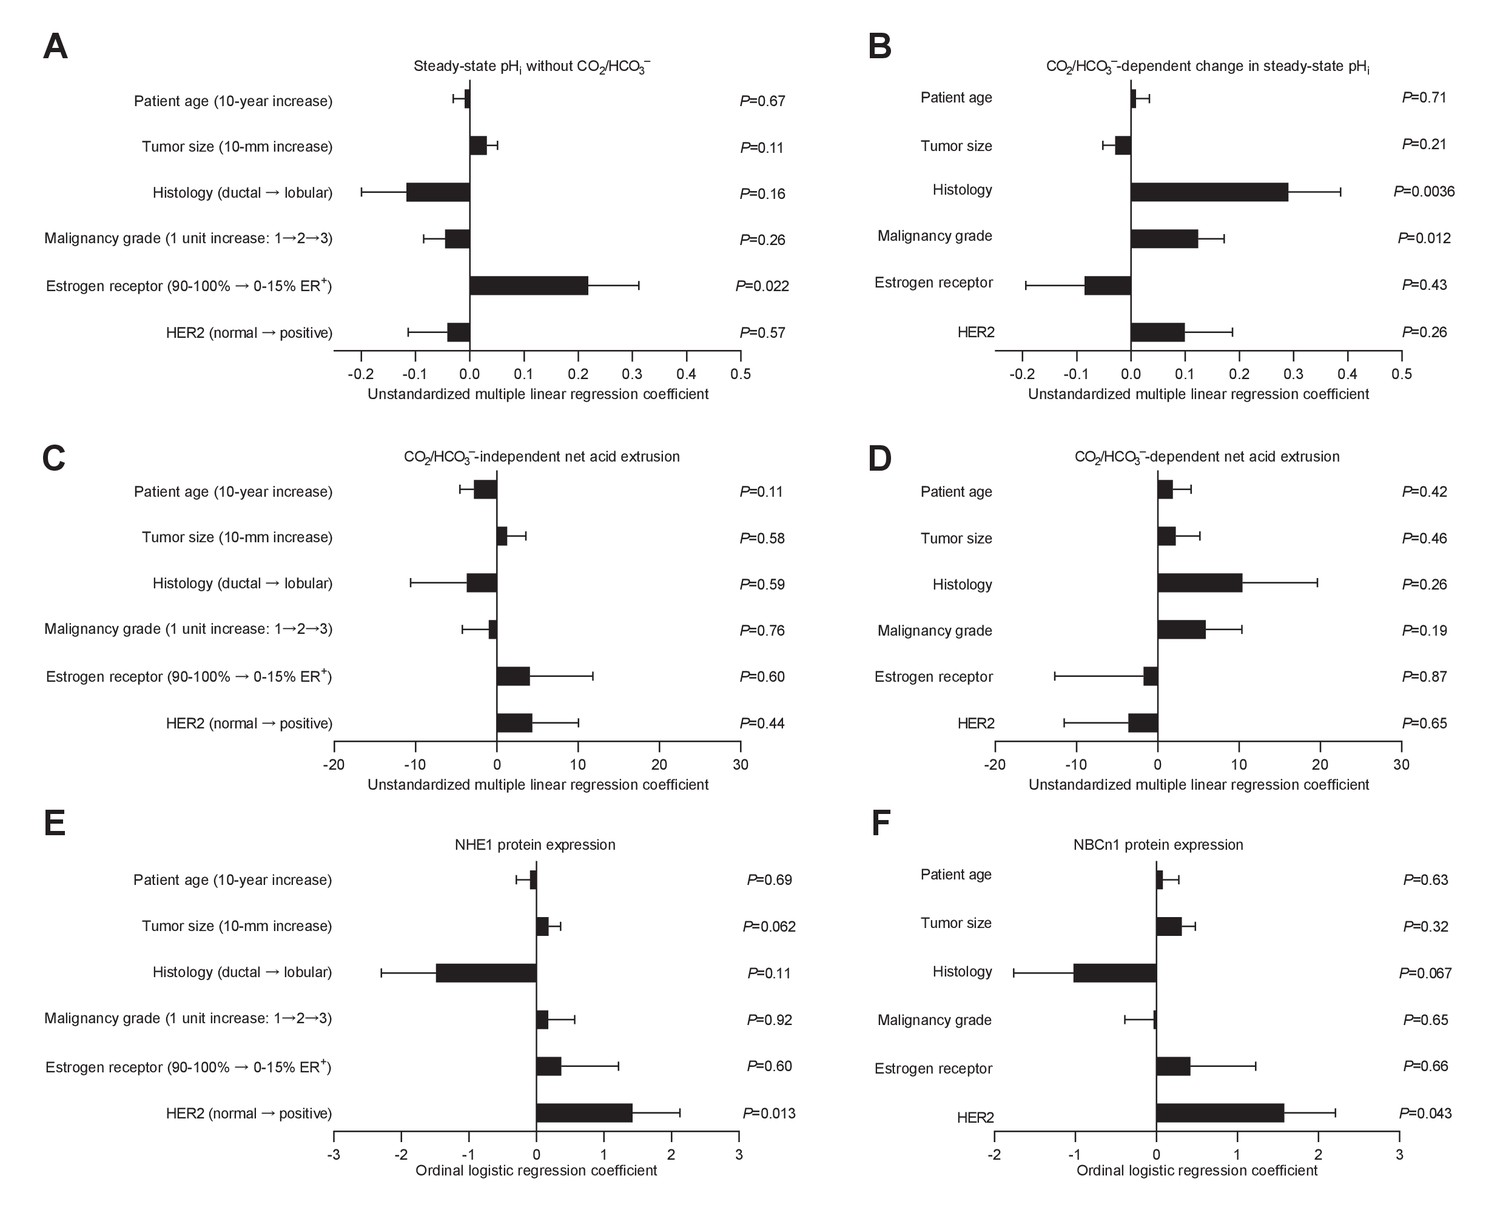
Histology, malignancy grade, and receptor expression profiles are independent predictors of intracellular pH (pHi) dynamics and acid-base transporter expression in human invasive lobular and ductal breast carcinomas.
(A–D) Multiple linear regression analyses show the independent influences of patient age, tumor size, histology, malignancy grade, and expression of estrogen and HER2 receptors on steady-state pHi and net acid extrusion capacity in human breast cancer tissue (n=78). Data were adjusted for inter-investigator variation. Figure 6—figure supplement 1 provides plots of steady-state pHi and net acid extrusion as functions of tumor size and patient age. (E,F) Ordinal logistic regression analyses show the independent influences of patient age, tumor size, histology, malignancy grade, and expression of estrogen and HER2 receptors on protein expression levels for NHE1 (E) and NBCn1 (F) in human breast cancer tissue (n=73).
Figure 6—figure supplement 1
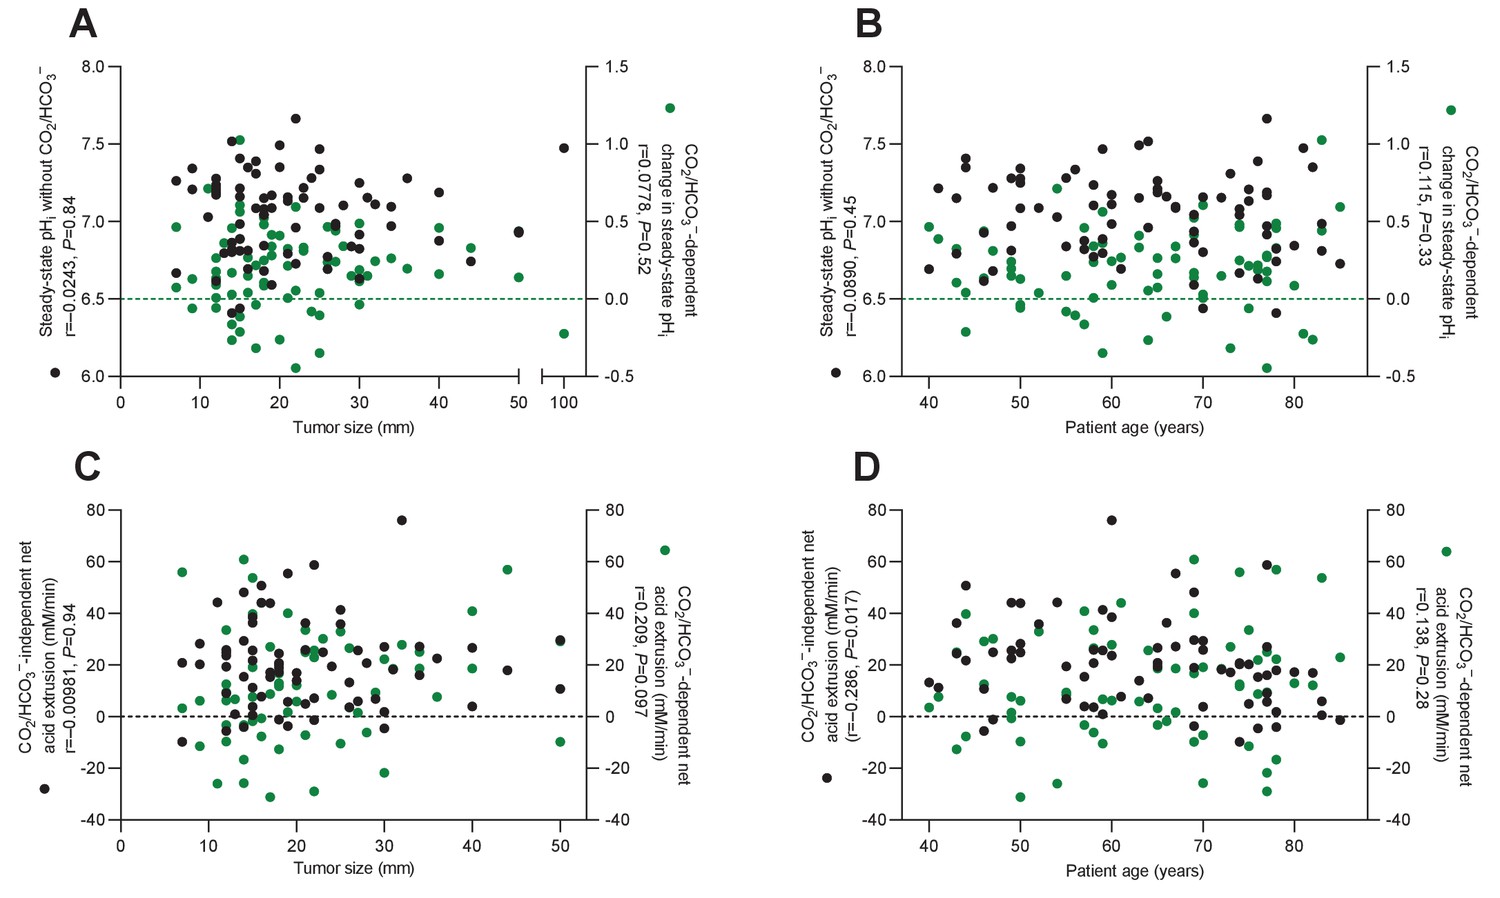
Plots of acid-base parameters in human breast cancer tissue (n=64–74) as functions of tumor size (A,C) and patient age (B,D).
Statistical relationships among the variables were tested by Spearman’s correlation analyses.
Figure 7 with 1 supplement
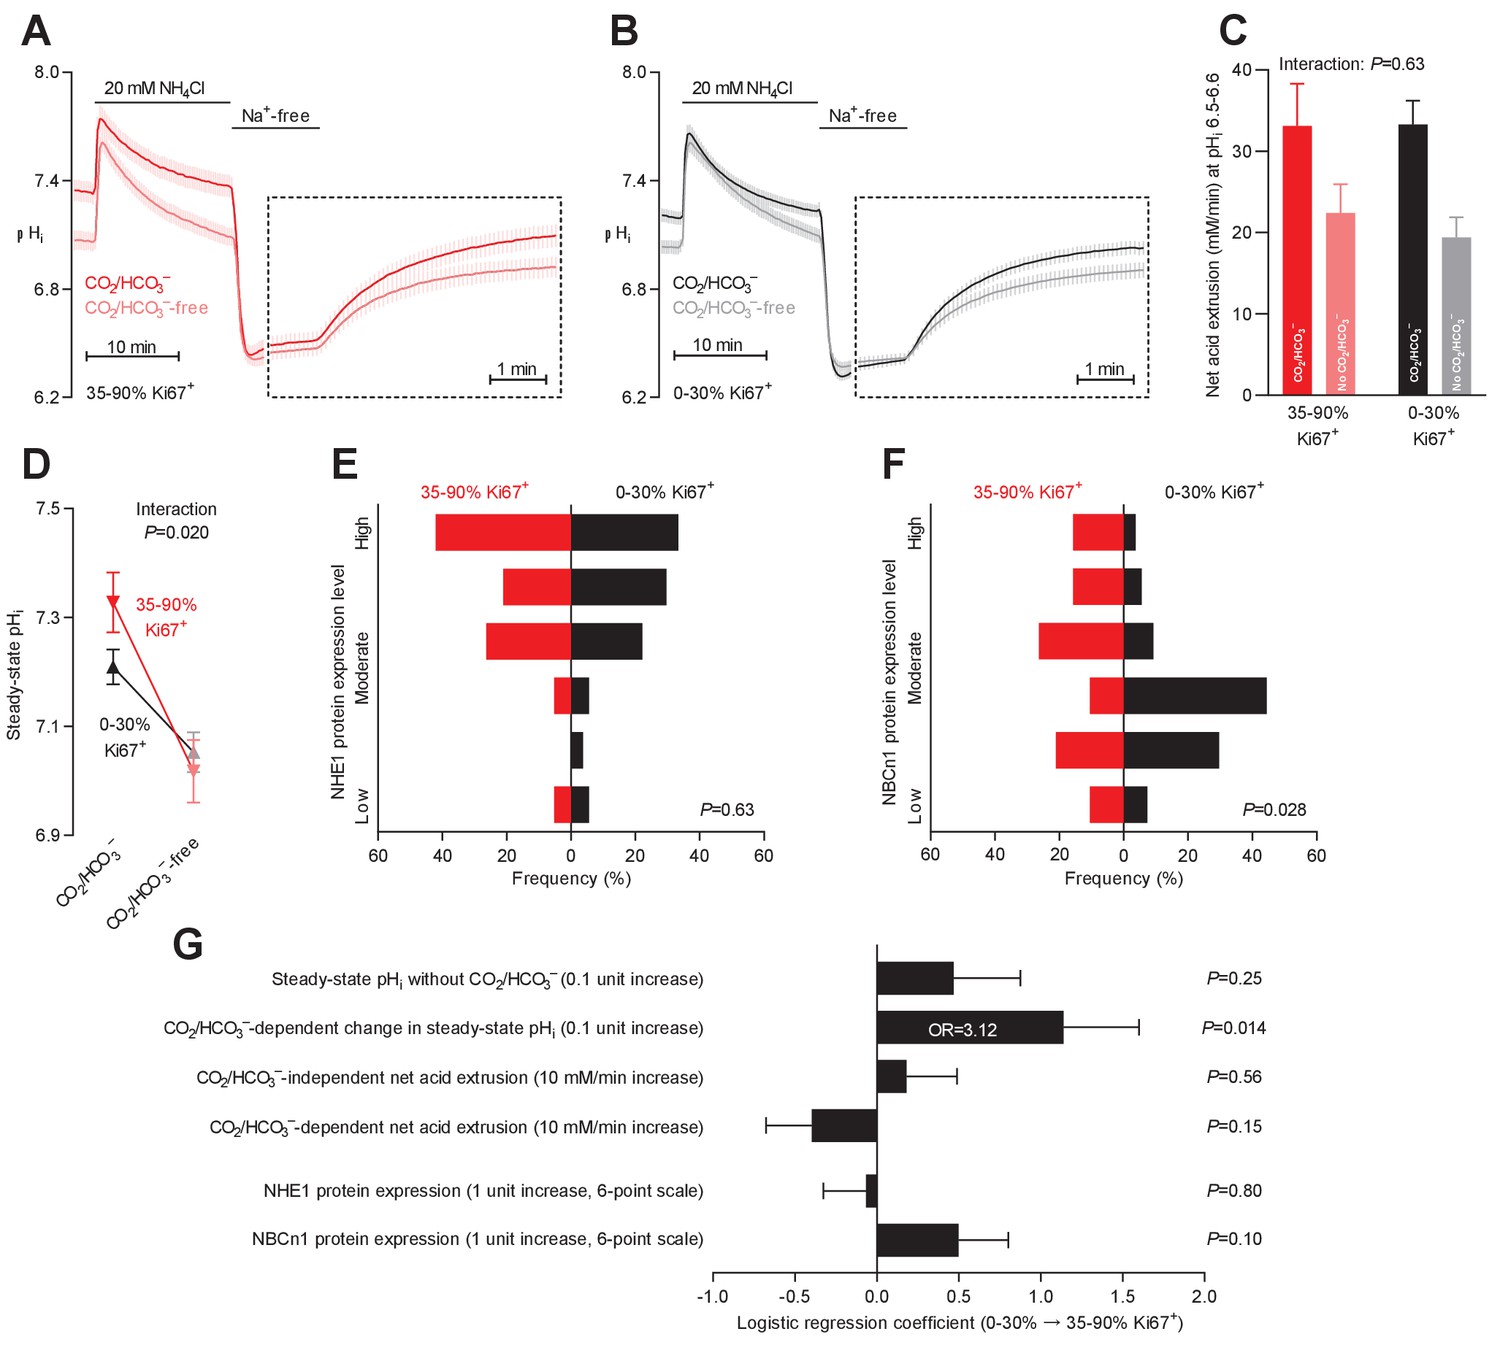
Steady-state intracellular pH (pHi) is elevated in human breast carcinomas with high proliferative activity (elevated Ki67 index).
(A,B) Traces of NH4+-prepulse-induced pHi dynamics in breast carcinomas with high (A, 35–90% Ki67+, n=19–20) and low (B, 0–30% Ki67+, n=49–51) Ki67 index. The time scale within the dotted rectangles is expanded in order to improve resolution during the pHi recovery phase. (C) Cellular net acid extrusion activities in presence and nominal absence of CO2/HCO3– were calculated in the pHi range 6.5–6.6 for human breast carcinomas stratified by Ki67 index (n=19–51). Figure 7—figure supplement 1 provides a detailed analysis of the net acid extrusion capacity as function of pHi. (D) Initial steady-state pHi in breast carcinomas with high (n=20) and low (n=53–54) Ki67 index. Data in panels C and D were compared by mixed-effects analyses. ‘Interaction’ reports whether the effect of CO2/HCO3– varies between breast carcinomas with high and low Ki67 index. (E,F) Summarized pathologist-scored, immunohistochemistry-based protein expression levels for NHE1 (E) and NBCn1 (F) in human breast carcinomas (n=73) stratified by Ki67 index. Protein expression in human breast carcinomas of low and high Ki67 index was compared by χ2 tests for trend. (G) Results of binominal logistic regression analyses where the influence of the acid-base parameters and transporter expression levels on cellular proliferation was adjusted for patient age, tumor size, histology, malignancy grade, estrogen receptor status, HER2 status, and inter-investigator variation (n=73–78). Odds ratios (OR) are given for variables showing statistically significant association.
Figure 7—figure supplement 1
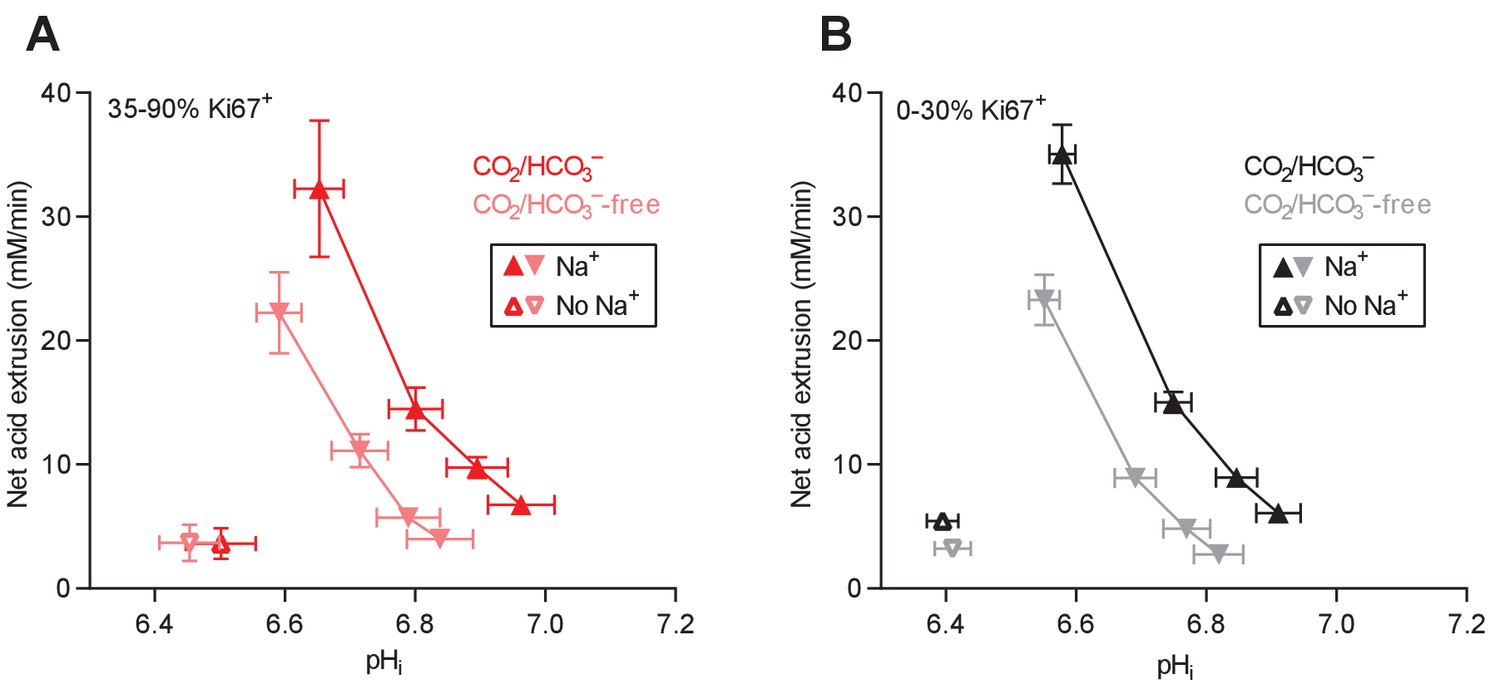
Cellular net acid extrusion activities in presence and nominal absence of CO2/HCO3– plotted as functions of intracellular pH (pHi) for human breast carcinomas stratified by Ki67 index.
(A) Primary breast carcinomas with high proliferative index (35–90% Ki67+ cells; n=19–20). (B) Primary breast carcinomas with low proliferative index (0–30% Ki67+ cells; n=49–51).
Figure 8 with 1 supplement
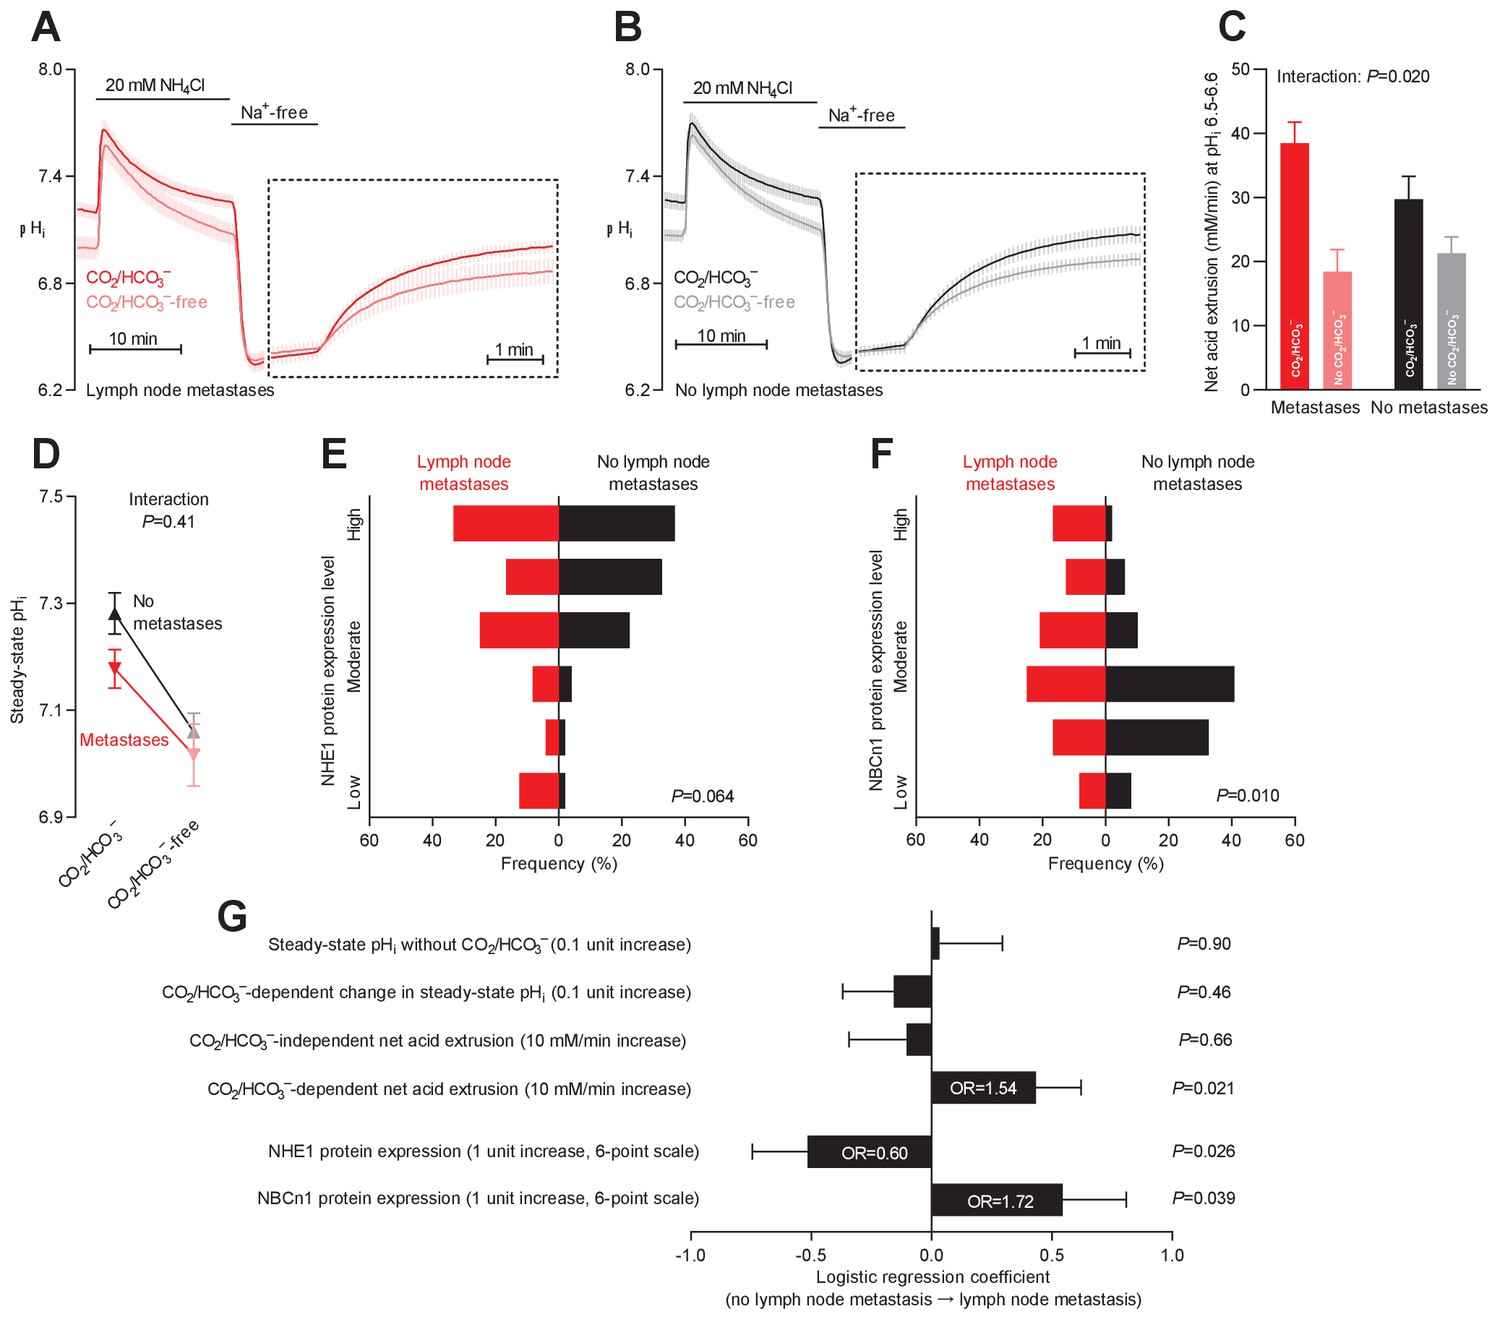
Primary breast cancer tissue from patients with axillary lymph node metastases shows higher Na+,HCO3– cotransport activity during intracellular acidification, higher NBCn1 expression, and lower NHE1 expression than breast cancer tissue from patients without metastases.
(A,B) Traces of NH4+-prepulse-induced intracellular pH (pHi) dynamics in primary breast carcinomas from patients with (A, n=25–28) and without (B, n=42–44) axillary lymph node metastases. Time scales within the dotted rectangles are expanded to improve resolution during the pHi recovery. (C) Cellular net acid extrusion activities in presence and absence of CO2/HCO3– calculated in the pHi range 6.5–6.6 for primary breast carcinomas stratified by axillary lymph node status (n=25–44). Figure 8—figure supplement 1 provides detailed analysis of net acid extrusion capacities as function of pHi. (D) Initial steady-state pHi in primary breast carcinomas from patients with (n=28) and without (n=45–46) lymph node metastases. Data in panels C and D were compared by mixed-effects analyses. ‘Interaction’ reports whether the effect of CO2/HCO3– varies between breast carcinomas from patients with and without lymph node metastases. (E,F) Summarized pathologist-scored, immunohistochemistry-based protein expression levels for NHE1 (E) and NBCn1 (F) in primary breast carcinomas from patients with (n=24) and without (n=49) lymph node metastases. Protein expression data were compared by χ2 tests for trend. (G) Results of binominal logistic regression analyses where influences of acid-base parameters and transporter expression levels on lymph node metastasis were adjusted for patient age, tumor size, histology, malignancy grade, estrogen receptor status, HER2 status, and inter-investigator variation (n=73–78). Odds ratios (OR) are given for variables showing statistically significant association.
Figure 8—figure supplement 1
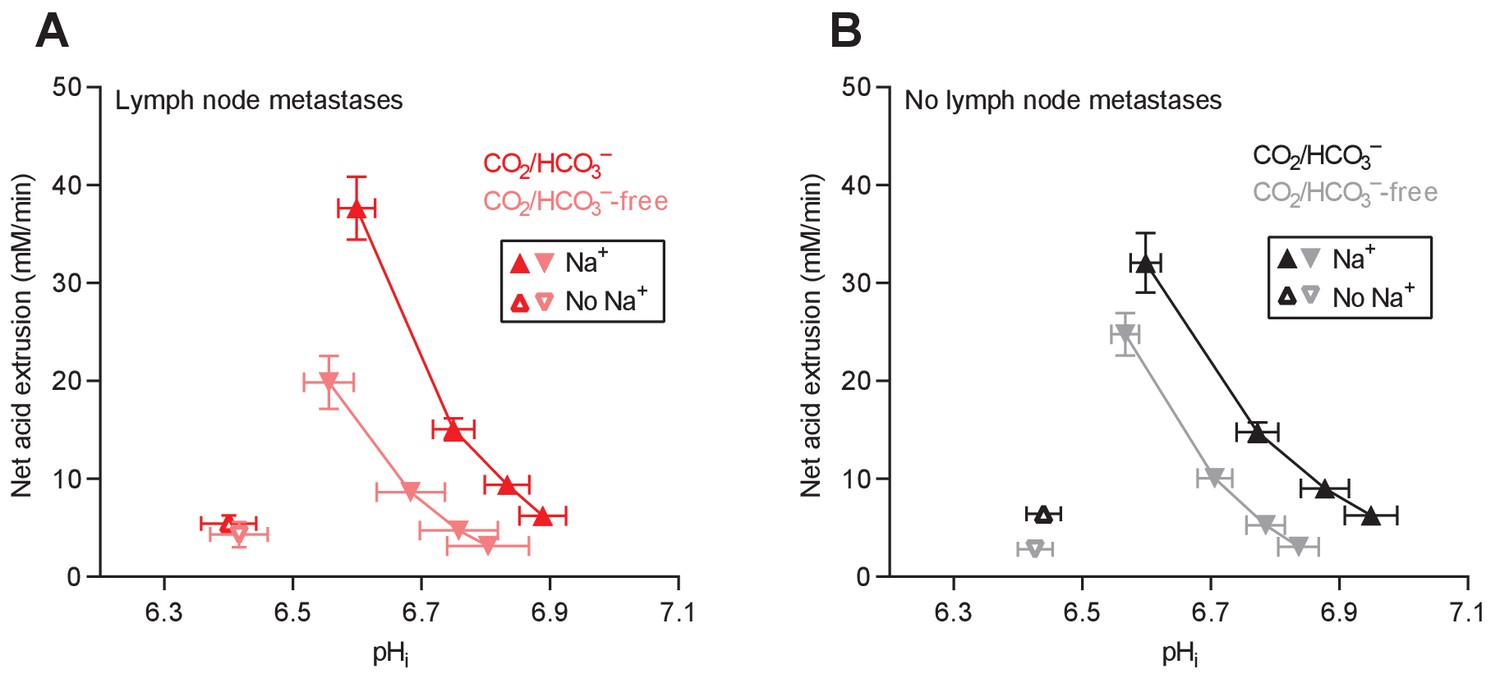
Cellular net acid extrusion activities in presence and nominal absence of CO2/HCO3– plotted as functions of intracellular pH (pHi) for human primary breast carcinomas stratified by axillary lymph node status.
(A) Primary breast carcinomas from patients with lymph node metastases (n=25–28). (B) Primary breast carcinomas from patients with no lymph node metastases (n=42–44).
Figure 9 with 1 supplement
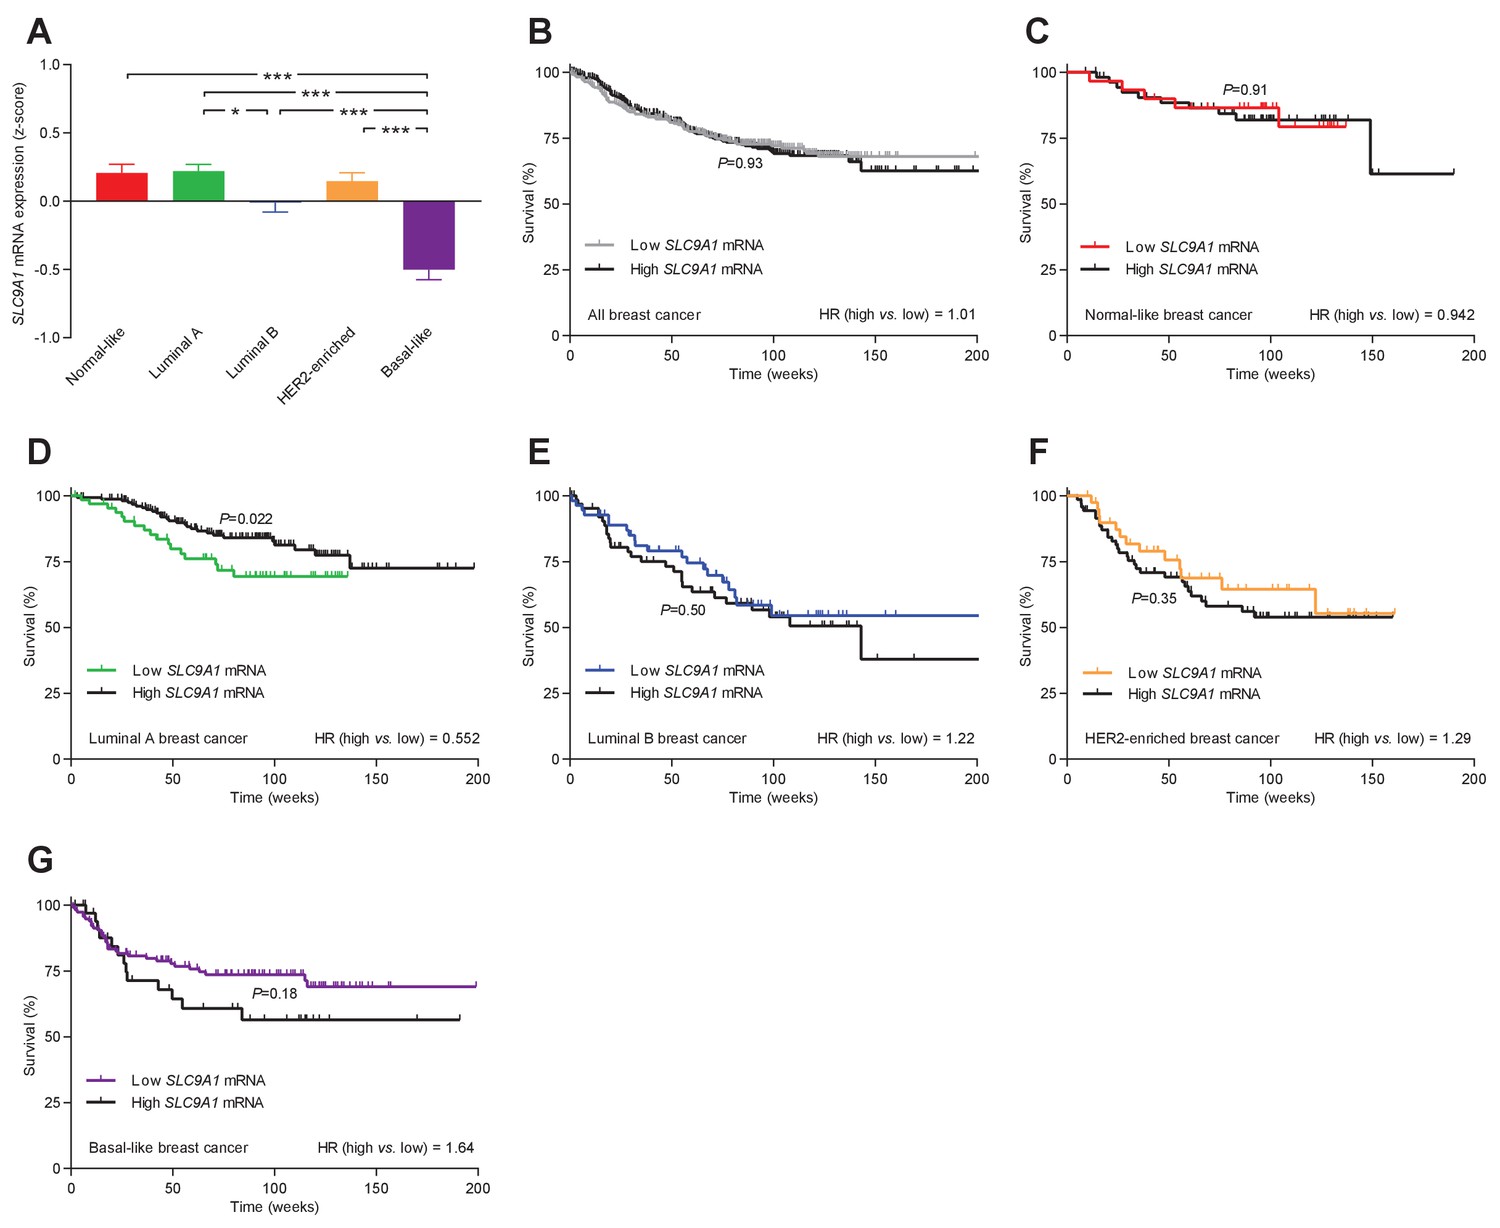
The levels of SLC9A1 mRNA, encoding NHE1, vary among breast cancer subtypes, and high SLC9A1 expression is associated with improved survival in patients with luminal A breast cancer.
(A) Variation in SLC9A1 mRNA levels among patients with different breast cancer subtypes (n=135–344). Expression data were compared by one-way ANOVA followed by Tukey’s post-test. Figure 9—figure supplement 1 provides data on mRNA expression of ESR1, PGR, ERBB2, MKI67, LDHA, PECAM1, and CD34 in breast cancer tissue of the different molecular subtypes. Figure 9—source data 1 provides results from correlation analyses between SLC9A1 mRNA expression and the mRNA levels for ESR1, PGR, ERBB2, SLC4A7, SLC16A1, and SLC16A3. *p<0.05, ***p<0.001. (B–G) Survival curves stratified by SLC9A1 mRNA levels in patients with different breast cancer subtypes. The ticks on the curves represent censored subjects. Survival data were compared by Mantel-Cox and Gehan-Breslow-Wilcoxon tests. HR, hazard ratio.
-
Figure 9—source data 1
The mRNA expression for SLC9A1 correlates with that of ESR1 and ERBB2.
When adjusted for expression of ESR1, PGR, and ERBB2, the mRNA expression of SLC9A1 does not correlate with that of SLC4A7, SLC16A1, and SLC16A3 (n=409–1162).
- https://cdn.elifesciences.org/articles/68447/elife-68447-fig9-data1-v2.docx
Figure 9—figure supplement 1
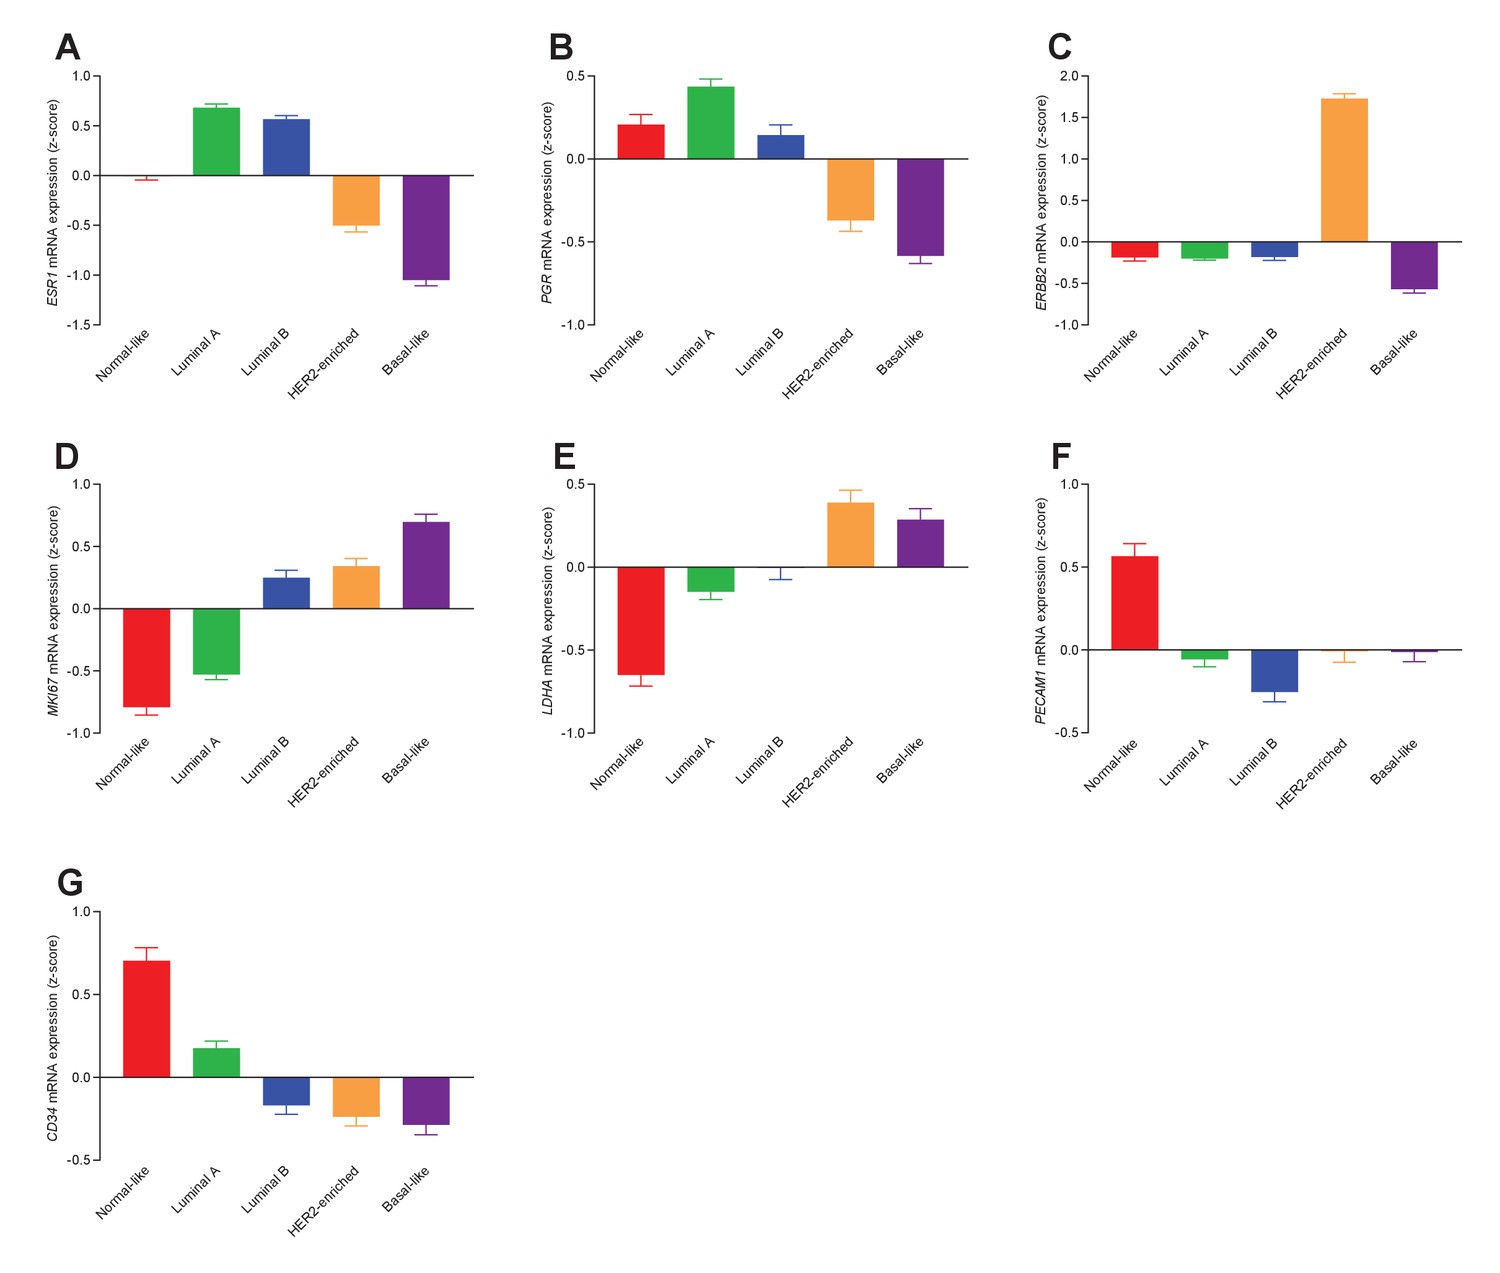
Transcript patterns for the different molecular subtypes of breast cancer.
We observe systematic differences in mRNA levels for estrogen (A: ESR1, n=135–344), progesterone (B: PGR, n=162–438), and HER2 (C: ERBB2, n=162–438) receptors, the proliferative marker Ki67 (D: MKI67, n=135–344), lactate dehydrogenase (E: LDHA, n=135–344) involved in fermentative glycolysis, and the angiogenic markers PECAM1/CD31 (F: PECAM1, n=162–438) and CD34 (G: CD34, n=162–438).
Figure 10 with 2 supplements
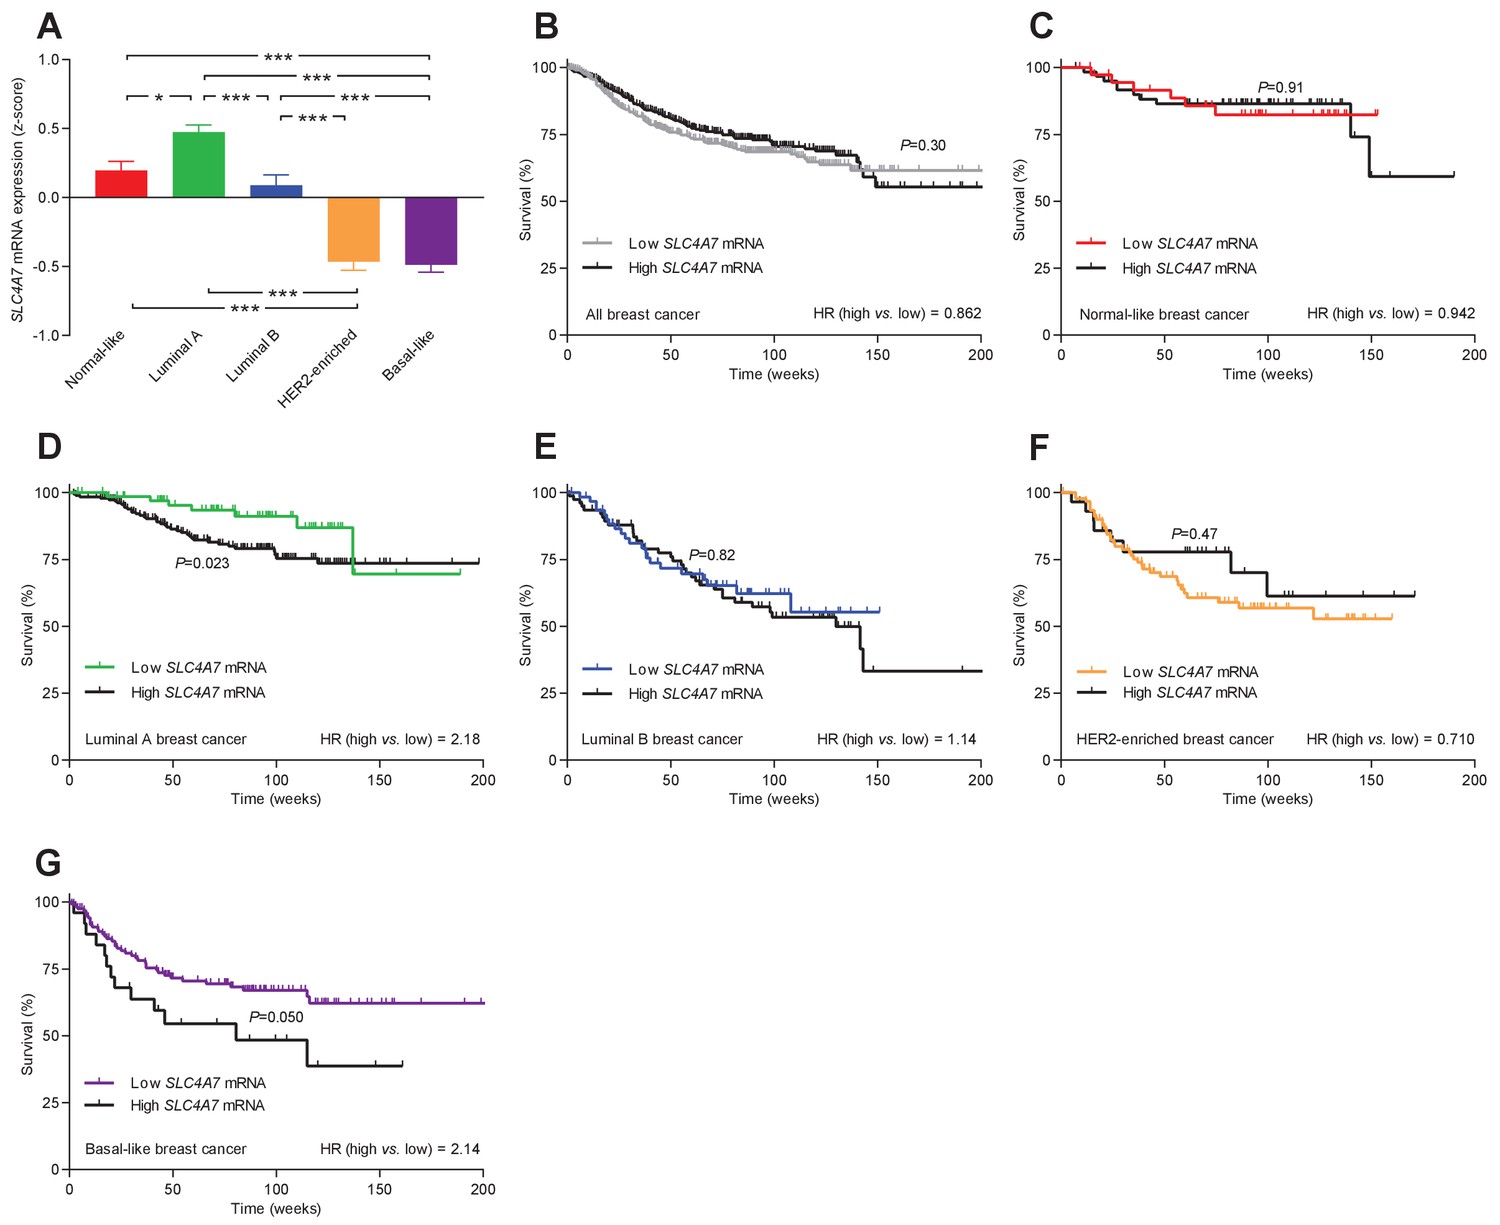
The levels of SLC4A7 mRNA, encoding NBCn1, vary among breast cancer subtypes, and high SLC4A7 expression is associated with poor survival in patients with luminal A or basal-like breast cancer.
(A) Variation in SLC4A7 mRNA levels among patients with different breast cancer subtypes (n=135–344). Expression data were compared by one-way ANOVA followed by Tukey’s post-test. *p<0.05, ***p<0.001. Figure 10—source data 1 provides results from correlation analyses between SLC4A7 mRNA expression and the mRNA levels for ESR1, PGR, ERBB2, SLC9A1, SLC16A1, and SLC16A3. (B–G) Survival curves stratified by SLC4A7 mRNA levels in patients with different breast cancer molecular subtypes. The ticks on the curves represent censored subjects. Survival data were compared by Mantel-Cox and Gehan-Breslow-Wilcoxon tests. HR, hazard ratio. Figure 10—figure supplement 1 provides results on the expression and survival consequences of SLC16A1 mRNA. Figure 10—figure supplement 2 provides results on the expression and survival consequences of SLC16A3 mRNA.
-
Figure 10—source data 1
The mRNA expression for SLC4A7 correlates with that of ESR1, PGR, and ERBB2.
When adjusted for expression of ESR1, PGR, and ERBB2, the mRNA expression of SLC4A7 does not correlate with that of SLC9A1, SLC16A1, and SLC16A3 (n=409–1162).
- https://cdn.elifesciences.org/articles/68447/elife-68447-fig10-data1-v2.docx
Figure 10—figure supplement 1
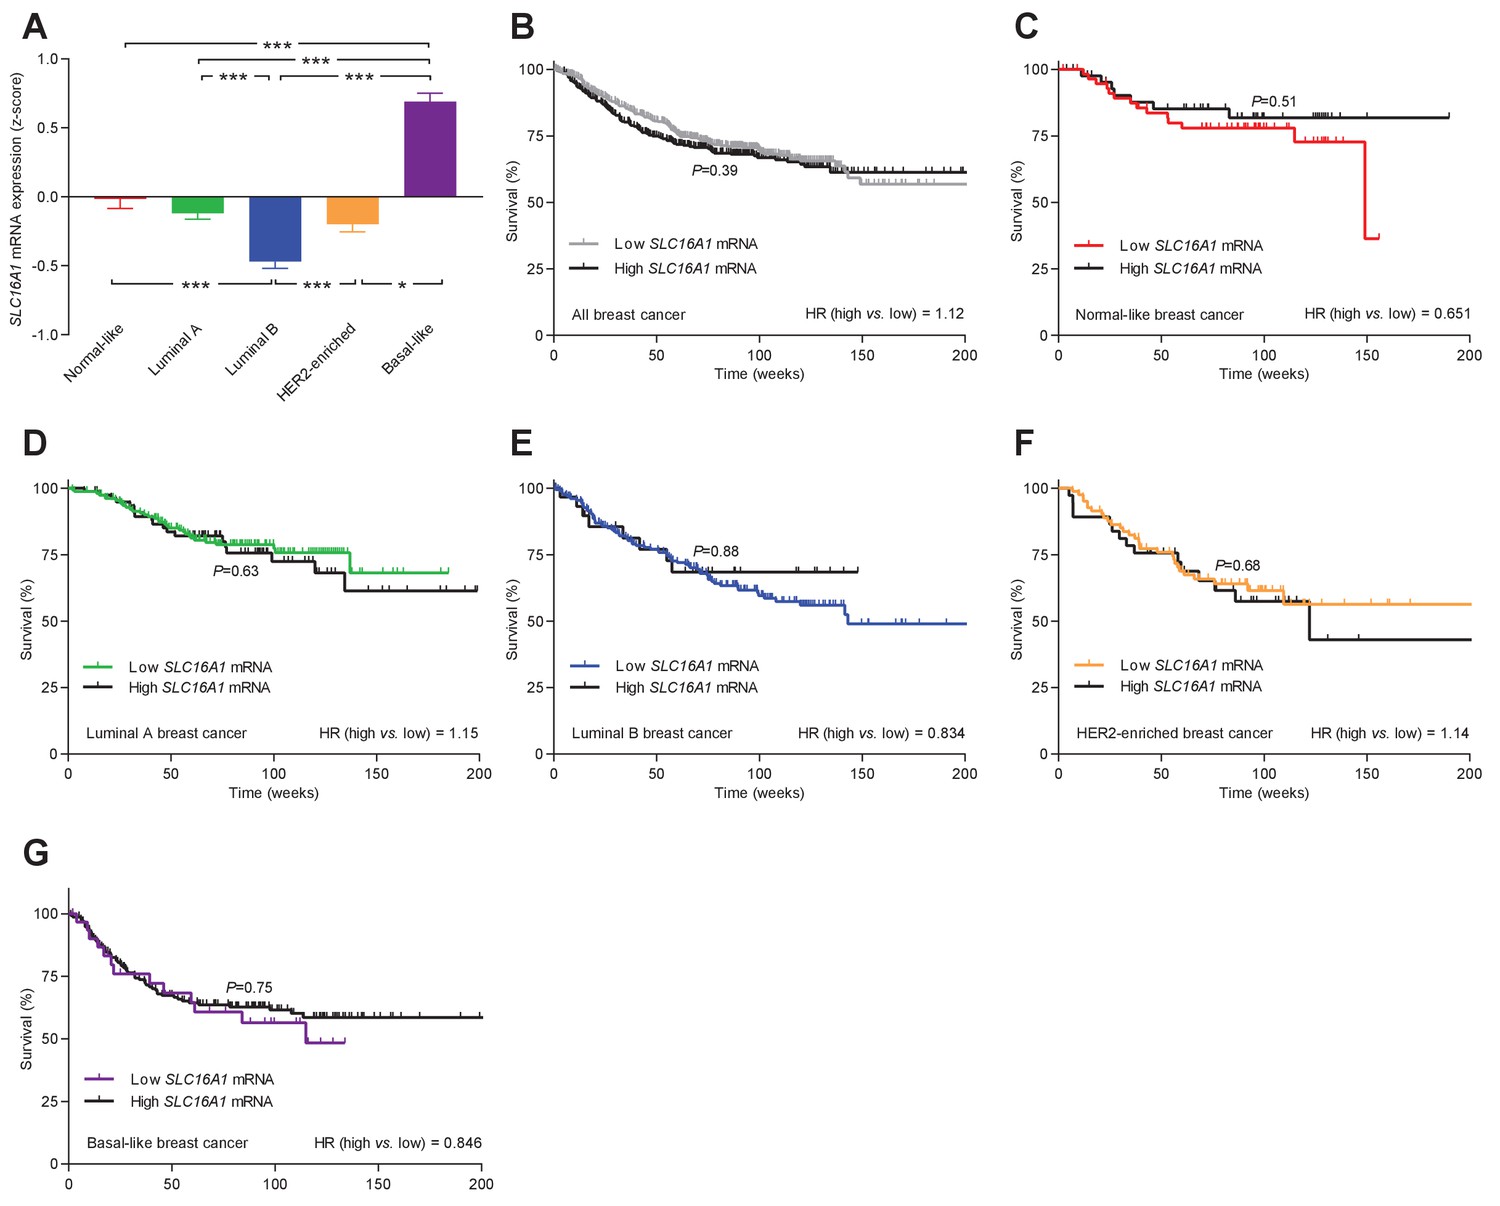
The levels of SLC16A1 mRNA, encoding MCT1, vary among breast cancer subtypes but are not associated with significant changes in patient survival.
(A) Variation in SLC16A1 mRNA levels among patients with different breast cancer subtypes (n=162–438). Expression data were compared by one-way ANOVA followed by Tukey’s post-test. Figure 10—figure supplement 1—source data 1 provides results from correlation analyses between SLC16A1 mRNA expression and the mRNA levels for ESR1, PGR, ERBB2, SLC4A7, SLC9A1, and SLC16A3 . (B–G) Survival curves stratified by SLC16A1 mRNA levels in patients with different breast cancer subtypes. The ticks on the curves represent censored subjects. Survival data were compared by Mantel-Cox and Gehan-Breslow-Wilcoxon tests. HR, hazard ratio. *p<0.05, ***p<0.001.
-
Figure 10—figure supplement 1—source data 1
The mRNA expression for SLC16A1 correlates with that of ESR1, PGR, and ERBB2.
When adjusted for expression of ESR1, PGR, and ERBB2, the mRNA expression of SLC16A1 does not correlate with that of SLC4A7, SLC9A1, and SLC16A3 (n=409–1457).
- https://cdn.elifesciences.org/articles/68447/elife-68447-fig10-figsupp1-data1-v2.docx
Figure 10—figure supplement 2
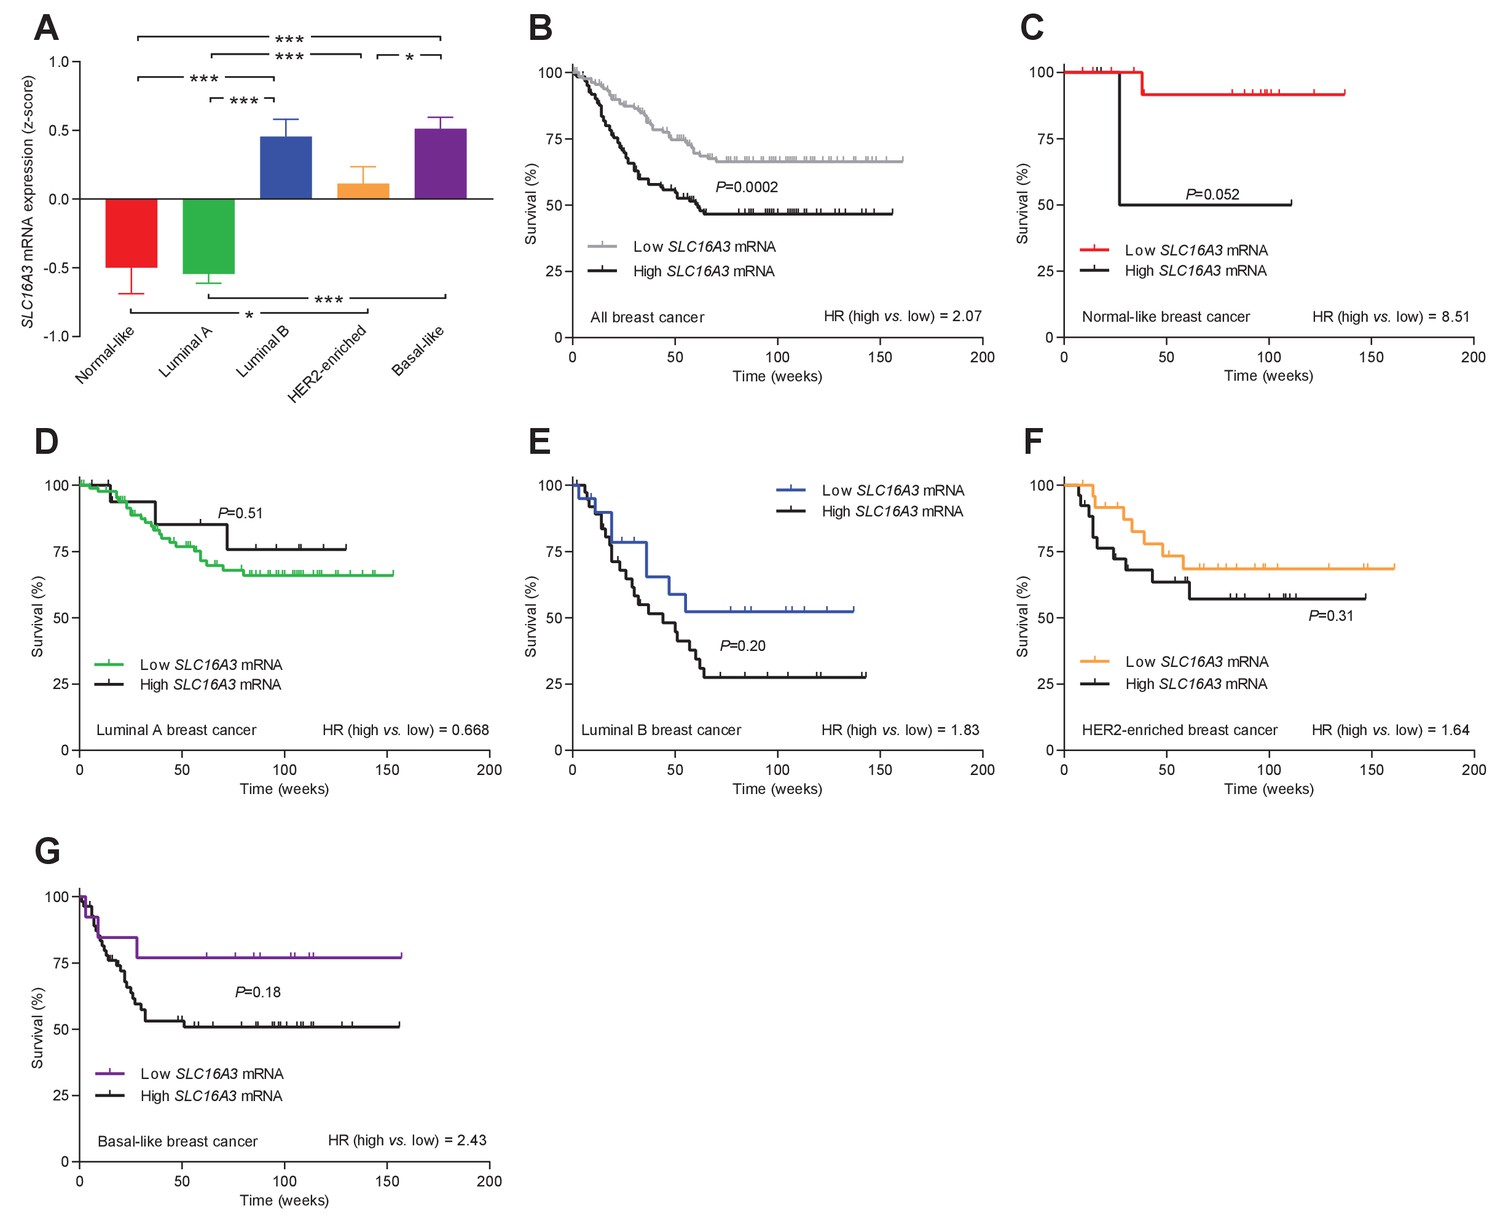
The levels of SLC16A3 mRNA, encoding MCT4, vary among breast cancer subtypes, and high SLC16A3 expression is associated with poor survival except in luminal A breast cancer.
(A) Variation in SLC16A3 mRNA levels among patients with different breast cancer subtypes (24–141). Expression data were compared by one-way ANOVA followed by Tukey’s post-test. Figure 10—figure supplement 2—source data 1 provides results from correlation analyses between SLC16A3 mRNA expression and the mRNA levels for ESR1, PGR, ERBB2, SLC4A7, SLC9A1, and SLC16A1. (B–G) Association of SLC16A3 mRNA expression level with survival in patients with different breast cancer subtypes. The ticks on the curves represent censored subjects. Survival data were compared by Mantel-Cox and Gehan-Breslow-Wilcoxon tests. HR, hazard ratio. *p<0.05, ***p<0.001.
-
Figure 10—figure supplement 2—source data 1
The mRNA expression for SLC16A3 correlates with that of ESR1, PGR, and ERBB2.
When adjusted for expression of ESR1, PGR, and ERBB2, the mRNA expression of SLC16A3 does not correlate with that of SLC4A7, SLC9A1, and SLC16A1 (n=409).
- https://cdn.elifesciences.org/articles/68447/elife-68447-fig10-figsupp2-data1-v2.docx
Figure 11
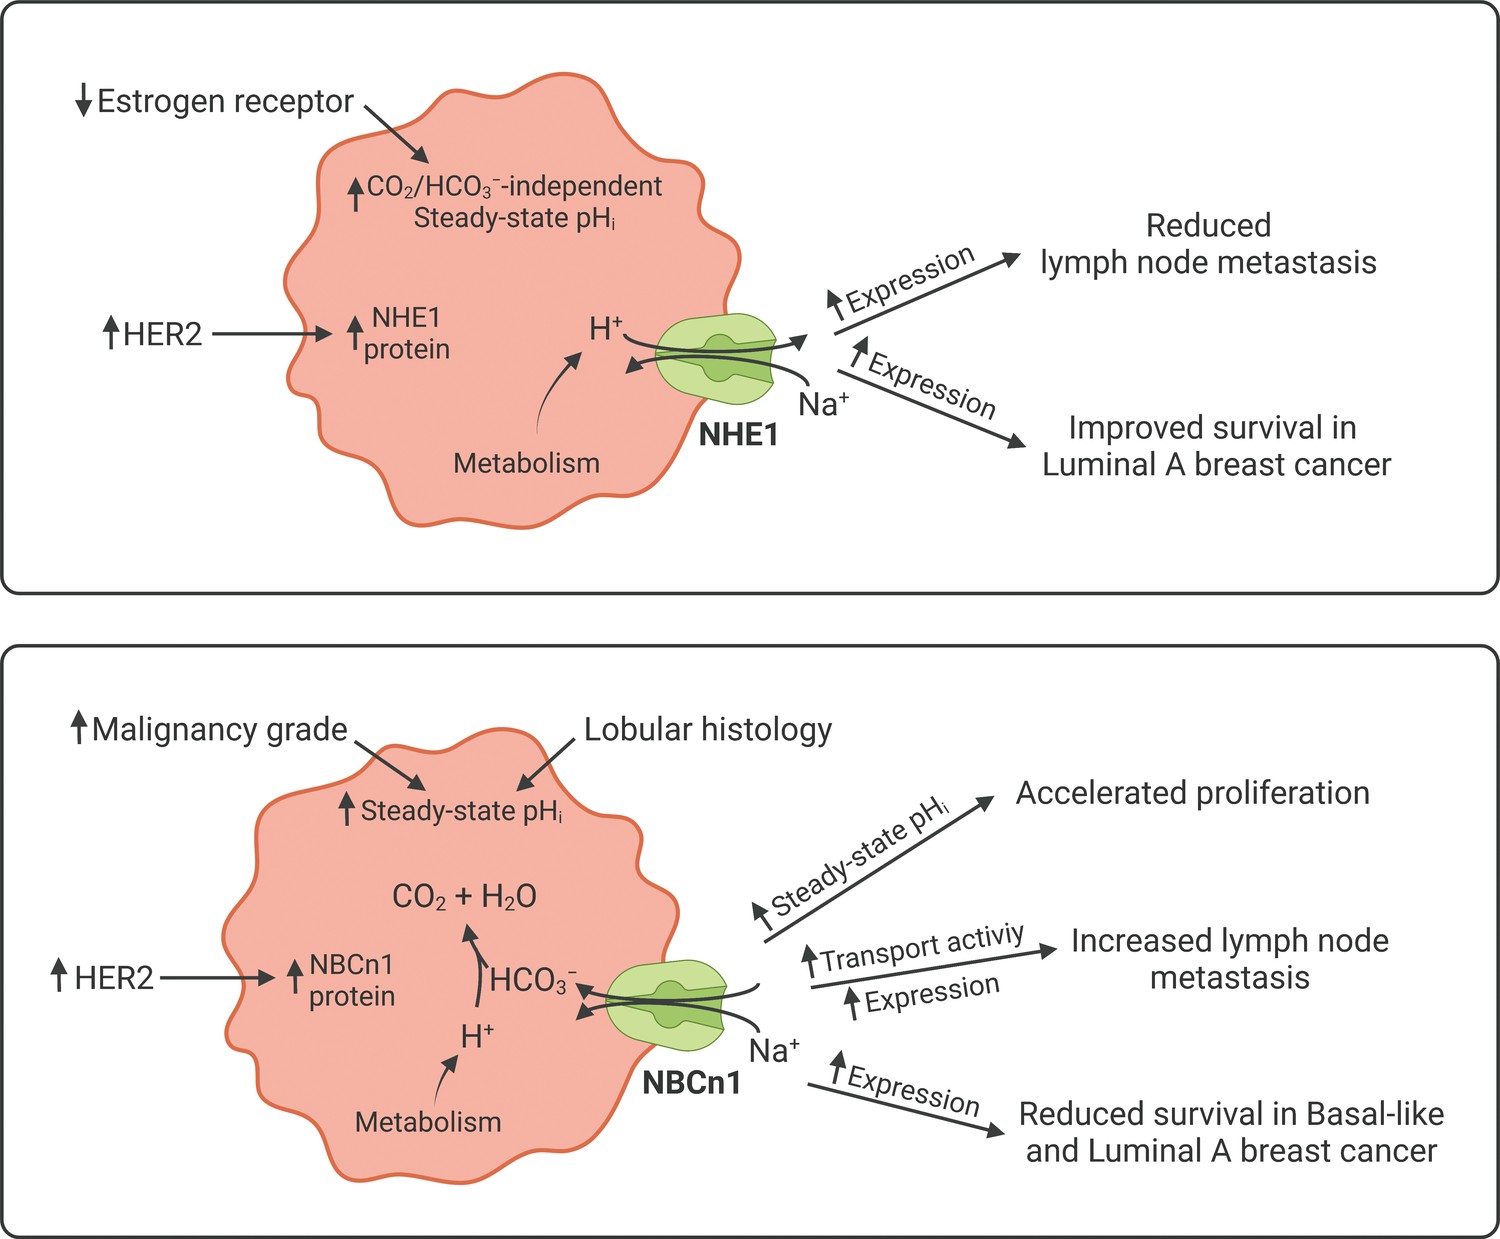
Schematics summarizing identified interactions and associated functional implications of NHE1 (upper panel) and NBCn1 (lower panel) in human breast cancer.
The image was generated with BioRender.com.
Tables
Table 1
Clinical and pathological characteristics of the patient cohort investigated for intracellular pH (pHi) dynamics and protein expression.
| Number of patients | 110 |
| Patient age (years; median, interquartile range) | 64.5 (56–74) |
| Tumor size (mm; median, interquartile range) | 18 (14–26) |
| Histological type | |
| Invasive ductal carcinomas | 92 (84%) |
| Invasive lobular carcinomas | 92 (84%) |
| Mucinous adenocarcinomas | 5 (5%) |
| Tubular carcinoma | 2 (2%) |
| Pleomorphic lobular carcinoma | 1 (1%) |
| HER2 receptor status | |
| Normal | 95 (86%) |
| Overexpression or gene amplification | 15 (14%) |
| Estrogen receptor status | |
| 90–100% ER+ cells | 99 (90%) |
| 0–15% ER+ cells | 11 (10%) |
| Malignancy grade | |
| I | 31 (28%) |
| II | 52 (47%) |
| III | 22 (20%) |
| Not graded | 5 (5%) |
| Axillary lymph node status | |
| Negative | 69 (63%) |
| Isolated tumor cells | 15 (14%) |
| Micro-metastases | 5 (5%) |
| Macro-metastases | 21 (19%) |
| Ki67 index | |
| 0–30% Ki67+ cells | 82 (75%) |
| 35–90% Ki67+ cells | 28 (25%) |
Key resources table
| Reagent type (species) or resource | Designation | Source or reference | Identifiers | Additional information |
|---|---|---|---|---|
| Gene (Homo sapiens) | SLC4A7 | GenBank | Gene ID: 9497 | Encodes NBCn1 |
| Gene (Homo sapiens) | SLC9A1 | GenBank | Gene ID: 6548 | Encodes NHE1 |
| Gene (Homo sapiens) | SLC16A1 | GenBank | Gene ID: 6566 | Encodes MCT1 |
| Gene (Homo sapiens) | SLC16A3 | GenBank | Gene ID: 9123 | Encodes MCT4 |
| Biological sample (Homo sapiens) | Surgical breast biopsies | Regionshospitalet Randers, Denmark | This study cohort | Cancer and matched normal tissue |
| Chemical compound, drug | Collagenase type 3 | Worthington Biochemical Corporation | Cat. #: LS004182 | 450 IU/mL |
| Chemical compound, drug | BCECF-AM | Thermo Fisher Scientific | Cat. #: B1170 | 3 µM |
| Antibody | Anti-NBCn1 (Rabbit polyclonal) | Jeppe Praetorius, Aarhus University, Denmark Damkier et al., 2006 | Reference | IHC (1:100) |
| Antibody | Anti-NHE1 (Mouse monoclonal) | Santa Cruz Biotechnology | Cat. #: sc-136239; RRID:AB_2191254 | IHC (1:100) |
| Commercial assay, kit | OptiView DAB IHC detection kit | Roche Diagnostics | RRID:AB_2833075 | Goat anti-rabbit and anti-mouse |
| Software, algorithm | SPSS | IBM | RRID:SCR_002865 | |
| Software, algorithm | Prism | GraphPad | RRID:SCR_002798 | Version 9.1.1 |
Additional files
Download links
A two-part list of links to download the article, or parts of the article, in various formats.
Downloads (link to download the article as PDF)
Open citations (links to open the citations from this article in various online reference manager services)
Cite this article (links to download the citations from this article in formats compatible with various reference manager tools)
Acid-base transporters and pH dynamics in human breast carcinomas predict proliferative activity, metastasis, and survival
eLife 10:e68447.
https://doi.org/10.7554/eLife.68447


