Multiscale analysis of single and double maternal-zygotic Myh9 and Myh10 mutants during mouse preimplantation development
- Institut Curie, PSL Research University, Sorbonne Université, France
- Carl Zeiss SAS, France
Figures
Figure 1 with 1 supplement
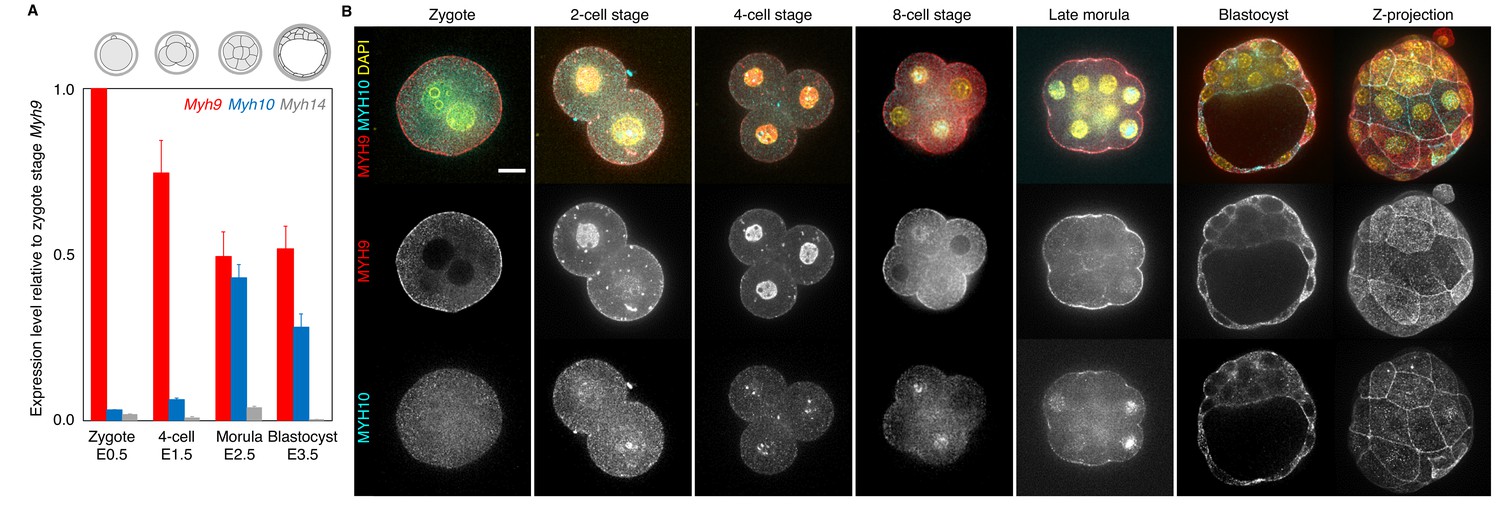
Expression of non-muscle myosin II heavy chain (NMHC) paralogs during preimplantation development.
(A) RT-qPCR of Myh9 (red), Myh10 (blue), and Myh14 (grey) at the zygote (E0.5, n = 234), four-cell (E1.5, n = 159), morula (E2.5, n = 189), and blastocyst (E3.5, n = 152) stages from six independent experiments. Gene expression is normalized to Gapdh and shown as the mean ± SEM fold change relative to Myh9 at the zygote stage. (B) Representative images of immunostaining of NMHC paralogs MYH9 (red) and MYH10 (cyan) throughout preimplantation development. DAPI in yellow. Scale bar, 20 µm.
Figure 1—figure supplement 1
Analysis of the expression of non-muscle myosin II heavy chain (NMHC) paralogs during preimplantation development based on single cell RNA sequencing and MYH9-GFP fluorescence.
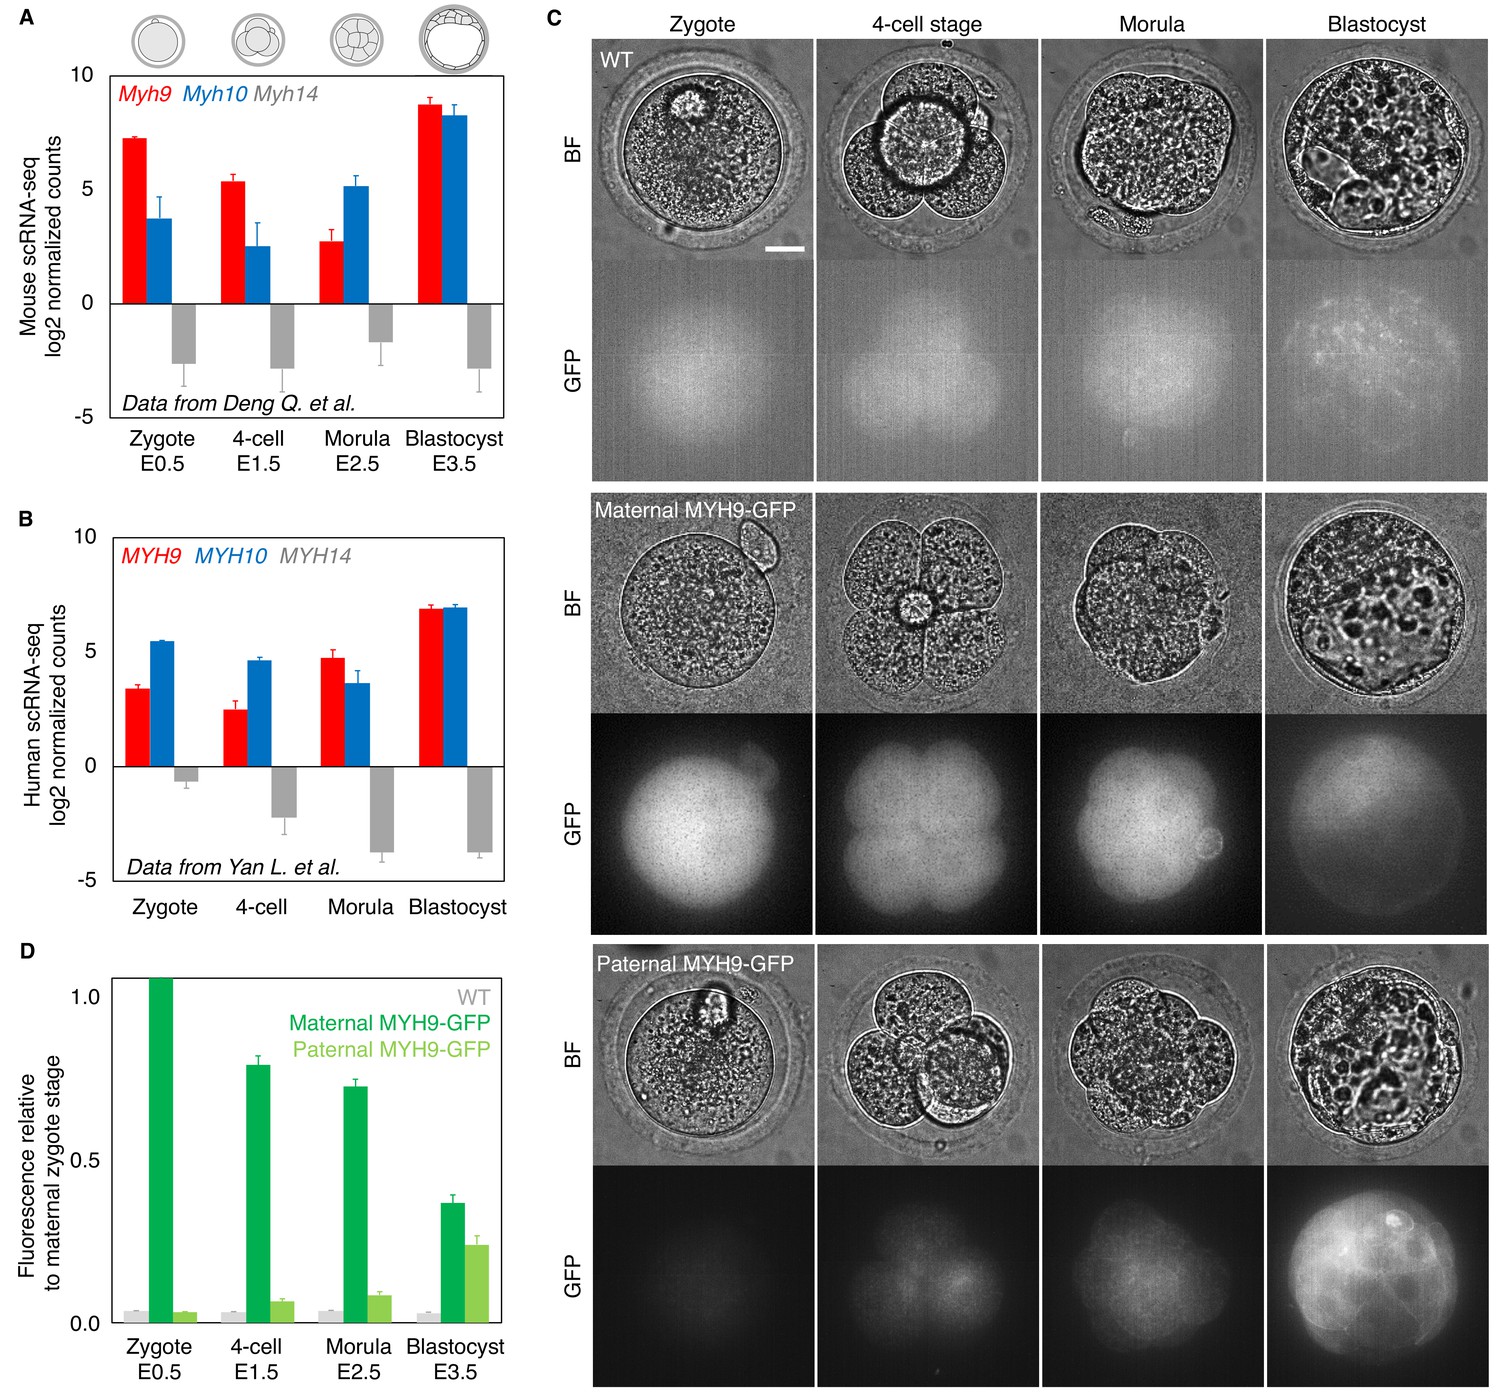
(A) Mouse single cell RNA sequencing analysis adapted from Deng et al., 2014, showing the expression levels of Myh9 (red), Myh10 (blue), and Myh14 (grey) at the zygote, four-cell, morula, and blastocyst stages. Data show mean ± SEM. (B) Human single cell RNA sequencing analysis adapted from Yan et al., 2013, showing the expression levels of MYH9 (red), MYH10 (blue), and MYH14 (grey) at the zygote, four-cell, morula, and blastocyst stages. Data show mean ± SEM. (C) Representative images of WT (top) and transgenic embryos expressing a GFP-tagged version of MYH9 from their maternal (middle) or paternal (bottom) allele at the zygote, four-cell, morula, and blastocyst stages. LUT is adjusted to the brightest signal of each respective genotype. (D) MYH9-GFP fluorescent level normalized to maternal MYH9-GFP at the zygote stage. Data originate from three independent experiments for the WT (grey) from zygote to blastocyst stage (n = 6), maternal MYH9-GFP (dark green) zygote stage (n = 23), maternal MYH9-GFP from 4-cell stage to blastocyst stage (n = 24), and paternal MYH9-GFP (light green) from zygote to blastocyst stage (n = 22). Data show mean ± SEM. Scale bars, 20 µm.
Figure 2 with 6 supplements
Multiscale analysis of morphogenesis in single maternal-zygotic Myh9 or Myh10 mutant embryos.
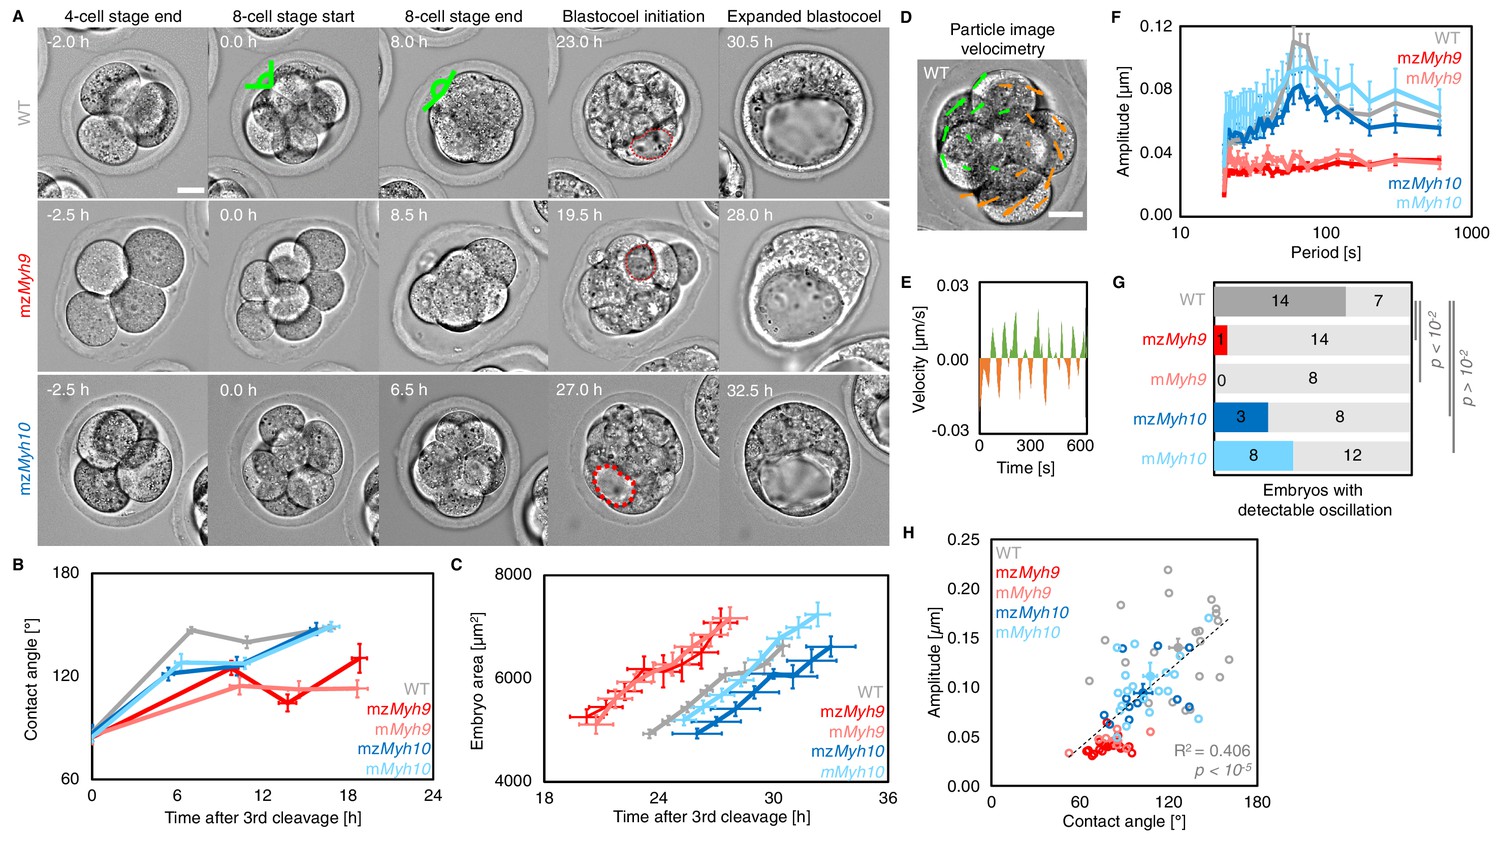
(A) Representative images of long-term time-lapse of WT, mzMyh9, and mzMyh10 embryos at the end of the 4-cell stage, start and end of the 8-cell stage, at the initiation of blastocoel formation and early blastocyst stage (see also Figure 2—video 1). Scale bar, 20 µm. Time in hours after the third cleavage. Green lines mark the contact angles increasing during compaction. Dotted red lines indicate the nascent lumen. (B) Contact angle of WT (grey, n = 23, 23, 21, 22), mzMyh9 (red, n = 15, 15, 10, 8), mMyh9 (light red, n = 8, 8, 8, 3), mzMyh10 (blue, n = 11, 11, 11, 11), and mMyh10 (light blue, n = 20, 20, 20, 20) embryos after the third cleavage, before and after the fourth cleavage and before the fifth cleavage. Data show mean ± SEM. Statistical analyses are provided in Appendix 1—table 1–2. (C) Embryo growth during lumen formation of WT (grey, n = 20), mzMyh9 (red, n = 9), mMyh9 (light red, n = 7), mzMyh10 (blue, n = 7), and mMyh10 (light blue, n = 13) embryos measured for seven continuous hours after a lumen of at least 20 µm in diameter is observed. Data show mean ± SEM. (D) Representative image of a short-term time-lapse overlaid with a subset of velocity vectors from Particle Image Velocimetry (PIV) analysis. Green for positive and orange for negative Y-directed movement. (E) Velocity over time for a representative velocity vector of embryo shown in D and Figure 2—video 2. (F) Power spectrum resulting from Fourier transform of PIV analysis of WT (grey, n = 21), mzMyh9 (red, n = 17), mMyh9 (light red, n = 8), mzMyh10 (blue, n = 11), and mMyh10 (light blue, n = 20) embryos. Data show mean ± SEM. (G) Proportion of WT (grey, n = 21), mzMyh9 (red, n = 17), mMyh9 (light red, n = 8), mzMyh10 (blue, n = 11), and mMyh10 (light blue, n = 20) embryos showing detectable oscillations in their power spectrum (see 'Materials and methods'). Chi2 p value comparing to WT is indicated. (H) Amplitude of oscillation as a function of the mean contact angle for WT (grey, n = 21), mzMyh9 (red, n = 17), mMyh9 (light red, n = 8), mzMyh10 (blue, n = 11), and mMyh10 (light blue, n = 20) embryos. Open circles show individual embryos and filled circles give mean ± SEM of a given genotype. Pearson’s R2 and p value are indicated. Statistical analyses are provided in Appendix 1—table 3.
Figure 2—figure supplement 1
Macroscopic shape analysis of maternal-zygotic Myh9 and Myh10 mutant embryos.
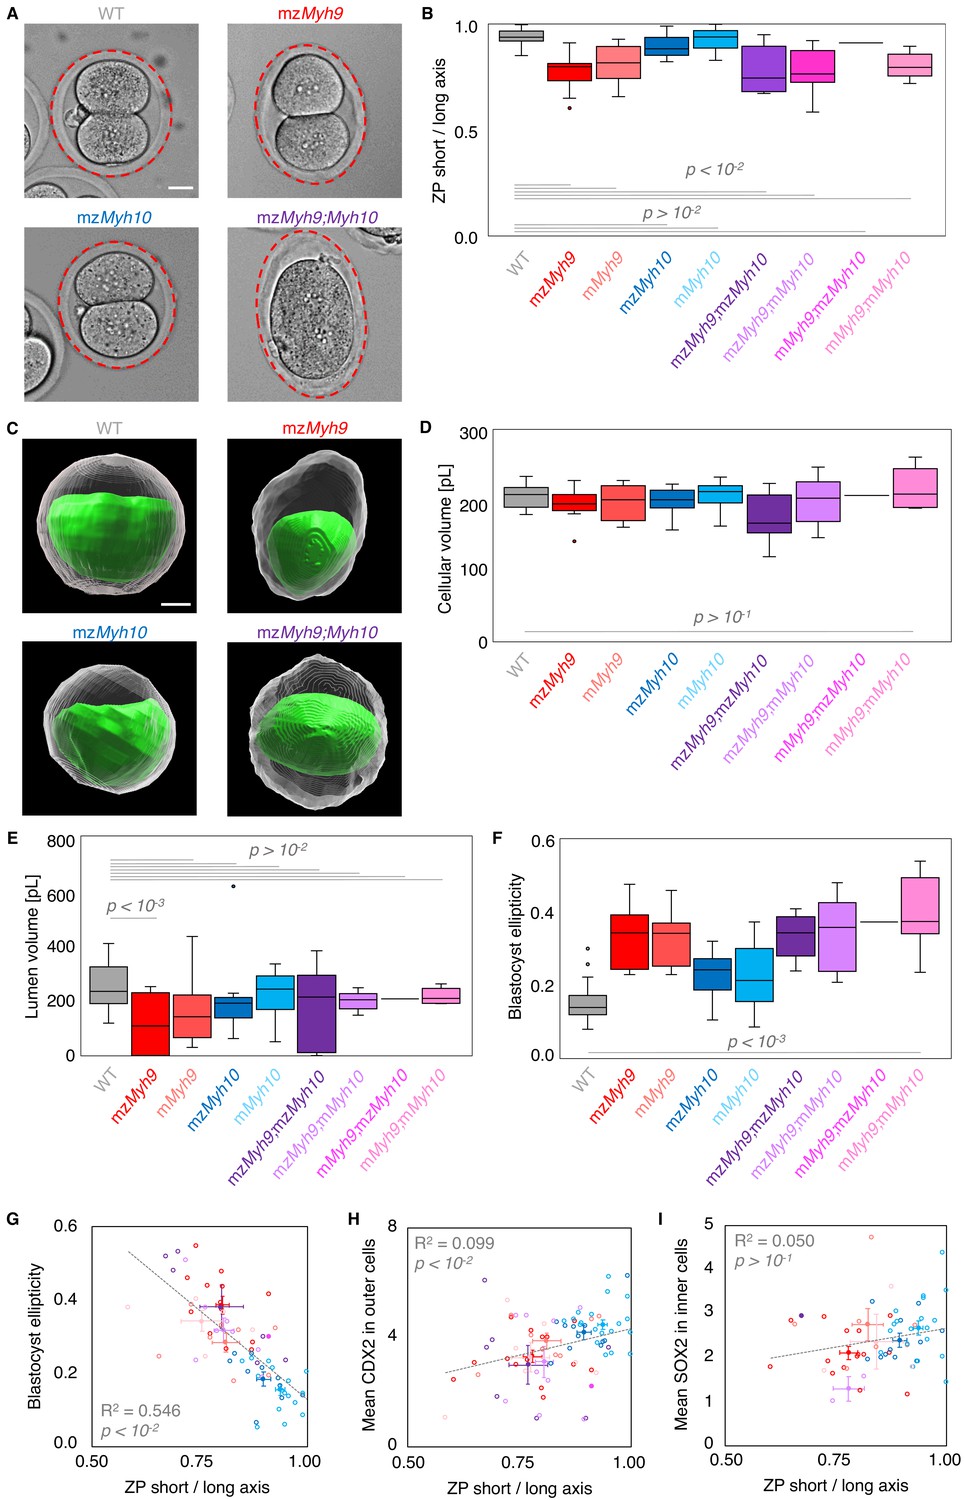
(A) Representative images of E1.5 WT, mzMyh9, mzMyh10, and mzMyh9;mzMyh10 embryos. The zona pellucida is highlighted with a red ellipse. (B) Boxplot of the short/long axis ratio of an ellipse manually fitted onto the zona pellucida of E1.5 embryos that are WT (grey, n = 23), mzMyh9 (red, n = 15), mMyh9 (light red, n = 8), mzMyh10 (blue, n = 11), mMyh10 (light blue, n = 19), mzMyh9;mzMyh10 (purple, n = 8), mzMyh9;mMyh10 (lilac, n = 9), mMyh9;mzMyh10 (pink, n = 1), and mMyh9;mMyh10 (bubblegum, n = 7) mutants. (C) Representative images of segmented WT, mzMyh9, mzMyh10, and mzMyh9;mzMyh10 blastocysts. The segmented lumen is shown in green. The cellular volume, shown in grey, results from subtracting the lumen volume from the segmented embryo volume. (D-F) Cellular (D) and lumen (E) volumes, and 3D oblate ellipticity (F) of segmented WT (grey, n = 23), mzMyh9 (red, n = 13), mMyh9 (light red, n = 8), mzMyh10 (blue, n = 10), mMyh10 (light blue, n = 16), mzMyh9;mzMyh10 (purple, n = 6), mzMyh9;mMyh10 (lilac, n = 8), mMyh9;mzMyh10 (pink, n = 1), and mMyh9;mMyh10 (bubblegum, n = 5) mutants. (G-I) Blastocyst ellipticity (G), CDX2 N/C ratio in outer cells (H), or SOX2 N/C ratio in inner cells (I) as a function of the ZP short/long axis at the 2-cell stage. mzMyh9 (red, n = 13/15/15), mMyh9 (light red, n = 8/8/7), mzMyh10 (blue, n = 10/11/11), mMyh10 (light blue, n = 16/19/19), mzMyh9;mzMyh10 (purple, n = 6/7/1), mzMyh9;mMyh10 (lilac, n = 8/9/2), mMyh9;mzMyh10 (pink, n = 1/1/0), and mMyh9;mMyh10 (bubblegum, n = 5/7/3) mutants. Open circles show individual embryos and filled circles give mean ± SEM of a given genotype. Pearson’s R2 and p value are indicated. Scale bars, 20 µm. Welch’s t test p values compared to WT are shown.
Figure 2—figure supplement 2
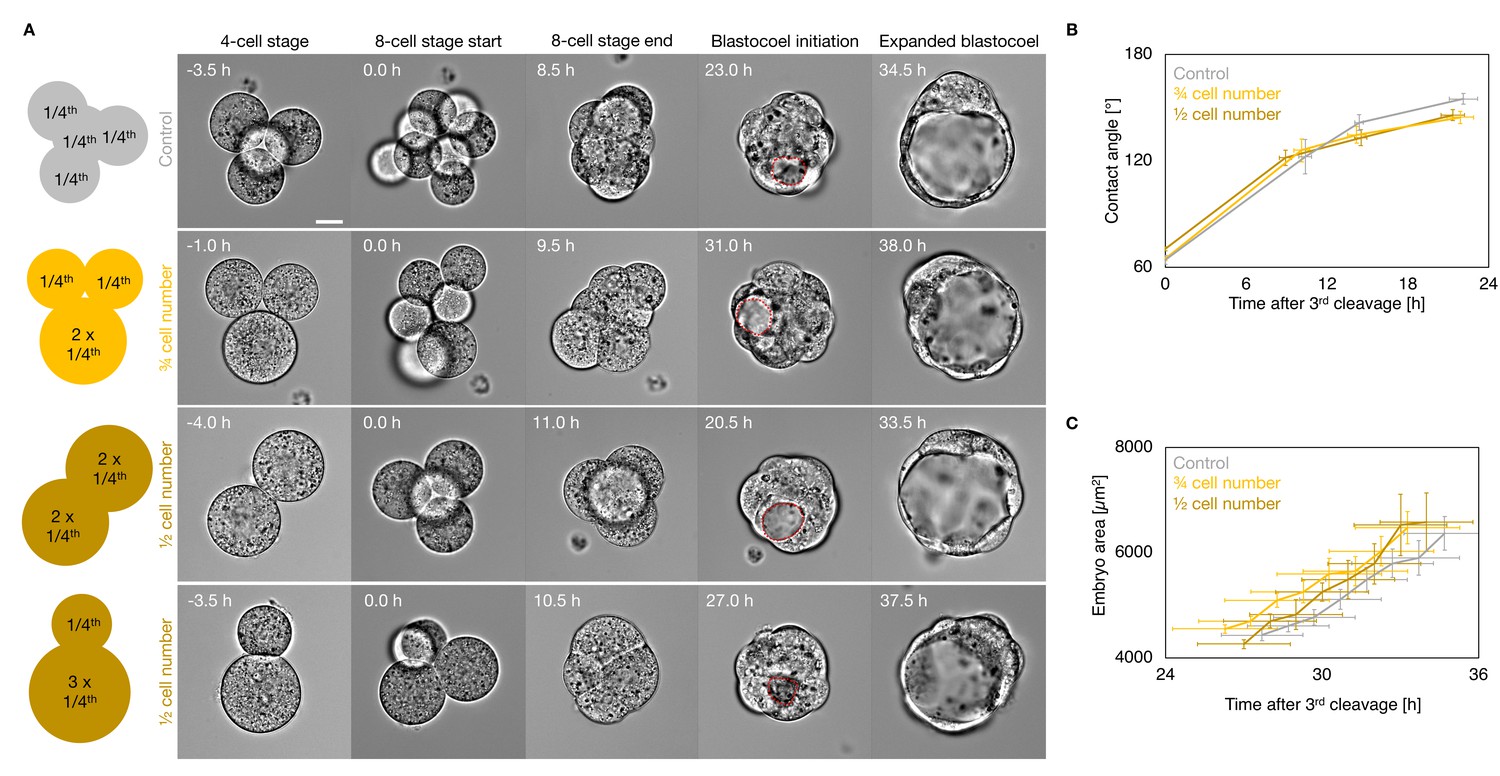
Morphogenesis of embryos with blastomeres fused at the 4-cell stage.
(A) Schematic diagram of 4-cell stage embryos with four cells (control) or after fusion with three cells, two cells of equal or unequal sizes. Representative images of long-term time-lapse of embryos withfour cells (control), or after fusion with three cells, two cells of equal or unequal sizes at the end of the 4-cell stage, start and end of the 8-cell stage, at the initiation of blastocoel formation, and early blastocyst stage (Figure 2—video 4). Scale bar, 20 µm. Time in hours after the third cleavage. Dotted red lines indicate the nascent lumen. (B) Contact angle of control (grey, n = 12, 12, 12, 12), ¾ cell number (yellow, n = 12, 12, 12, 9), and ½ cell number (brown, n = 4, 4, 4, 4) embryos after the third cleavage, before and after the fourth cleavage, and before the fifth cleavage. Data show mean ± SEM. (C) Embryo growth during lumen formation for control (grey, n = 10), ¾ cell number (yellow, n = 11), and ½ cell number (brown, n = 4) embryos measured for seven continuous hours after a lumen of at least 20 µm is observed (as in blastocoel initiation of panel A). Data show mean ± SEM.
Figure 2—video 1
Preimplantation development of WT, mzMyh9, and mzMyh10 embryos.
Long-term time-lapse imaging of WT (left), mzMyh9 (middle), and mzMyh10 (right) embryos from the 4-cell stage onwards. Images are taken every 30 min; scale bar is 20 µm. Time is given in hours following the last division from the third wave of cleavages.
Figure 2—video 2
Periodic waves of contraction in WT, mzMyh9, mzMyh10, and mzMyh9;mzMyh10 embryos.
Short-term time-lapse imaging of WT (top left), mzMyh9 (top right), mzMyh10 (bottom left), and mzMyh9;mzMyh10 (bottom right) embryos. Images are taken every 5 s; scale bar is 20 µm.
Figure 2—video 3
Failed cleavage in mzMyh9 embryos.
Long-term time-lapse imaging of an mzMyh9 embryo during the third cleavage wave. Images are taken every 30 min; scale bar is 20 µm.
Figure 2—video 4
Preimplantation development of control, ¾, and ½ cell number embryos.
Long-term time-lapse imaging of control (top left), ¾ cell number (top right), and ½ cell number (after the fusion events of two pairs of blastomeres on bottom left or after the fusion of three blastomeres on bottom right) embryos from the 4-cell stage onwards. Images are taken every 30 min; scale bar is 20 µm. Time is given in hours following the last division from the third wave of cleavages.
Figure 3 with 2 supplements
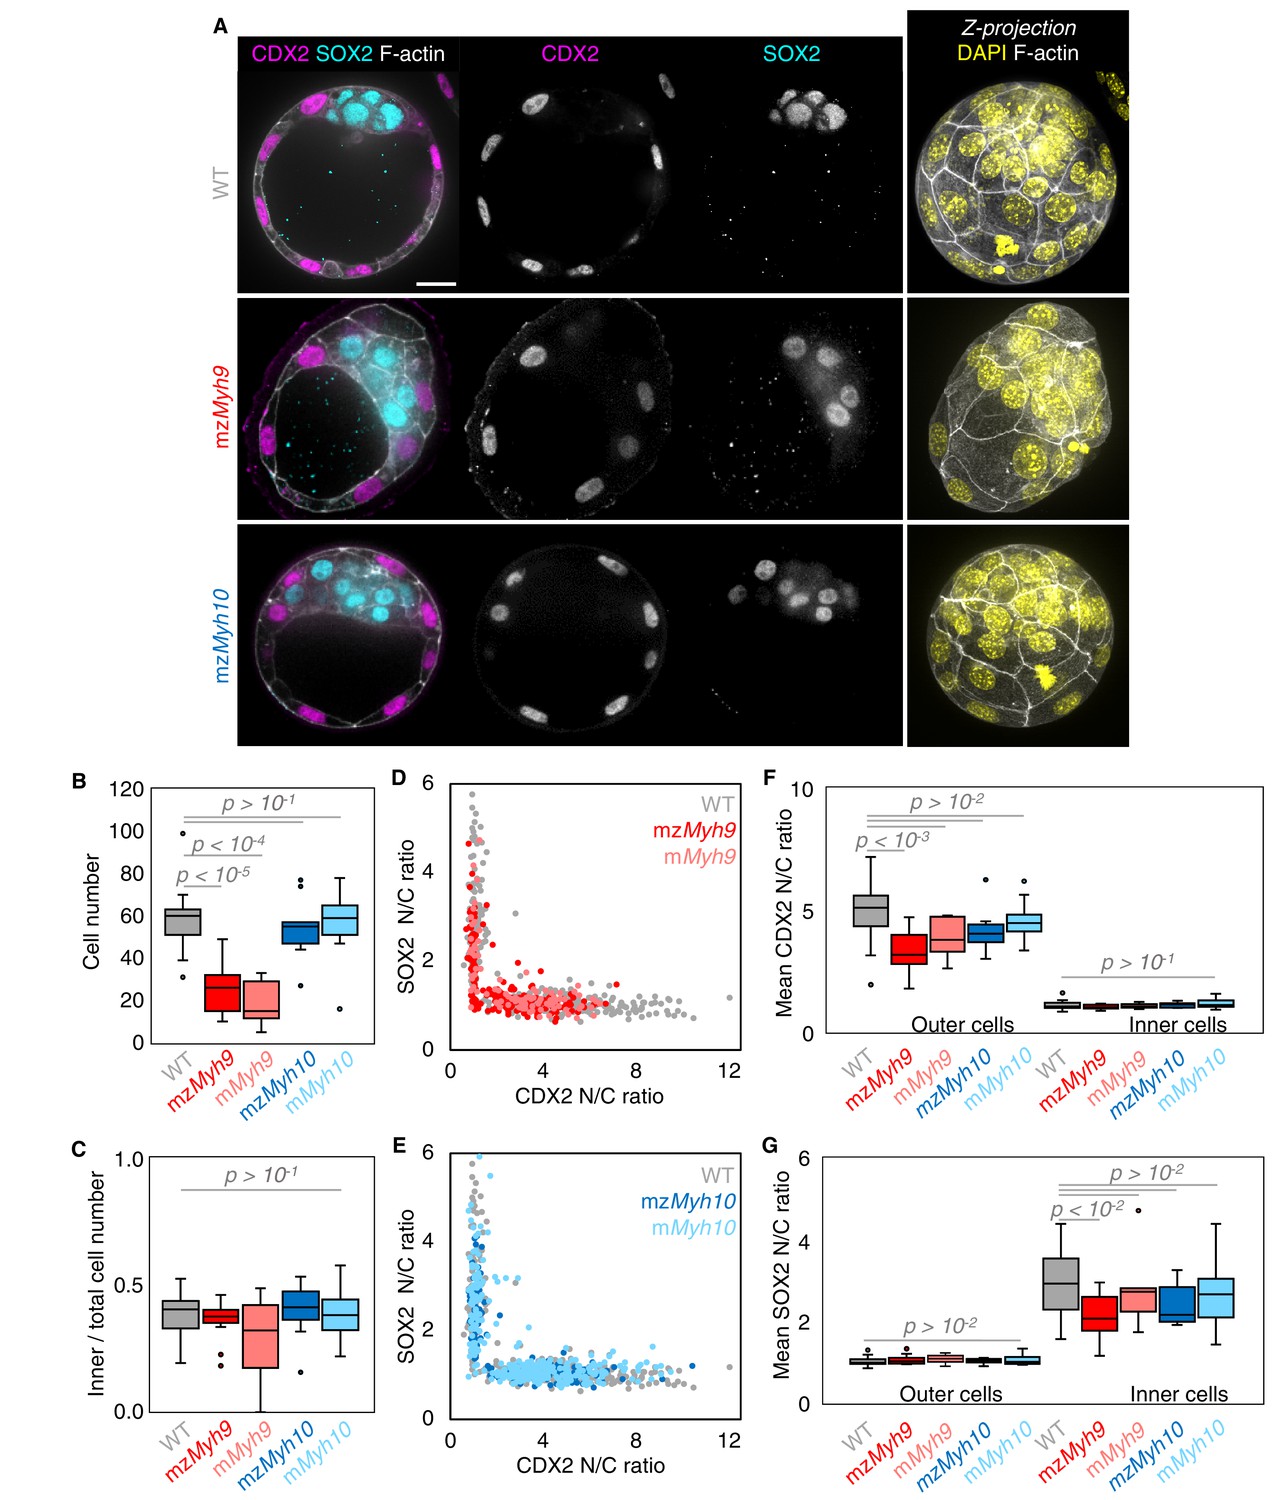
Analysis of TE and ICM lineages in single maternal-zygotic Myh9 or Myh10 mutant embryos.
(A) Representative images of WT, mzMyh9, and mzMyh10 embryos stained for TE and ICM markers CDX2 (magenta) and SOX2 (cyan), DAPI (yellow), and F-actin (grey). The same mutant embryos as in Figure 2A are shown. Scale bar, 20 µm. (B-C) Total cell number (B) and proportion of inner cells (C) in WT (grey, n = 23), mzMyh9 (red, n = 15), mMyh9 (light red, n = 8), mzMyh10 (blue, n = 11), and mMyh10 (light blue, n = 19) embryos. (D-E) Nuclear to cytoplasmic (N/C) ratio of CDX2 and SOX2 staining for individual cells from WT (grey, n = 345), mzMyh9 (red, n = 204), mMyh9 (light red, n = 95), mzMyh10 (blue, n = 160), and mMyh10 (light blue, n = 300) embryos. (F-G) Average N/C ratio of CDX2 (F) and SOX2 (G) staining for outer (left) or inner (right) cells from WT (grey, n = 23), mzMyh9 (red, n = 15), mMyh9 (light red, n = 8), mzMyh10 (blue, n = 11), and mMyh10 (light blue, n = 19) embryos. Mann-Whitney U test p values compared to WT are indicated.
Figure 3—figure supplement 1
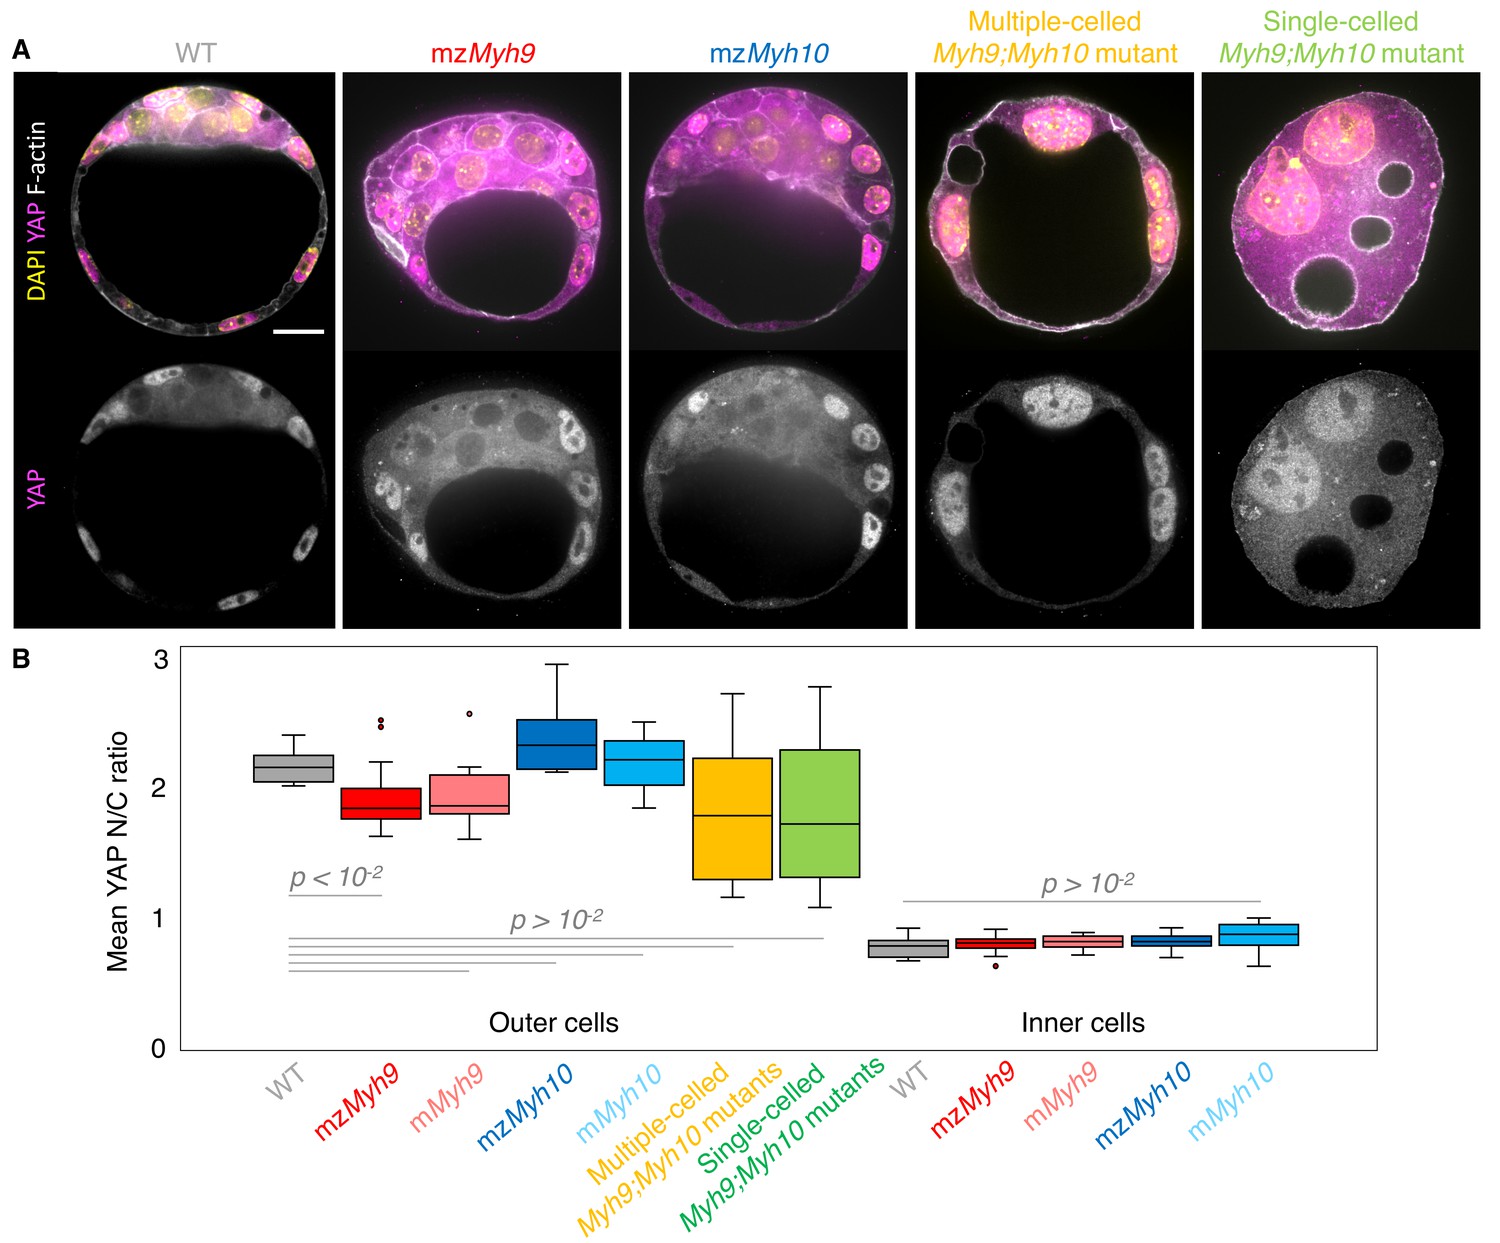
Analysis of YAP localization in maternal-zygotic Myh9 and Myh10 mutant embryos.
(A) Representative images of WT, mzMyh9, mzMyh10, and multiple- or single-celled Myh9;Myh10 mutant embryos stained for YAP (magenta), DAPI (yellow), and F-actin (grey). Scale bar, 20 µm. (B) Mean nuclear to cytoplasmic (N/C) ratio of YAP for outer and inner cells from WT (grey, n = 15), mzMyh9 (red, n = 19), mMyh9 (light red, n = 9), mzMyh10 (blue, n = 6), mMyh10 (light blue, n = 13) embryos and outer cells from multiple-celled Myh9;Myh10 (yellow, n = 10) and single-celled Myh9;Myh10 (green, n = 9) mutant embryos. Mann-Whitney U test p values compared to WT are indicated.
Figure 3—figure supplement 2
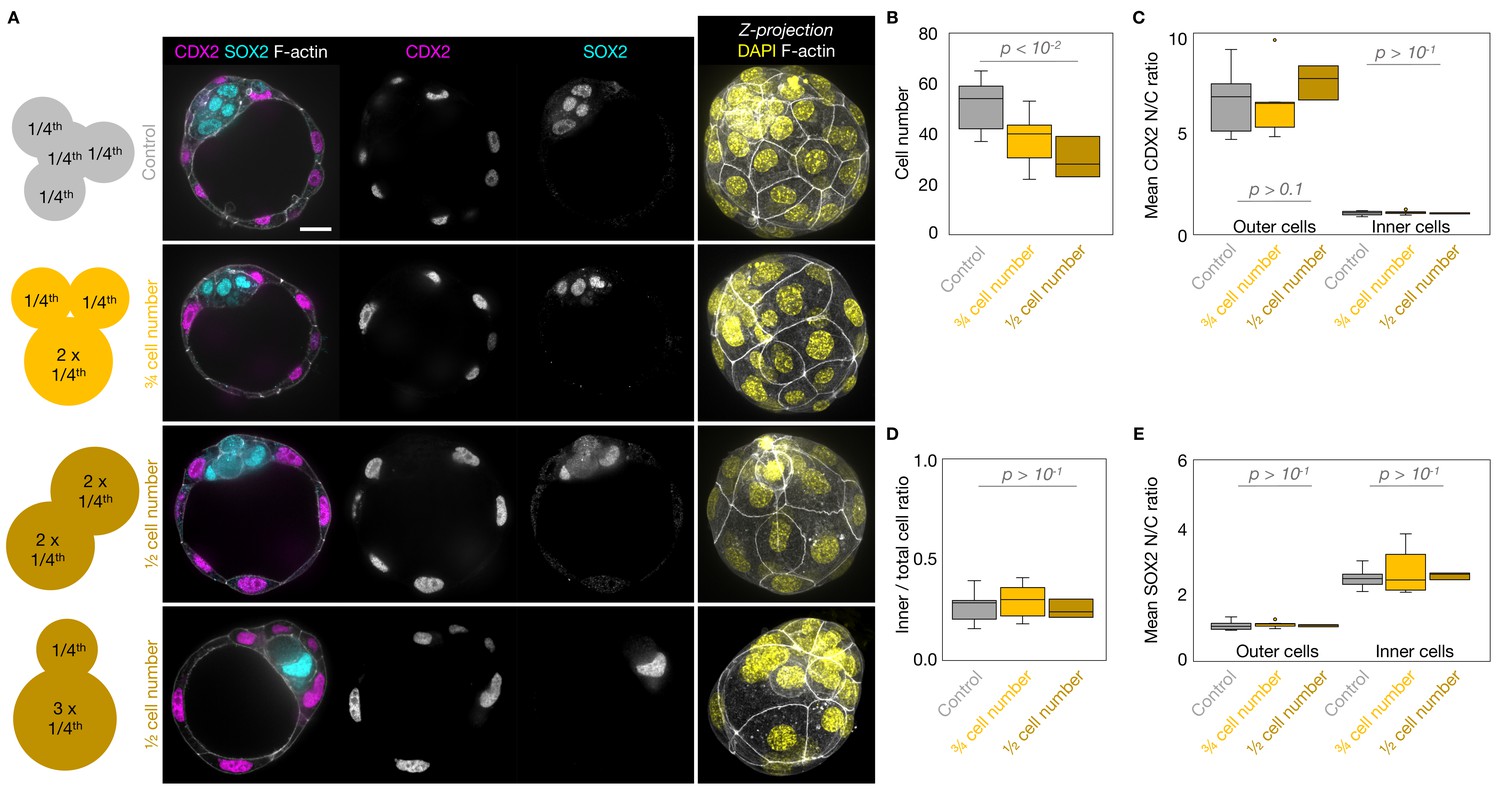
Lineage specification of embryos with blastomeres fused at the 4-cell stage.
(A) Schematic diagram of 4-cell stage embryos with four cells (control) or after fusion with three cells, two cells of equal or unequal sizes. Representative images of embryos with four cells (control), or after fusion with three cells, two cells of equal or unequal sizes stained for TE and ICM markers CDX2 (magenta) and SOX2 (cyan). DAPI in yellow and F-actin in grey. The same fused embryos as in Figure 2—figure supplement 2A are shown. (B-D) Total cell number (B) and proportion of inner cells (D) in control (grey, n = 11), ¾ cell number (yellow, n = 9), and ½ cell number (brown, n = 3) embryos. (C-E) N/C ratio of CDX2 (C) and SOX2 (E) staining for outer (left) or inner (right) cells from control (grey, n = 11), ¾ cell number (yellow, n = 9), and ½ cell number (brown, n = 3) embryos. Scale bars, 20 µm. Mann-Whitney U test p values compared to WT are indicated.
Figure 4
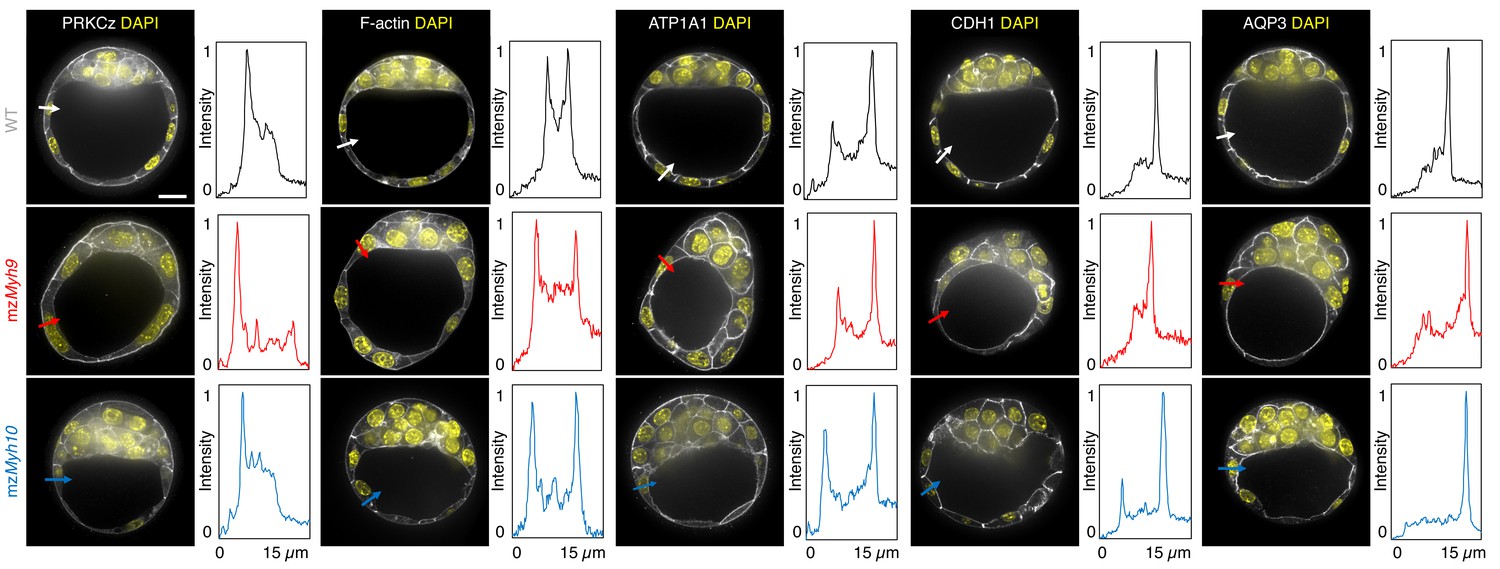
Apico-basal polarity of single maternal-zygotic Myh9 or Myh10 mutant embryos.
Representative images of WT, mzMyh9, and mzMyh10 embryos stained for apico-basal polarity markers. From left to right: PRKCz, F-actin, ATP1A1, CDH1, and AQP3 shown in grey. Nuclei stained with DAPI are shown in yellow. Intensity profiles of a representative 15 µm line drawn from the embryo surface towards the interior are shown next to each marker and genotype (arrows). Intensities are normalized to each minimal and maximal signals. Scale bar, 20 µm.
Figure 5 with 1 supplement
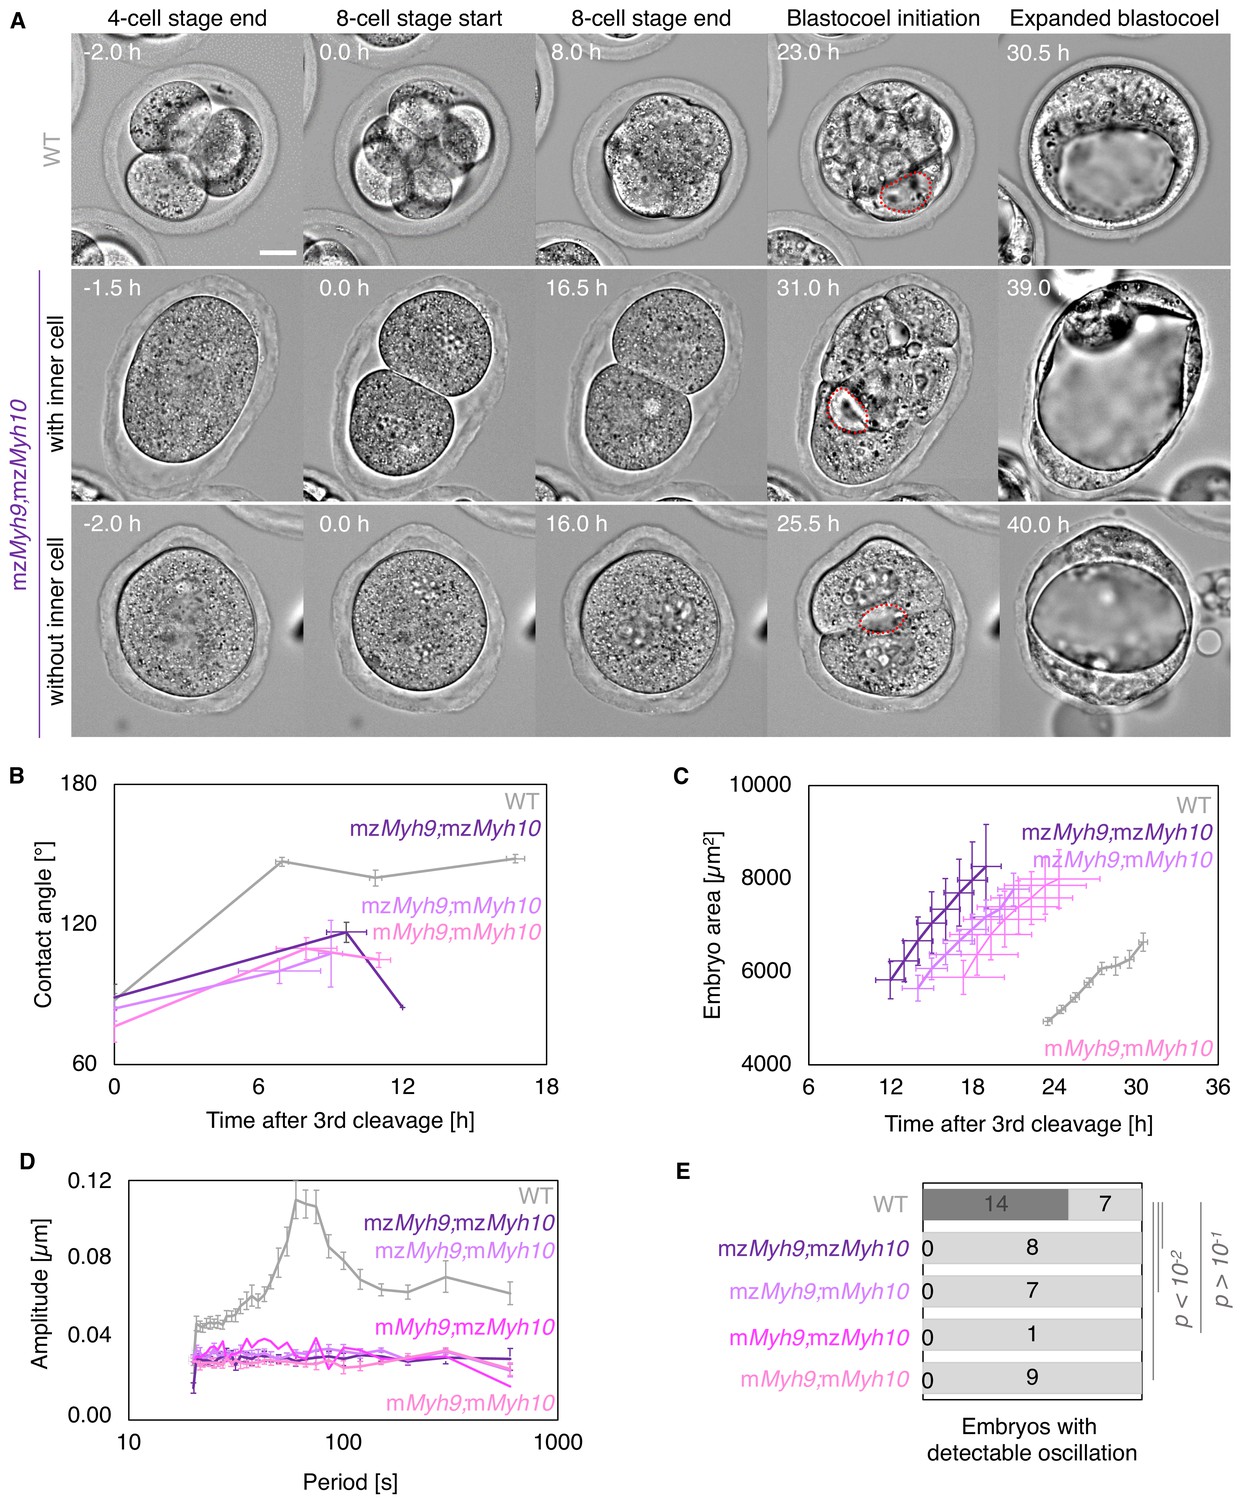
Multiscale analysis of morphogenesis in double maternal-zygotic Myh9 and Myh10 mutant embryos.
(A) Representative images of long-term time-lapse of WT and mzMyh9;mzMyh10 embryos at the end of the 4-cell stage, start and end of the 8-cell stage, at the initiation of blastocoel formation, and early blastocyst stage (Figure 5—video 1). The middle row shows an embryo that cleaved once at the time of the third cleavage and twice at the time of the fourth cleavage, which produces an embryo with one inner cell. The bottom row shows an embryo that cleaved once at the time of the fourth cleavage, which produces an embryo without inner cell. Scale bar, 20 µm. (B) Contact angle of WT (grey, n = 23, 23, 21, 22), mzMyh9;mzMyh10 (purple, n = 7, 3, 1), mzMyh9;mMyh10 (lilac, n = 7, 4, 2), and mMyh9;mMyh10 (bubblegum, n = 7, 5, 3) embryos after the third cleavage, before and after the fourth cleavage, and before the fifth cleavage, when available. Data show mean ± SEM. Statistical analyses are provided in Appendix 1—table 1–2. (C) Embryo growth during lumen formation for WT (grey, n = 20), mzMyh9;mzMyh10 (purple, n = 5), mzMyh9;mMyh10 (lilac, n = 6), and mMyh9;mMyh10 (bubblegum, n = 6) embryos measured for seven continuous hours after a lumen of at least 20 µm is observed. Data show mean ± SEM. (D) Power spectrum resulting from Fourier transform of PIV analysis of WT (grey, n = 21), mzMyh9;mzMyh10 (purple, n = 8), mzMyh9;mMyh10 (lilac, n = 7), mMyh9;mzMyh10 (pink, n = 1), and mMyh9;mMyh10 (bubblegum, n = 9) embryos. Data show mean ± SEM. (E) Proportion of WT (grey, n = 21), mzMyh9;mzMyh10 (purple, n = 8), mzMyh9;mMyh10 (lilac, n = 7), mMyh9;mzMyh10 (pink, n = 1), and mMyh9;mMyh10 (bubblegum, n = 9) embryos showing detectable oscillations in their power spectrum. Chi2 test p value compared to WT is indicated.
Figure 5—video 1
Preimplantation development of mzMyh9;mzMyh10 embryos.
Long-term time-lapse imaging of mzMyh9;mzMyh10 embryos forming an ICM (left), or without ICM (right) from the equivalent of the 2-cell stage onwards. Images are taken every 30 min; scale bar is 20 µm. Time is given in hours following the last tentative division from the third wave of cleavages.
Figure 6
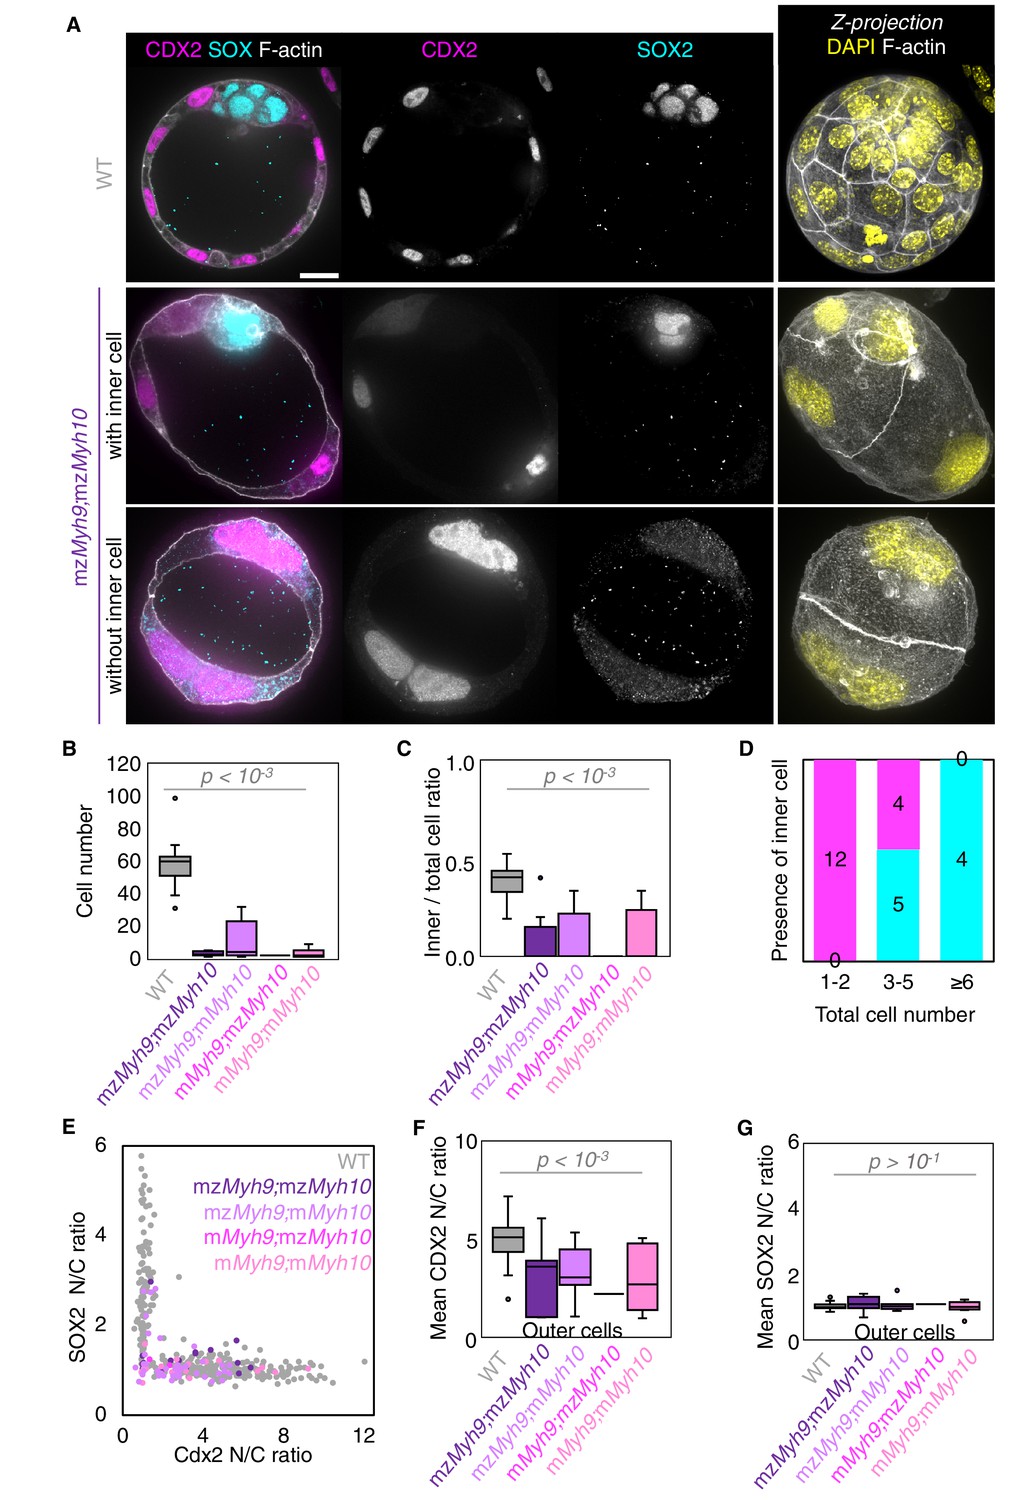
Analysis of TE and ICM lineage in double maternal-zygotic Myh9 and Myh10 mutant embryos.
(A) Representative images of WT and mzMyh9;mzMyh10 embryos stained for TE and ICM markers CDX2 (magenta) and SOX2 (cyan), DAPI (yellow), and F-actin (grey). The same mutant embryos as in Figure 5A are shown. Scale bar, 20 µm. (B-C) Total cell number (B) and proportion of inner cells (C) in WT (grey, n = 23), mzMyh9;mzMyh10 (purple, n = 8), mzMyh9;mMyh10 (lilac, n = 7), mMyh9;mzMyh10 (pink, n = 1), and mMyh9;mMyh10 (bubblegum, n = 9) embryos. (D) Number of maternal Myh9;Myh10 mutant embryos with (cyan) or without (magenta) inner cells as a function of the total number of cells. (E) Nuclear to cytoplasmic (N/C) ratio of CDX2 and SOX2 staining for individual cells from WT (grey, n = 345), mzMyh9;mzMyh10 (purple, n = 17), mzMyh9;mMyh10 (lilac, n = 41), mMyh9;mzMyh10 (pink, n = 2), and mMyh9;mMyh10 (bubblegum, n = 21) embryos. (F-G) N/C ratio of CDX2 (F) and SOX2 (G) staining for outer cells from averaged WT (grey, n = 23), mzMyh9;mzMyh10 (purple, n = 8), mzMyh9;mMyh10 (lilac, n = 7), mMyh9;mzMyh10 (pink, n = 1), and mMyh9;mMyh10 (bubblegum, n = 9) embryos. Mann-Whitney U test p values compared to WT are indicated.
Figure 7
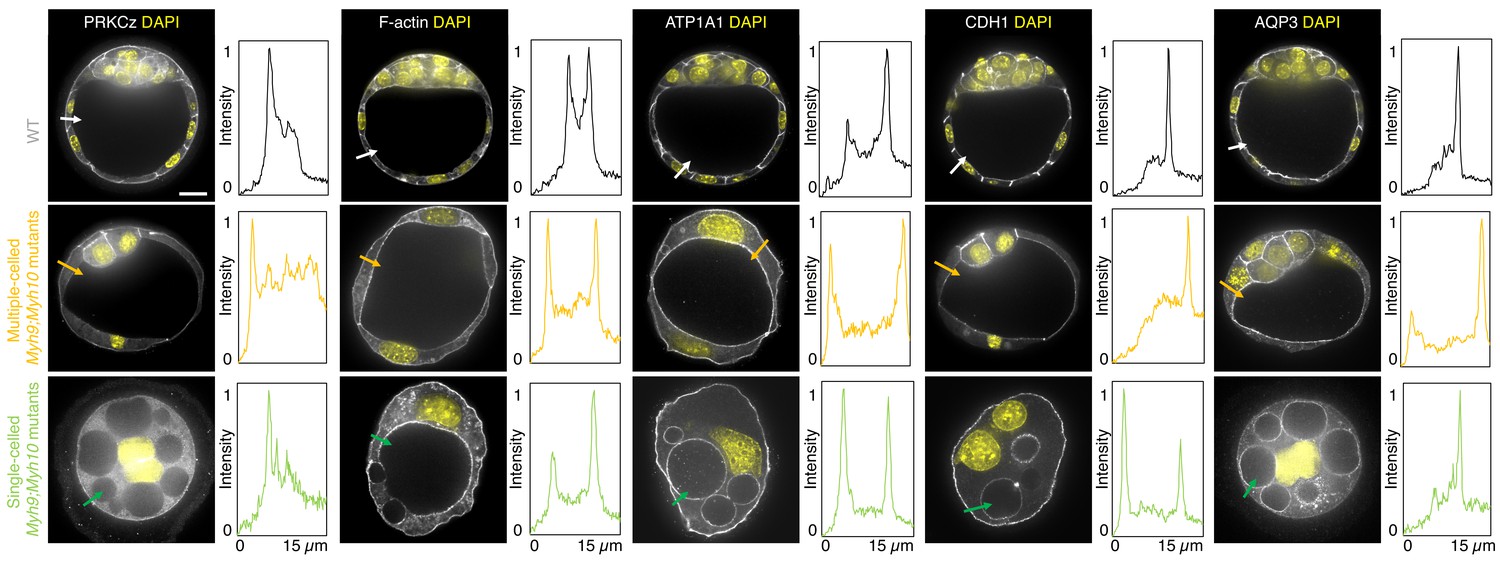
Apico-basal polarity of maternal Myh9;Myh10 mutant embryos composed of multiple cells or a single cell.
Representative images of WT, multiple- or single-celled Myh9;Myh10 mutant embryos stained for apico-basal polarity markers. From left to right: PRKCz, F-actin, ATP1A1, CDH1, and AQP3 shown in grey. Nuclei stained with DAPI shown in yellow. Intensity profiles of a representative 15 µm line drawn from the embryo surface towards the interior are shown next to each marker and genotype (arrows). Intensities are normalized to each minimal and maximal signals. Scale bar, 20 µm.
Figure 8 with 3 supplements
Single-celled embryos at the blastocyst stage.
(A) Representative images of long-term time-lapse of WT and single-celled mMyh9;mMyh10 embryos at the onset of fluid accumulation (Figure 8—video 1). Scale bar, 20 µm. (B) Embryo growth curves during fluid accumulation for WT (grey, n = 20) and multiple- (yellow, n = 13) or single-celled Myh9;Myh10 (green, n = 4) mutant embryos measured for seven continuous hours after a lumen of at least 20 µm is observed. Data show mean ± SEM. (C) Representative images of WT and single-celled mMyh9;mMyh10 embryos stained for TE and ICM markers CDX2 (magenta) and SOX2 (cyan), DAPI (yellow), and F-actin (grey). The same mutant embryos as in A are shown. Scale bar, 20 µm. (D-E) N/C ratio of CDX2 (D) and SOX2 (E) staining for outer cells from WT (grey, n = 23) and multiple- (yellow, n = 18) or single-celled Myh9;Myh10 (green, n = 6) embryos. Mann-Whitney U test p values compared to WT are indicated.
Figure 8—figure supplement 1
Morphogenesis and lineage specification of embryos with all blastomeres fused at the late morula stage.
(A) Representative images of long-term time-lapse of control and fused single-celled embryos at the onset of fluid accumulation (Figure 8—video 2). A schematic diagram of the cell fusion process is shown, with a picture of the representative fused embryo shown right after the fusion. Scale bar, 20 µm. (B) Embryo growth curves during fluid accumulation for control (grey, n = 8) and fused single-celled (light green, n = 7) embryos measured for seven continuous hours after a lumen of at least 20 µm is observed. Data show mean ± SEM. (C) Representative images of control and fused single-celled embryos stained for TE and ICM markers CDX2 (magenta) and SOX2 (cyan), DAPI (yellow), and F-actin (grey). Scale bar, 20 µm. (D-E) N/C ratio of CDX2 (D) and SOX2 (E) staining for outer cells from averaged control (grey, n = 4) and fused single-celled (light green, n = 6) embryos. Mann-Whitney U test p values compared to control are indicated.
Figure 8—video 1
Preimplantation development of an mMyh9;mMyh10 embryo failing all successive cleavages.
Long-term time-lapse imaging of an mMyh9;mMyh10 embryo failing all successive cleavages. Images are taken every 30 min; scale bar is 20 µm. Time is given in hours following the last putative division from the third wave of cleavages.
Figure 8—video 2
Fluid accumulation in control and single-celled fused embryos.
Long-term time-lapse imaging of control (left) and single-celled fused (right) embryos around the time of the fifth wave of cleavage onwards. Images are taken every 30 min; scale bar is 20 µm. Time is given in hours following the time at which a lumen of about 20 µm is visible in the control embryo.
Tables
Appendix 1—table 1
Statistical analysis of compaction data.
| Time after last third cleavage | Time before intial fourth cleavage | Time after last fourth cleavage | Time before intial fifth cleavage | |||||||||||||||
|---|---|---|---|---|---|---|---|---|---|---|---|---|---|---|---|---|---|---|
| Mean | SEM | Embryos | p value | Mean | SEM | Embryos | p value | Mean | SEM | Embryos | p value | Mean | SEM | Embryos | p value | |||
| WT | Time after 3rd cleavage [h] | 0 | 0 | 23 | NA | 7.0 | 0.3 | 23 | NA | 10.9 | 0.3 | 21 | NA | 16.7 | 0.4 | 22 | NA | |
| Contact angle [°] | 87 | 3 | NA | 147 | 2 | NA | 140 | 3 | NA | 148 | 2 | NA | ||||||
| mzMyh9 | Time after 3rd cleavage [h] | 0 | 0 | 15 | NA | 9.8 | 0.5 | 15 | 0.0001 | 13.8 | 0.6 | 10 | 0.002 | 18.8 | 0.5 | 8 | 0.01 | |
| Contact angle [°] | 85 | 2 | 0.5 | 125 | 4 | 0.00001 | 104 | 5 | 0.00001 | 131 | 8 | 0.02 | ||||||
| mMyh9 | Time after 3rd cleavage [h] | 0 | 0 | 8 | NA | 10.4 | 0.7 | 8 | 0.001 | 14.6 | 0.8 | 8 | 0.002 | 18.7 | 0.7 | 3 | 0.002 | |
| Contact angle [°] | 86 | 5 | 0.5 | 115 | 6 | 0.0001 | 112 | 7 | 0.003 | 113 | 21 | 0.1 | ||||||
| mzMyh10 | Time after 3rd cleavage [h] | 0 | 0 | 11 | NA | 5.4 | 0.4 | 11 | 0.004 | 10.2 | 0.6 | 11 | 0.2 | 15.8 | 0.4 | 11 | 0.1 | |
| Contact angle [°] | 87 | 5 | 0.8 | 121 | 4 | 0.0001 | 126 | 5 | 0.03 | 148 | 4 | 0.8 | ||||||
| mMyh10 | Time after 3rd cleavage [h] | 0 | 0 | 20 | NA | 6.3 | 0.4 | 20 | 0.2 | 10.8 | 0.3 | 20 | 0.5 | 16.8 | 0.6 | 20 | 0.9 | |
| Contact angle [°] | 85 | 3 | 0.3 | 128 | 5 | 0.0004 | 128 | 3 | 0.006 | 149 | 2.8 | 0.5 | ||||||
| mzMyh9;mzMyh10 | Time after 3rd cleavage [h] | 0 | 0 | 7 | NA | 9.7 | 0.8 | 3 | 0.07 | 12 | NA | 1 | NA | NA | ||||
| Contact angle [°] | 89 | 6 | 0.8 | 117 | 4 | 0.006 | 84.5 | NA | NA | |||||||||
| mzMyh9;mMyh10 | Time after 3rd cleavage [h] | 0 | 0 | 7 | NA | 6.9 | 1.7 | 4 | 1.0 | 9 | 0.5 | 2 | 0.1 | 12 | NA | 1 | NA | |
| Contact angle [°] | 83 | 5 | 0.6 | 100 | 5 | 0.002 | 108 | 14 | 0.07 | 113 | NA | NA | ||||||
| mMyh9;mMyh10 | Time after 3rd cleavage [h] | 0 | 0 | 7 | NA | 8 | 1.3 | 5 | 0.5 | 11 | 0.5 | 3 | 1.0 | NA | ||||
| Contact angle [°] | 76 | 7 | 0.1 | 110 | 5 | 0.0006 | 105 | 3 | 0.002 | |||||||||
Appendix 1—table 2
Statistical analysis of cell cycle duration data.
Mean durations of 8-cell stage, fourth wave of cleavage, and 16-cell stage related to Figures 2B and 5B with associated SEM, embryo number, and p value from unpaired two-tailed Welch’s t test against WT.
| Duration of 8-cell stage [h] | Duration of fourth wave of cleavages [h] | Duration of 16-cell stage [h] | ||||||||||
|---|---|---|---|---|---|---|---|---|---|---|---|---|
| Mean | SEM | Embryos | p value | Mean | SEM | Embryos | p value | Mean | SEM | Embryos | p value | |
| WT | 7.0 | 0.3 | 23 | NA | 4.0 | 0.3 | 23 | NA | 5.5 | 0.4 | 23 | NA |
| mzMyh9 | 9.8 | 0.5 | 15 | 0.0001 | 4.8 | 0.7 | 15 | 0.3 | 5.7 | 0.8 | 14 | 0.8 |
| mMyh9 | 10.4 | 0.7 | 8 | 0.001 | 4.2 | 1.2 | 8 | 0.9 | 7.0 | 1.1 | 8 | 0.1 |
| mzMyh10 | 5.4 | 0.4 | 11 | 0.004 | 4.8 | 0.8 | 11 | 0.2 | 5.6 | 0.5 | 11 | 0.9 |
| mMyh10 | 6.3 | 0.4 | 20 | 0.2 | 4.5 | 0.4 | 20 | 0.3 | 6.1 | 0.5 | 20 | 0.4 |
| mzMyh9;mzMyh10 | 10.3 | 1.4 | 8 | 0.06 | 2.0 | 0.8 | 3 | 0.1 | ||||
| mzMyh9;mMyh10 | 8.1 | 1.4 | 6 | 0.5 | 4.3 | 1.1 | 3 | 0.8 | NA | |||
| mMyh9;mMyh10 | 9.3 | 1.0 | 8 | 0.06 | 3.6 | 0.7 | 5 | 0.6 | ||||
Appendix 1—table 3
Statistical analysis of periodic contraction data.
Mean amplitude of periodic movements and contact angle related to Figure 2H with associated SEM, embryo number, and p value from Mann-Whitney U test against WT.
| Maximum amplitude within 50–120 s oscillation period range [µm] | Contact angle [°] | ||||||
|---|---|---|---|---|---|---|---|
| Embryos | Mean | SEM | p value | Mean | SEM | p value | |
| WT | 21 | 0.140 | 0.009 | NA | 126 | 5 | NA |
| mzMyh9 | 15 | 0.039 | 0.002 | 0.0000005 | 78 | 3 | 0.000003 |
| mMyh9 | 8 | 0.045 | 0.003 | 0.00005 | 82 | 6 | 0.001 |
| mzMyh10 | 11 | 0.094 | 0.009 | 0.006 | 103 | 6 | 0.02 |
| mMyh10 | 20 | 0.111 | 0.013 | 0.01 | 108 | 5 | 0.02 |
Additional files
Download links
A two-part list of links to download the article, or parts of the article, in various formats.
Downloads (link to download the article as PDF)
Open citations (links to open the citations from this article in various online reference manager services)
Cite this article (links to download the citations from this article in formats compatible with various reference manager tools)
Multiscale analysis of single and double maternal-zygotic Myh9 and Myh10 mutants during mouse preimplantation development
eLife 10:e68536.
https://doi.org/10.7554/eLife.68536


