Cortex cis-regulatory switches establish scale colour identity and pattern diversity in Heliconius
- Department of Zoology, University of Cambridge, Downing St., United Kingdom
- Smithsonian Tropical Research Institute, Panama
- The George Washington University Department of Biological Sciences, Science and Engineering Hall, United States
- Department of Biology, Centre for Applied Tropical Ecology and Conservation, University of Puerto Rico, Puerto Rico
- Baker Institute for Animal Health, College of Veterinary Medicine, Cornell University, United States
- Cell & Developmental Biology, Division of Biological Sciences, UC San Diego, United States
- Biology Program, Faculty of Natural Sciences, Universidad del Rosario, Colombia
Figures
Figure 1 with 4 supplements
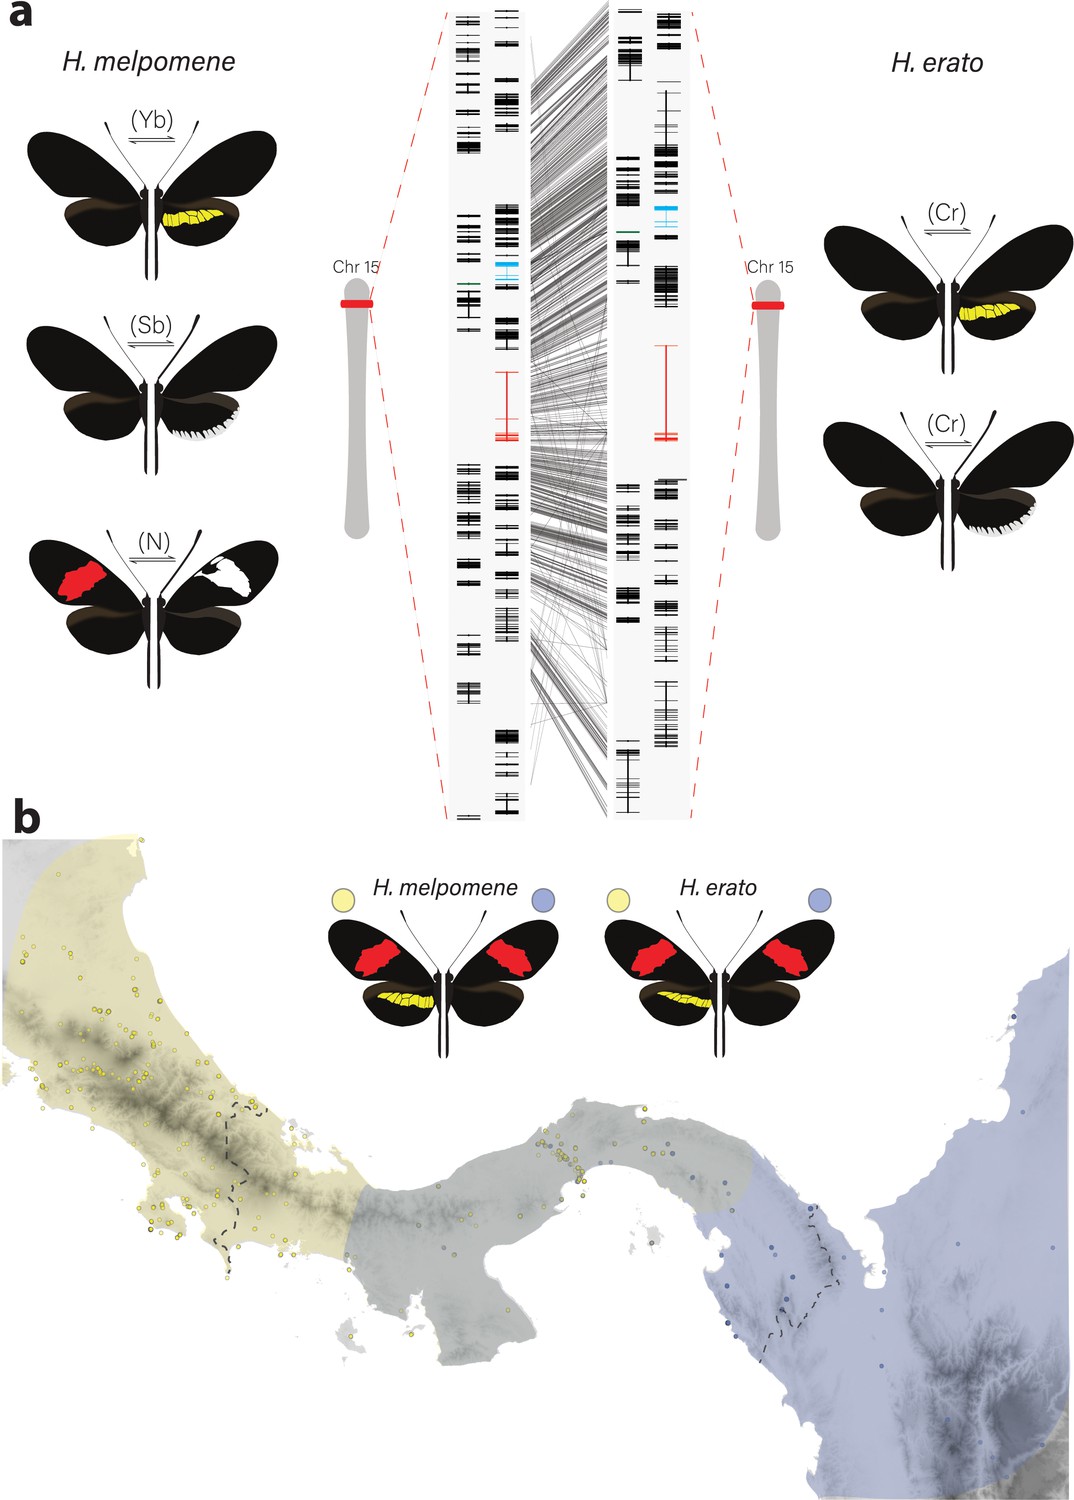
Phenotypic switches of yellow and white colour pattern elements are controlled by homologous loci in Heliconius species.
(a) Homologous loci in both H. erato and H. melpomene are associated with variation in yellow and white patterns between morphs. In H. melpomene, three tightly linked genetic elements located at chromosome 15 have been identified that control variation for the hindwing yellow bar, white margin elements, and forewing band (Yb, Sb, and N, respectively), while in H. erato, variation has been mapped to one element (Cr). The gene cortex is highlighted in red, dome/wash in blue, and dome-trunc in green. Alignments between the two co-mimetic species at the locus is shown (grey lines, 75% alignment identity). Gene models from assemblies of H. melpomene (left) and H. erato (right) are shown for the loci spanning the associated intervals controlling the phenotypic switches highlighted. Horizontal bars indicate exons, vertical bars introns. (b) Focal co-mimetic morphs of H. erato and H. melpomene used in this study, differing in the presence of a hindwing yellow bar, and their ranges across Central America are shown. Yellow: yellow banded morphs, blue: black hindwing morphs, grey: range overlap. Each dot represents a sampled location (data from Rosser et al., 2012). Country borders are indicated by dotted lines.
Figure 1—figure supplement 1
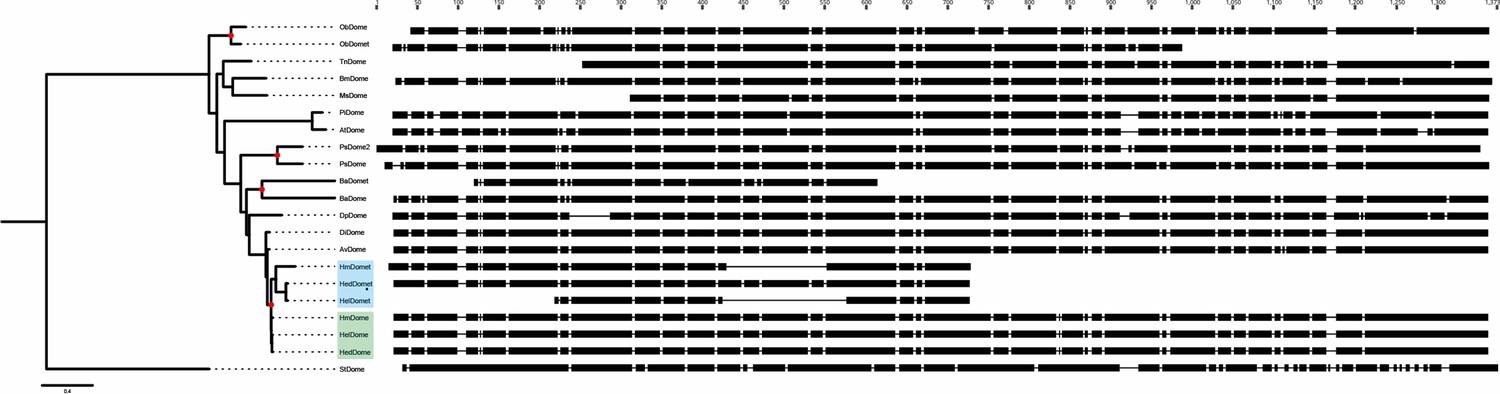
Maximum-likelihood tree based on lepidopteran dome amino acid sequences.
The Heliconius duplications are highlighted in blue (dome-t) and green (dome). Putative duplication events are shown with a red circle. Protein alignments are shown alongside each species, illustrating several C-terminal truncation events in the duplicated sequences. Protein alignments indicate that in both H. erato and H. melpomene, dome-trunc maintains only the N-terminal half of the gene, suggesting dome-trunc is undergoing pseudogenisation. H. melpomene (Hm), H.erato demophoon (Hed), Operophtera brumata (Ob), Trichoplusia ni (Tn), Bombyx mori (Bm), Manduca sexta (Ms), Plodia interpunctella (Pi), Amyeolis transitella (At), Phoebis sennae (Ps), Bicyclus anynana (Ba), Danaus plexippus (Dp), Dryas iulia (Di), Agraulis vanillae (Av), and Heliconius erato lativitta (Hel). All lepidoptera sequences were extracted from the assemblies deposited on lepbase.org. As a trichopteran outgroup, we used a recently published Pacbio assembly of Stenopsyche tienmushanensis (St) (Luo et al., 2018).
Figure 1—figure supplement 2
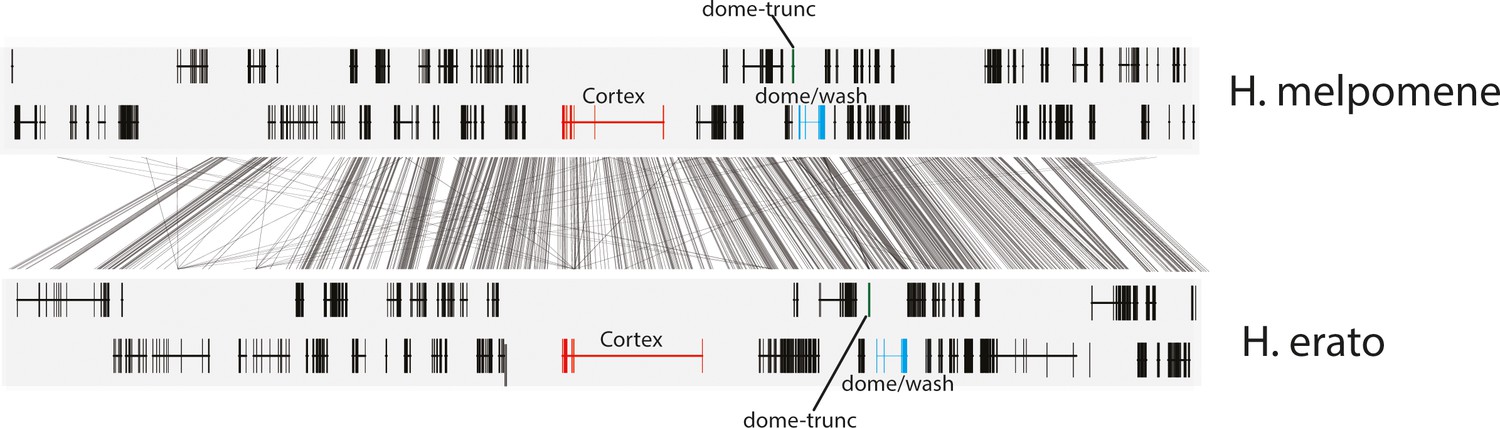
Annotation of the genes present in the 47 gene interval previously shown to be associated with colour pattern differences in Heliconius.
The positions of cortex (red), dome-trunc (green), and dome/wash are highlighted. Alignments between the two species at the locus is shown (grey lines, 75% alignment identity). Gene models from assemblies of H. melpomene (top) and H. erato (bottom) are shown for the loci spanning the associated intervals controlling the phenotypic switches highlighted. Horizontal bars indicate exons, and vertical bars indicate introns.
Figure 1—figure supplement 3
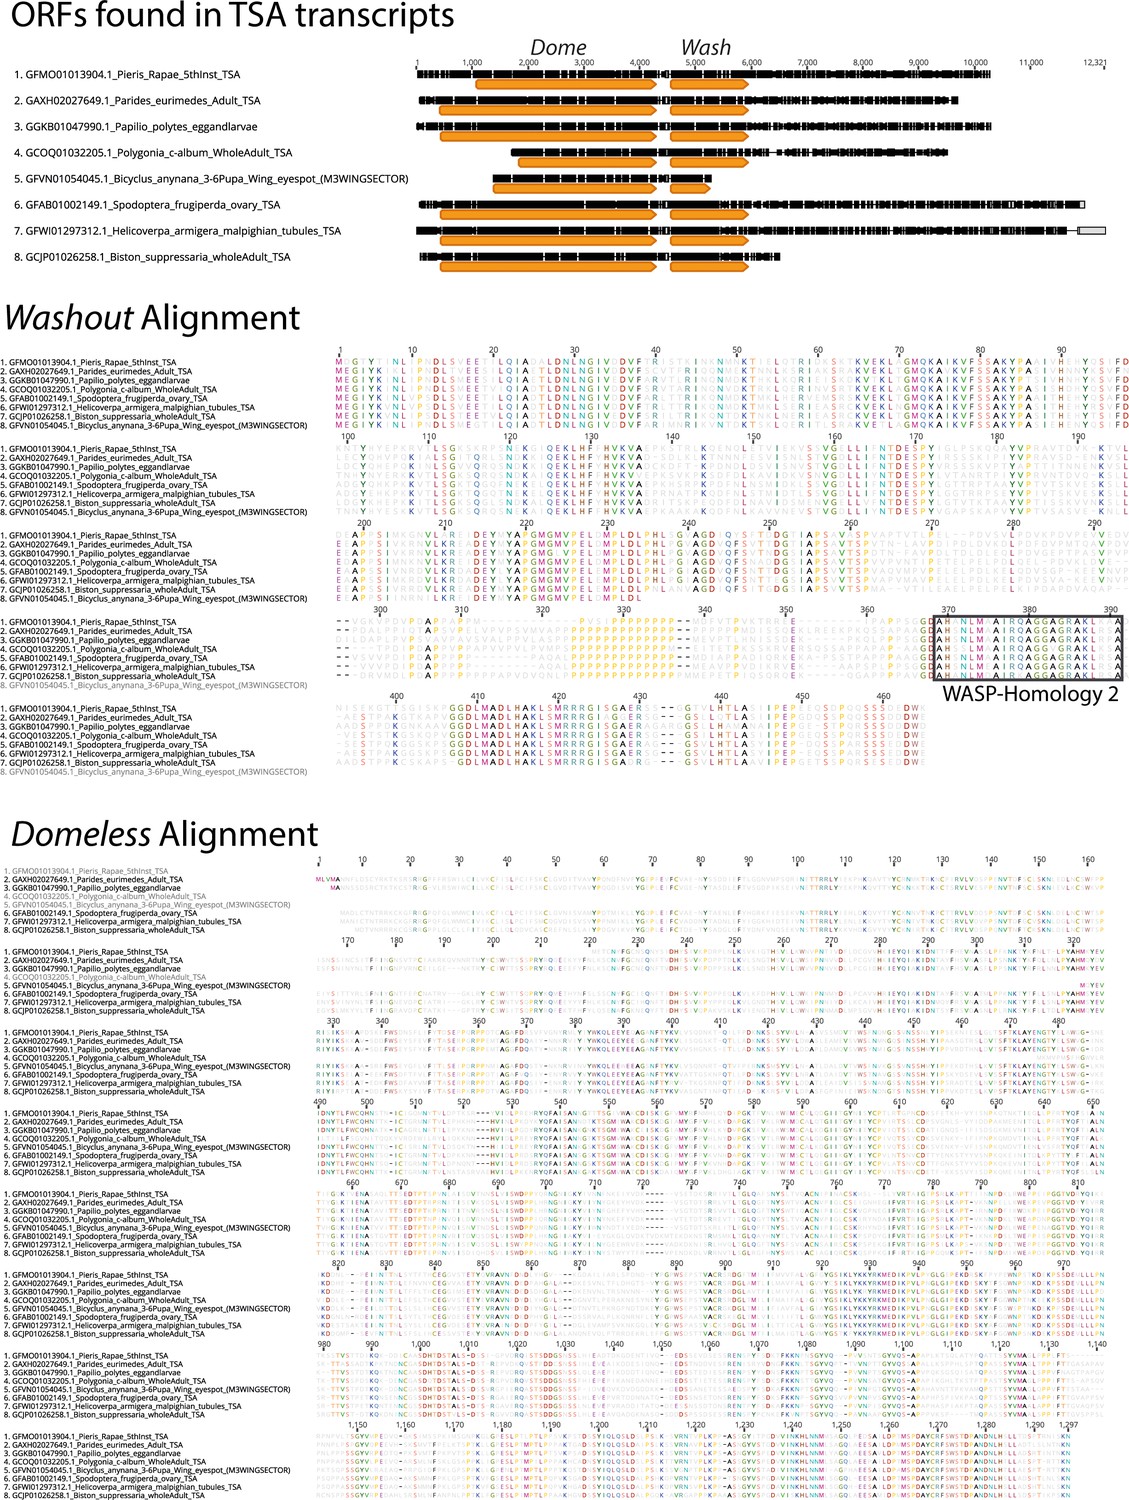
To examine the conservation of dome/wash bi-cistronic transcription in the Lepidoptera, we performed BLASTn searches using the previously annotated dome transcripts from the H.
melpomene genome (Hmel2) found on Lepbase (Challi et al., 2016), against the Transcription Shotgun Assembly (TSA) sequence archive on NCBI. We recovered several assembled transcripts containing both the dome and wash ORFs in various divergent lepidoptera. The positions of dome and wash ORFs are shown (arrows blocks in TSA transcript) as well as the encoded Wash and Dome proteins below.
Figure 1—figure supplement 4
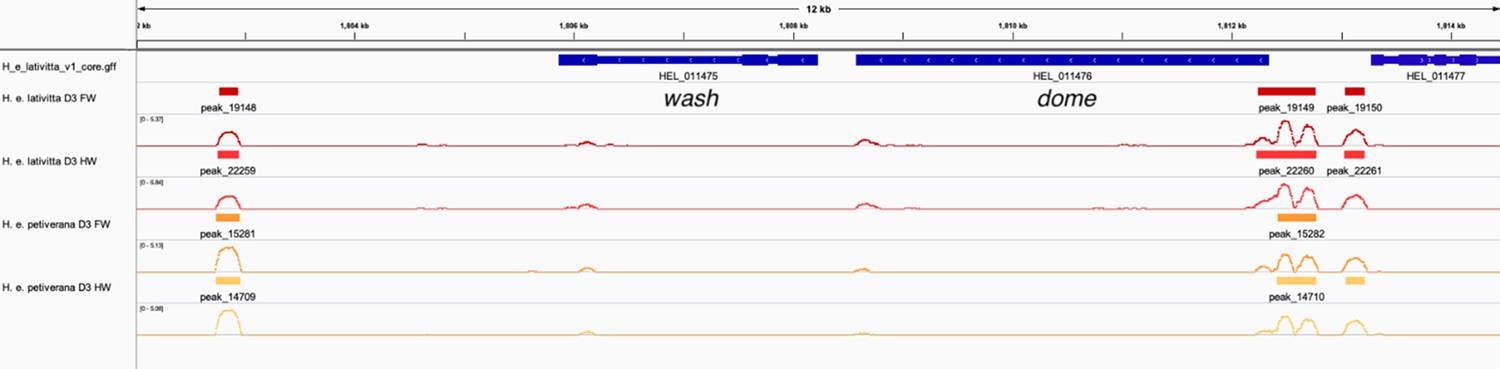
ATAC-sequencing analysis supports dome/wash bi-cistronic transcription in Heliconius erato.
We explored whether dome/wash share a promoter by analysing published ATAC-sequencing data from Lewis et al., 2019. We analysed samples corresponding to the forewings and hindwings of day three pupa of H. e. lativitta and H. e. petiverana. Peaks were called using Genrich (http://github.com/jsh58/Genrich/ (Gaspar, 2021), using the parameter -j (ATAC-seq mode) with a cutoff of q < 0.05 (q = FDR adjusted p-value). Peaks were visualised in IGV. Coloured blocks correspond to significant peaks and lines represent -log(q). Peaks, indicating cis-regulatory activity, were observed upstream of dome for all samples, whereas no peaks were present upstream of the start of wash, indicating a shared promoter for dome/wash.
Figure 2 with 6 supplements
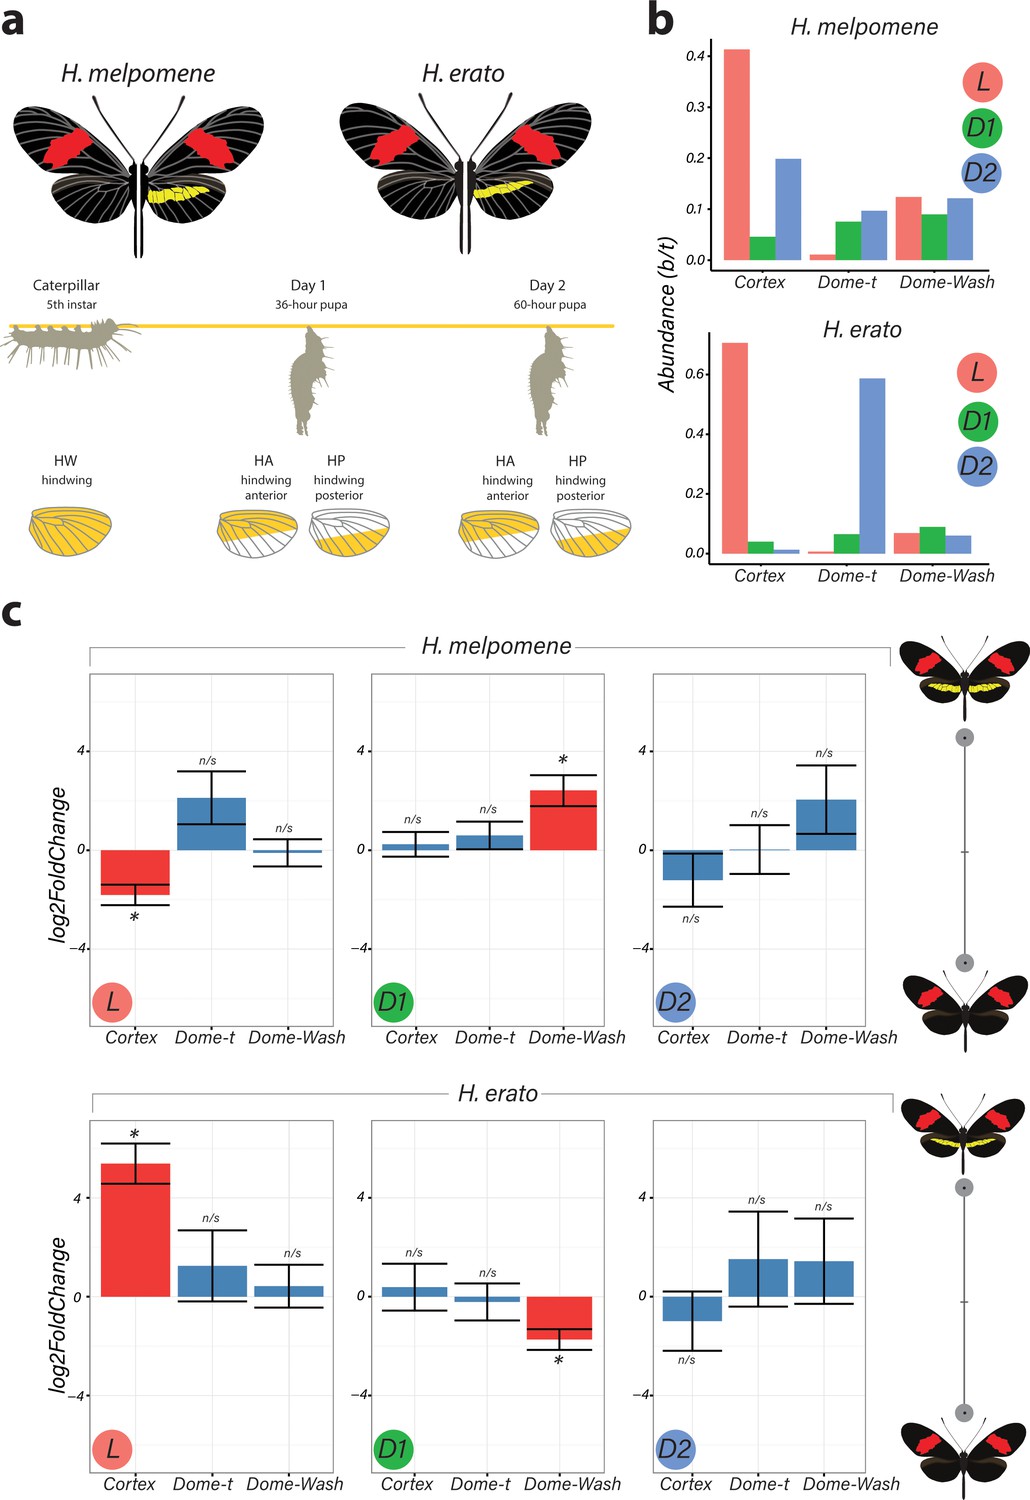
Differential expression of genes at Chromosome 15 implicate cortex as most likely candidate driving yellow bar differences.
(a) Hindwing tissue from co-mimetic morphs of H. melpomene and H. erato were collected at three developmental stages fifth-instar caterpillar, Day 1 Pupae (36hAPF) and Day 2 Pupae (60hAPF). For pupal tissue, hindwing tissue was dissected using the wing vein landmarks shown, corresponding to the future adult position of the hindwing yellow bar (dissection scheme based on Hanly et al., 2019). (b) Relative abundance of transcripts corresponding to the genes cortex, domeless-truncated, domeless/washout throughout developmental stages. (c) Log2FoldChange for the genes cortex, domeless-truncated (dome-t), domeless/washout (dome-wash) across developmental stages. Comparisons are for whole wing discs (Larvae, L) and across wing sections differing in the presence of a yellow bar in pupal wings (D1 and D2; see Figure 2—figure supplement 2: for depiction of contrasts analysed). *Adjusted p<0.05; n/s = not significant. N = 3 for each bar plot.
-
Figure 2—source data 1
RNA-seq samples were genotyped relative to protein-coding WGS SNPs from individuals from the source populations in Panama.
Both SNPs were contained in the protein-coding sequence of the gene Cortex. Individuals from the RNA-seq experiment match the genotype of the source populations.
- https://cdn.elifesciences.org/articles/68549/elife-68549-fig2-data1-v1.docx
-
Figure 2—source data 2
This was repeated for the H. erato samples; here, only one informative protein-coding SNP was found, in the gene parn.
Once again, all individuals match the expected genotype.
- https://cdn.elifesciences.org/articles/68549/elife-68549-fig2-data2-v1.docx
-
Figure 2—source data 3
Primers used for qPCR experiments for housekeeping genes and cortex are shown below.
- https://cdn.elifesciences.org/articles/68549/elife-68549-fig2-data3-v1.docx
-
Figure 2—source data 4
Gene IDs in the H. melpomene Yb locus and their corresponding IDs in the H. erato genome.
- https://cdn.elifesciences.org/articles/68549/elife-68549-fig2-data4-v1.docx
Figure 2—figure supplement 1
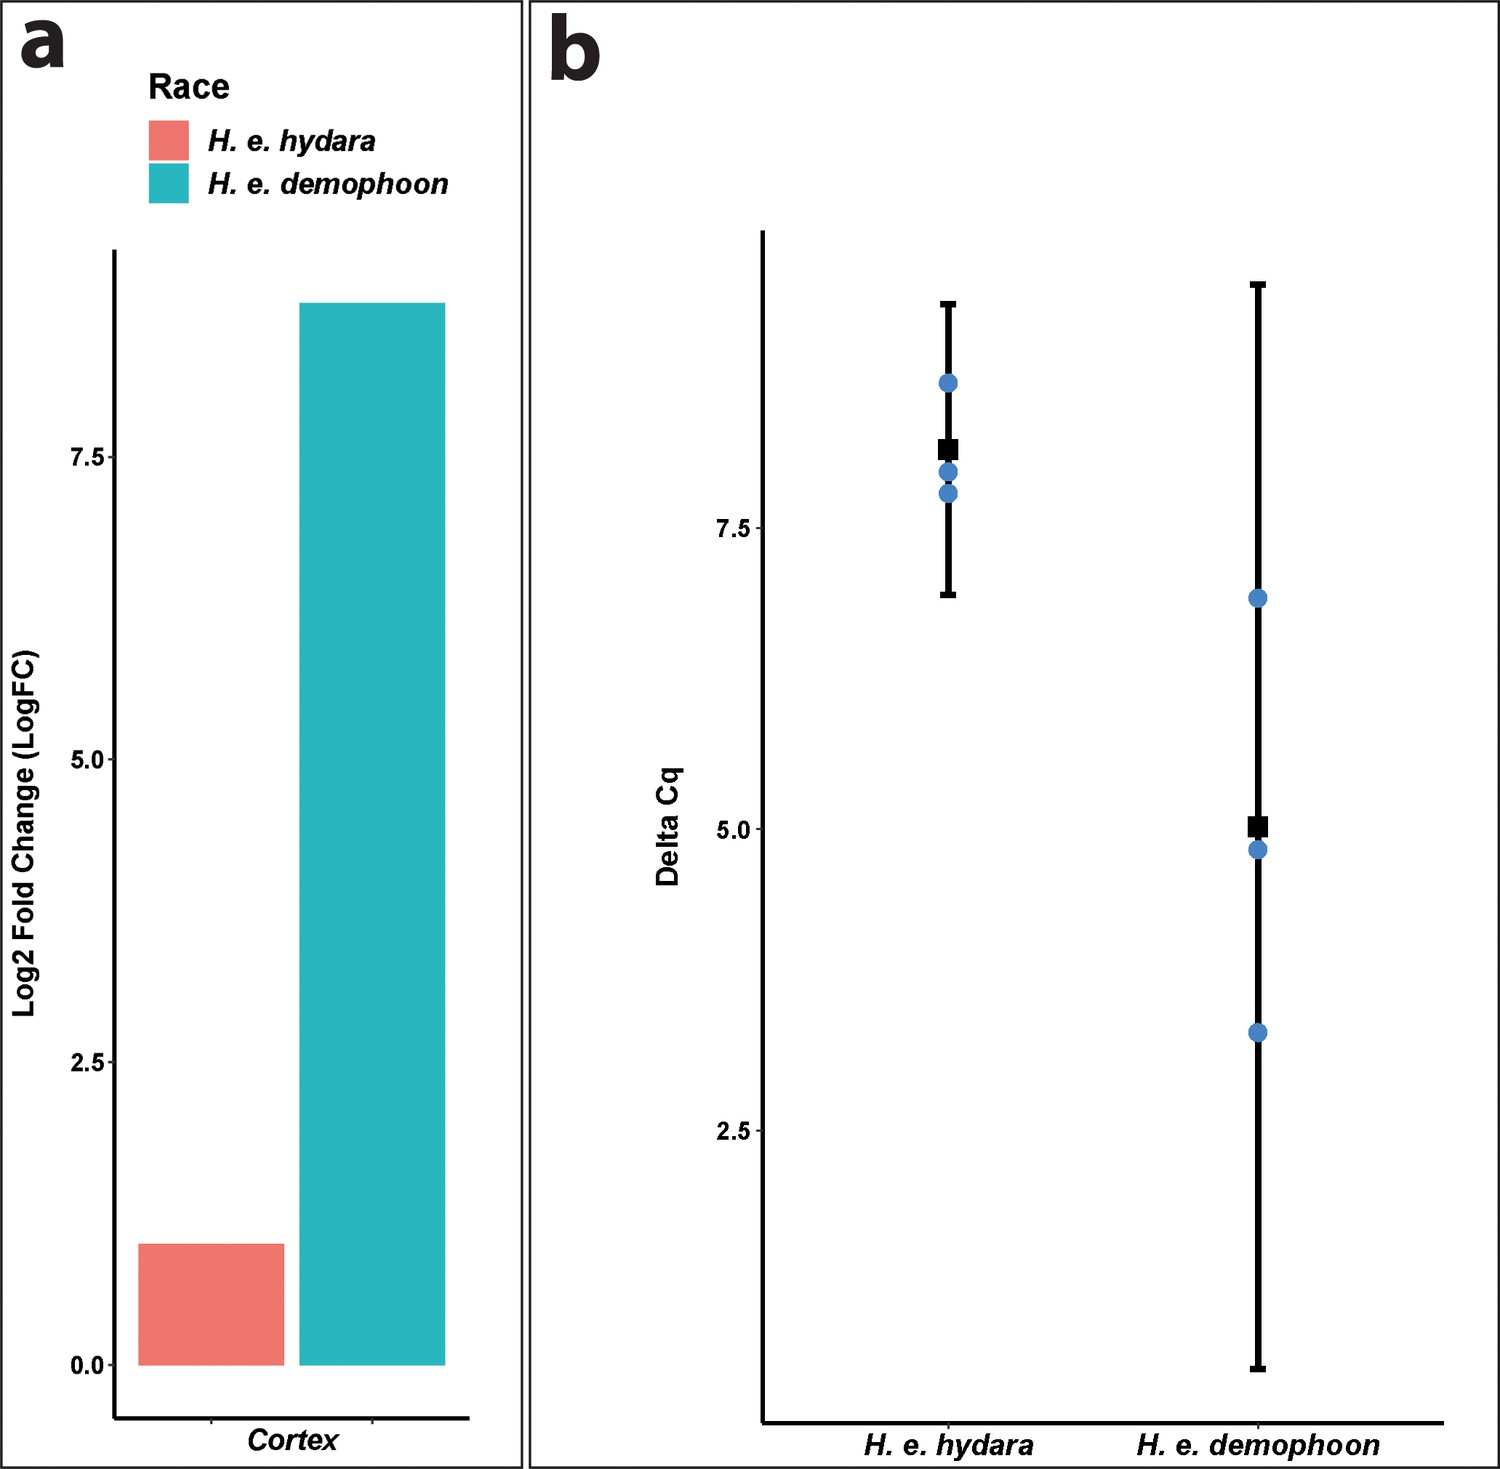
qPCR confirms direction of differential expression in Heliconius erato.
(a) Cortex log2 fold change relative to H. e. hydara using delta CT. Data were normalised against the geometric average CT of three housekeeping genes eF1a, rpL3, and polyABP. (b) Cortex deltaCT in H. e. hydara and H. e. demophoon. Error bars represent the confidence interval for n = 3 (p=0.0444).
Figure 2—figure supplement 2
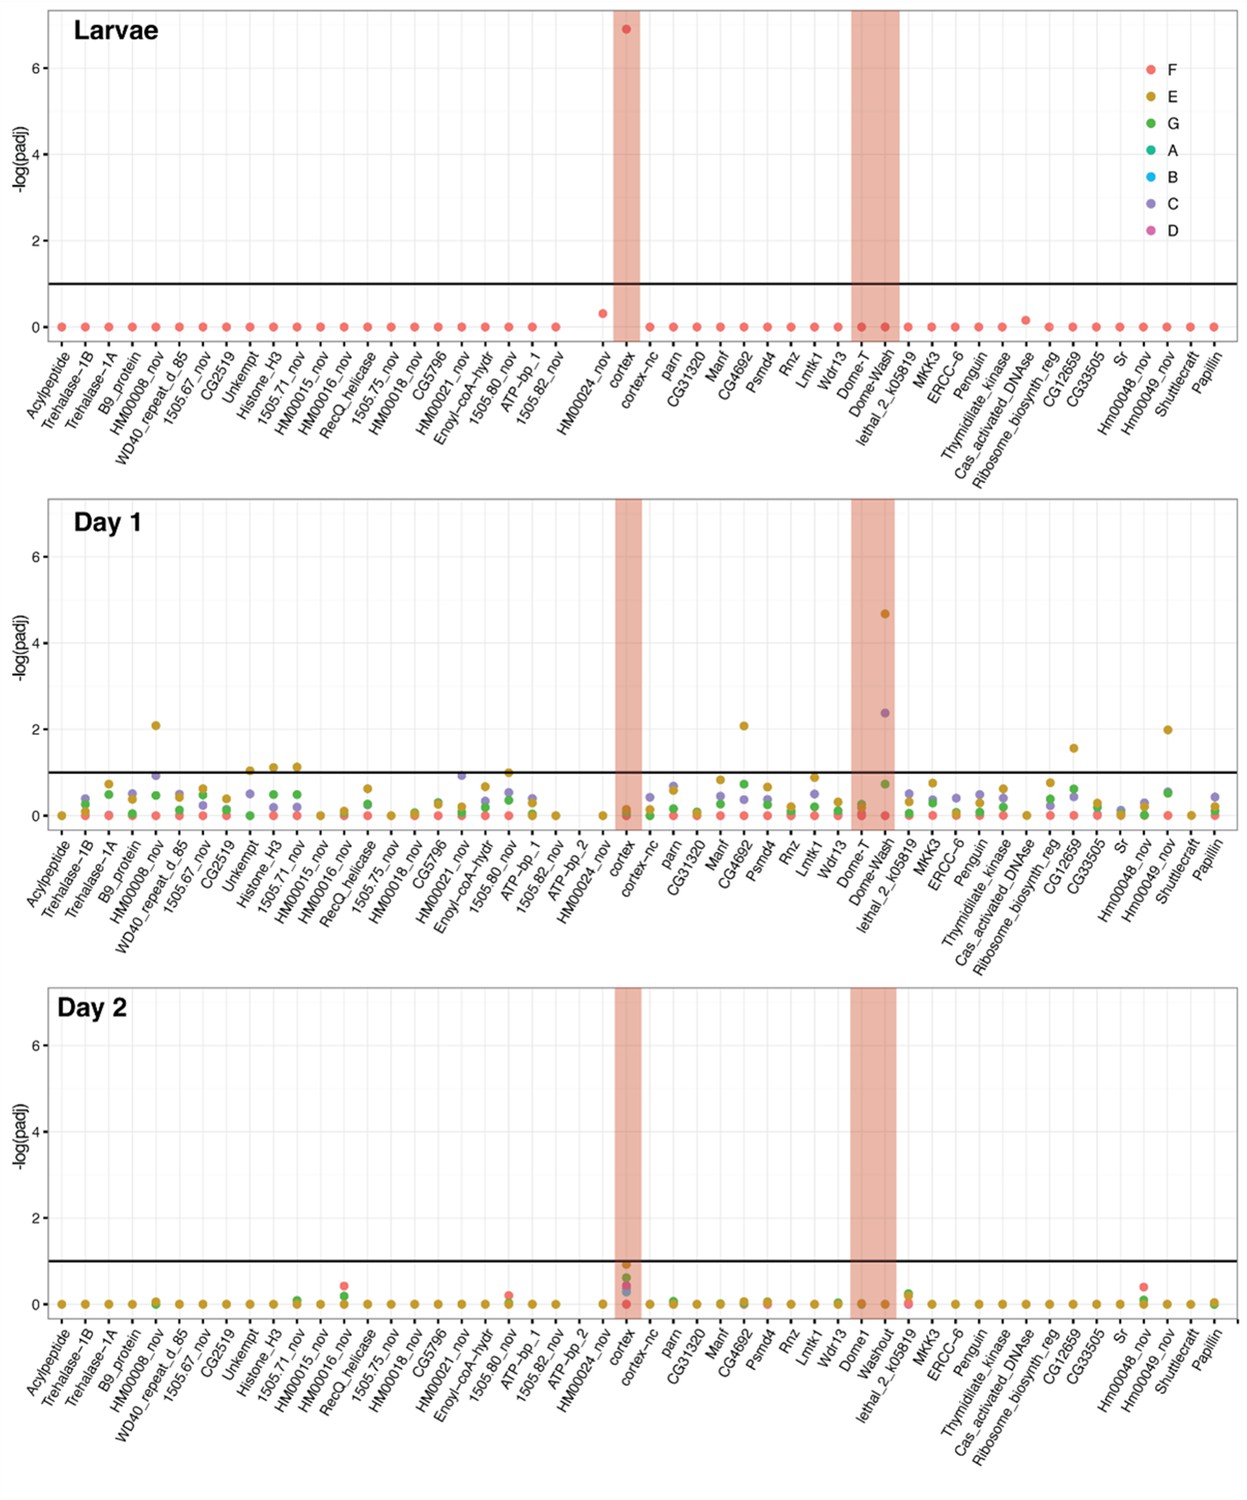
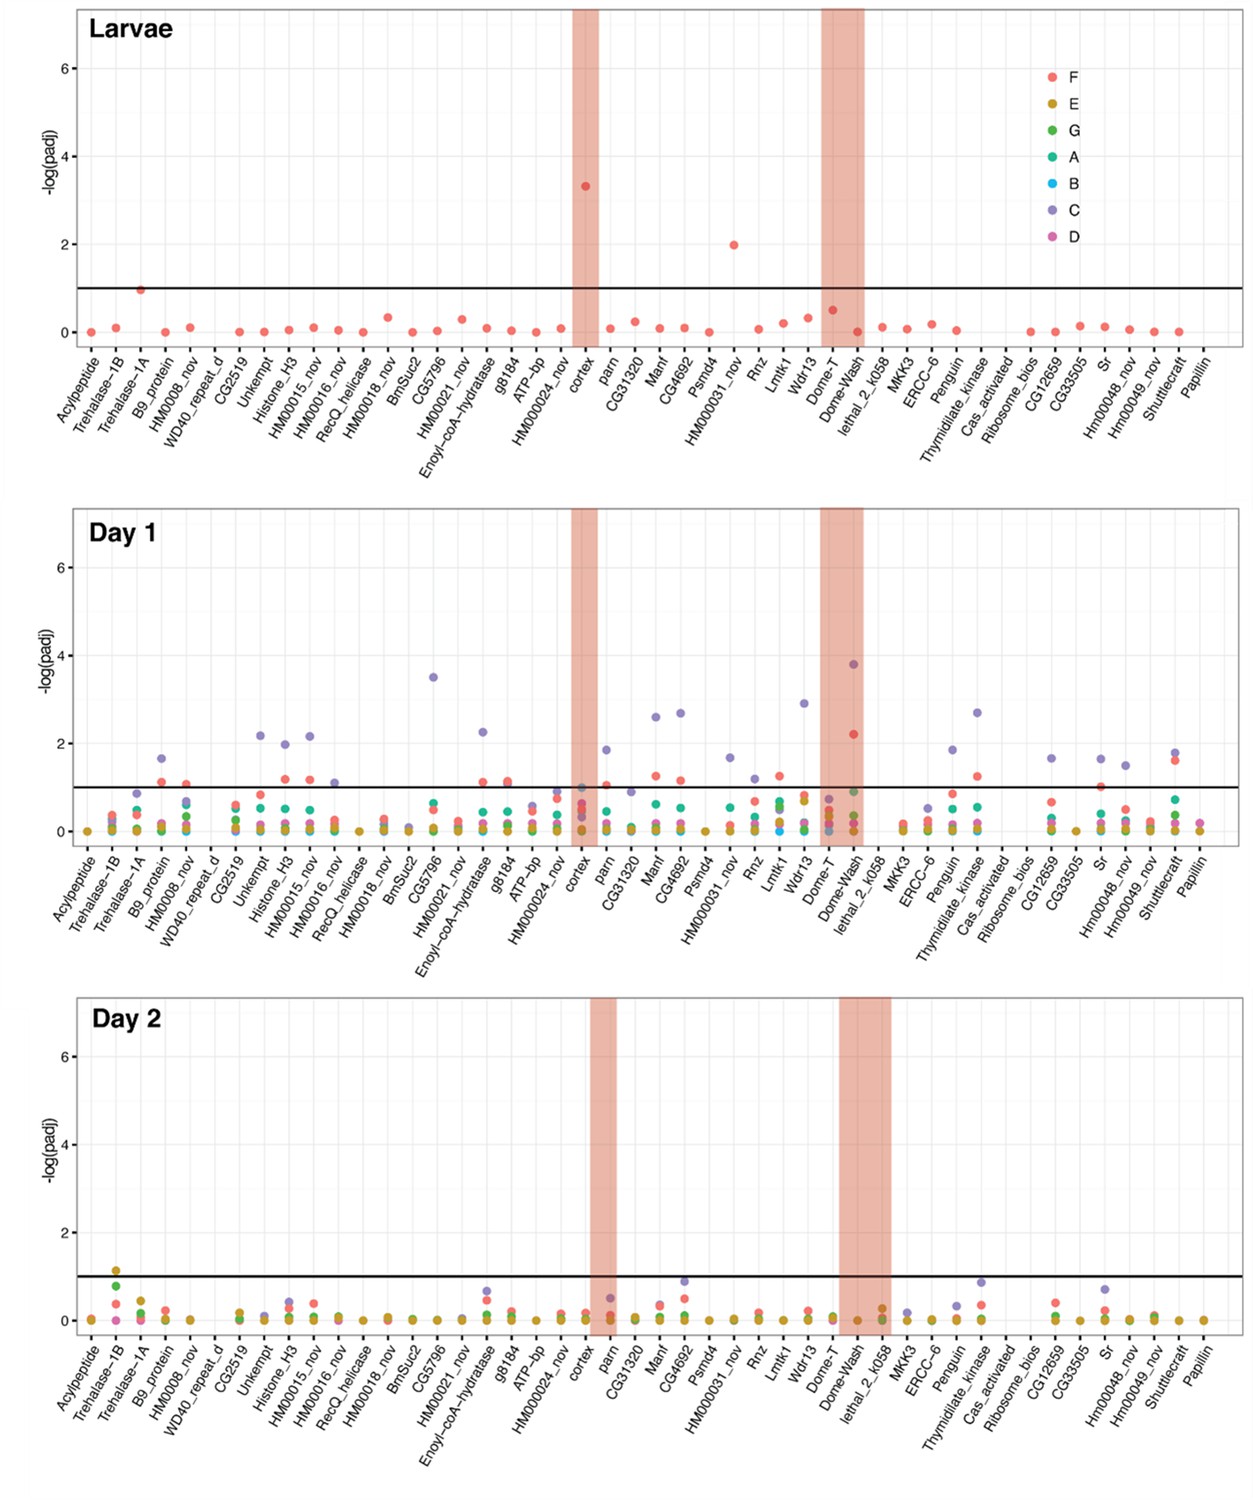
DGE analysis shows cortex and dome/wash are consistently differentially expressed between colour pattern races and pupal wing sections.
Differential expression across the cortex locus in H. erato, shown as the negative log of the adjusted p-value (-log(padj)). Top: larvae, middle: Day 1 pupae, bottom, Day 2 pupae. See Figure 2—source data 4 for gene IDs and homology with H. melpomene. The red shading highlights the genes cortex, dome-T, and Dome-Wash. The horizontal line indicates the cutoff for significance, at padj = 0.1. Colours are used for each of the contrasts, depicted in Figure 3. In this analysis, genes were differentially expressed in contrast E and C (depictions of these contrasts are provided). E gives genes differentially regulated in black posterior compartment, and C gives genes differentially regulated in yellow anterior compartment.
Figure 2—figure supplement 3
Differential expression across the cortex locus in H. melpomene, shown as the negative log of the adjusted p-value (–log(padj)).
Top: larvae, middle: day one pupae, bottom, day two pupae. See Figure 2—source data 4 for gene IDs and homology with H. erato. Red bars highlight the genes cortex, Dome-T, and Dome-Wash. The horizontal line indicates the cutoff for significance, at padj = 0.1. Colours are used for each of the contrasts, depicted in Figure 2—figure supplement 4. In this analysis, genes were differentially expressed in contrast E, C, and F (depictions of these contrasts are provided). F is the difference between races, E gives genes differentially regulated in black posterior compartment, and C gives genes differentially regulated in yellow anterior compartment (these contrasts are depicted in cartoon form).
Figure 2—figure supplement 4
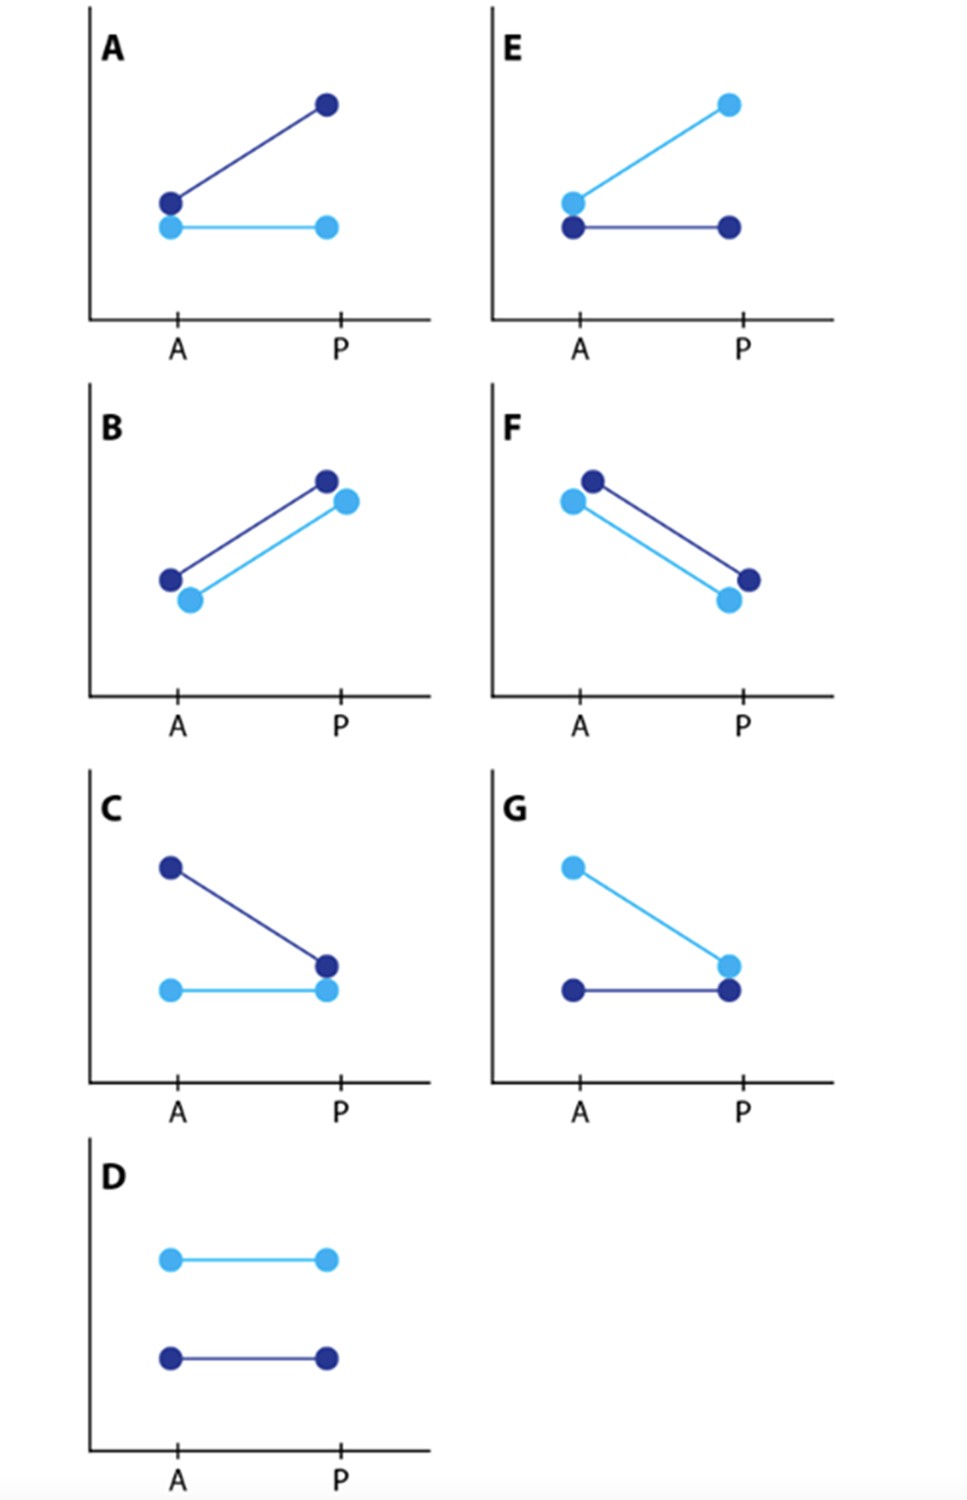
Depiction of contrasts.
Dark blue represents the yellow races, H. m. rosina and H. e. demophoon from Panama. Light blue represents the black races, H. m. melpomene and H. e. hydara from Colombia.
Figure 2—figure supplement 5
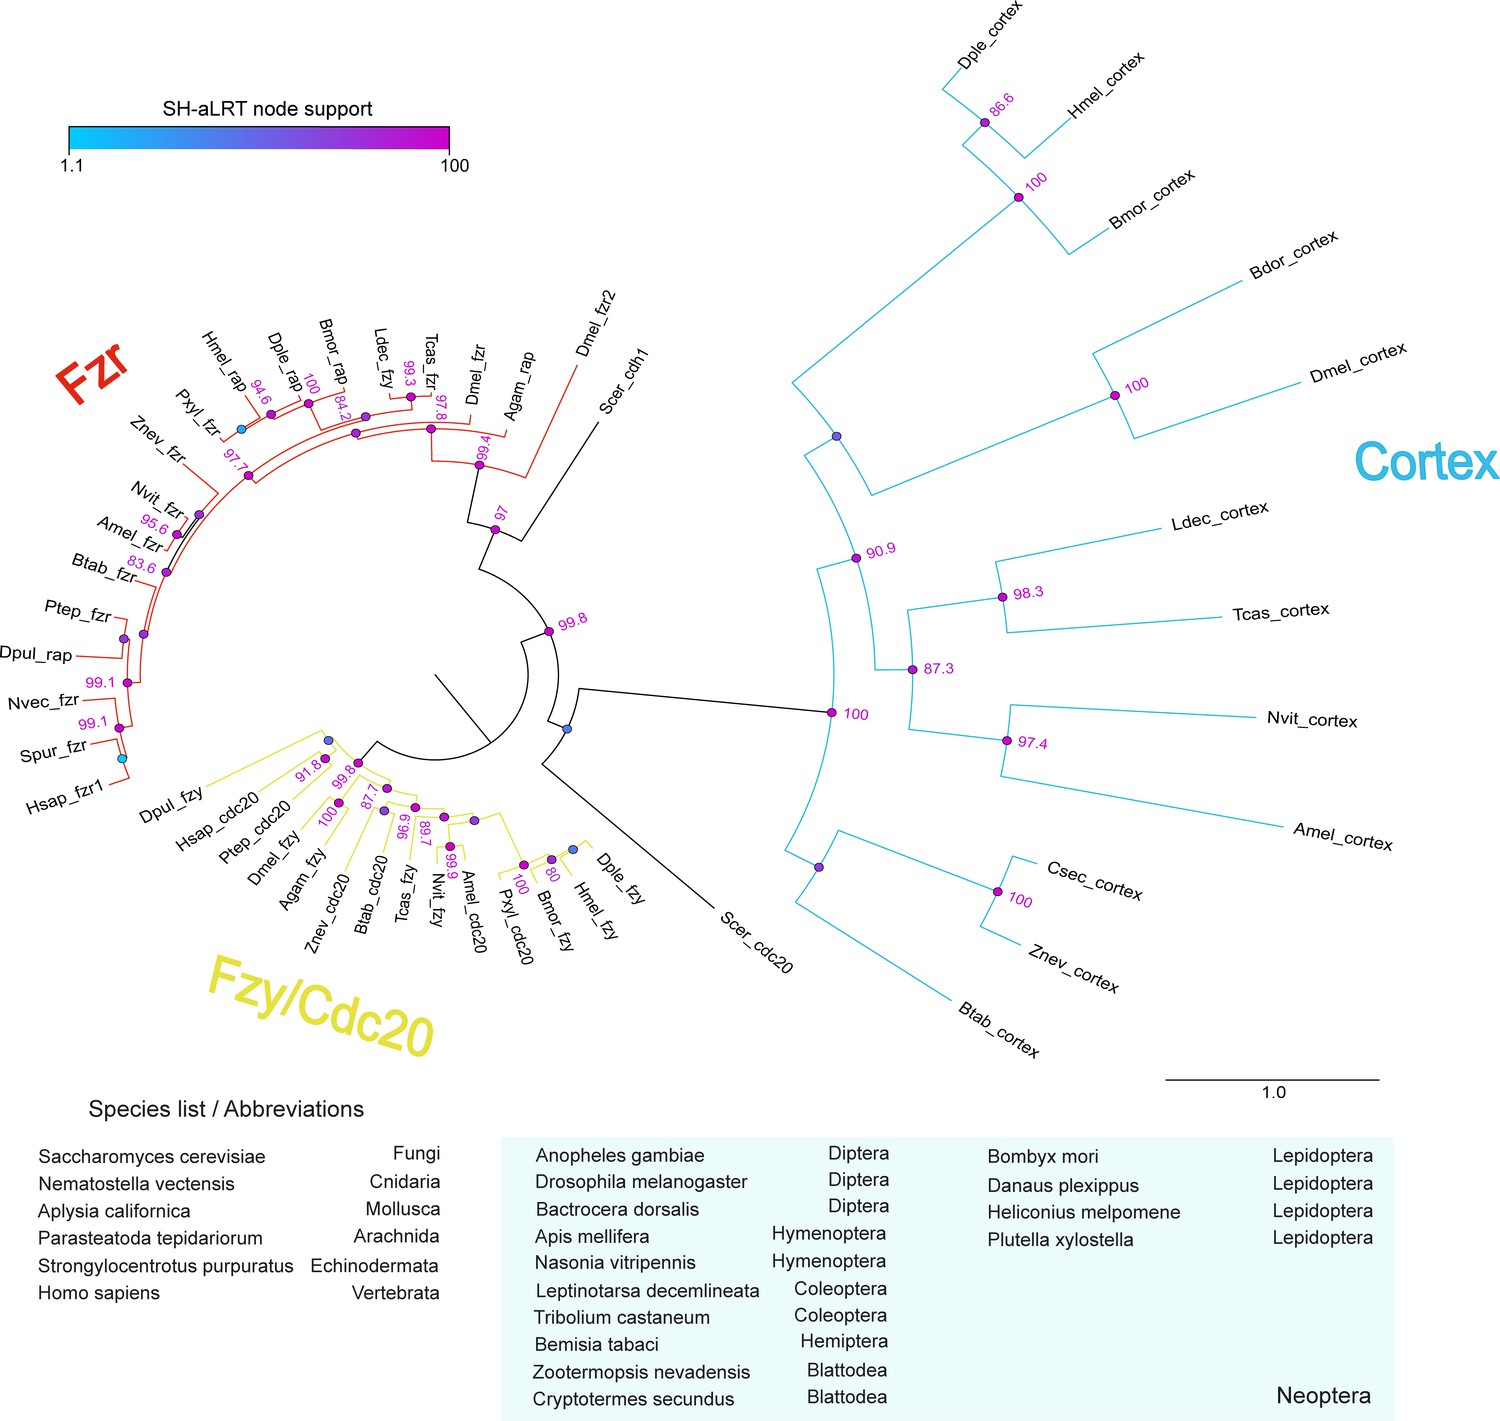
analysis of the cdc20/cdh1 family reveals Cortex is a derived and insect-specific derivative of cdc20.
Full-length protein homologs retrieved from TBLASTN searches were used to generate a curated alignment with MAFFT/Guidance2 with a column threshold of 0.5. TBLASTN searches against arthropod genome and transcriptome NCBI repositories did not recover Cortex homologues outside of the Neoptera lineage. The maximum-likelihood tree was constructed with W-IQ-TREE with the ‘Auto’ function to find a best-fit model of substitution. Colour circles indicate the scores of SH-like approximate likelihood ratio tests (SH-aLRT) computed over 1000 replicates, with numeric values for scores > 80. Scale bar indicates amino-acid substitutions per site. Abbreviations: fzy, fizzy; fzr, fizzy-related; rap, retina aberrant pattern (syn. fzr).
Figure 2—figure supplement 6
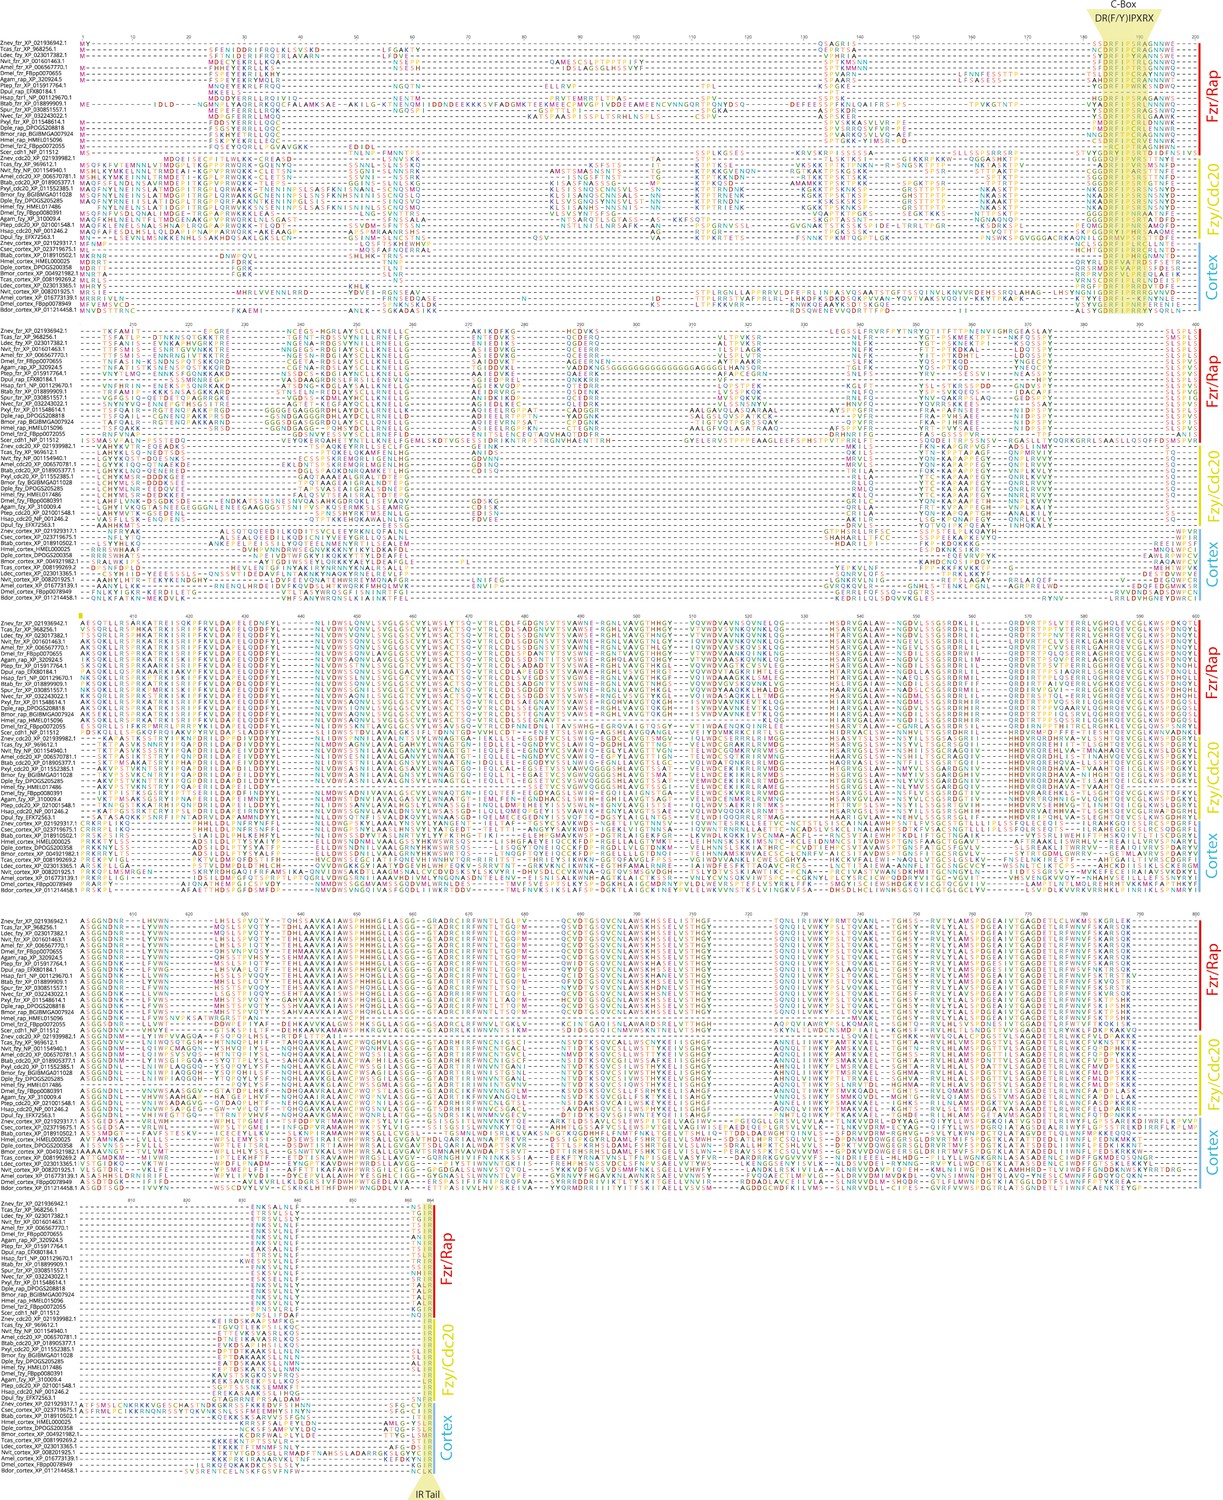
Full Cdc20 family protein alignments (see legend in Figure 2—figure supplement 5 for abbreviations).
The conserved C-box motif, necessary for interaction with the APC/C and the IR are highlighted.
Figure 3 with 1 supplement
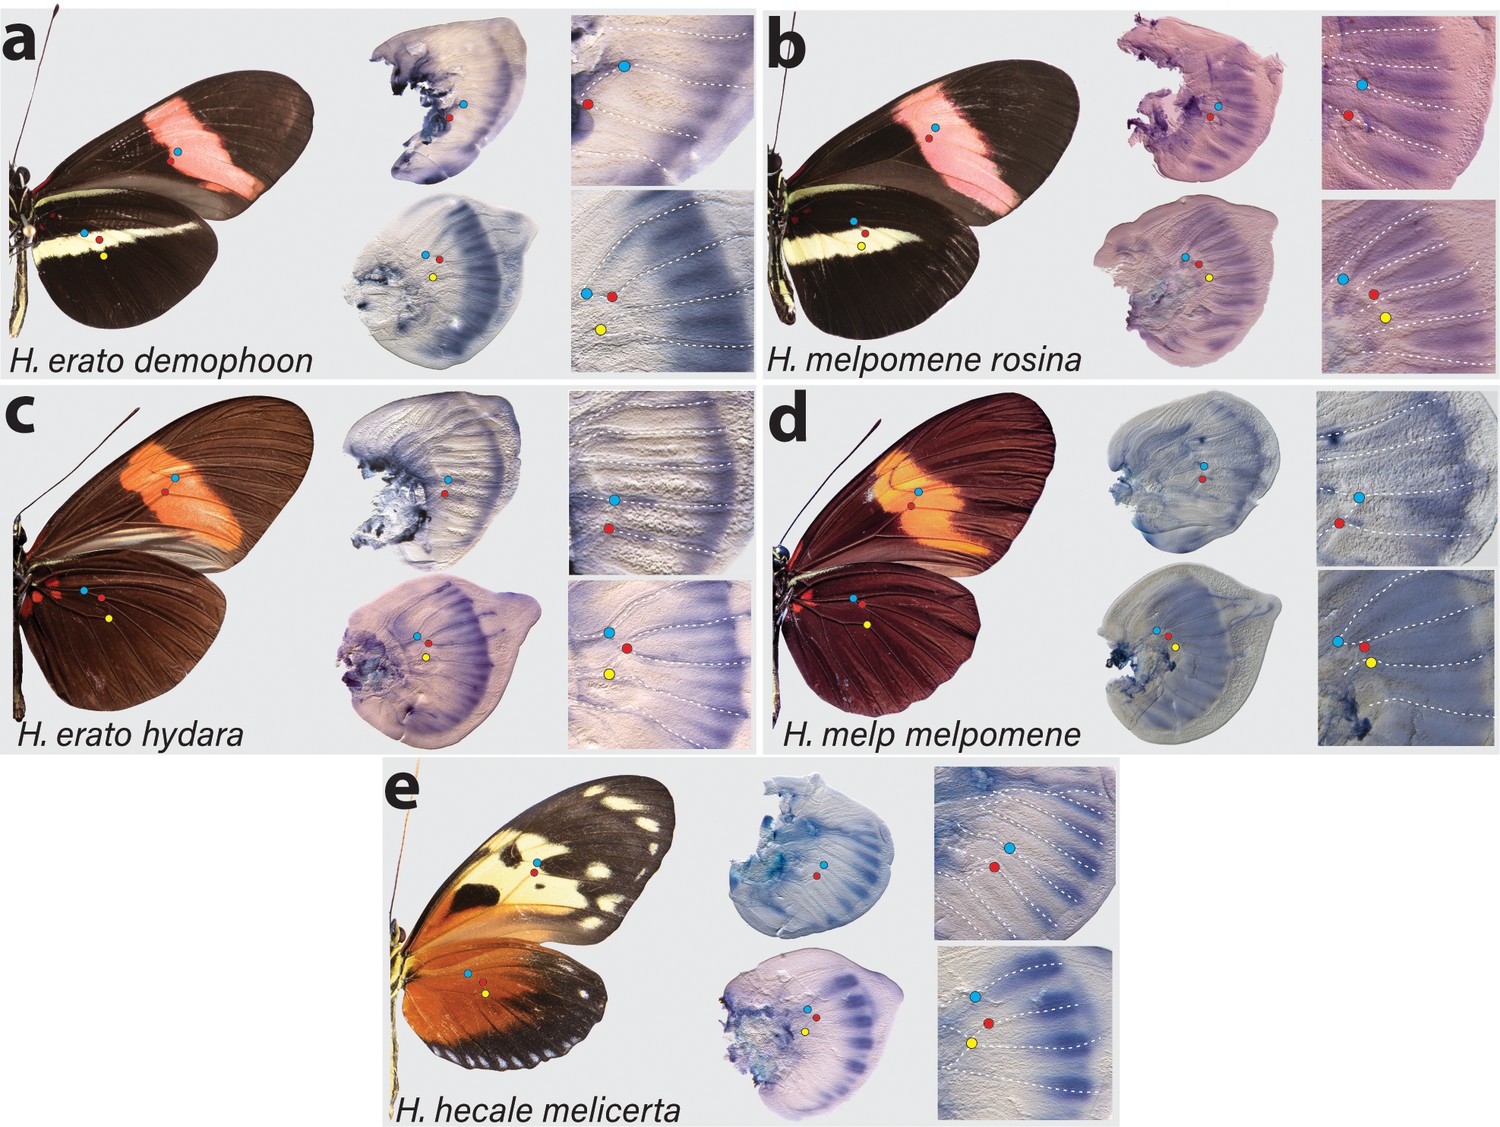
Expression of cortex transcripts in Heliconius melpomene, Heliconius erato, and Heliconius hecale fifth-instar wing discs.
Cortex expression in fifth-instar wing discs is restricted to the distal end of both forewings and hindwings in all species and morphs analysed. In H. erato, expression is strongest at the intervein midline but extends across vein compartments in H. erato demophoon (a), whereas it is more strongly localised to the intervein midline in H. erato hydara (c). In H. melpomene rosina (b), cortex localises in a similar manner to H. erato demophoon, with stronger expression again observed at the intervein midline, whereas expression in H. melpomene melpomene (d) extends more proximally. Expression in H. hecale melicerta (e) is strongest at the distal wing vein margins. Coloured dots represent homologous vein landmarks across the wings.
Figure 3—figure supplement 1
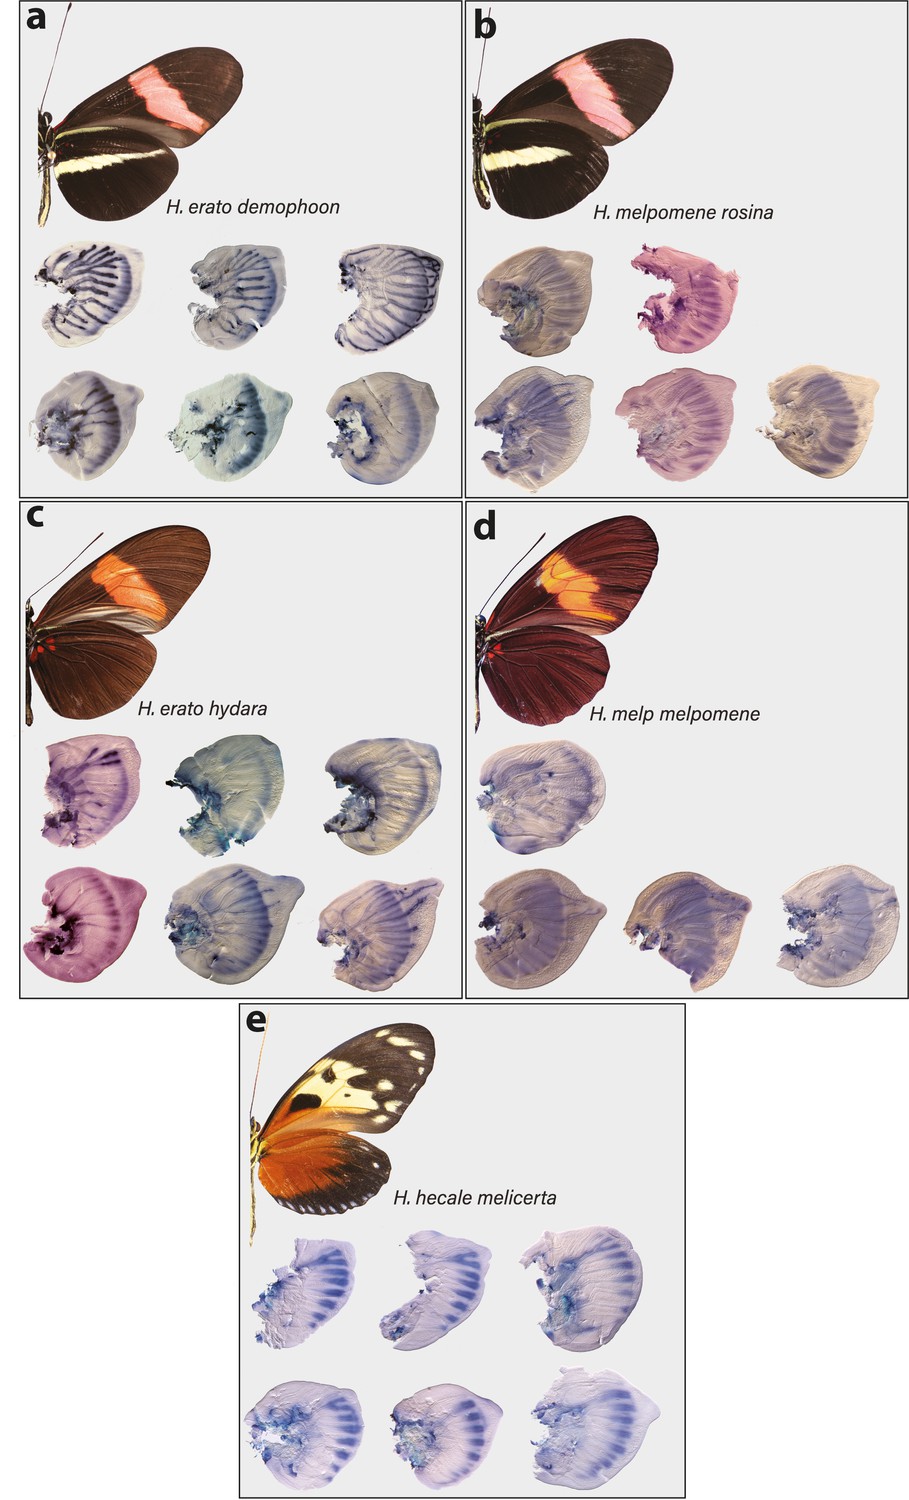
Distal expression of cortex in Heliconius fifth-instar imaginal discs.
In H. erato, cortex expression is strongest at the distal end of the wing throughout fifth-instar development, with stronger intervein expression in H. erato hydara. In H. melpomene, cortex expression extends further proximally, with expression seen throughout the wing in H. melpomene melpomene.
Figure 4 with 5 supplements
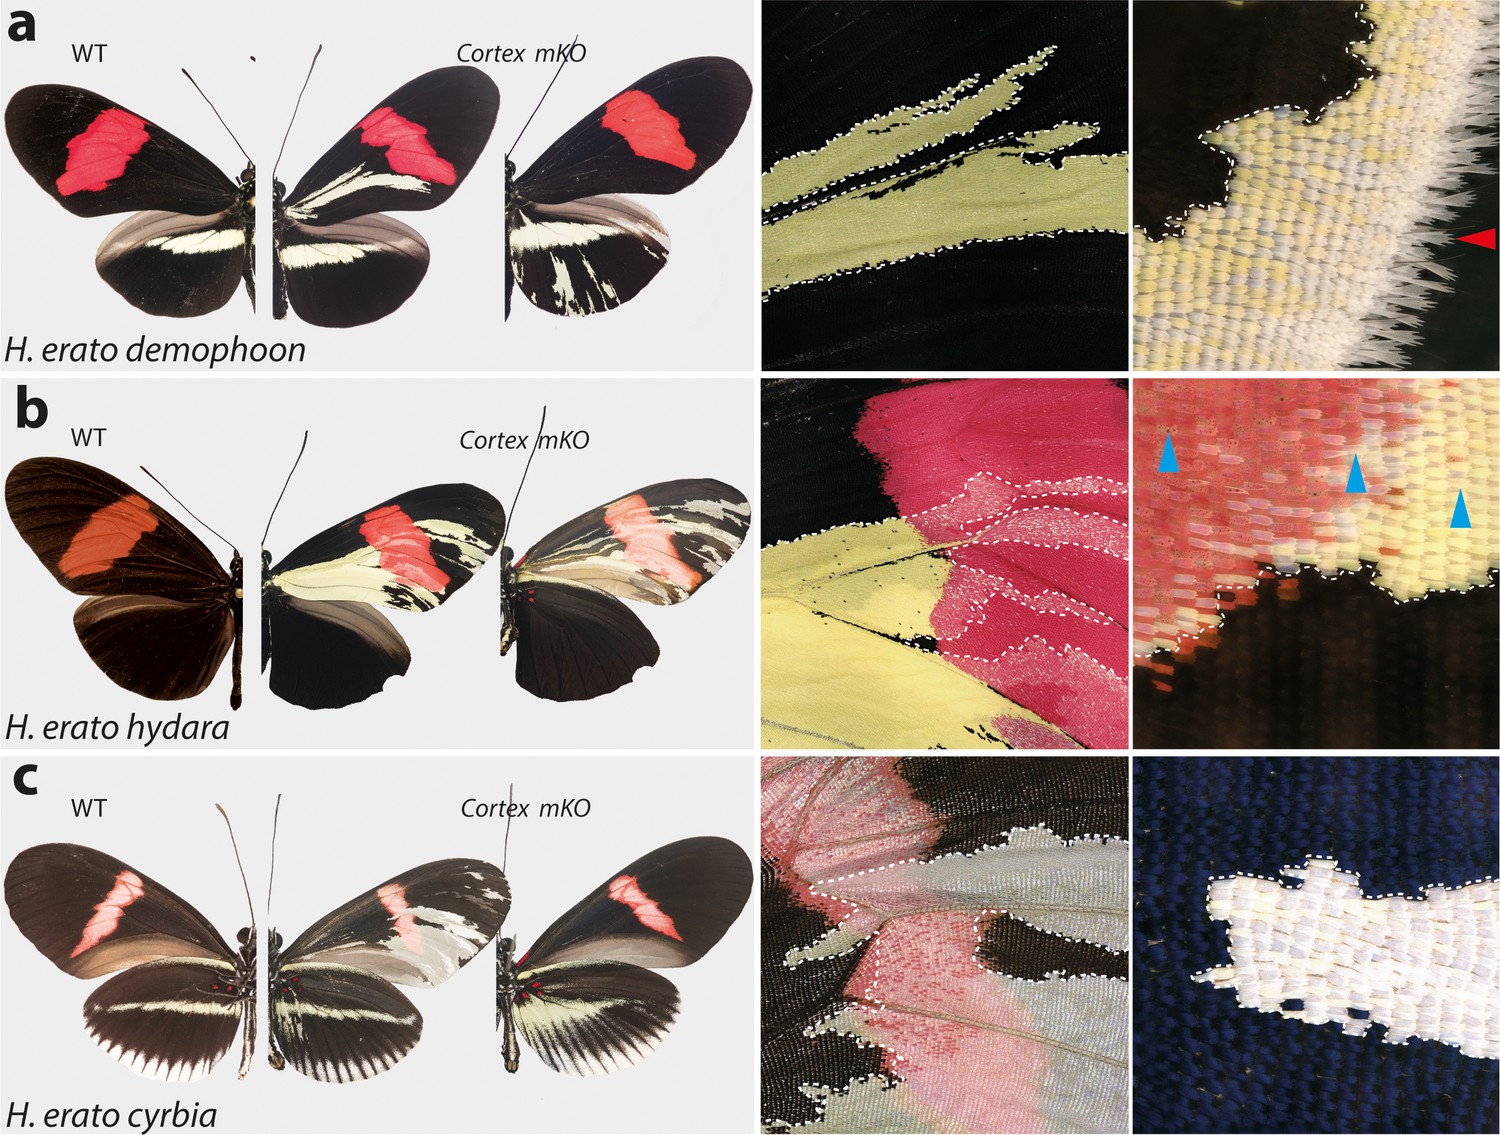
Cortex loss-of-function transforms scale identity across the entire wing surface of Heliconius erato.
Phenotypes of cortex mKO across H. erato morphs reveal a loss of melanic (Type II) and red (Type III) scales and transformation to Type I (yellow or white) scales. Affected regions are not spatially restricted and span both distal and proximal portions of forewings and hindwings. The scale transformation extends to all scale types, including the wing border scales (red arrow head in (a)), and across the red band elements, where mutant scales transform to white, as well as some showing an intermediate phenotype (blue arrow heads in (b)). A positional effect is observed in some morphs, where ectopic Type I scales are either white or yellow depending on their position along the wing (H. erato cyrbia, (c)). Ectopic Type I scales can be induced from both melanic and red scales, switching to either white or yellow depending on wing position and morph. Boundaries between Wild-type (WT) to mutant scales are highlighted (dotted white line).
-
Figure 4—source data 1
CRISPR experiments and guides used per species/morph.
- https://cdn.elifesciences.org/articles/68549/elife-68549-fig4-data1-v1.xlsx
-
Figure 4—source data 2
Sequences for guides yielding successful phenotypes and associated genotyping primers.
- https://cdn.elifesciences.org/articles/68549/elife-68549-fig4-data2-v1.xlsx
Figure 4—figure supplement 1
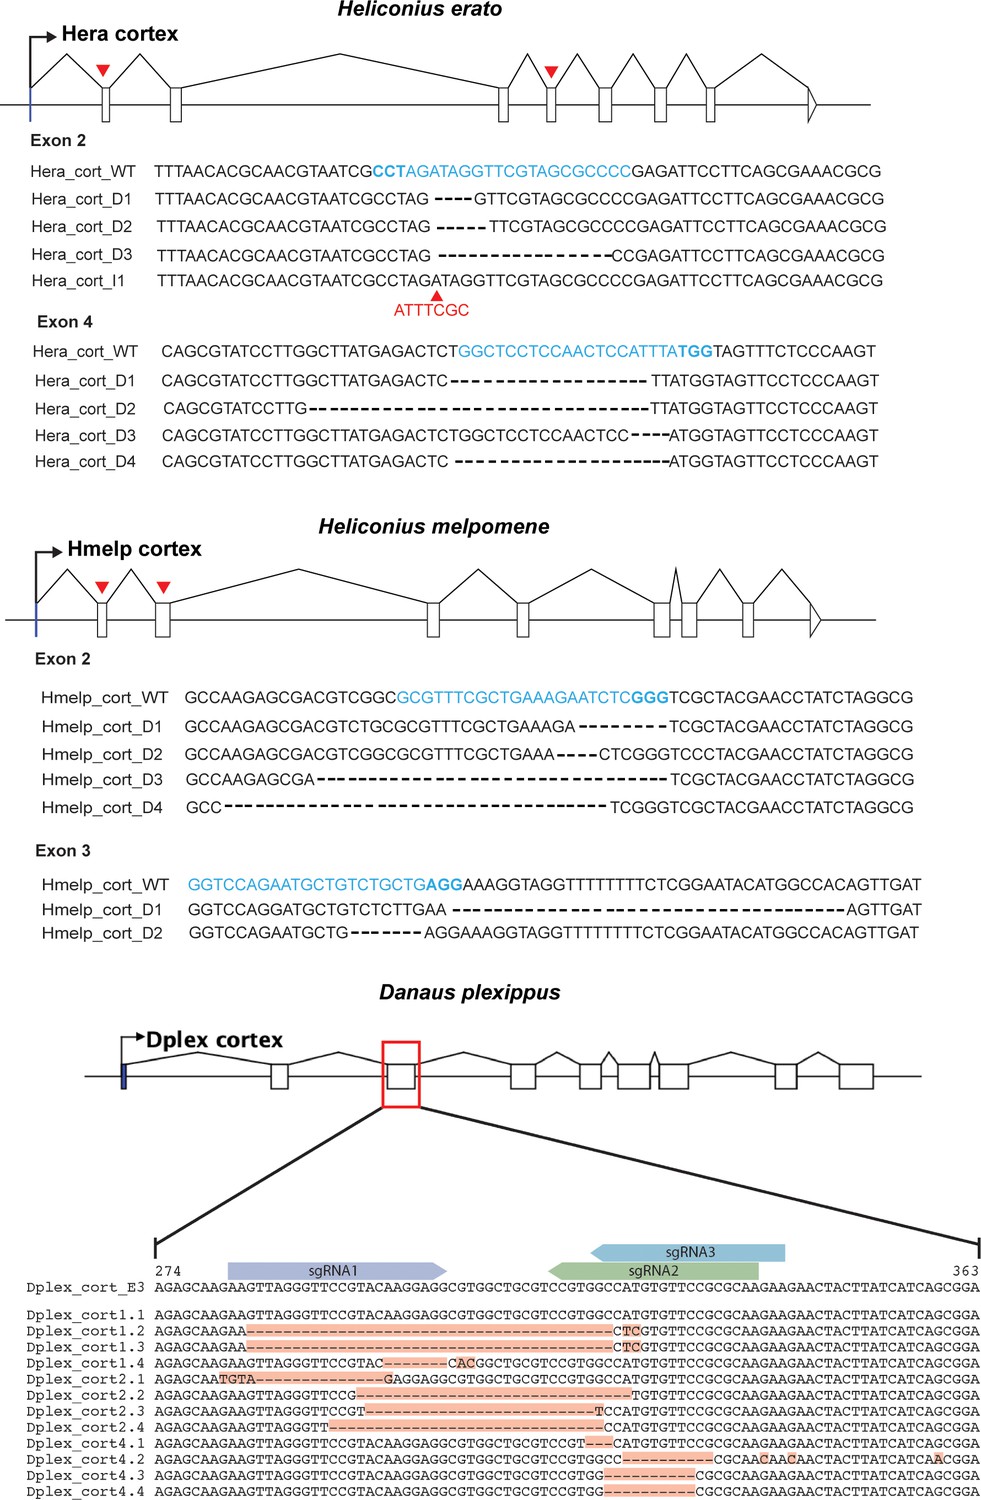
CRISPR mutagenesis confirmed through sanger sequencing.
Gene models for cortex are shown for both H. erato, H. melpomene and D. plexippus. Red arrows indicate positions of sgRNAs that were genotyped in CRISPR experiments. Recovered sequences showing evidence of editing as a result of CRISPR mutagenesis are shown. Target sequences are shown in blue and PAM site highlighted in bold. For H. erato exon 2, we recovered a sequence containing a 7 bp insertion (indicated with red arrowhead, I2).
Figure 4—figure supplement 2
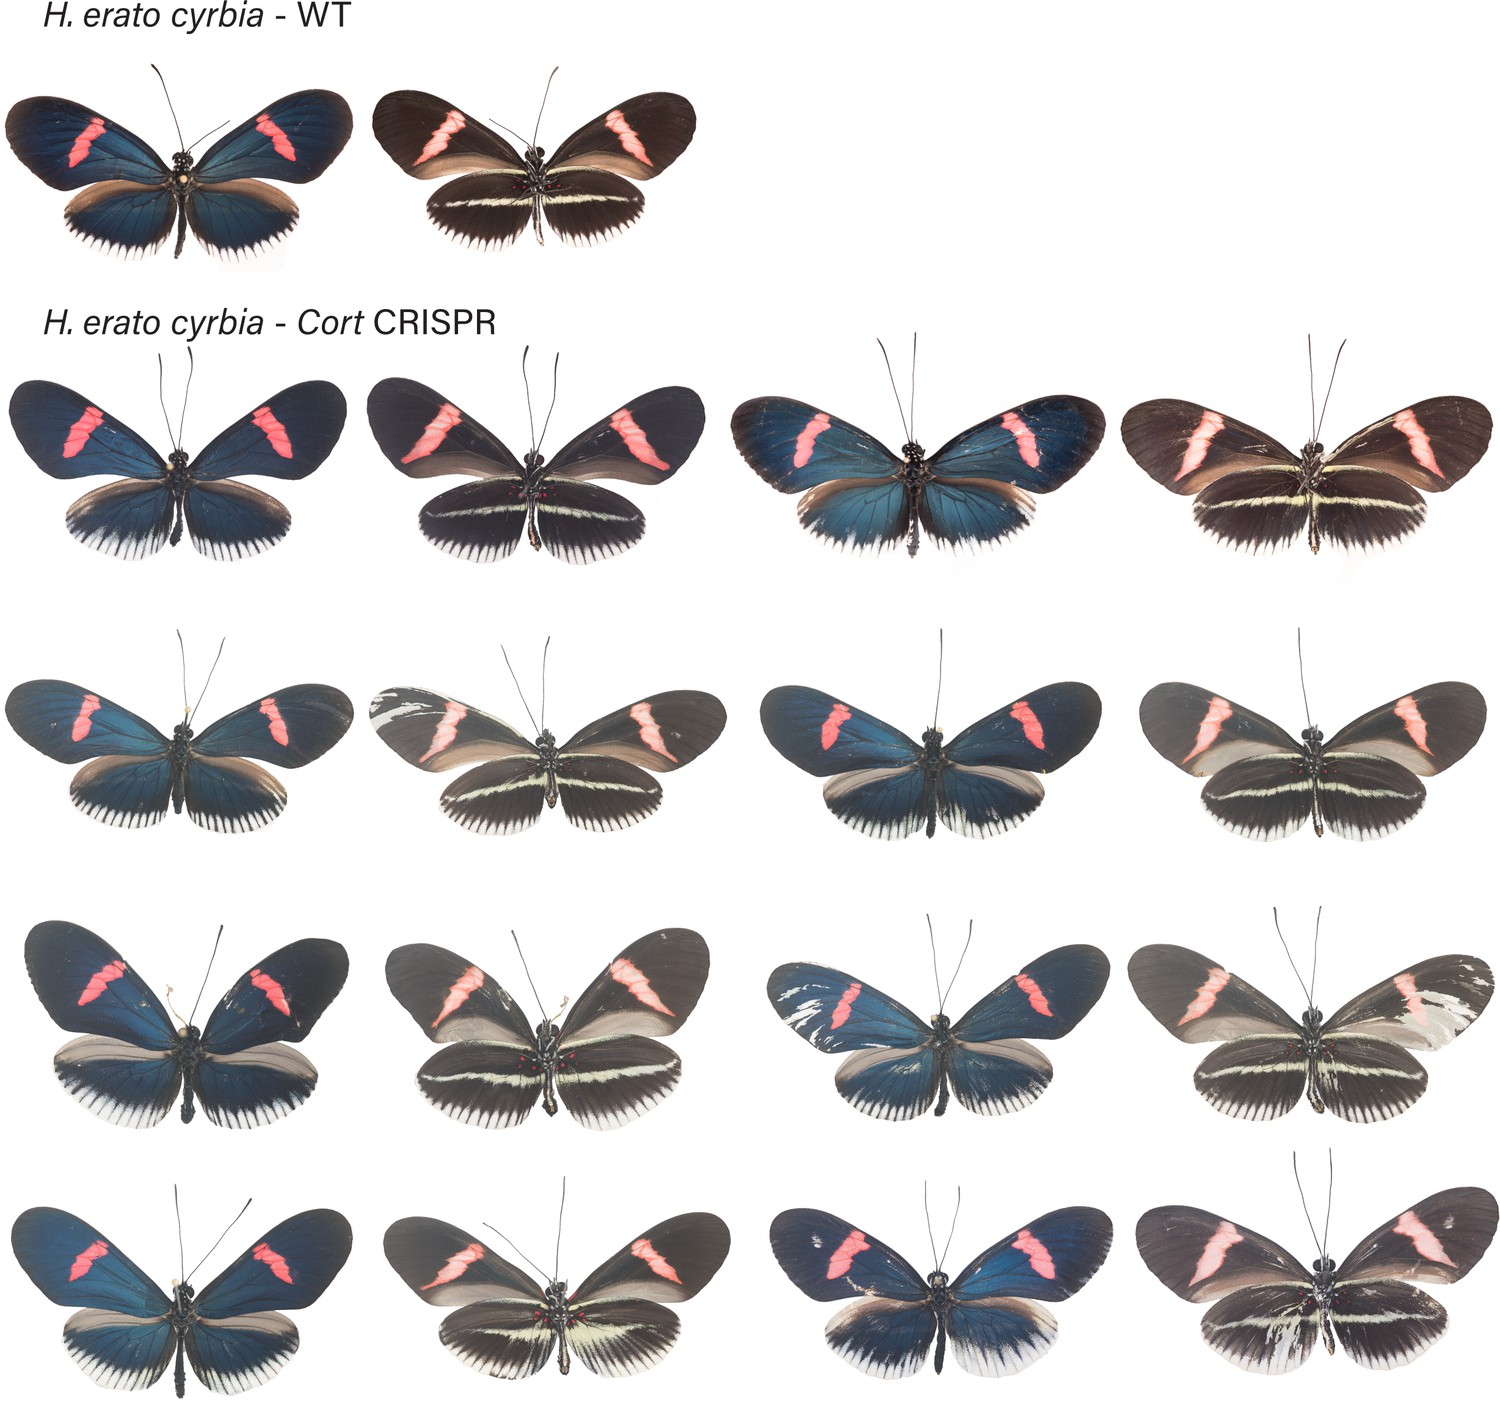
H. erato cyrbia wild-type (WT), alongside cortex mKO individuals recovered in CRISPR experiments.
Dorsal and ventral sides shown for each mutant.
Figure 4—figure supplement 3
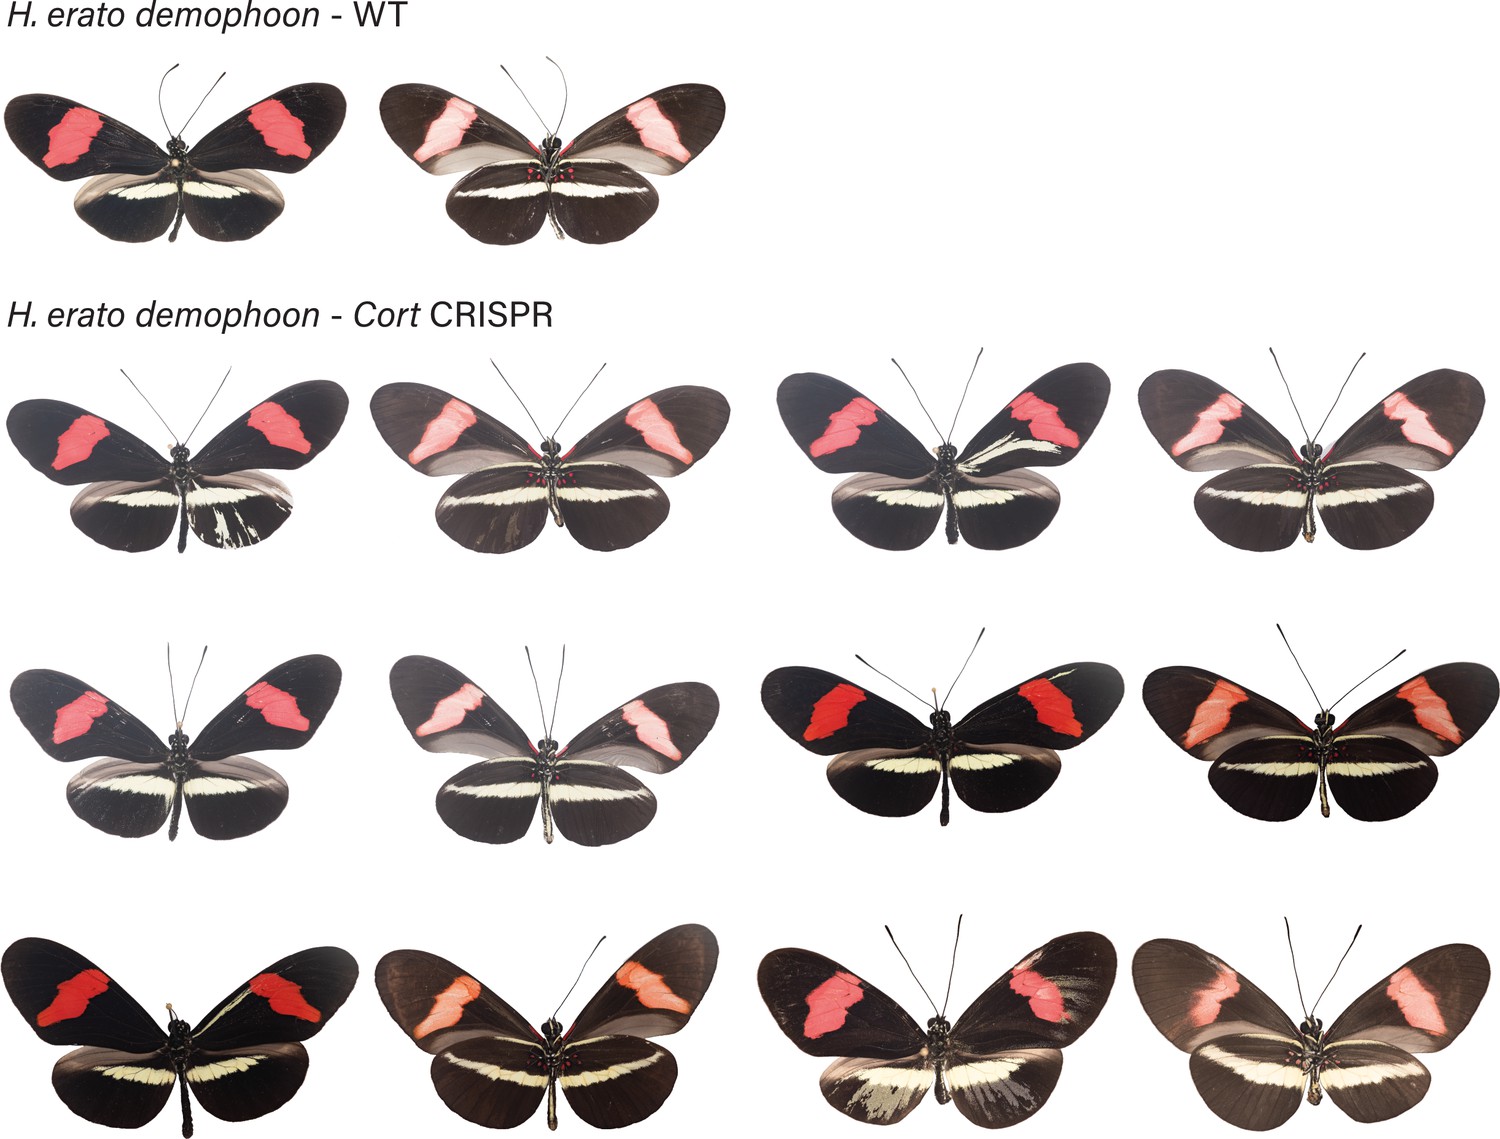
H. erato demophoon wild-type (WT), alongside cortex mKO individuals recovered in CRISPR experiments.
Dorsal and ventral sides shown for each mutant.
Figure 4—figure supplement 4
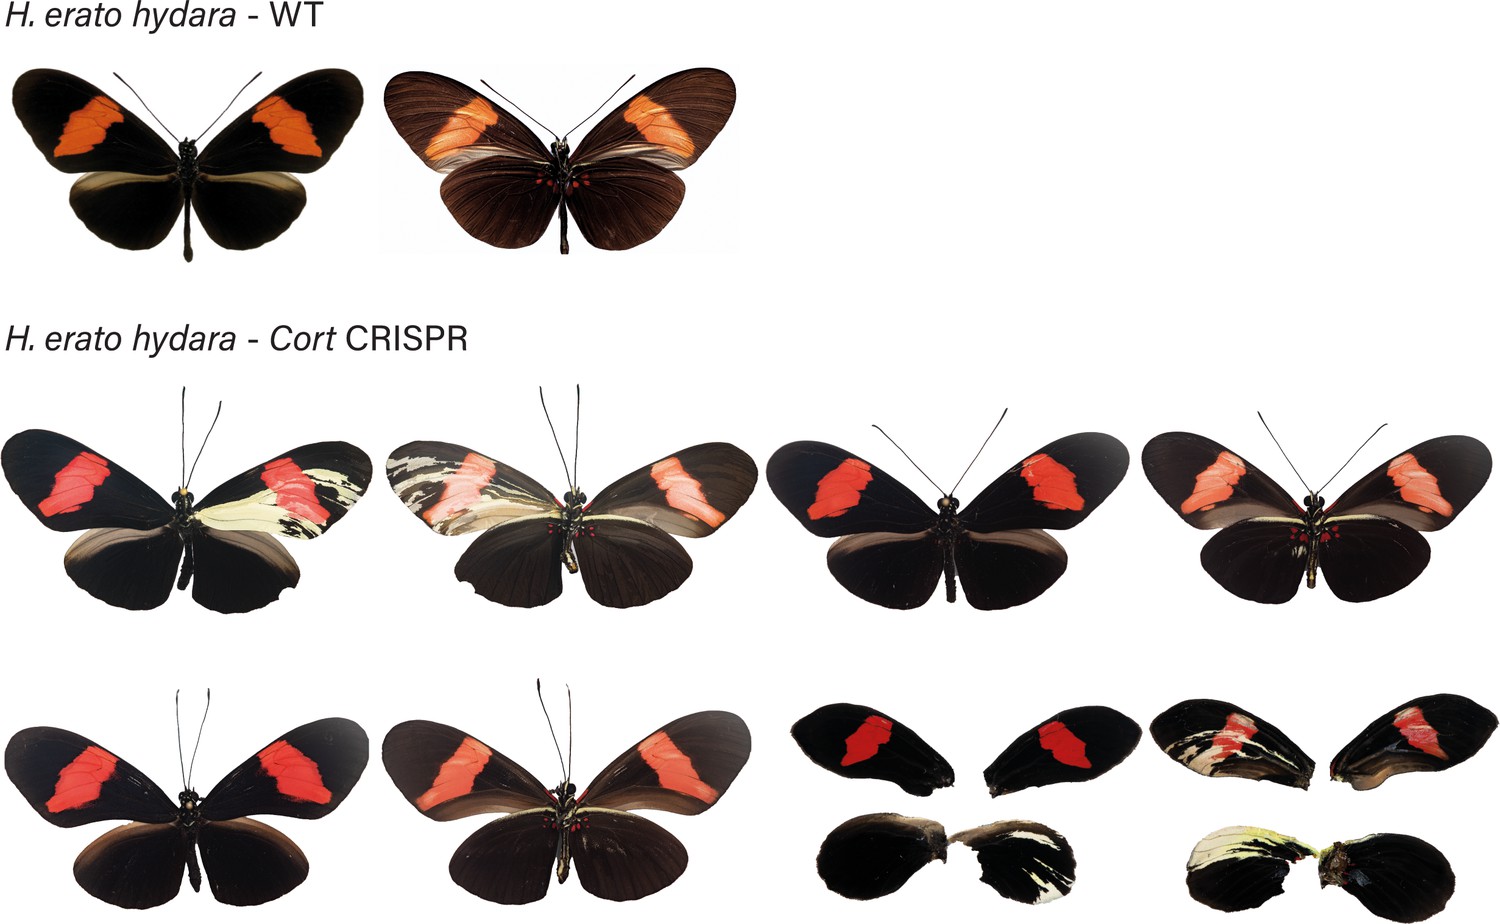
H. erato hydara wild-type (WT), alongside cortex mKO individuals recovered in CRISPR experiments.
Dorsal and ventral sides shown for each mutant.
Figure 4—figure supplement 5
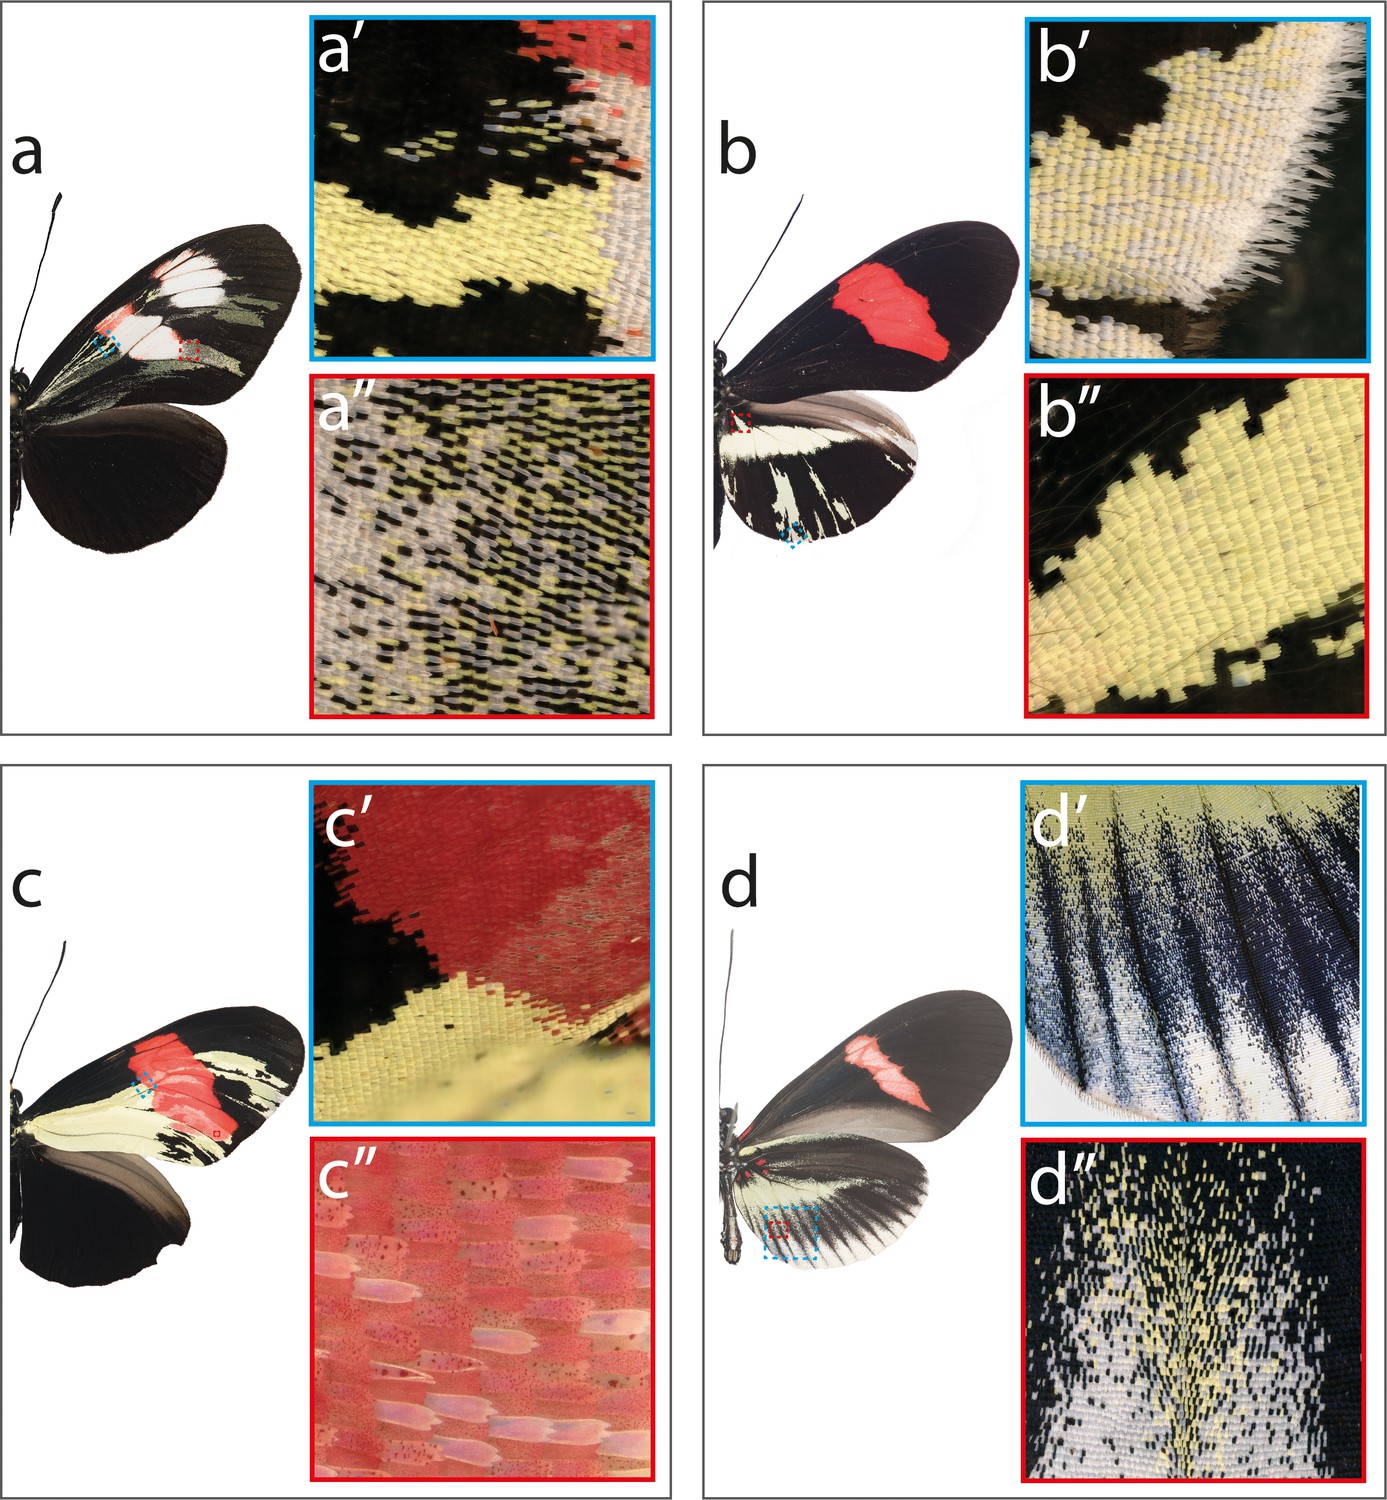
Mutant close-ups illustrating variety of effects caused by cortex mKO.
(a) H. melpomene plesseni showing mutant clones across proximal forewing (a’) as we as more distal areas, where cover scales are more affected (a’’). (b) H. erato demophoon showing cortex mKO effects on elongated border scales (b’), and scale located anterior to yellow bar element (b’’). (c) H. erato hydara showing clones extending into forewing red band (c’) and asymmetric deposition of red pigment across the affected red band region (c’’). (d) H. erato cyrbia illustrates positional effect of cortex mKO where posterior hindwing scales shift to white, while anterior scales shift to yellow (d’and d’’).
Figure 5 with 5 supplements
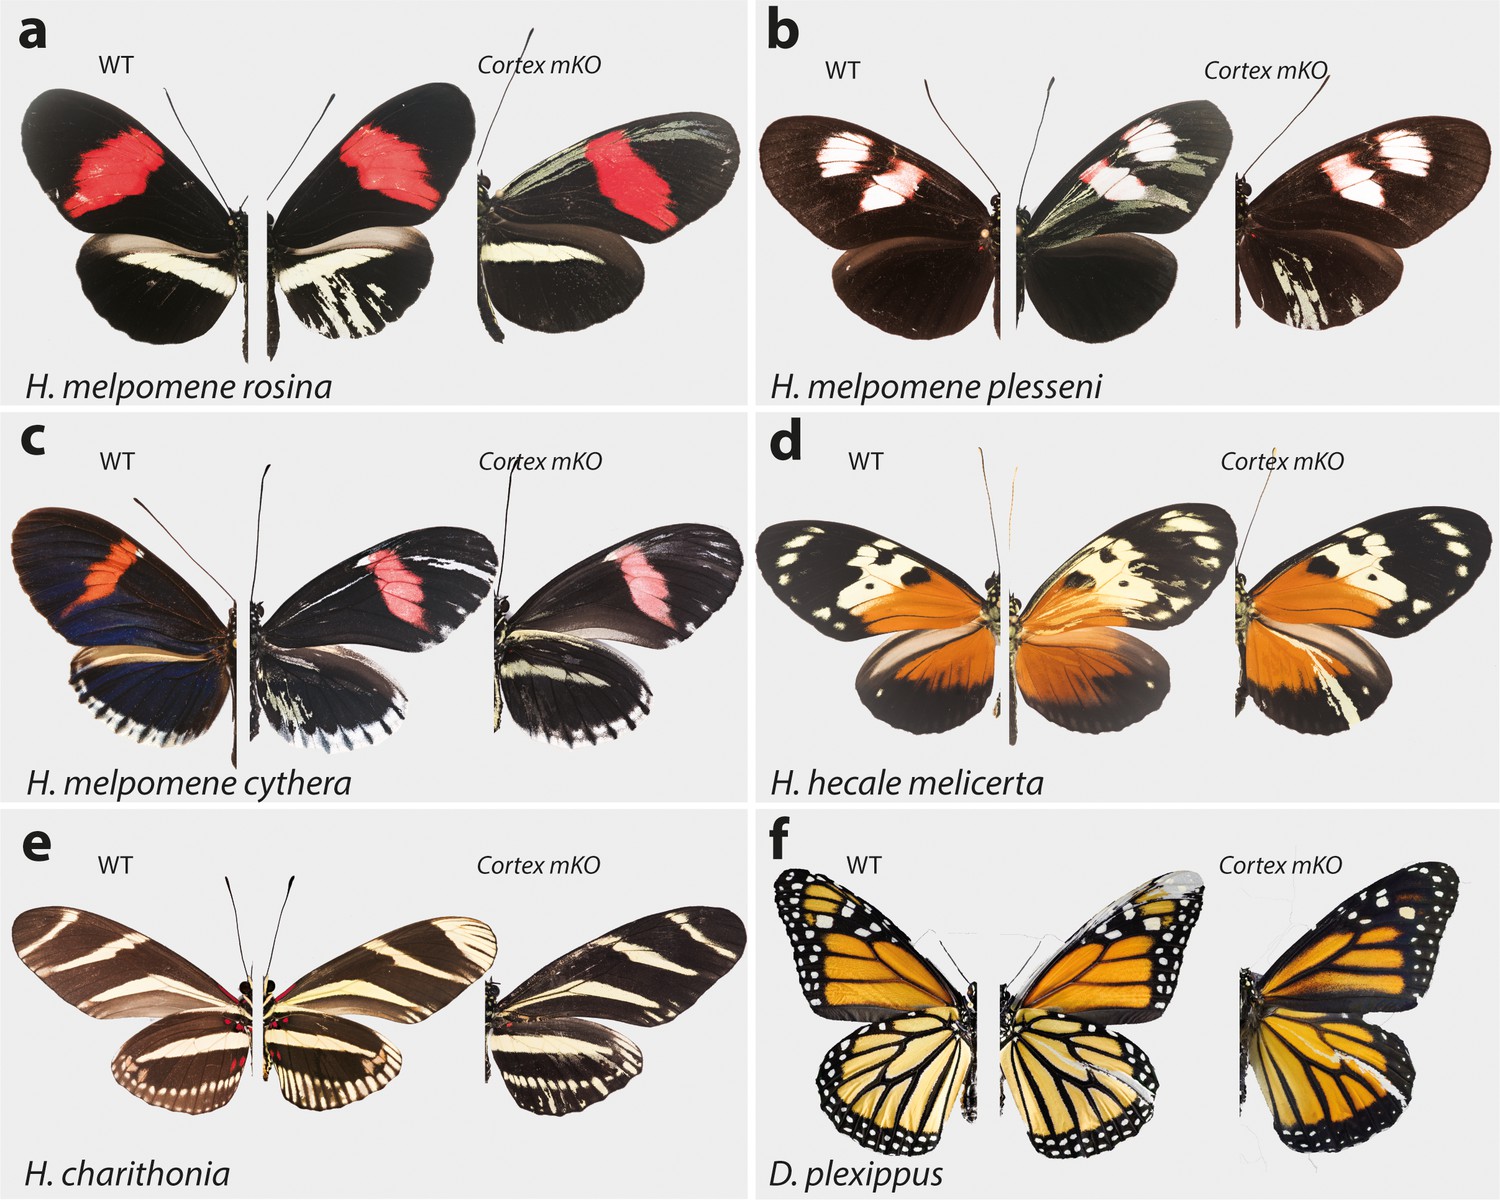
Cortex function is conserved across Heliconius and Nymphalids Phenotypes of cortex mKO across H. melpomene colour pattern morphs.
(a–c) reveal cortex has a conserved function in switching scale cell fates, as in H. erato. This function is also conserved in outgroups to H. melpomene and H. erato (H. hecale melicerta and H. charithonia respectively (d–e)) as well as in distantly diverged nymphalids (D. plexippus (f)). Left; wild-type, middle and right; cortex mKO.
Figure 5—figure supplement 1
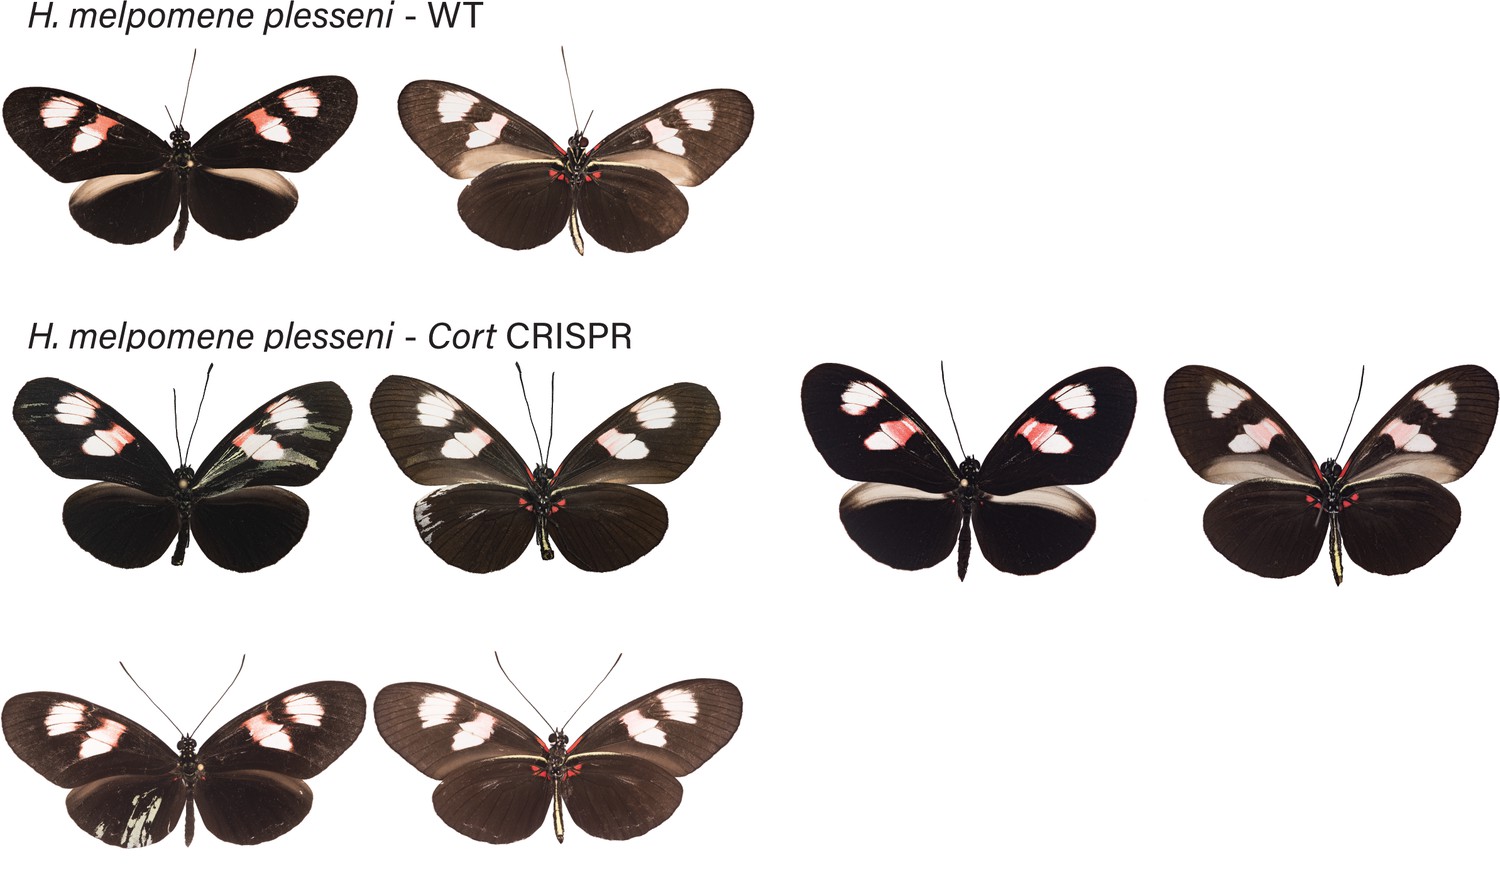
H. melpomene plesseni wild-type (WT), alongside cortex mKO individuals recovered in CRISPR experiments.
Dorsal and ventral sides shown for each mutant.
Figure 5—figure supplement 2
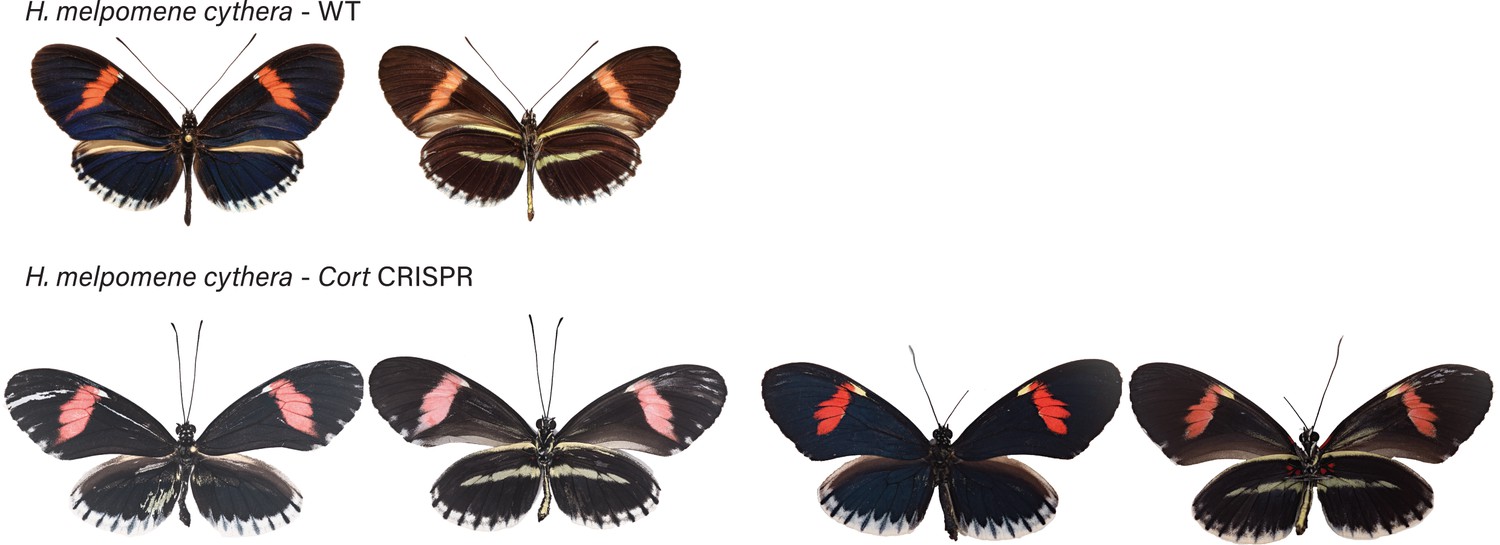
H. melpomene cythera wild-type (WT), alongside cortex mKO individuals recovered in CRISPR experiments.
Dorsal and ventral sides shown for each mutant.
Figure 5—figure supplement 3
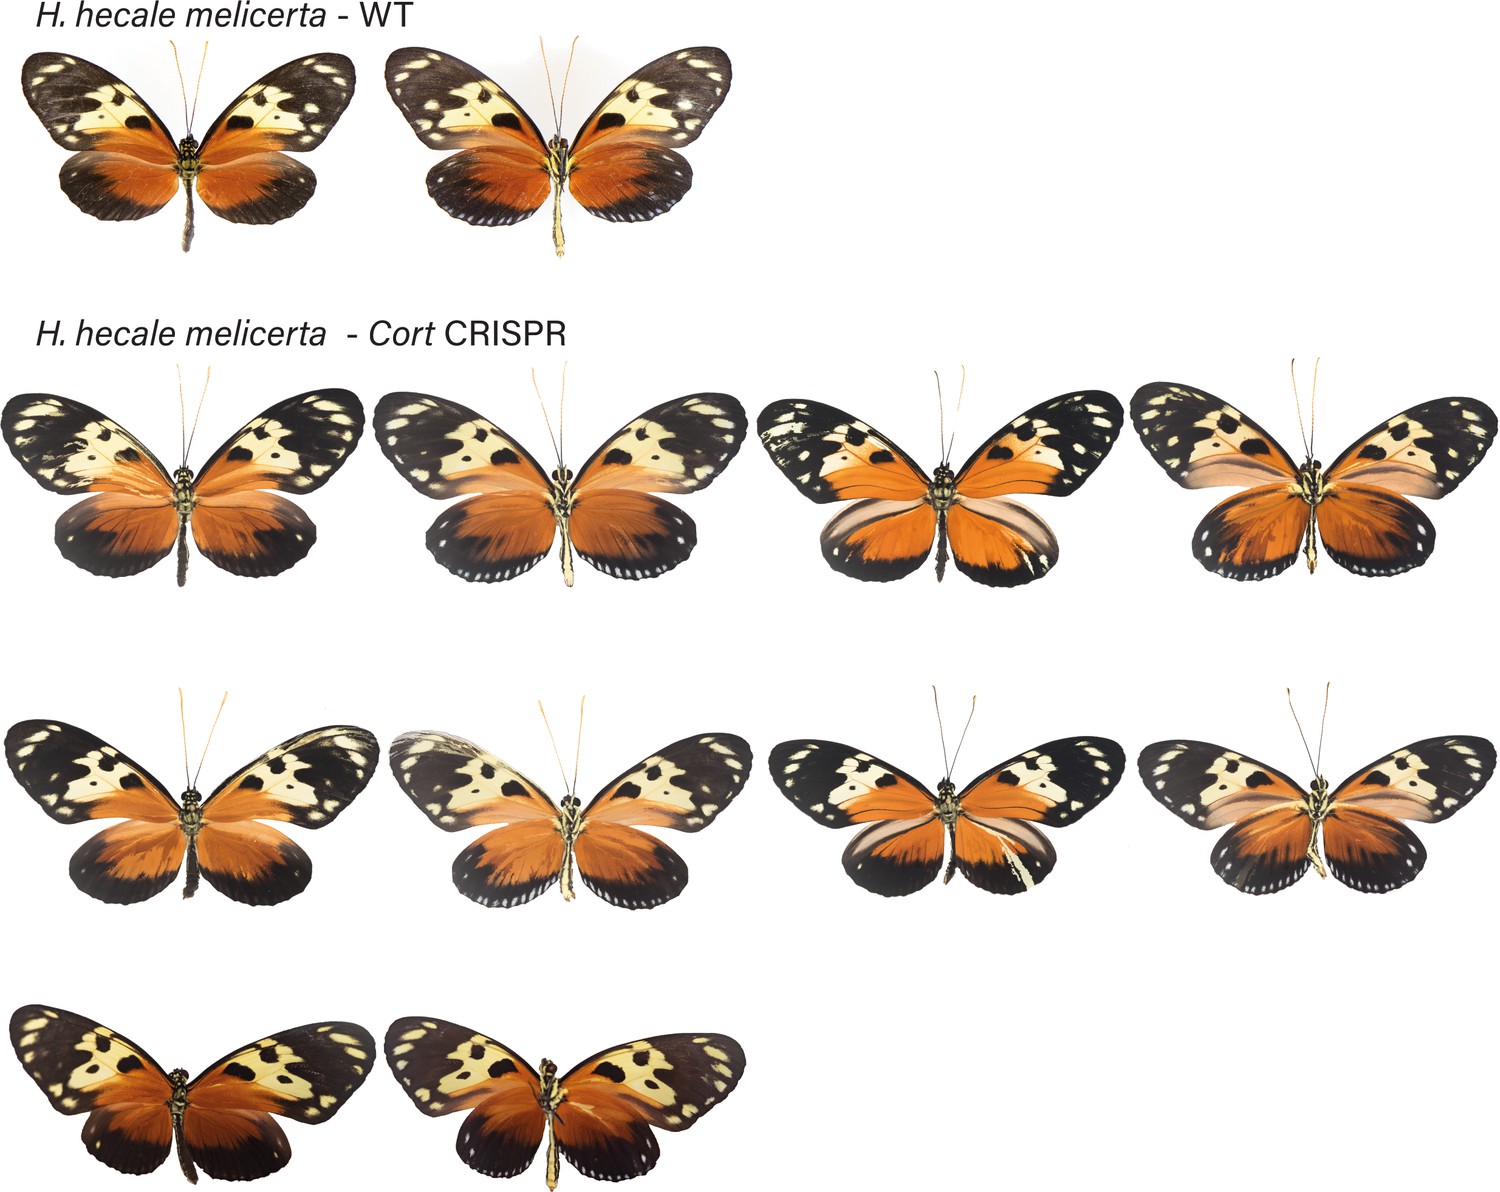
H. hecale melicerta wild-type (WT), alongside cortex mKO individuals recovered in CRISPR experiments.
Dorsal and ventral sides shown for each mutant.
Figure 5—figure supplement 4
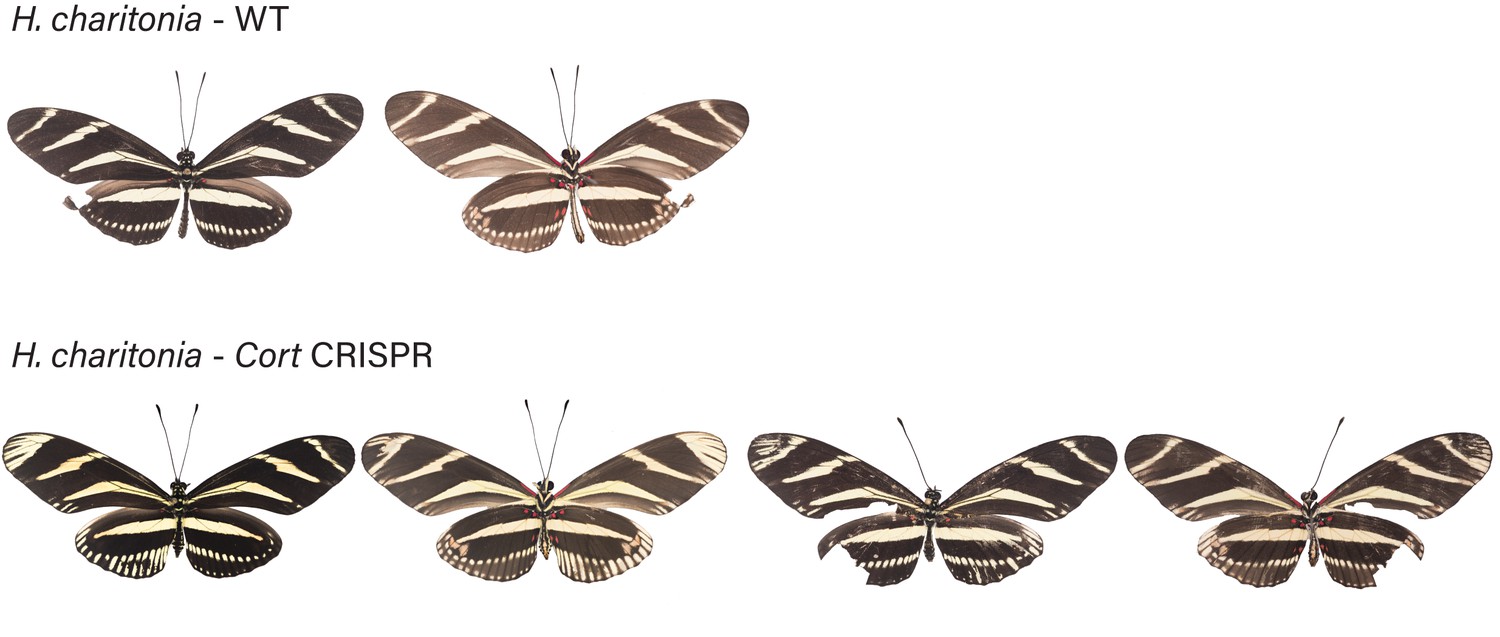
H. charithonia wild-type (WT), alongside cortex mKO individuals recovered in CRISPR experiments.
Dorsal and ventral sides shown for each mutant.
Figure 5—figure supplement 5
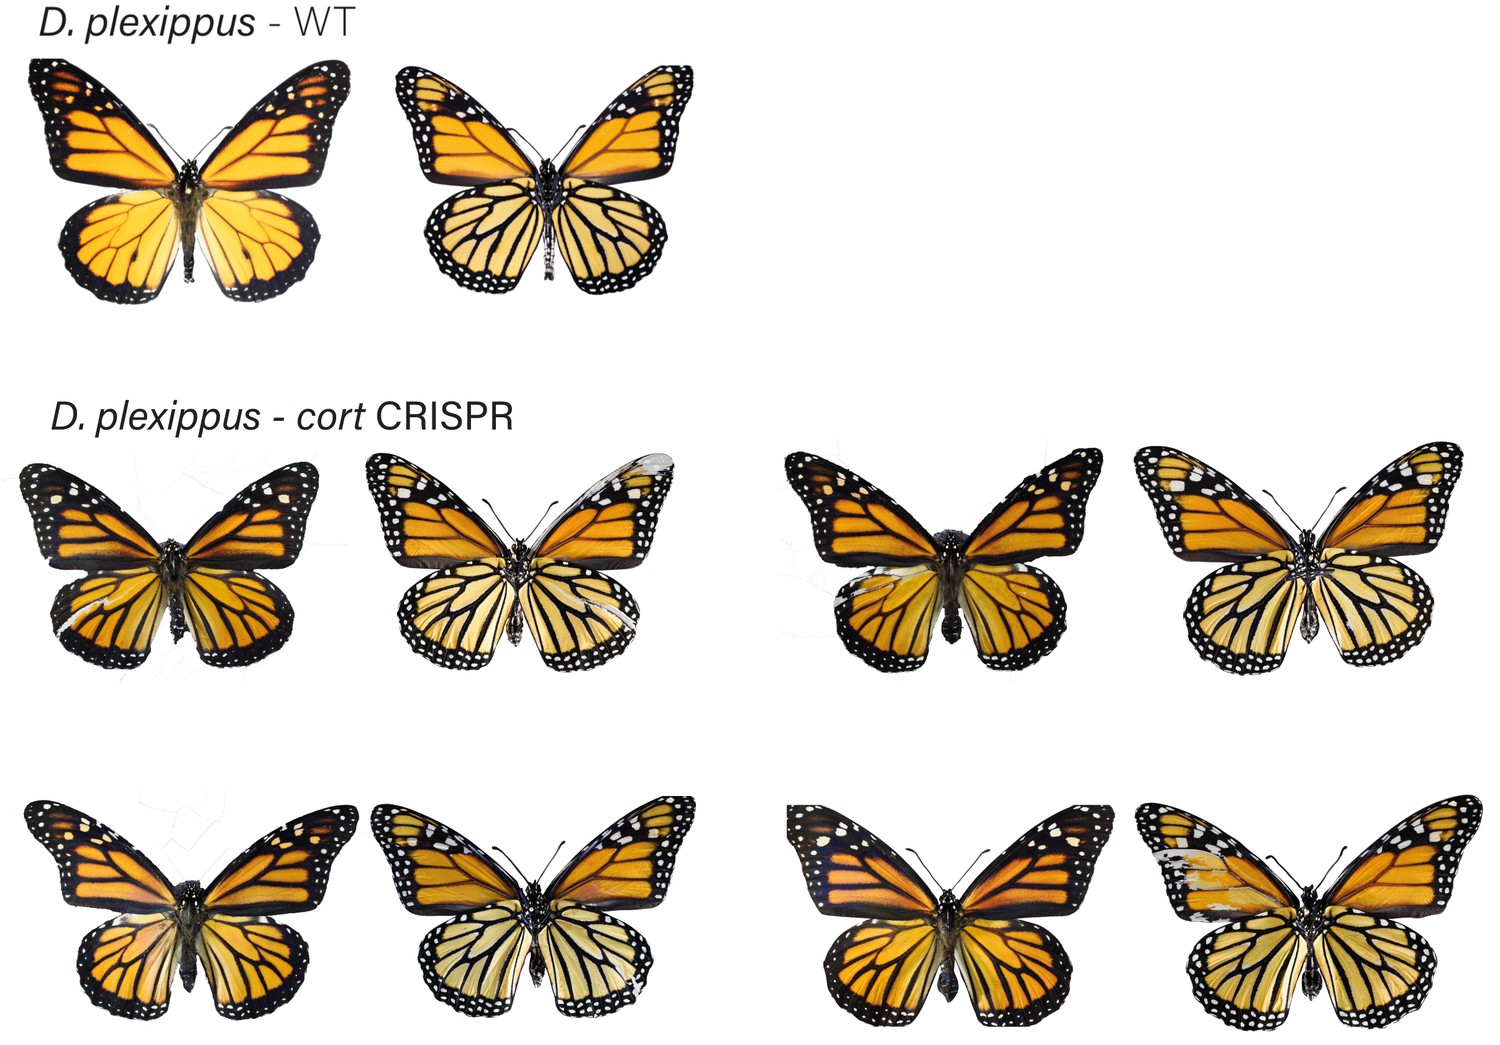
Danaus plexippus wild-type (WT), alongside cortex CRE mKO individuals recovered in CRISPR experiments.
Dorsal and ventral sides shown for each mutant.
Figure 6 with 1 supplement

Cortex protein localises across the wings in H. erato demophoon.
Antibody stainings reveal Cortex protein is localised at the distal intervein midline in fifth-instar wing discs (yellow arrowheads) (a). At 24 hr APF, the protein is detected across the wing and localised strongly to the cell nuclei (b). This localisation continues at 72 hr APF(c) and 80 APF (d). In each panel, leftmost insert shows nuclei stained with DAPI (magenta), middle insert with Cortex antibody detected with a secondary alexa-fluor 555 conjugated antibody (red), and right insert shows both channels merged into a composite image. No appreciable difference in localisation is detected across presumptive pattern elements at 72 hr APF (e). The magnified portion of the imaged wing is indicated in the wing cartoon in the top left corner of ( e).
Figure 6—figure supplement 1
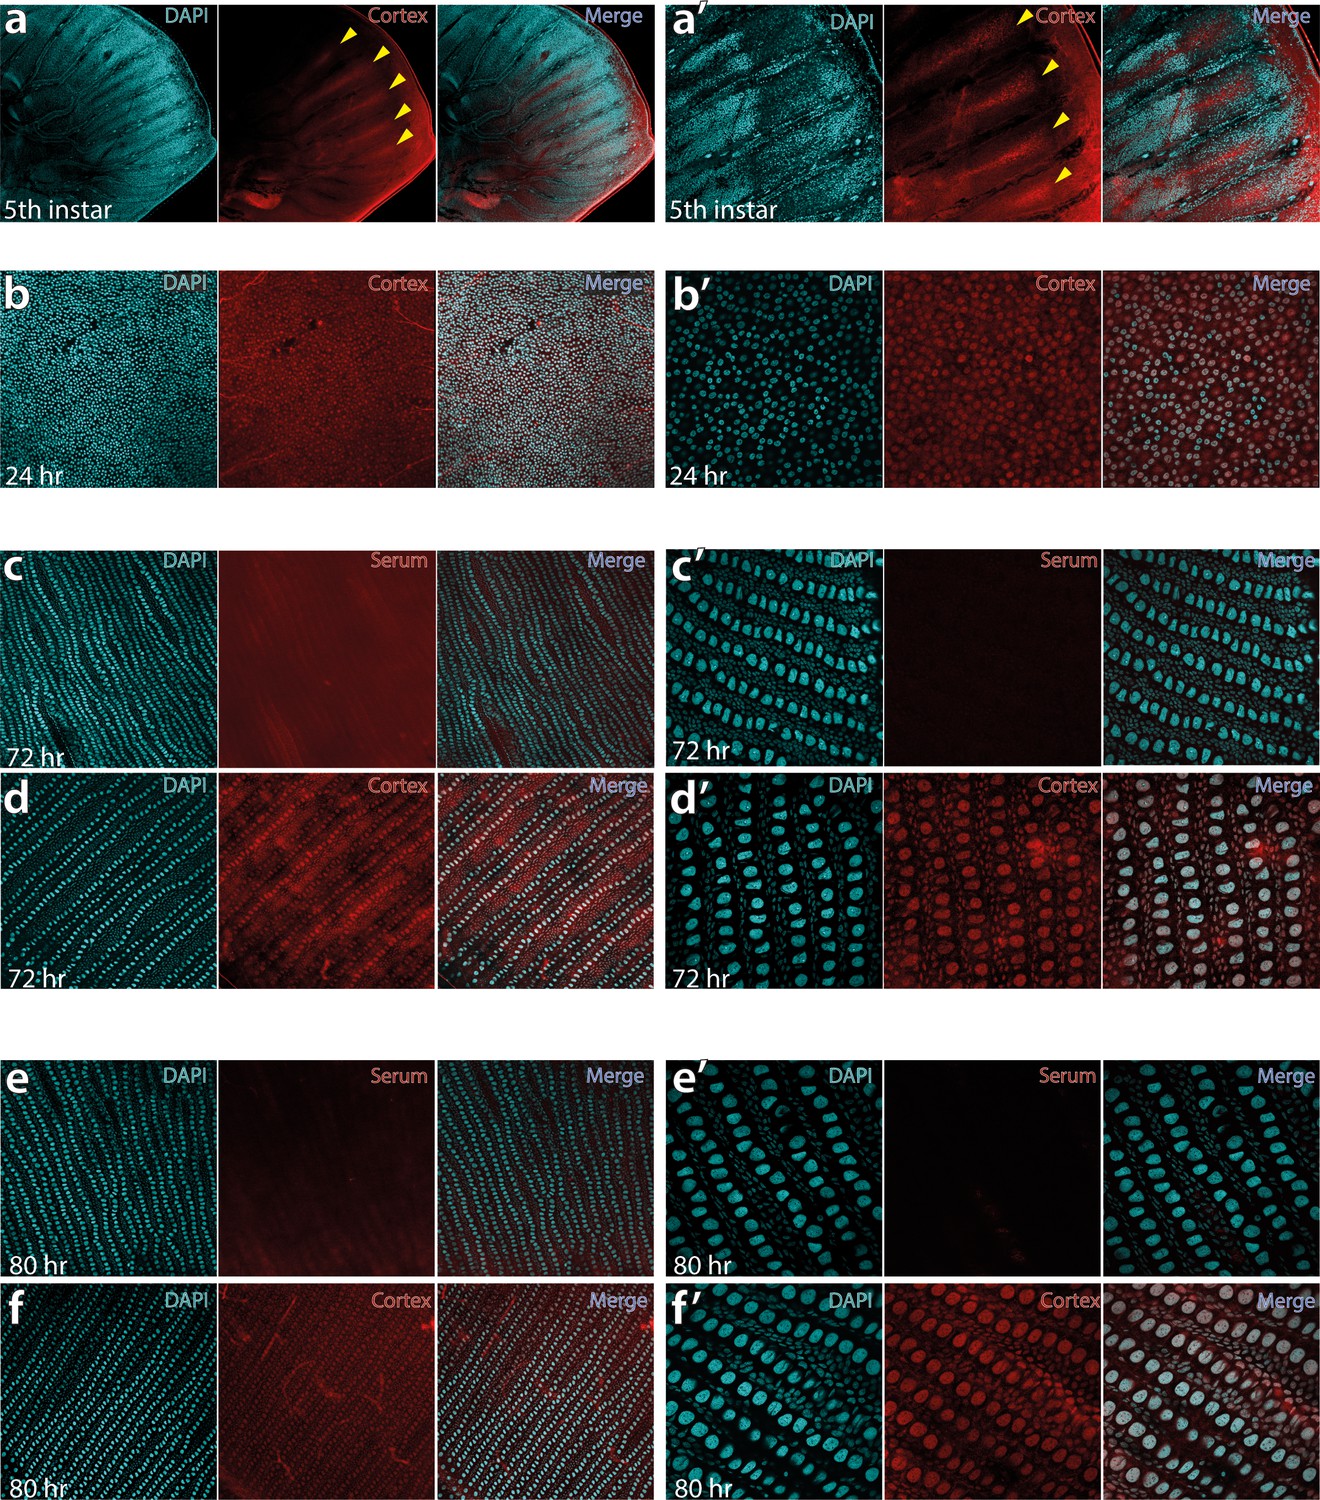
Fifth-instar larval wing disc showing intervein localisation of Cortex protein at 10× (a) and 30× magnification of the same area (a’).
Pupal wings sampled at 24 hr post-pupation at 20× magnification (b) and 60× magnification (b’) show nuclear localisation of Cortex protein. At this stage, the hexagonal organisation of future scale cells is apparent, with the middle cell eventually differentiating into the scale cell. Pupal wings were stained with a negative control using the pre-immune serum at 72 hr, shown at 20× (c) and 60× (c’), reveal no evidence of nuclear signal. Using the same confocal settings with Cortex antibody at 72 hr reveals nuclear localisation at 30x magnification (d) and 60× magnification (d’). The nuclear staining is also absent in control serum samples at 80 hr post-pupation (e and e’), with nuclear localisation persisting in Cortex antibody incubated samples at 80 hr post-pupation (f and f’).
Figure 7 with 5 supplements
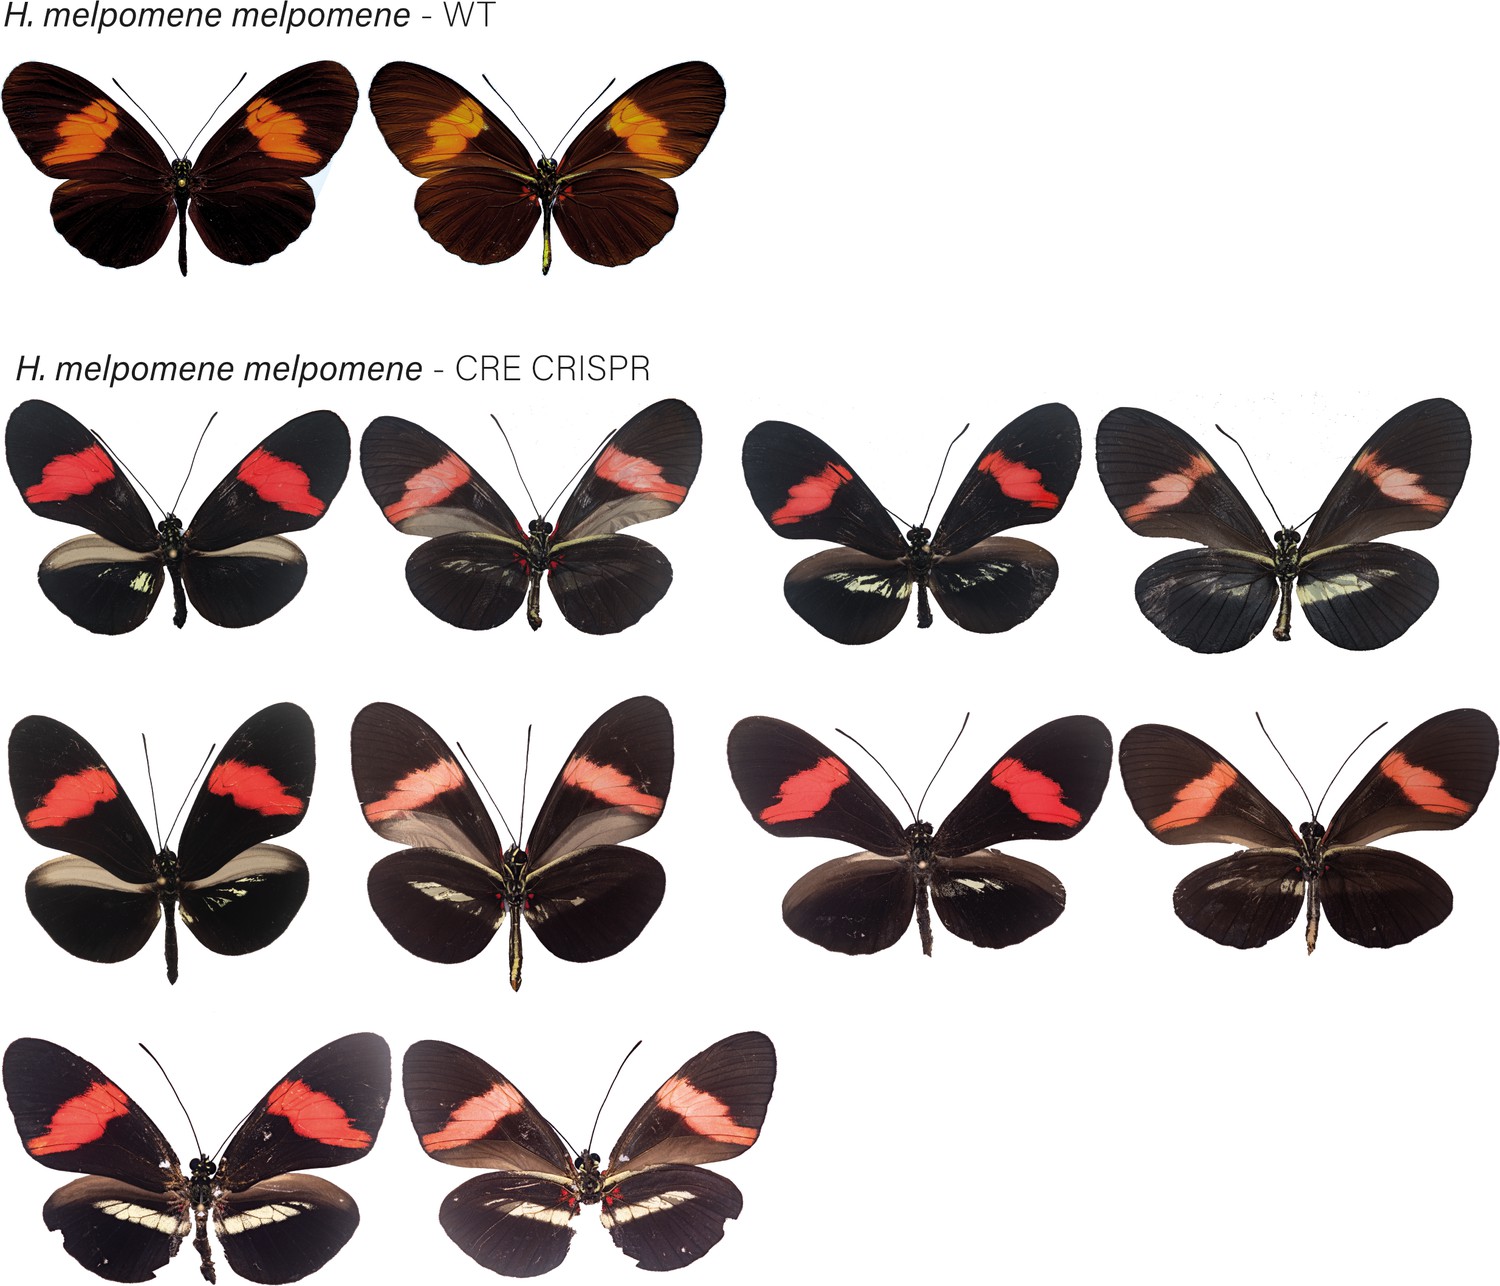
Modular CREs control the presence of the yellow band in Heliconius melpomene and Heliconius erato.
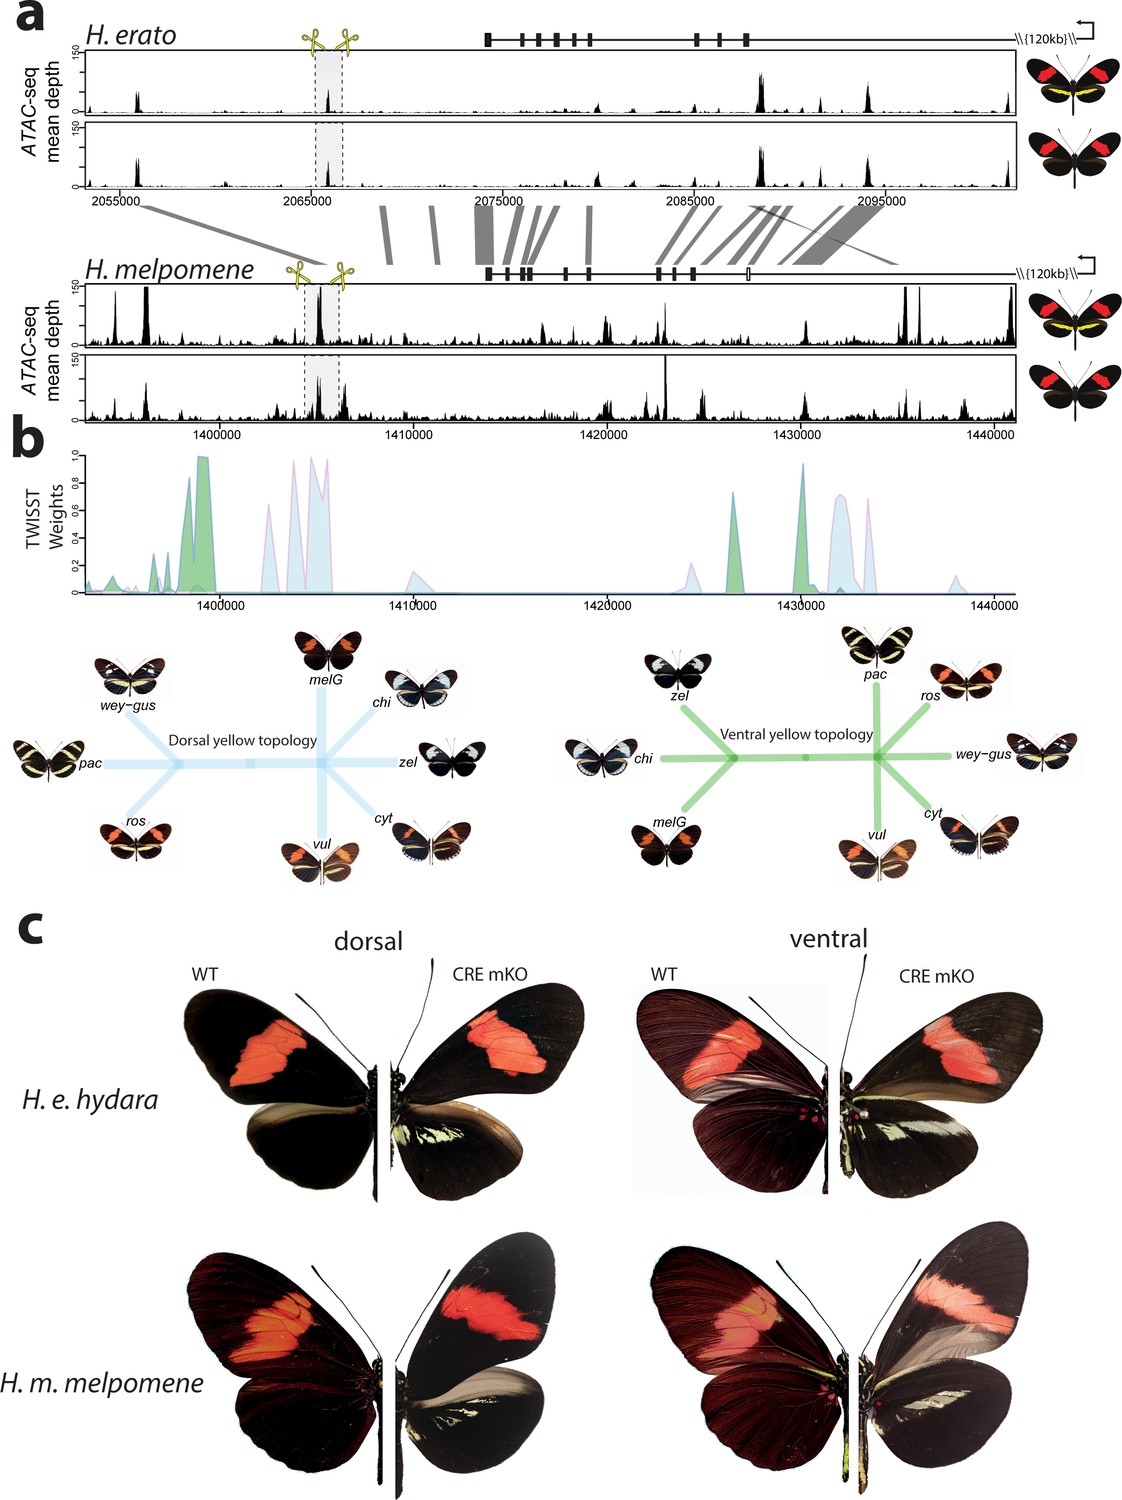
(a) Chromatin accessibility as measured by mean sequence depth for ATAC-seq traces in H. erato (top) and H. melpomene (bottom) in fifth-instar caterpillar hindwings in yellow banded and black morphs. The gene model for cortex is shown above the traces (black rectangles are coding exons, white rectangle non-coding exon, lines are introns, direction of transcription is indicated by an arrow). The transcription start site is around 120 kb from the first coding exon of cortex. Positions of sgRNAs used for peak excision are shown (yellow scissors). Regions with >75% sequence identity between H. melpomene and H. erato are indicated by grey lines. (b) Twisst analysis results showing high genetic association for the presence of a yellow bar in H. melpomene populations with a ventral (ventral topology) or dorsal (dorsal topology) yellow bar. Abbreviations for twisst morphs: wey-gus = H. cydno weymeri-gustavi, chi = H. cydno chioneus, zel = H. cydno zelinde, pac = H. pachinus, ros = H. melpomene rosina, melG = H. melpomene melpomene French Guiana, vul = H. melpomene vulcanus, cyt = H. melpomene cythera. (c) Cortex loss-of-function at the yellow bar CREs affect scales only in the presumptive yellow bar region. CRE KO affects both dorsal (left) and ventral (right) hindwings.
-
Figure 7—source data 1
List of ATAC-seq samples used in this study, and corresponding accession numbers.
- https://cdn.elifesciences.org/articles/68549/elife-68549-fig7-data1-v1.docx
Figure 7—figure supplement 1
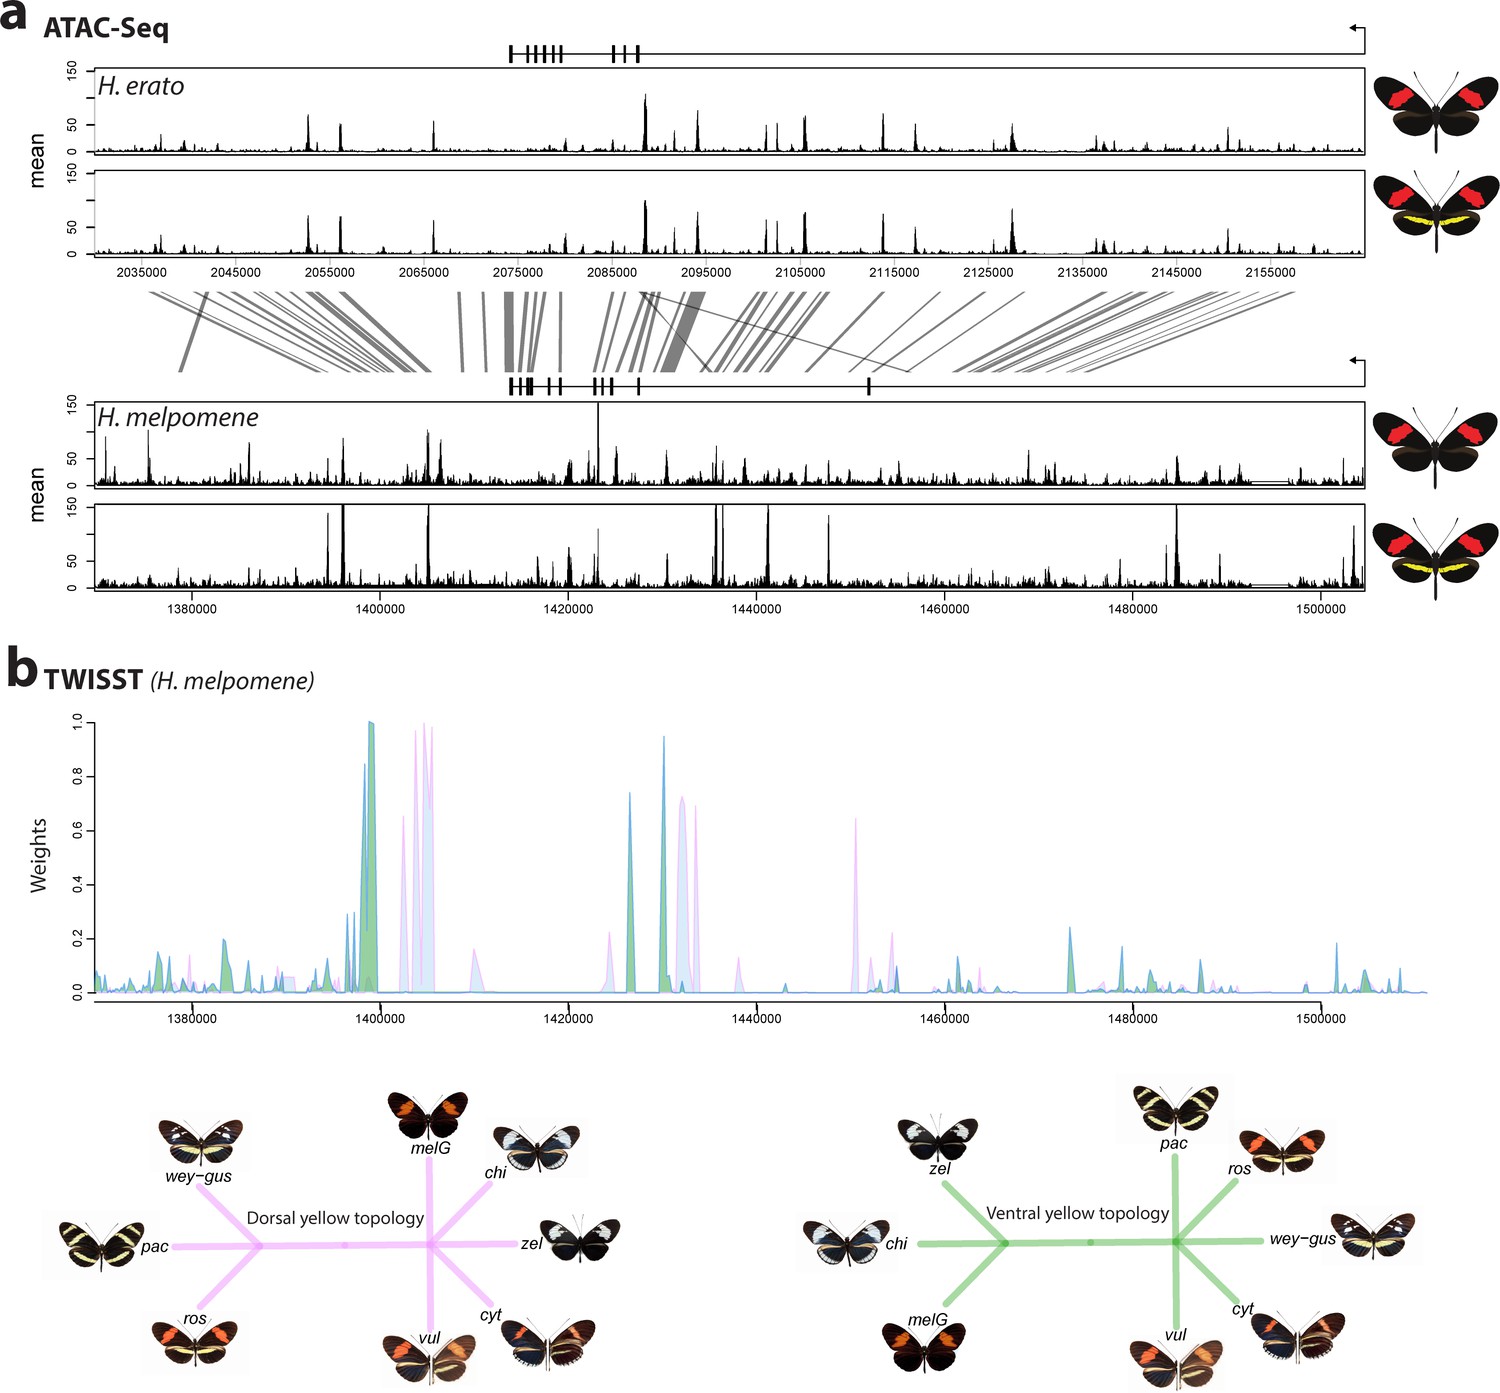
The cortex locus is characterised by many accessible chromatin peaks as revealed by ATAC-seq.
Mean sequence depth for ATAC-Seq traces in H.erato (top) and H. melpomene (bottom) in fifth-instar caterpillar hindwings in yellow banded and black morphs. The gene model for cortex is shown above the traces (black rectangles are coding exons, lines are introns, direction of transcription is indicated by an arrow). 95% sequence identity between H. melpomene and H.erato is indicated by grey lines. (b) Twisst analysis results showing high support for the presence of a yellow bar in H.melpomene populations with a ventral (ventral topology) or dorsal (dorsal topology) yellow bar. Tree topologies used to calculate weightings are shown. Abbreviations for twisst morphs: wey-gus = H. cydno weymeri-gustavi, chi = H. cydno chioneus, zel = H. cydno zelinde, pac = H. pachinus, ros = H. melpomene rosina, vul = H. melpomene vulcanus, cyt = H. melpomene cythera, melG = H. melpomene melpomene (French Guiana).
Figure 7—figure supplement 2
H. melpomene melpomene wild-type (WT), alongside cortex CRE mKO individuals recovered in CRISPR experiments.
Dorsal and ventral sides shown for each mutant.
Figure 7—figure supplement 3
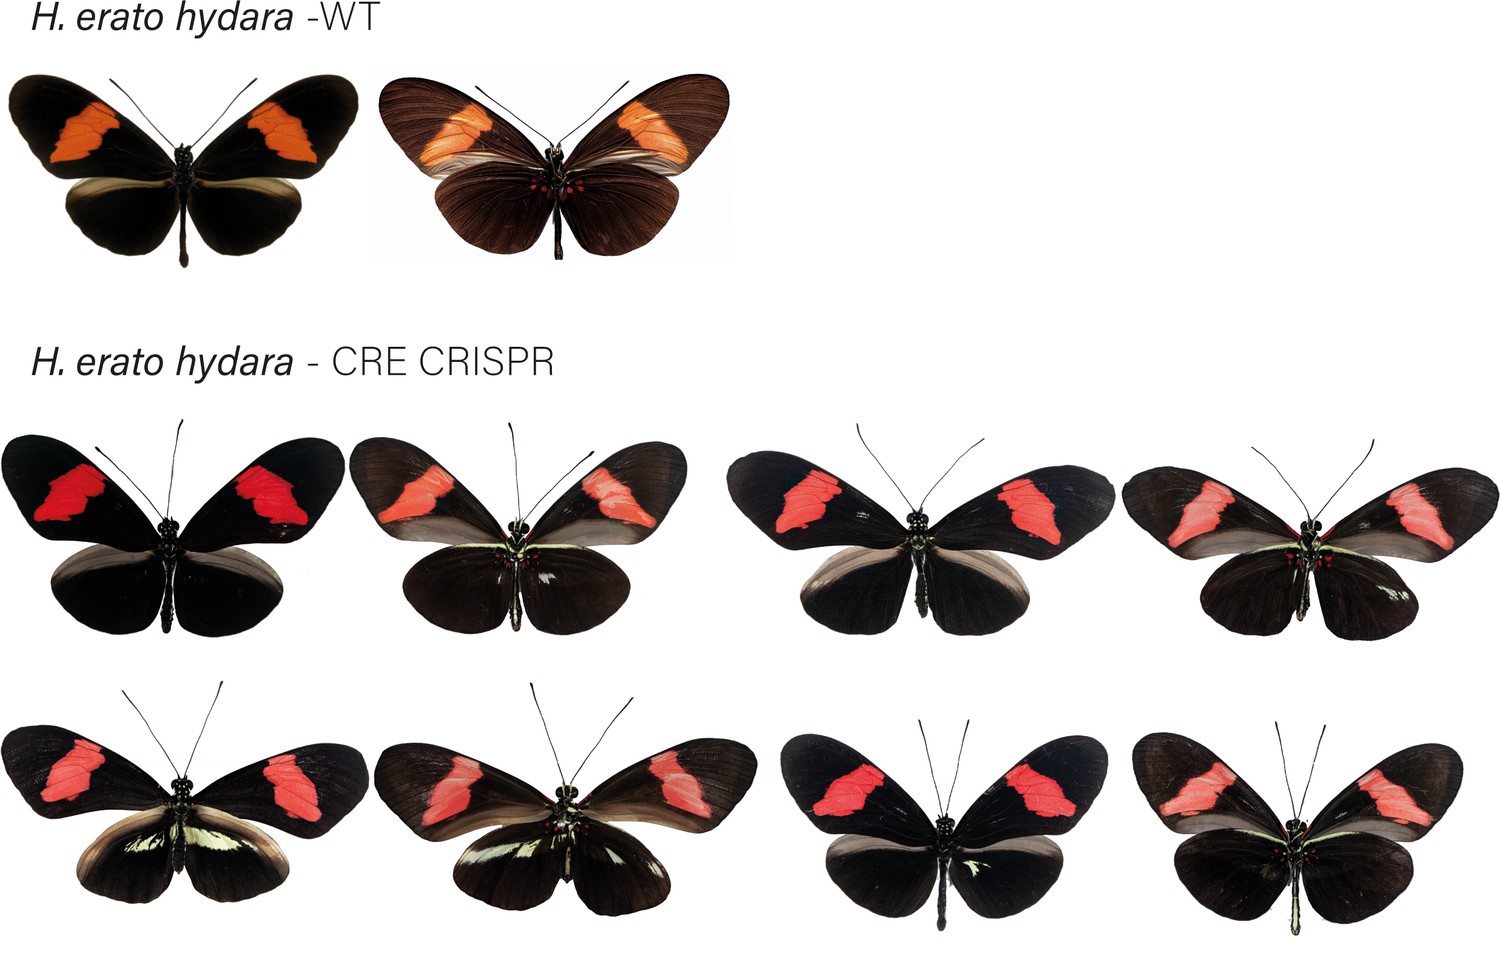
H. erato hydara wild-type (WT), alongside cortex CRE mKO individuals recovered in CRISPR experiments.
Dorsal and ventral sides shown for each mutant.
Figure 7—figure supplement 4
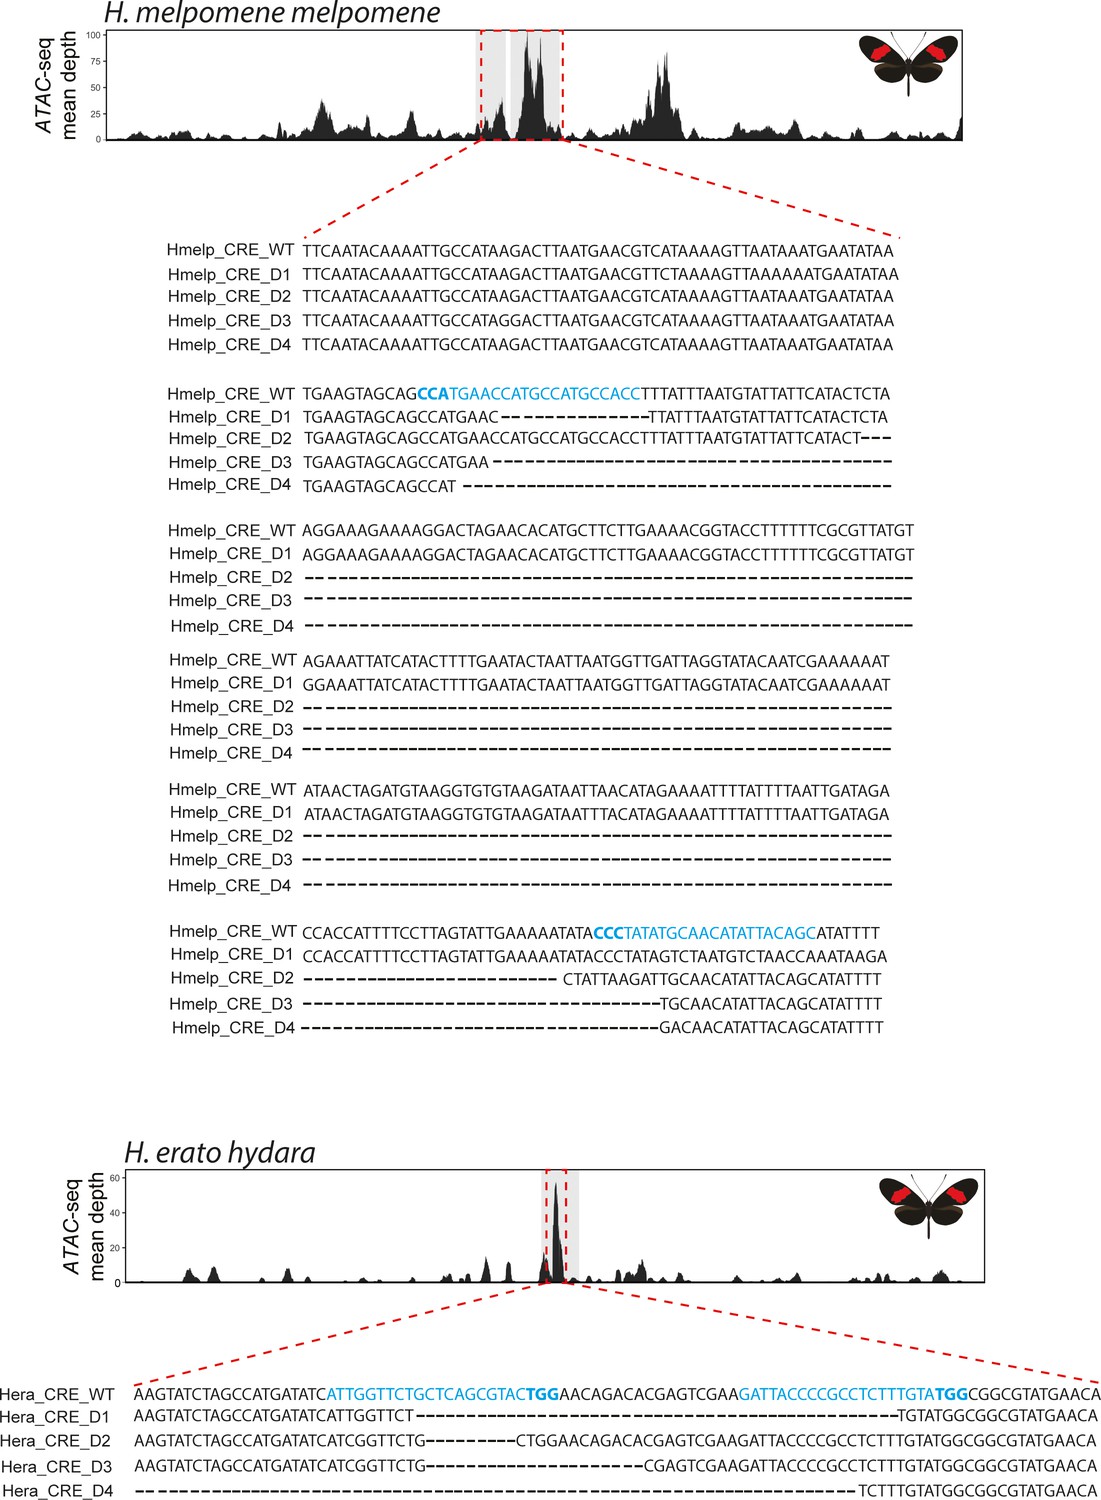
Genotyping at the H. melpomene and H. erato CRE confirms CRISPR-induced deletions.
Targeted ATAC-seq peak shown above (red dotted rectangle), as well as alignment between wild-type and recovered deletions. Guides highlighted in blue with PAM sequence in bold.
Figure 7—figure supplement 5
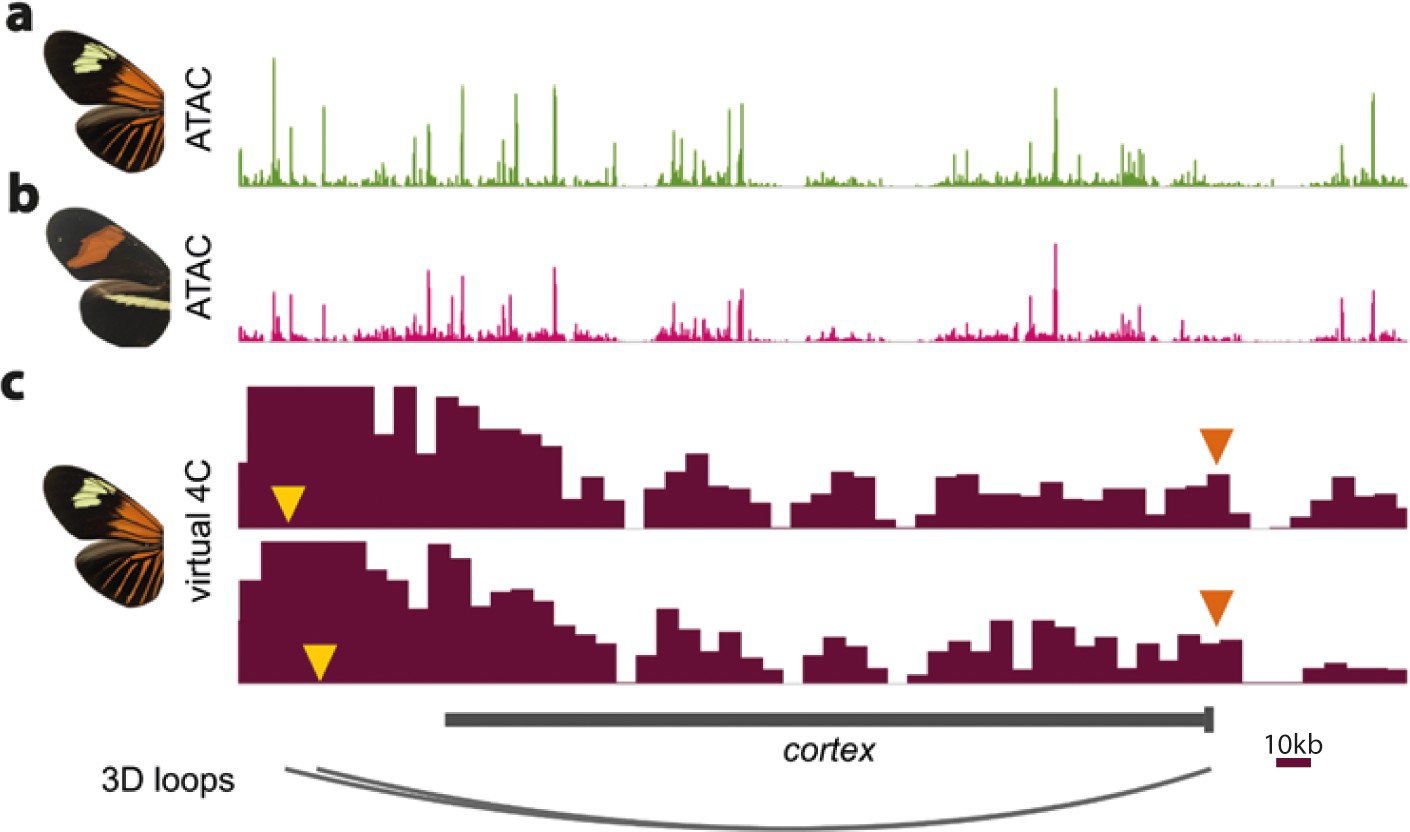
ATAC-Seq traces at the cortex locus for day three old pupal wings in H. erato lativitta (a) and H. erato demophoon (b).
Virtual 4C plots showing significant interactions (p<0.05) for the CREs assayed in the CRISPR experiments (yellow arrowheads) with the cortex promoter (orange arrowheads) (c). Data from Lewis et al., 2019. Scale bar = 10 kb.
Figure 8 with 2 supplements
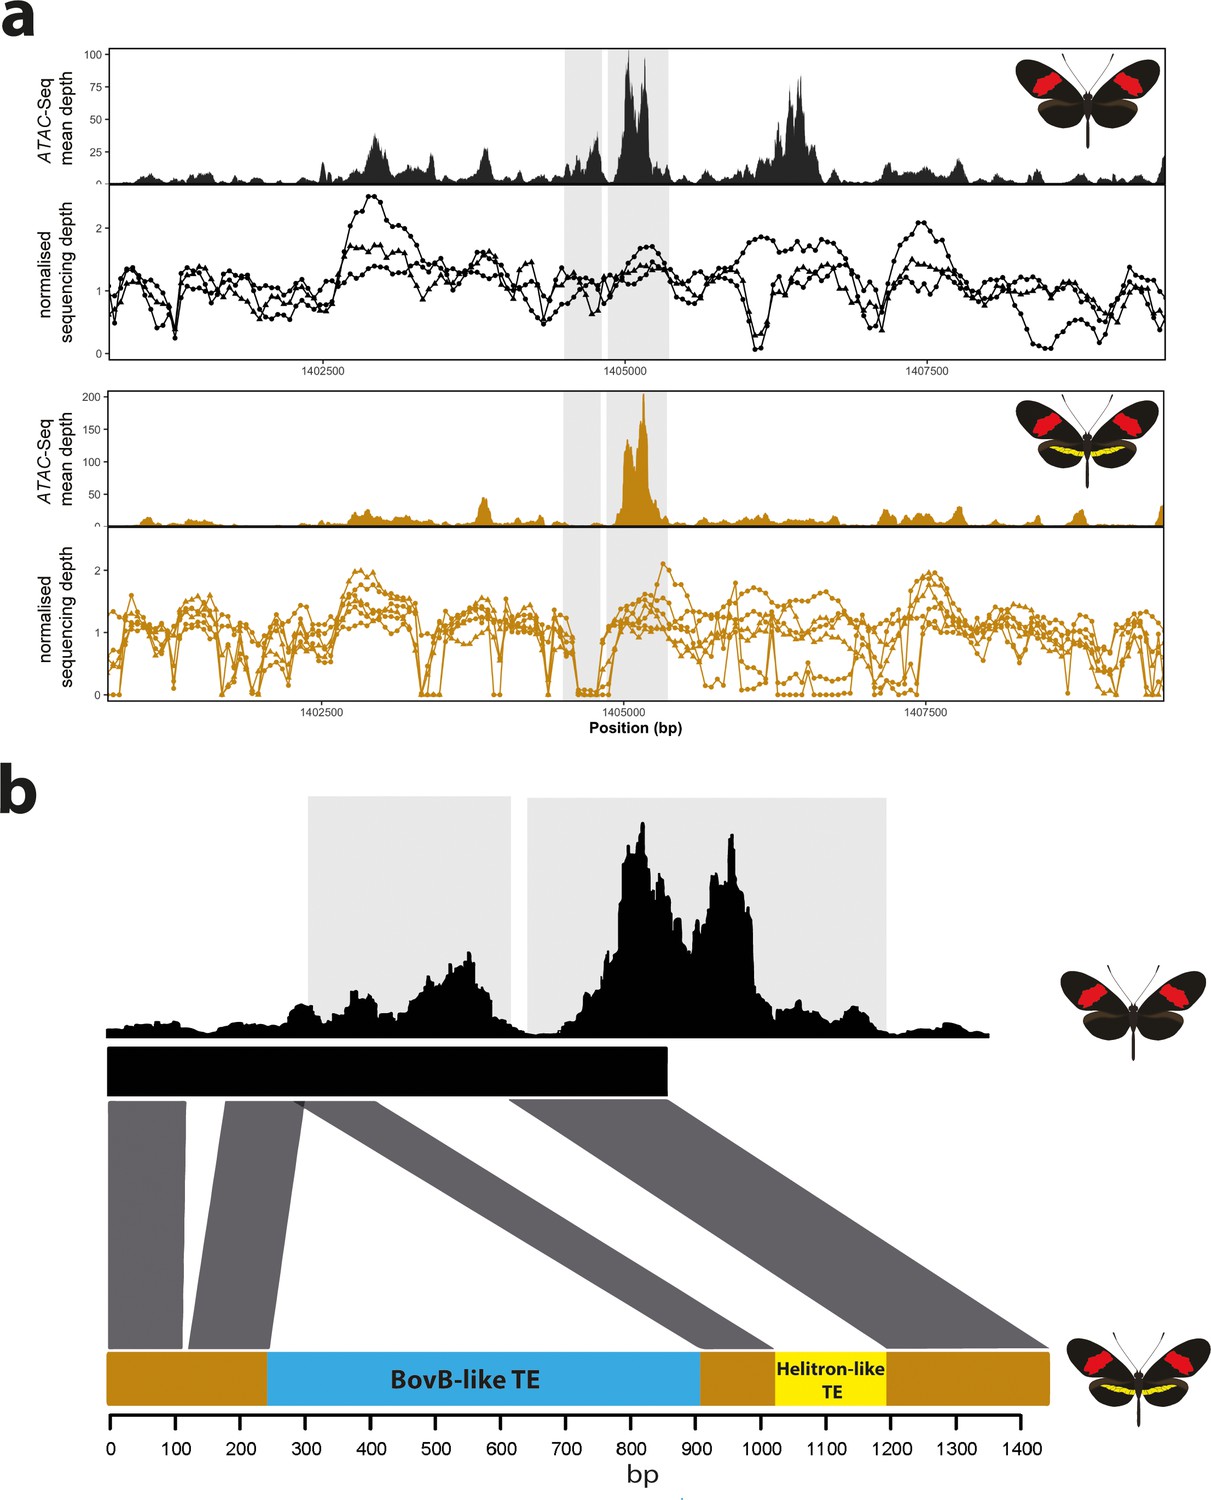
Coverage drop indicative of deletions in yellow-barred populations of H. melpomene.
(a) Mean sequence depth for ATAC-seq traces for the excised CRE are shown above normalised depth in sequencing coverage for populations of H.melpomene (circles) and H. timareta (triangles) differing for the presence of a yellow bar. Yellow-barred populations display a drop in coverage for both ATAC signal and sequencing depth at a position corresponding to a portion of the targeted CRE (highlighted by the grey lines). Morphs analysed for melanic hindwing H. melpomene and H. timareta: H. m. maletti, H. m. melpomene, H. t. florencia. Morphs analysed for yellow-barred H. melpomene and H. timareta: H. m. bellula, H. m. amaryllis, H. m. rosina, H. m. burchelli, H t. thelxione, H. t. tristero. (b) Sanger sequencing of target regions in H. m. melpomene and H. m. rosina reveals an insertion of two TE elements surrounding the yellow bar CRE. A larger BovB-like element of 690 bp (blue) and a smaller 163 bp Helitron-like element (yellow) are present in the H. m. rosina sequences, but not the H. m. melpomene sequences. Base pair positions of the consensus Sanger sequencing traces are shown below.
-
Figure 8—source data 1
List of individuals used in coverage depth analysis, and corresponding accession numbers.
- https://cdn.elifesciences.org/articles/68549/elife-68549-fig8-data1-v1.docx
-
Figure 8—source data 2
Consensus sequences recovered from Sanger sequencing across the H. melpomene/timareta CRE.
The BovB-like TE element is indicated in blue; The Helitron-like fragment in orange. Both are absent from the H. melpomene melpomene sequence.
- https://cdn.elifesciences.org/articles/68549/elife-68549-fig8-data2-v1.docx
Figure 8—figure supplement 1
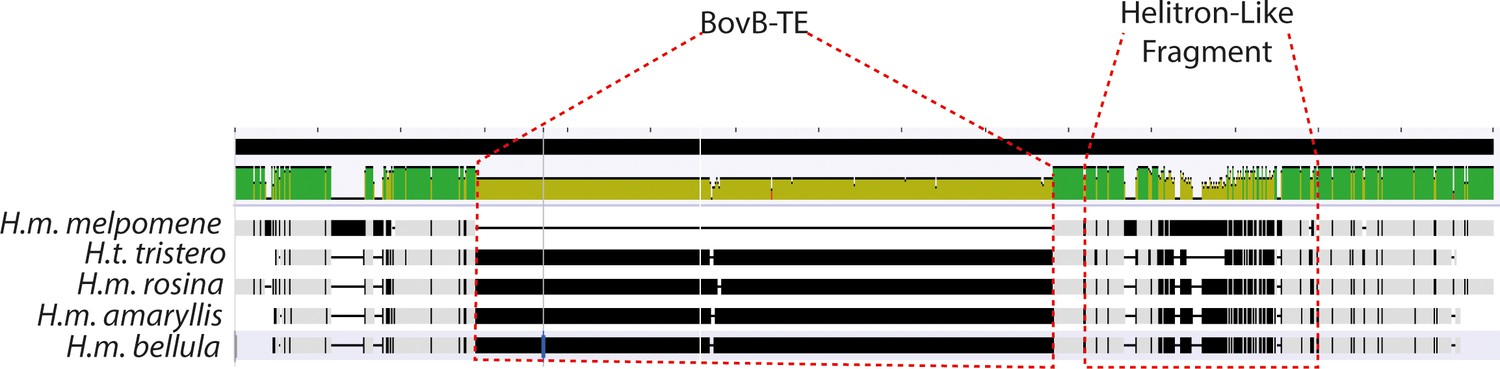
Alignment visualisation of the sequences above.
The BovB-TE insertion is evident in all yellow-barred morphs, as well as the divergent Helitron-like sequence. This is absent from the black hindwing morph (top, H.m. melpomene).
Figure 8—figure supplement 2
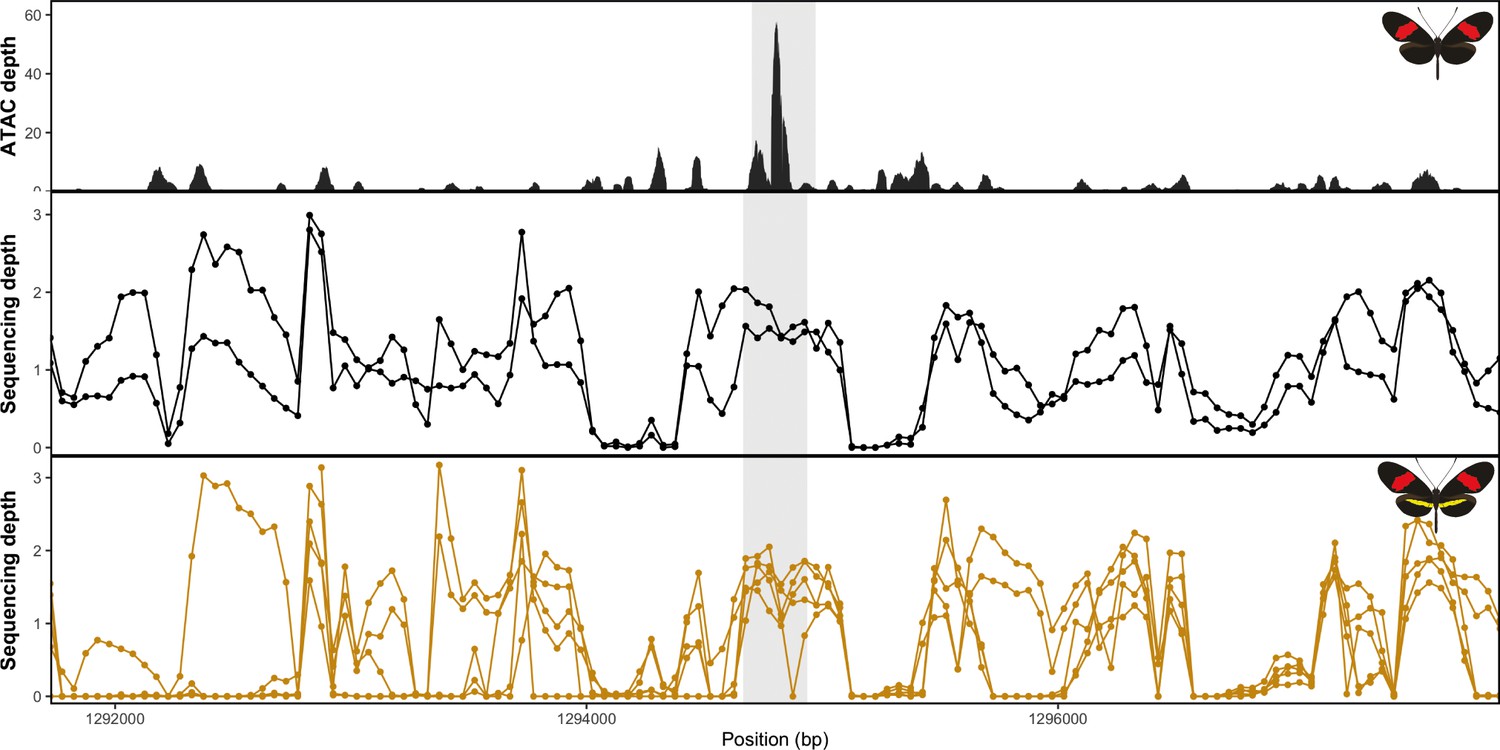
No evidence of deletion at the yellow bar CRE in H. erato populations.
Mean sequence depth for ATAC-Seq in H.erato (top) and normalised sequencing depth for black hindwing populations (middle) and yellow-barred populations (bottom). Sequences were mapped against the H. erato lativitta reference.
Figure 9 with 2 supplements
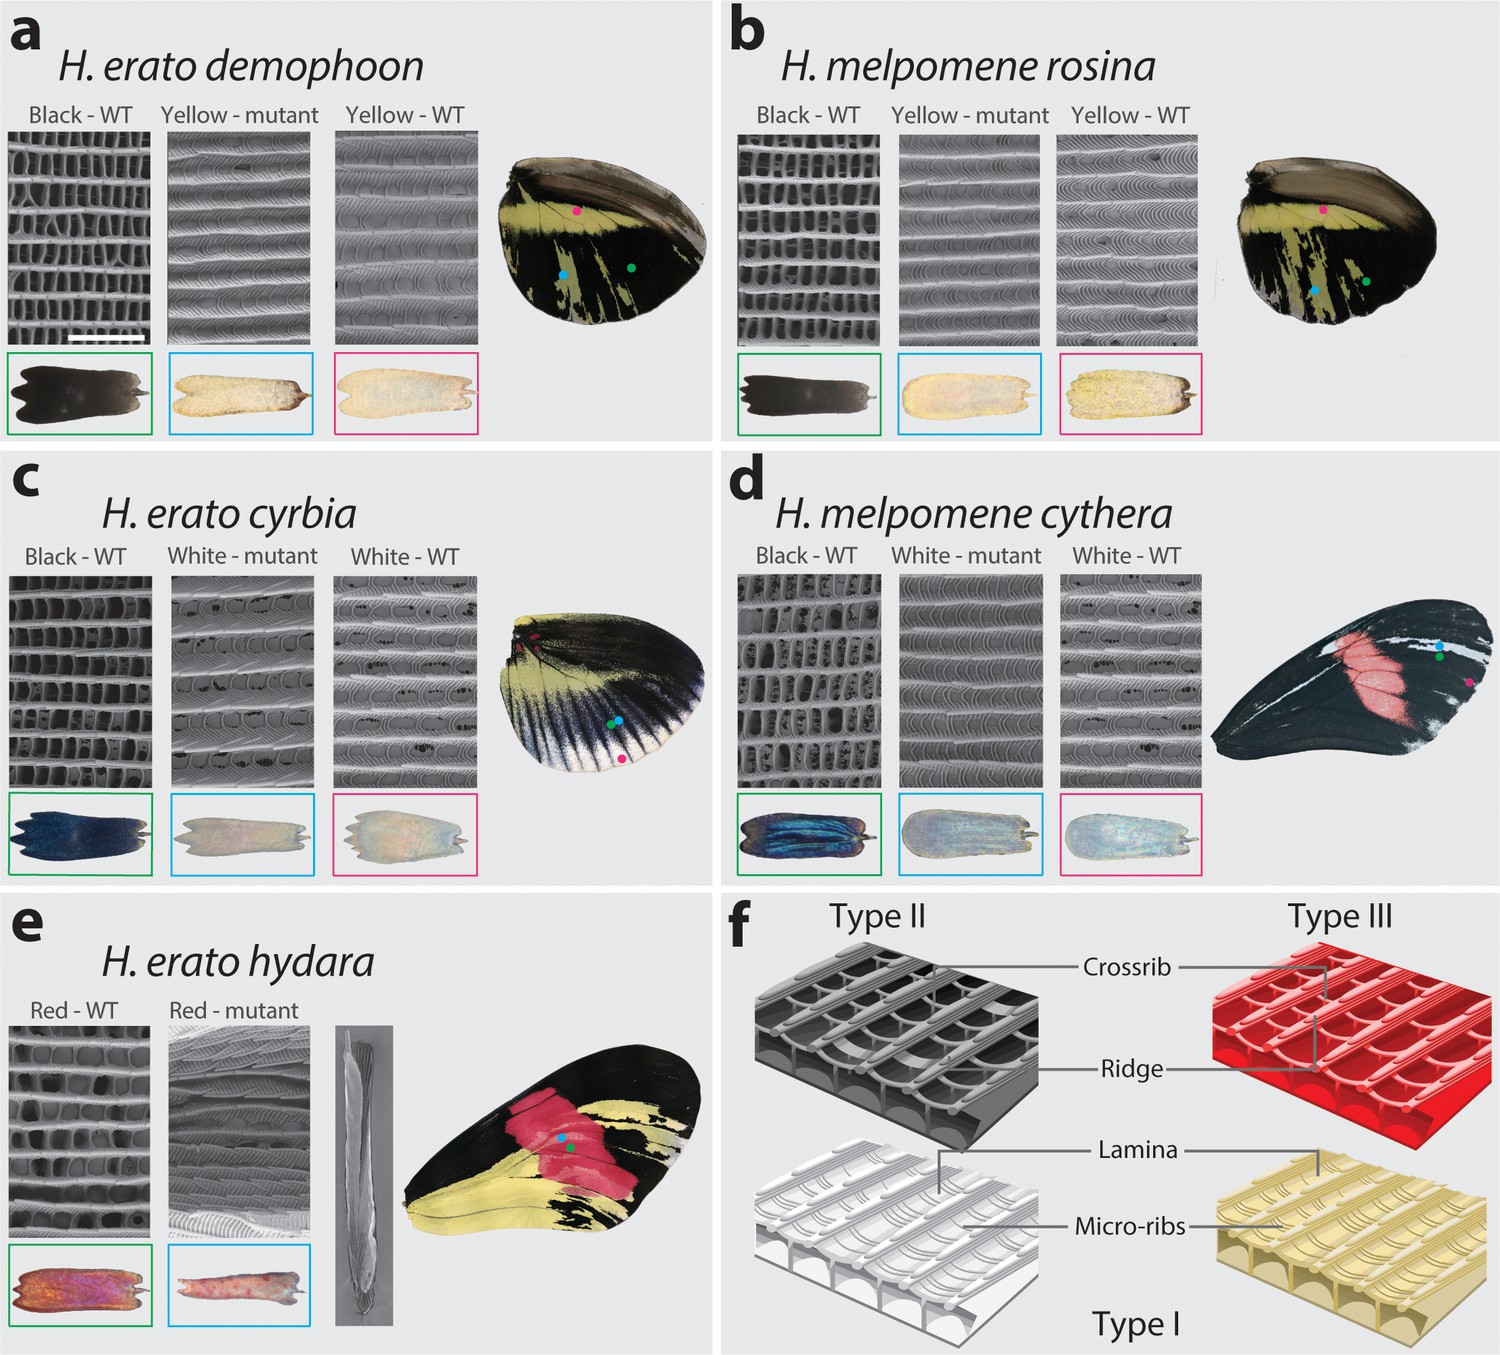
SEM reveals structural changes induced by cortex KO.
Ultrastructural morphology of H. erato demophoon (a) and H. melpomene rosina (b) hindwing scales for wild-type (WT) black, mutant yellow and wild-type yellow scales. Light micrographs of each scale are shown below the representative SEM images. Scale morphologies are also presented for morphs displaying shifts to white scales in H. erato cyrbia (c) and H. melpomene cythera (d). Structural changes in the red scales of H. erato hydara (e) are accompanied by scale deformations, resulting in a curled appearance. Cartoon depiction of scale ultrastructure illustrating differences between scale types (f). Type I scales are characterised by the presence of a lamina covering the scale windows and by microribs joining the longitudinal ridges. Type II scale cells display larger crossribs and lack a lamina covering the scale windows. Type III scale cells and are characterised by larger spacing between crossribs and ridges. Scale bar in (a) = 3 µm.
-
Figure 9—source data 1
Pairwise Wilcox test adjusted p-values for quantitative measures of scale structures and features in H.melpomene.
- https://cdn.elifesciences.org/articles/68549/elife-68549-fig9-data1-v1.docx
-
Figure 9—source data 2
Pairwise Wilcox test adjusted p-values for quantitative measures of scale structures and features in H.erato.
- https://cdn.elifesciences.org/articles/68549/elife-68549-fig9-data2-v1.docx
Figure 9—figure supplement 1
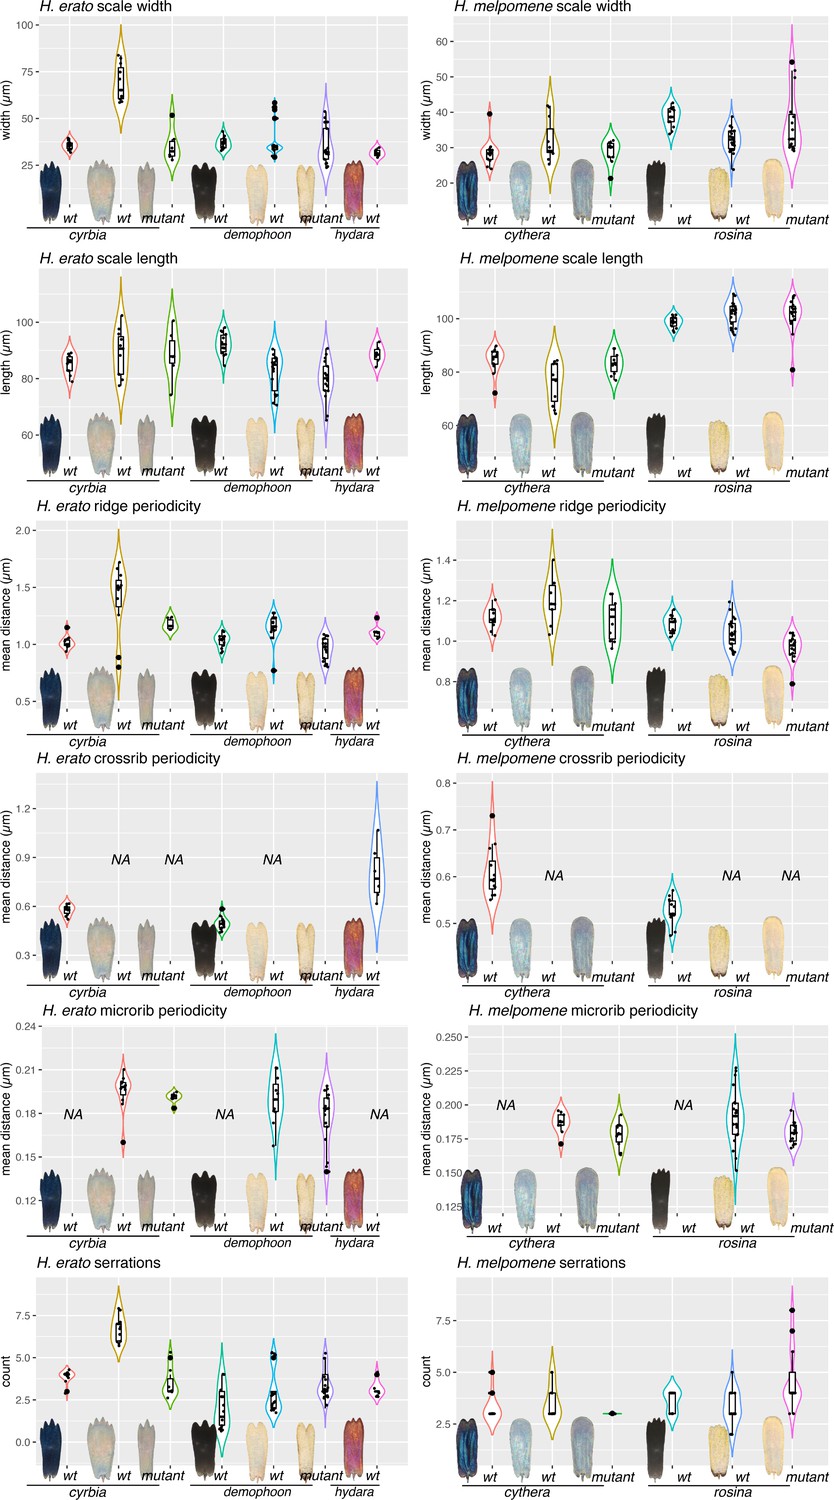
Quantitative measures of scale structures and features.
For each scale type depicted in Figure 9, between 8 and 15 scales were removed from the wing with an eyelash tool and imaged on SEM at 3000×. (Raw EM stitches can be found at the Dryad entry for this manuscript.) Each measurement was taken as previously described by Day et al., 2019. Briefly, a line segment was drawn over the scale in FIJI, and pixel intensity levels extracted. The resulting curves were subject to Fourier analysis to get mean measures for Ridge periodicity, crossrib periodicity and microrib periodicity. Serrations were counted manually.
Figure 9—figure supplement 2
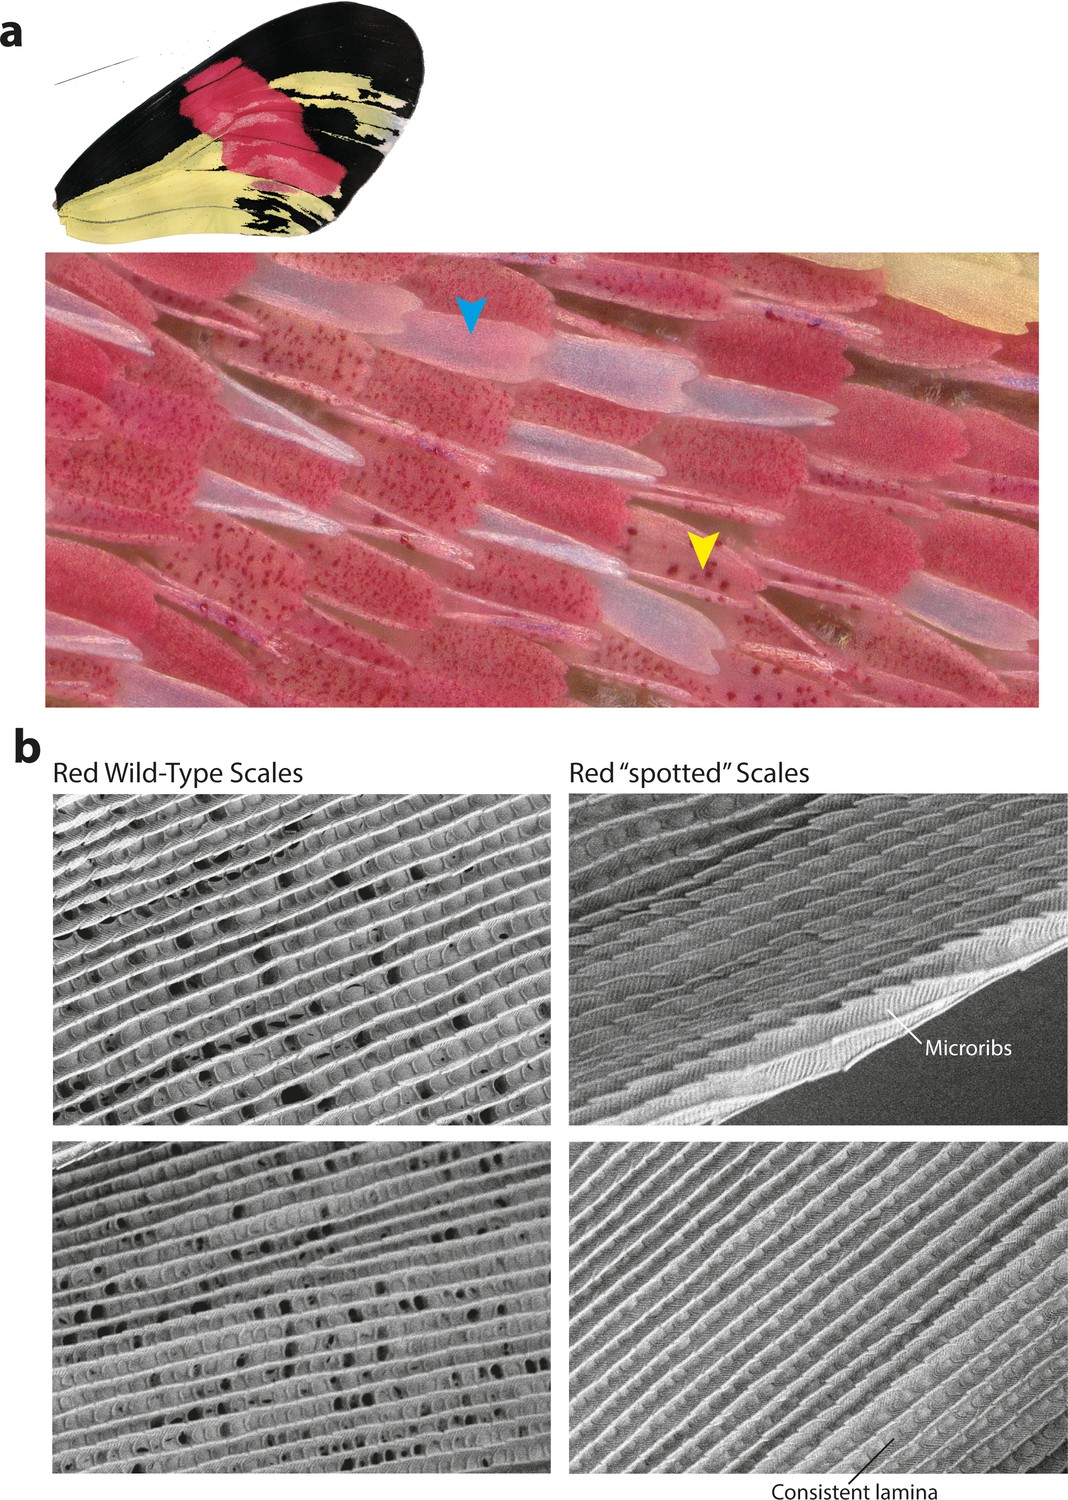
Cortex KOs in red scales produce aberrant morphologies with features consistent with Type I scale transformations.
(a) Cortex perturbations result in both fully white scales across the red band (blue arrowhead) as well as a ‘spotted’ phenotype, where the pigment appears to be asymmetrically deposited across the scale (yellow arrowhead). Many of the mutant scales also take up an aberrant morphology and appear curled in shape. (b) SEM images reveal that the mutated scales have features consistent with Type-I-like morphology, including the presence of microribs and consistent lamina covering the scale windows.
Figure 10
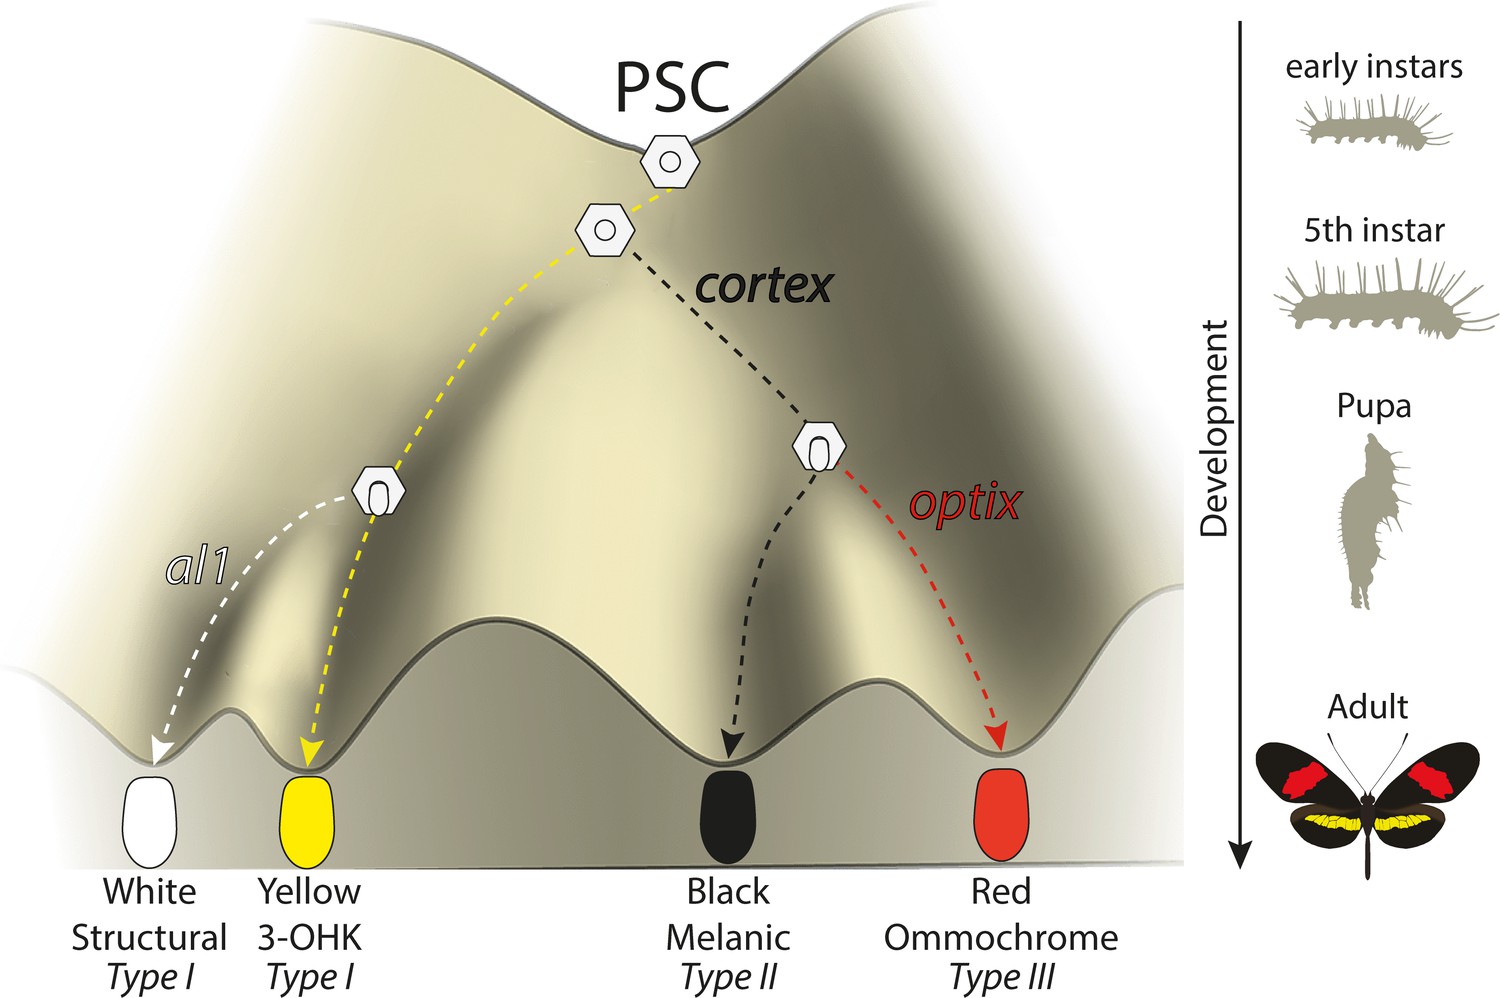
Expression of key genes affect scale fate decisions and influence downstream pigmentation state.
During early-instar development, wing disc cells differentiate into presumptive scale cells (PSCs). Throughout fifth-instar growth, PSCs express key scale cell specification genes such as cortex, which induce differentiation into Type II (optix−) scales or Type III (optix+) scales. In the absence of cortex, scale cells differentiate into Type I scales, which differ in pigmentation state based on 3-OHK synthesis controlled by aristaless1 expression. Model based on the epigenetic landscape (Waddington) and by observations made by Gilbert et al., 1987.
Additional files
Download links
A two-part list of links to download the article, or parts of the article, in various formats.
Downloads (link to download the article as PDF)
Open citations (links to open the citations from this article in various online reference manager services)
Cite this article (links to download the citations from this article in formats compatible with various reference manager tools)
Cortex cis-regulatory switches establish scale colour identity and pattern diversity in Heliconius
eLife 10:e68549.
https://doi.org/10.7554/eLife.68549


