SARS-CoV-2 spike protein induces inflammation via TLR2-dependent activation of the NF-κB pathway
- Department of Pathology, The University of Texas Southwestern Medical Center, United States
- Department of Pediatrics, The University of Texas Southwestern Medical Center, United States
- Department of Microbiology, The University of Texas Southwestern Medical Center, United States
Figures
Figure 1 with 2 supplements
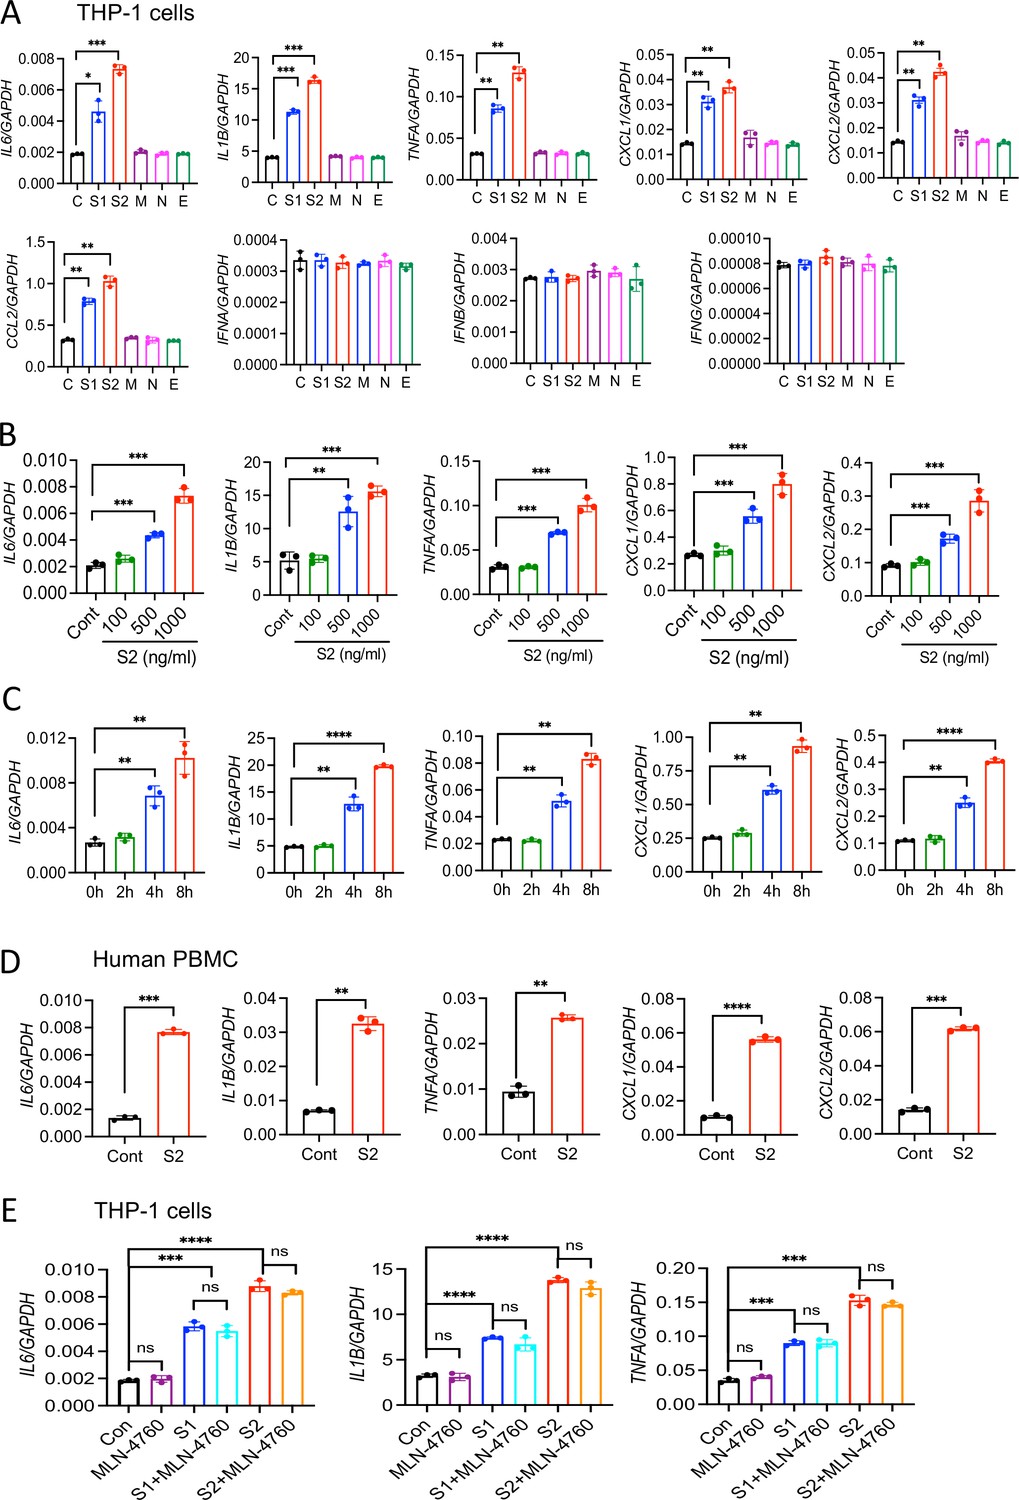
SARS-CoV-2 S protein induces cytokines and chemokines in macrophages and monocytes.
(A) Human monocytic cells THP1-derived macrophages were stimulated with recombinant S1, S2, M, N, and E proteins of SARS-CoV-2 at a concentration of 500 ng/ml. Four hours post-stimulation, the expression of IL6, IL1B, TNFA, CXCL1, CXCL2, CCL2, IFNA, IFNB, and IFNG was measured by real-time RT-PCR. (B) THP1 cells were stimulated with S2 protein at various concentrations for 4 hr and measured the indicated cytokines by real-time RT-PCR. (C) THP1 cells were stimulated with S2 protein (500 ng/ml). RNA isolated at 2, 4, and 8 hr post-stimulation was measured for IL6, IL1B, TNFA, CXCL1, and CXCL2 by real-time RT-PCR. (D) Human peripheral blood mononuclear cells (PBMCs) were incubated with S2 (500 ng/ml) protein for 4 hr. The expression of IL6, IL1B, TNFA, CXCL1, and CXCL2 was measured by real-time RT-PCR. (E) THP1 cells were incubated with S1 (500 ng/ml) or S2 (500 ng/ml) in the presence or absence of ACE2 inhibitor MLN-4760 (10 mM). The expression of cytokines was measured at 4 hr by real-time RT-PCR. Data represent mean ± SD (n=3); *p<0.05, **p<0.001, ***p<0.0001, ****p<0.00001 by unpaired Student’s t-test. Experiments described in (A) were repeated three times, and (B–E) were repeated two times. Data of representative experiments are presented.
-
Figure 1—source data 1
Raw source data for A-E.
- https://cdn.elifesciences.org/articles/68563/elife-68563-fig1-data1-v2.xlsx
Figure 1—figure supplement 1
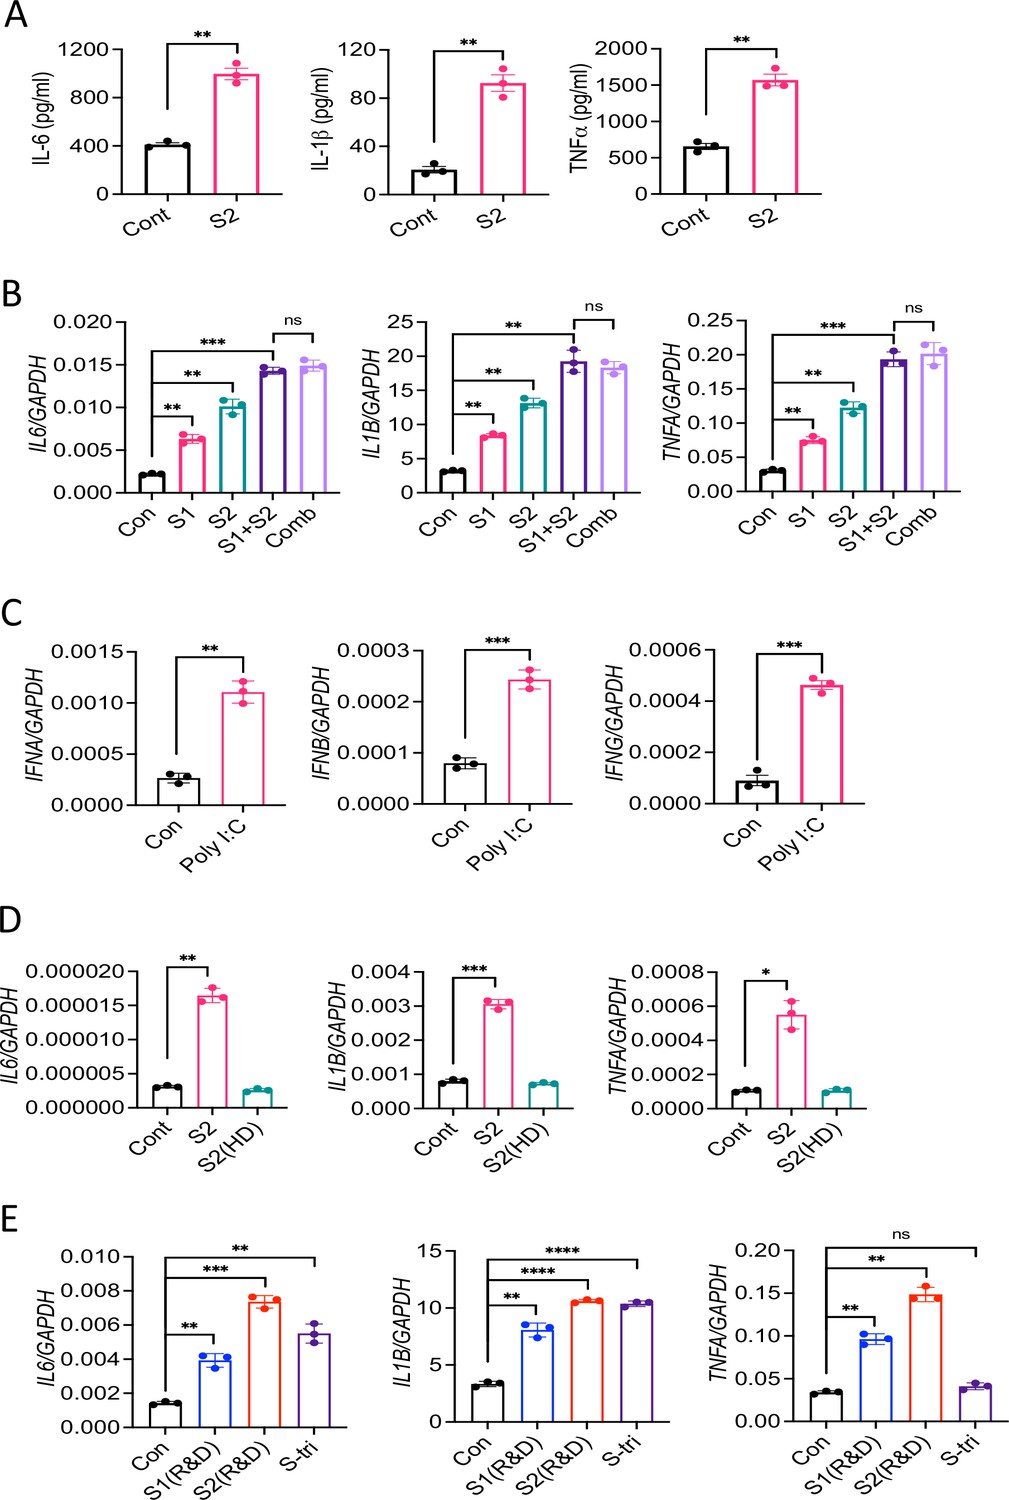
SARS-CoV-2 S protein induces inflammatory cytokines in macrophages.
(A) THP1 cells were stimulated with S2 protein. Four hours post-stimulation, culture supernatants were analyzed for IL-6, IL-1β, and TNFα by ELISA. (B) THP1 cells were stimulated with S1 and S2 individually or together or in combination with M, N, and E proteins (500 ng/ml each protein). RNA isolated at 4 hr post-stimulation was measured for IL6, IL1B, and TNFA. (C) THP-1 cells were stimulated with PolyI:C (1 μg/ml). The expression of interferons was measured by real-time RT-PCR. (D) THP1 cells were stimulated with native S2 or heat-denatured (HD) S2 (500 ng/ml). The induction of IL6, IL1B, and TNFA was measured by real-time RT-PCR at 4 hr post-stimulation. (E) THP1 cells were stimulated with S1, S2, or S-tri manufactured by R&D for 4 hr. The induction of inflammatory cytokines was measured by real-time RT-PCR. Data represent mean ± SD (n=3); **p<0.001, ***p<0.0001, ****p<0.00001 by unpaired Student’s t-test. Experiments were repeated two times and data of representative experiments are presented.
-
Figure 1—figure supplement 1—source data 1
Raw source data for A-E.
- https://cdn.elifesciences.org/articles/68563/elife-68563-fig1-figsupp1-data1-v2.xlsx
Figure 1—figure supplement 2
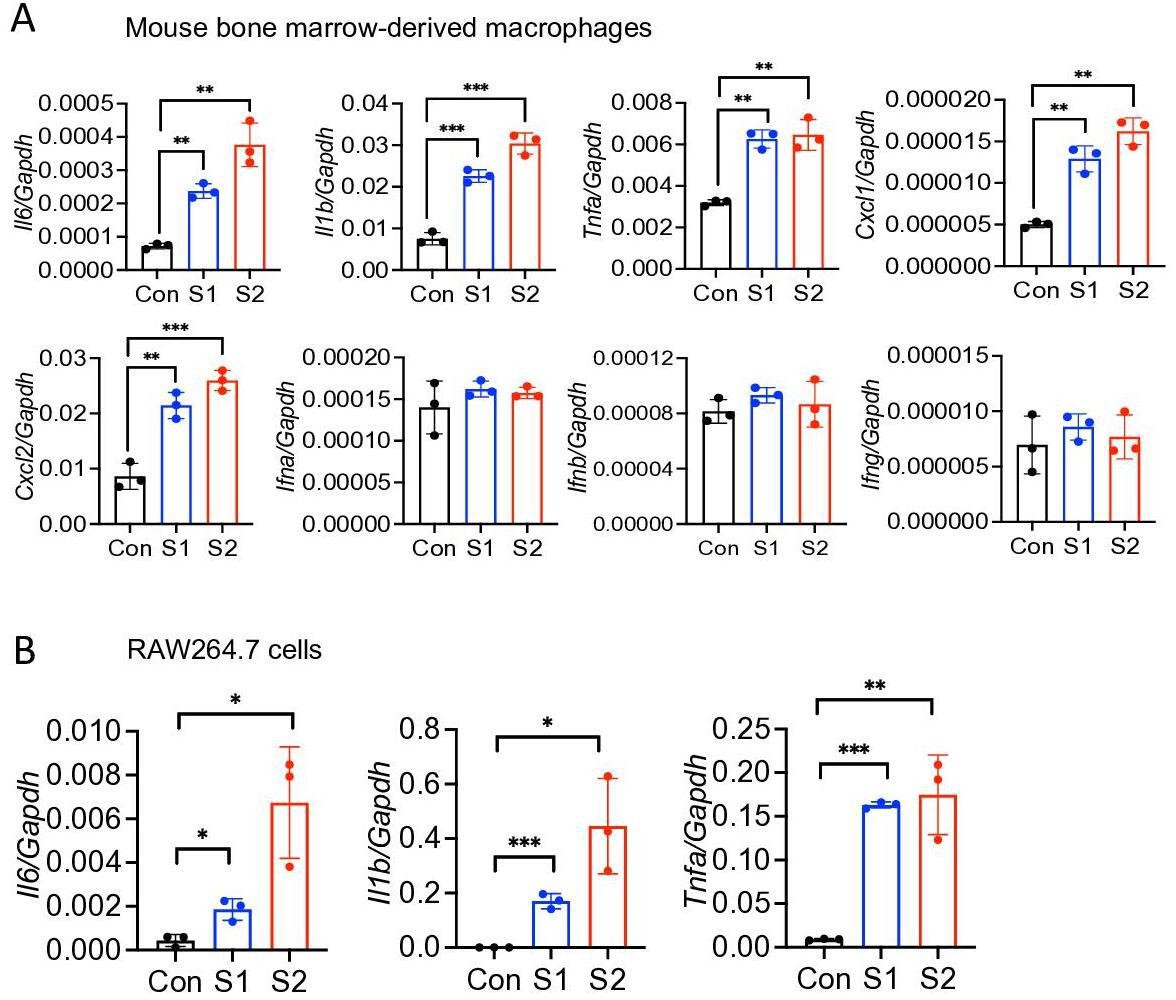
Mouse macrophages are stimulated by SARS-CoV-2 S protein.
(A) Bone marrow-derived macrophages from WT mice were stimulated with S1 and S2 proteins (500 ng/ml) for 4 hr. The expression of Il6, Il1b, Tnfa, Cxcl1, Cxcl2, Ifna, Ifnb, and Ifng was measured by real-time RT-PCR. (B) RAW264.7 murine macrophage cells were stimulated with S1 or S2 (500 ng/ml) for 4 hr. The expression of Il6, Il1b, and Tnfa was measured by real-time RT-PCR. Data represent mean ± SD (n=3); *p<0.05, **p<0.001, ***p<0.0001 by unpaired Student’s t-test. Experiments were repeated two times and data of representative experiments are presented.
-
Figure 1—figure supplement 2—source data 1
Raw source data for A-B.
- https://cdn.elifesciences.org/articles/68563/elife-68563-fig1-figsupp2-data1-v2.xlsx
Figure 2 with 1 supplement
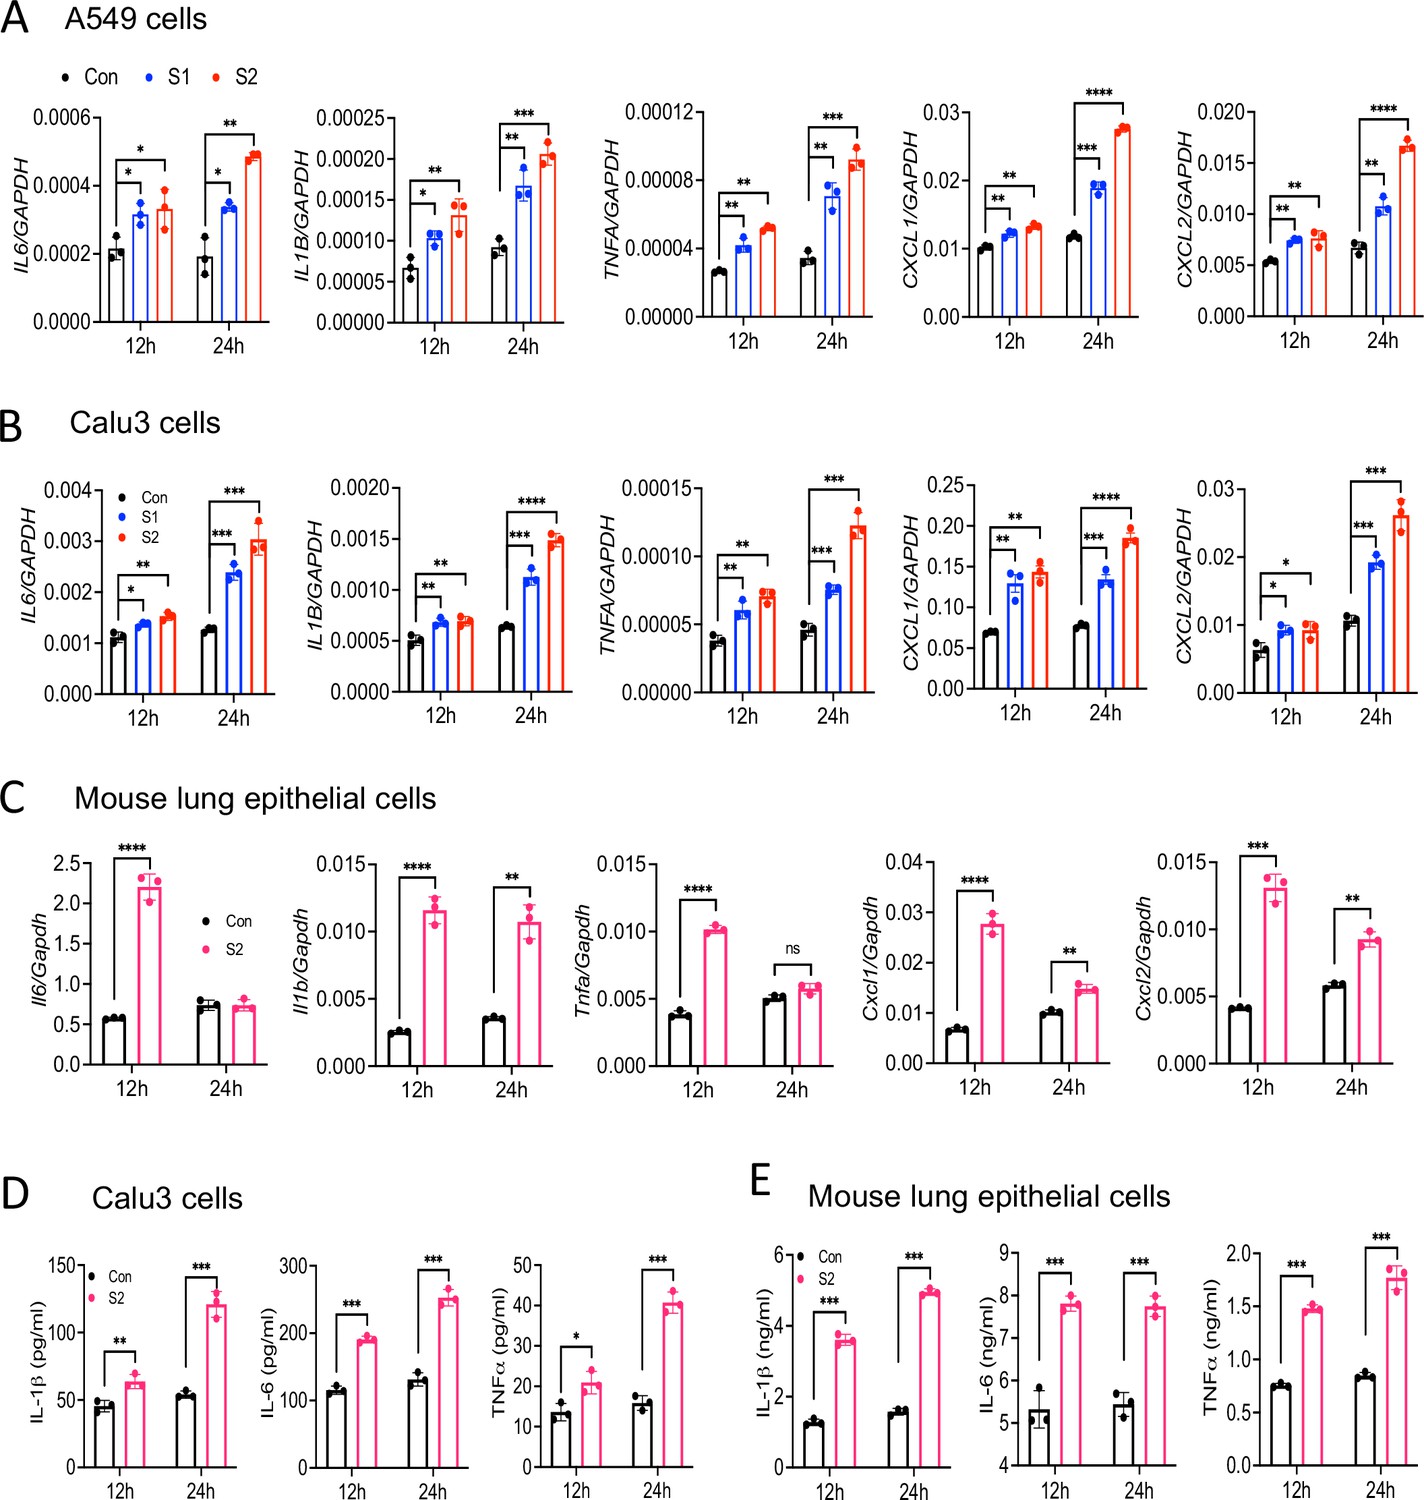
Lung epithelial cells produce inflammatory molecules in response to SARS-CoV-2 S protein.
(A, B) A549 or Calu3 cells were incubated with SARS-CoV-2 S1 or S2 proteins (500 ng/ml) for 12 and 24 hr. The expression of inflammatory cytokines and chemokines was measured by real-time RT-PCR. (C) Primary mouse lung epithelial cells were stimulated with S2 (500 ng/ml) for 12 and 24 hr. The expression of inflammatory cytokines and chemokines was measured by real-time RT-PCR. (D, E) Calu3 cells or mouse lung primary epithelial cells were stimulated with S2 (500 ng/ml). Culture supernatant collected at 12 and 24 hr were analyzed for IL-6, IL-1β, and TNFα by ELISA. *p<0.05, **p<0.001, ***p<0.0001, ****p<0.00001 by unpaired Student’s t-test. Experiments in (A, B) were repeated three times. Other experiments were repeated two times and data of representative experiments are presented.
-
Figure 2—source data 1
Raw source data for A-E.
- https://cdn.elifesciences.org/articles/68563/elife-68563-fig2-data1-v2.xlsx
Figure 2—figure supplement 1

Epithelial cells do not respond to SARS-CoV-2 S protein acutely.
A549 cells were incubated with SARS-CoV-2 S1 or S2 (500 ng/ml) proteins for 4 hr. The expression of inflammatory cytokines and chemokines was measured by real-time RT-PCR. Data represent mean ± SD (n=3). Experiments were repeated two times and data of representative experiments are presented.
-
Figure 2—figure supplement 1—source data 1
Raw source data.
- https://cdn.elifesciences.org/articles/68563/elife-68563-fig2-figsupp1-data1-v2.xlsx
Figure 3 with 2 supplements

Epithelial cells expressing S protein stimulate macrophages during co-culture.
(A–C) SARS-CoV-2 S protein was overexpressed in A549 or Calu3 cells. Forty-eight hours following transfection with S or GFP plasmids, cell culture supernatants were collected and added into THP1 cells in culture at 30% v/v. (B, C) The expression of IL6, IL1B, and TNFA in THP1 cells at 4 hr was measured by real-time RT-PCR. (D) A549 or Calu3 cells expressing S protein were co-cultured with THP1 cells at 1:2 ratio for 16 hr. (E, F) The expression of IL6, IL1B, and TNFA was measured by real-time RT-PCR. (G, H) Protein levels of IL-6, IL-1β, and TNFα in culture supernatant described in (D) were measured by ELISA. Data represent mean ± SD (n=3); **p<0.001, ***p<0.0001 by unpaired Student’s t-test. Experiments were repeated three times and data of representative experiments are presented.
-
Figure 3—source data 1
Raw source data for B, C, E, F, G, H.
- https://cdn.elifesciences.org/articles/68563/elife-68563-fig3-data1-v2.xlsx
Figure 3—figure supplement 1
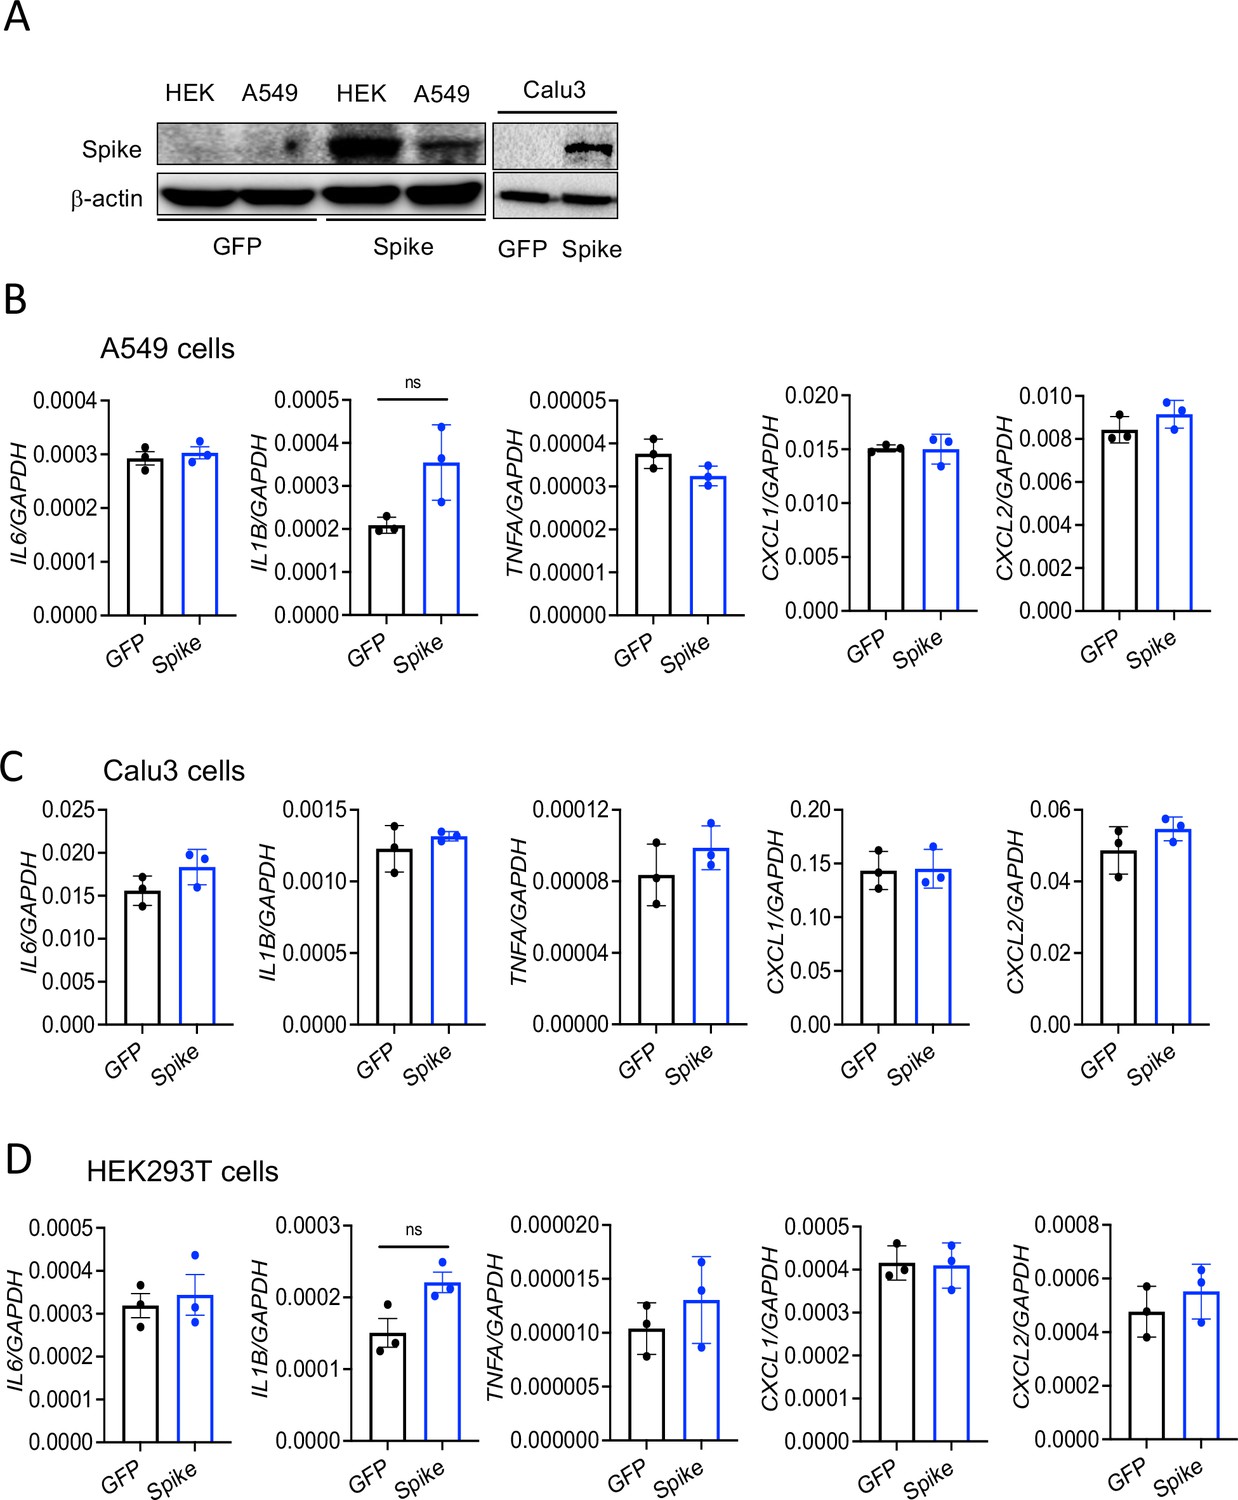
Cytosolic S protein dose not trigger inflammation in epithelial cells.
A549, Calu3, and HEK293T cells were transfected with plasmids containing flag-tagged S or green fluorescent protein (GFP). (A) Forty-eight hours post-transfection, cell lysates were collected and the expression of S was measured by Western blot analysis of S protein. (B–D) Forty-eight hours following transfection with expression plasmids, the mRNA levels of IL6, IL1B, TNFA, CXCL1, and CXCL2 were measured by real-time RT-PCR. Data represent mean ± SD (n=3). Experiments were repeated two times and data of representative experiments are presented.
-
Figure 3—figure supplement 1—source data 1
Raw source data for B-D.
- https://cdn.elifesciences.org/articles/68563/elife-68563-fig3-figsupp1-data1-v2.xlsx
Figure 3—figure supplement 2
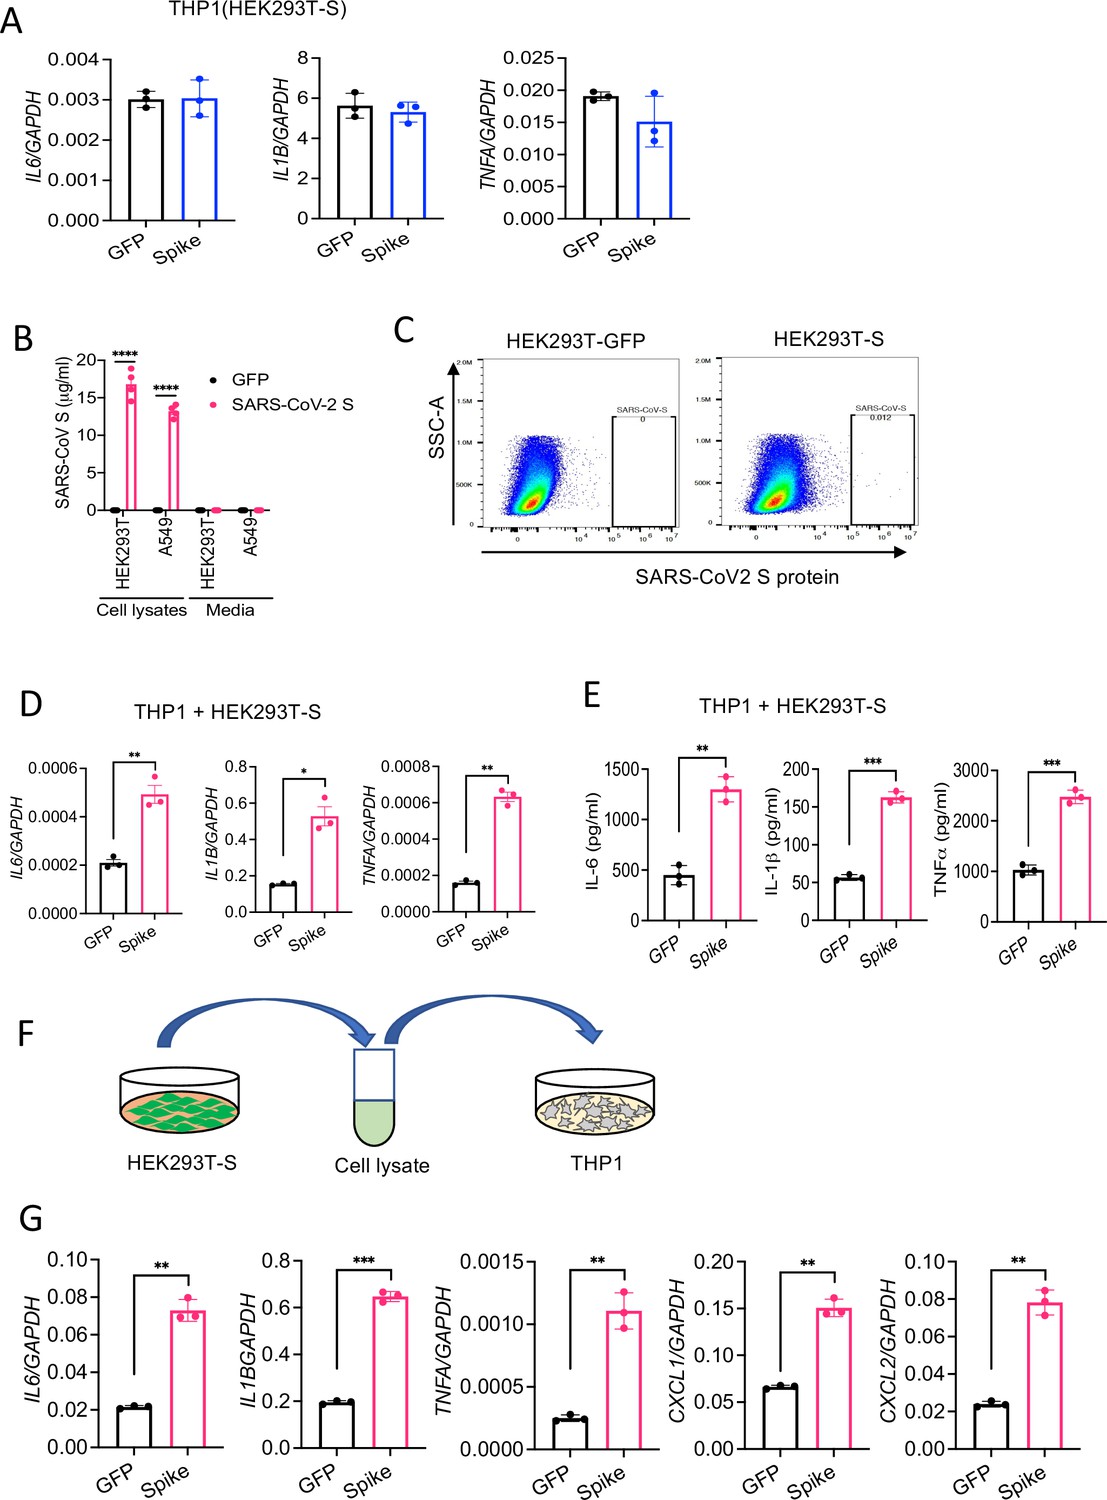
HEK293T cells expressing S protein activate macrophages.
(A–B) Spike or GFP (control) were overexpressed in HEK293T cells. THP1 cells were stimulated with cell culture supernatant (30% v/v) of HEK293T-S or HEK293T-GFP for 4 hr. The expression of IL6, IL1B, and TNFA was measured by real-time RT-PCR. (B) Spike or GFP (control) proteins were overexpressed in HEK293T or A549 cells. Cell culture supernatants and cell lysates were collected at 48 hr after transfection, and analyzed for S protein by ELISA. (C) The expression of S on the cell surface of HEK293T-S cells was measured by flow cytometry following surface staining of S protein. (D, E) HEK293T cells expressing S protein were co-cultured with THP1 cells at 1:2 ratio for 16 hr. The expression of IL6, IL1B, and TNFA was measured by real-time RT-PCR (D) and ELISA (E). (F) S or GFP (control) proteins were overexpressed in HEK293T cells. Cells were sonicated, and cell lysate supernatants were collected. THP1 cells were incubated with these cell lysate supernatants for 4 hr. (G) The expression of IL6, IL1B, TNFA, CXCL1, and CXCL2 in THP1 cells was measured by real-time RT-PCR. Data represent mean ± SD (n=3); *p<0.05, **p<0.001, ***p<0.0001 by unpaired Student’s t-test. Experiments were repeated two times and data of representative experiments are presented.
-
Figure 3—figure supplement 2—source data 1
Raw source data for A, B, D, E, G.
- https://cdn.elifesciences.org/articles/68563/elife-68563-fig3-figsupp2-data1-v2.xlsx
Figure 4
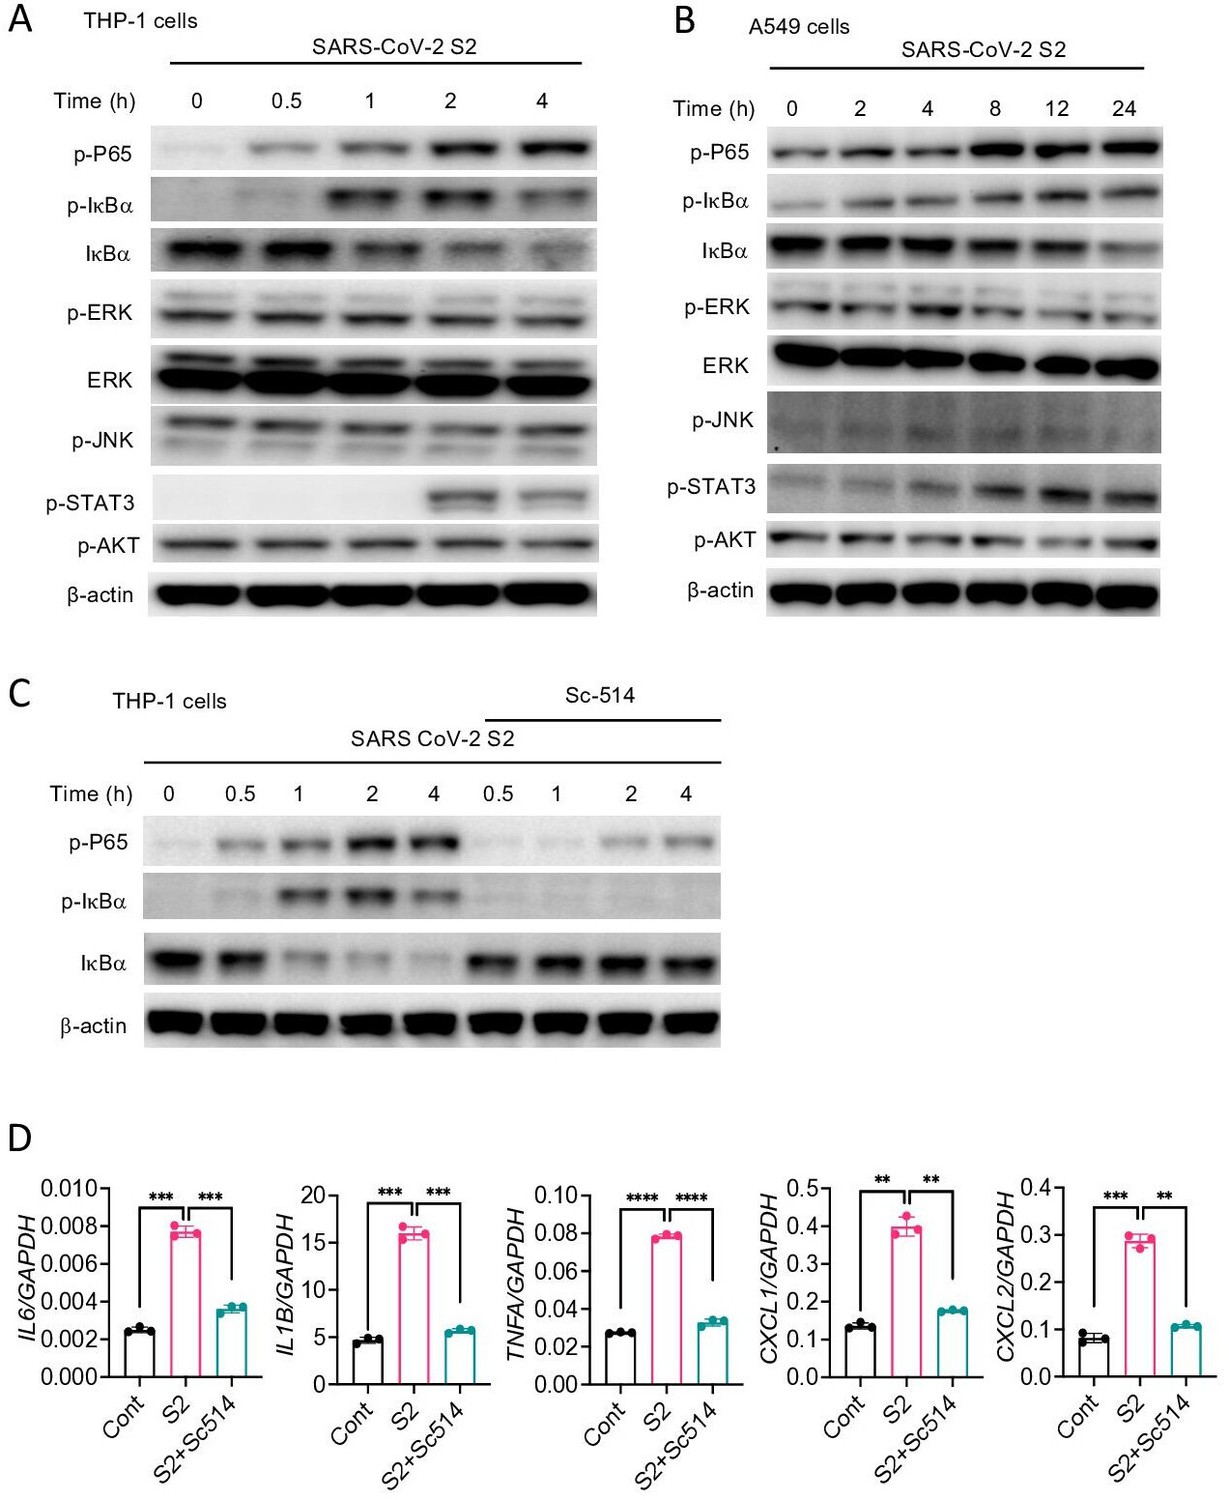
SARS-CoV-2 S protein activates the NF-κB pathway.
(A, B) THP1 and A549 cells were stimulated with S2 (500 ng/ml) for indicated time points. Phosphorylation of P65, IκBα, ERK, JNK, STAT3, and AKT was measured by Western blotting. (C, D) THP1 cells were stimulated by SARS-CoV-2 S2 protein (500 ng/ml) in the presence or absence of IKKβ inhibitor sc514. Phosphorylation of P65 and IκBα was measured by Western blotting (C). The expression of IL6, IL1B, TNFA, CXCL1, and CXCL2 in stimulated THP1 cells was measured by real-time RT-PCR (D). Data represent mean ± SD (n=3); *p<0.05, **p<0.001, ***p<0.0001, ****p<0.00001 by unpaired Student’s t-test. Experiments in (A, B) were repeated three times and (C, D) were repeated two times. Data of representative experiments are presented.
-
Figure 4—source data 1
Raw source data for D.
- https://cdn.elifesciences.org/articles/68563/elife-68563-fig4-data1-v2.xlsx
Figure 5 with 2 supplements

TLR2 recognizes SARS-CoV-2 S protein and activate the NF-κB pathway.
(A, B) Bone marrow-derived macrophages (BMDMs) from WT and Myd88−/− mice were stimulated with S2 protein (500 ng/ml). (A) The activation of the NF-κB pathway was measured by Western blot analysis of P-P65 and P-IκBα. (B) The induction of Il6, Il1b, and Tnfa was measured by real-time RT-PCR. (C) BMDMs from WT, Tlr2−/−, and Tlr4−/− mice were treated with S2 protein (500 ng/ml). Cell lysates collected at different times were analyzed for the activation of the NF-κB pathway by Western blotting of P-P65 and P-IκBα. (D) BMDMs from WT and Tlr2−/− mice were treated with S1 protein (500 ng/ml), and the activation of P65 and IκBα was measured by Western blotting. (E, F) WT, Tlr2−/−, and Tlr4−/− macrophages were treated with S2 protein (500 ng/ml) or S-tri (500 ng/ml). The expression of cytokines was measured by real-time RT-PCR at 4 hr post-stimulation. Data represent mean ± SD (n=3); ***p<0.0001, ****p<0.00001 by unpaired Student’s t-test. Experiments were repeated two times and data of representative experiments are presented. (G) THP1 cells were stimulated with S2 protein (500 ng/ml), Pam3CSK4 (500 ng/ml), or LPS (100 ng/ml) in the presence or absence of Tlr2 inhibitor C29 (150 mM) for 4 hr. The expression of IL6, IL1B, and TNFA was measured by real-time RT-PCR. (H) WT and Tlr2−/− mice were administered with S1 and S2 protein (1 μg each/mouse). Blood collected before and 16 hr post S protein administration was measured for IL-6, IL-1β, and TNFα by ELISA. Data represent mean ± SEM (n=5); ***p<0.0001, ****p<0.00001 by unpaired Student’s t-test. Experiments were repeated two times and data of representative experiments are presented.
-
Figure 5—source data 1
Raw source data for B, E, F, G, H.
- https://cdn.elifesciences.org/articles/68563/elife-68563-fig5-data1-v2.xlsx
Figure 5—figure supplement 1
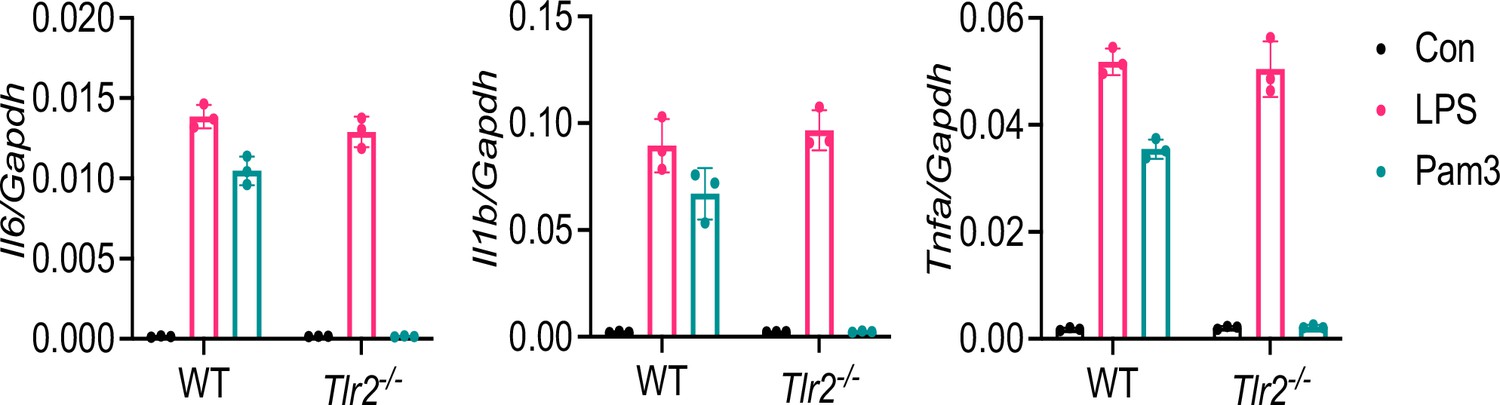
Macrophages of Tlr2−/− mice are defective in sensing TLR2 ligand Pam3CSK4.
BMDMs from WT and Tlr2−/− mice were stimulated with LPS (1 μg/l) or Pam3CSK4 (1 μg/ml) for 4 hr. The expression of inflammatory cytokines was measured by real-time RT-PCR. Data represent mean ± SD (n=3).
-
Figure 5—figure supplement 1—source data 1
Raw source data.
- https://cdn.elifesciences.org/articles/68563/elife-68563-fig5-figsupp1-data1-v2.xlsx
Figure 5—figure supplement 2
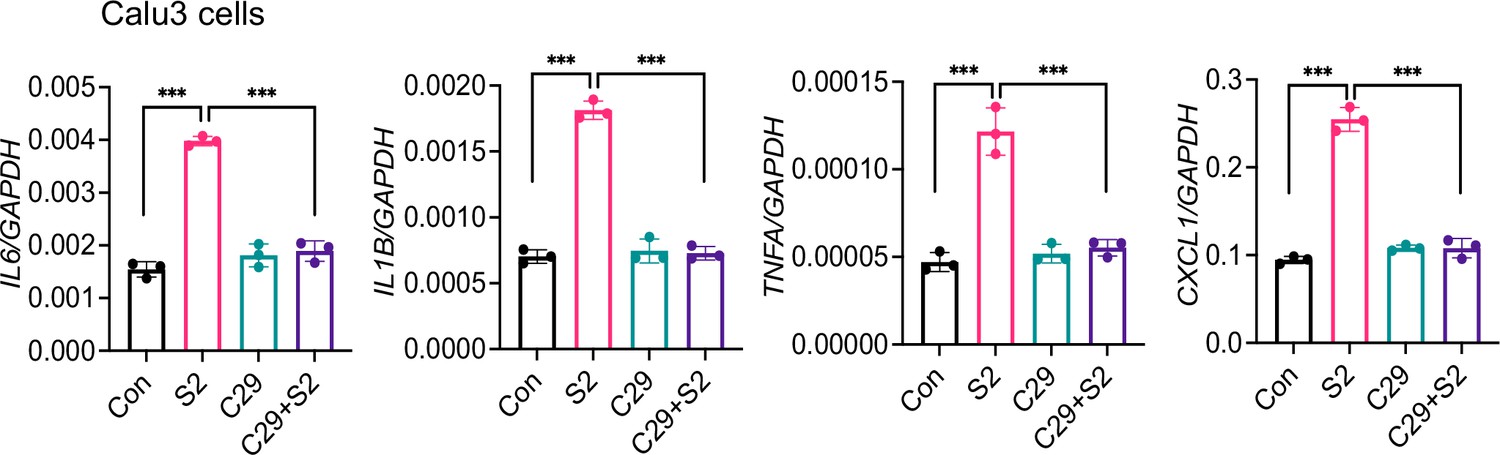
Inhibition of TLR2 abrogates S-mediated inflammatory response in Calu-3 cells.
Calu3 cells were stimulated with S2 (500 ng/ml) in the presence or absence of TLR2-inhibitor C29 (150 mM) for 24 hr. The expression of inflammatory cytokines was measured by real-time RT-PCR. Data represent mean ± SD (n=3); ***p<0.0001 by unpaired Student’s t-test. Experiments were repeated two times and data of representative experiments are presented.
-
Figure 5—figure supplement 2—source data 1
Raw source data.
- https://cdn.elifesciences.org/articles/68563/elife-68563-fig5-figsupp2-data1-v2.xlsx
Figure 6 with 2 supplements
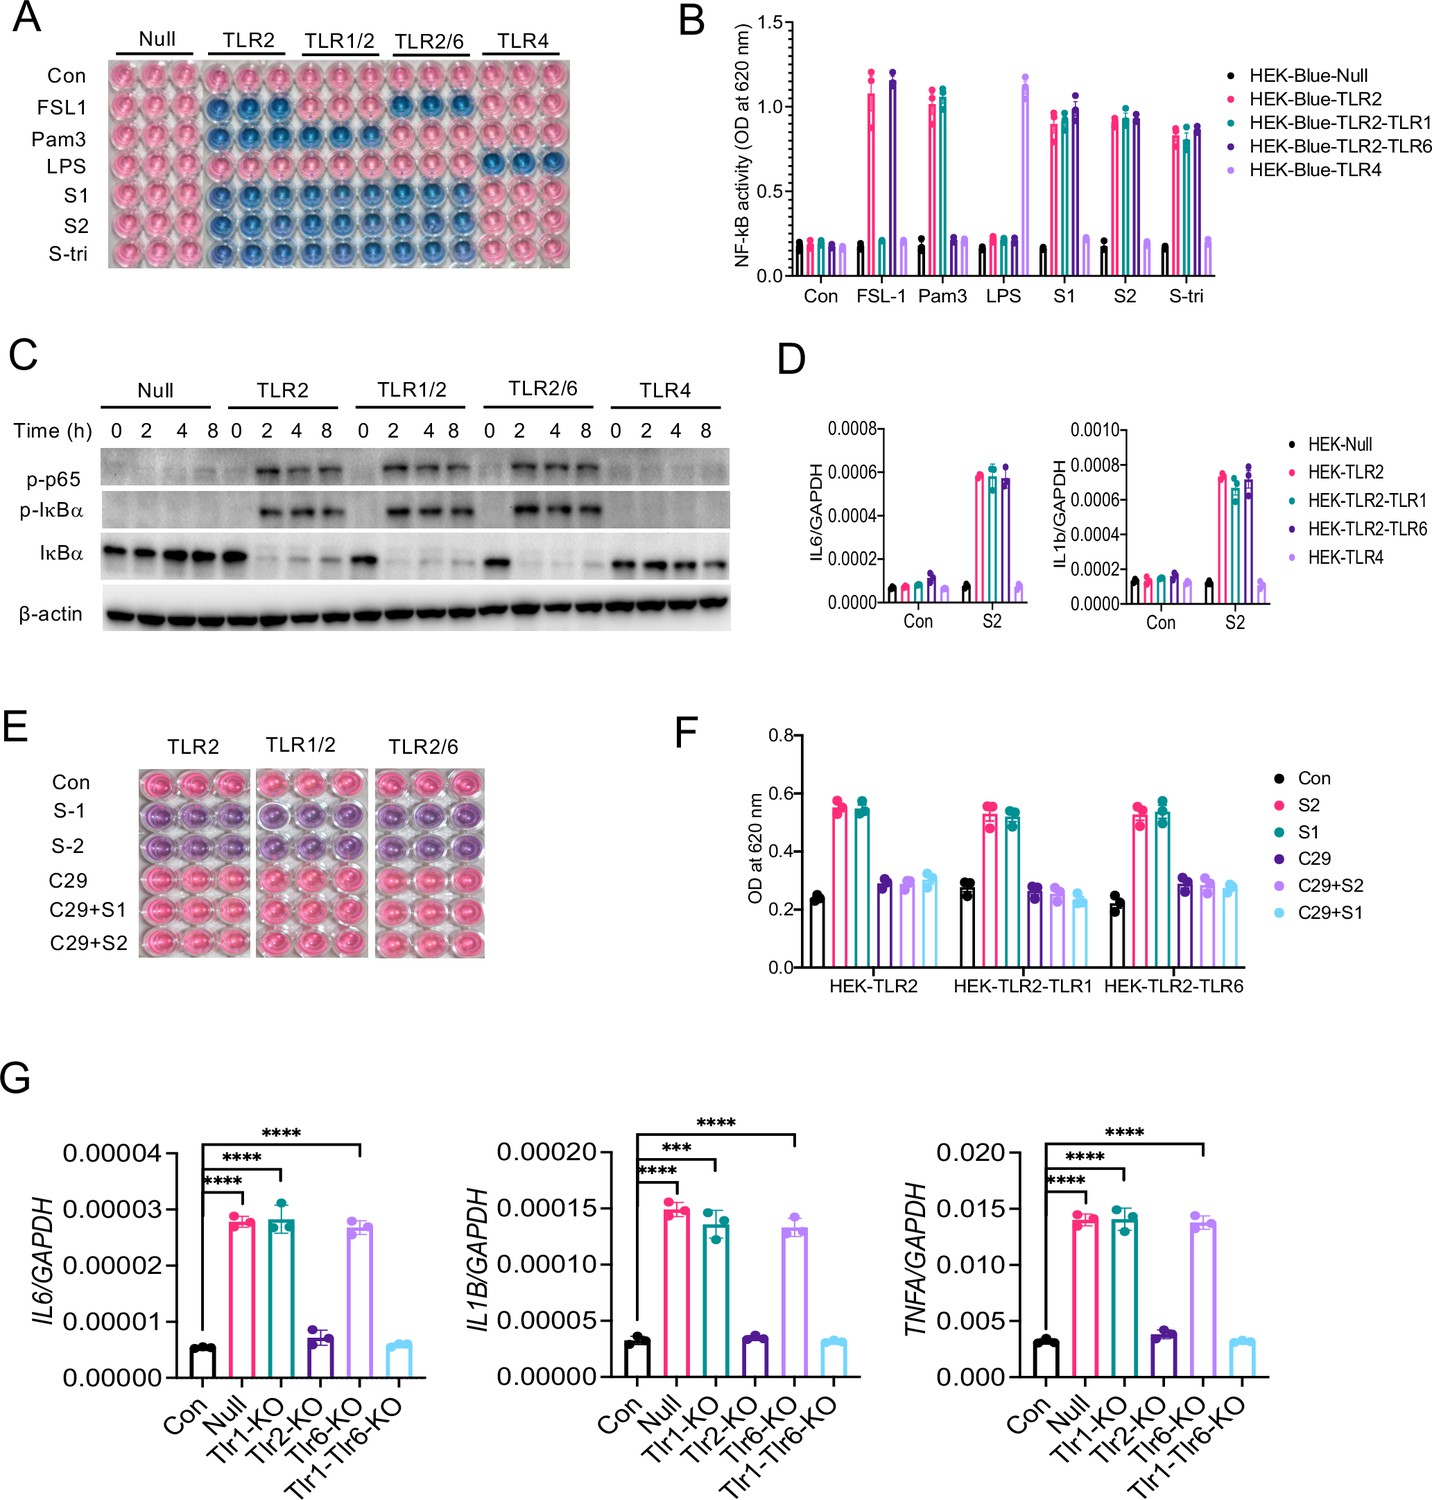
TLR1 and TLR6 are dispensable in S-mediated activation of TLR2/NF-κB pathway.
(A, B) HEK-Blue-Null, HEK-Blue-TLR2, HEK-Blue-TLR1/2, HEK-Blue-TLR2/6, and HEK-Blue-TLR4 were stimulated with S1, S2, or S-tri for 6 hr. FSL1, Pam3CSK4, and LPS were used as ligands for TLR2/1, TLR2/6, and TLR4, respectively. The activation of NF-κB was monitored by the blue color development (A), which was measured at 620 nm (B). (C) HEK-Blue-Null, HEK-Blue-TLR2, HEK-Blue-TLR1/2, HEK-Blue-TLR2/6, and HEK-Blue-TLR4 cells were stimulated with S2 (500 ng/ml) at indicated times. The activation of P-P65 and P-IκBα was measured by Western blot analysis. (D) HEK-Blue-Null, HEK2-Blue-TLR2, HEK-Blue-TLR1/2, HEK-Blue-TLR2/6, and HEK-Blue-TLR4 cells were stimulated with S2 (500 ng/ml) for 6 hr. The induction of IL6 and IL1B was measured by real-time RT-PCR. (E, F) HEK-Blue-TLR2, HEK-Blue-TLR2/1, and HEK-Blue-TLR2/6 cells were stimulated with S1 or S2 in the presence or absence of TLR2 inhibitor C29 (150 mM) for 6 hr. The NF-κB activity was monitored colorimetrically at 620 nm. (G, H) TLR1, TLR2, TLR6, or TLR1/6 were knocked out in Raw264.7 cells with CRISPR/Cas9. Cells were then stimulated with S2 protein (500 ng/ml) for 4 hr. (G) The expression of cytokines was measured by real-time RT-PCR. Data represent mean ± SD (n=5); ***p<0.0001, ****p<0.00001 by unpaired Student’s t-test. All experiments were repeated three times and data of representative experiments are presented.
-
Figure 6—source data 1
Raw source data for B, D, F, G.
- https://cdn.elifesciences.org/articles/68563/elife-68563-fig6-data1-v2.xlsx
Figure 6—figure supplement 1
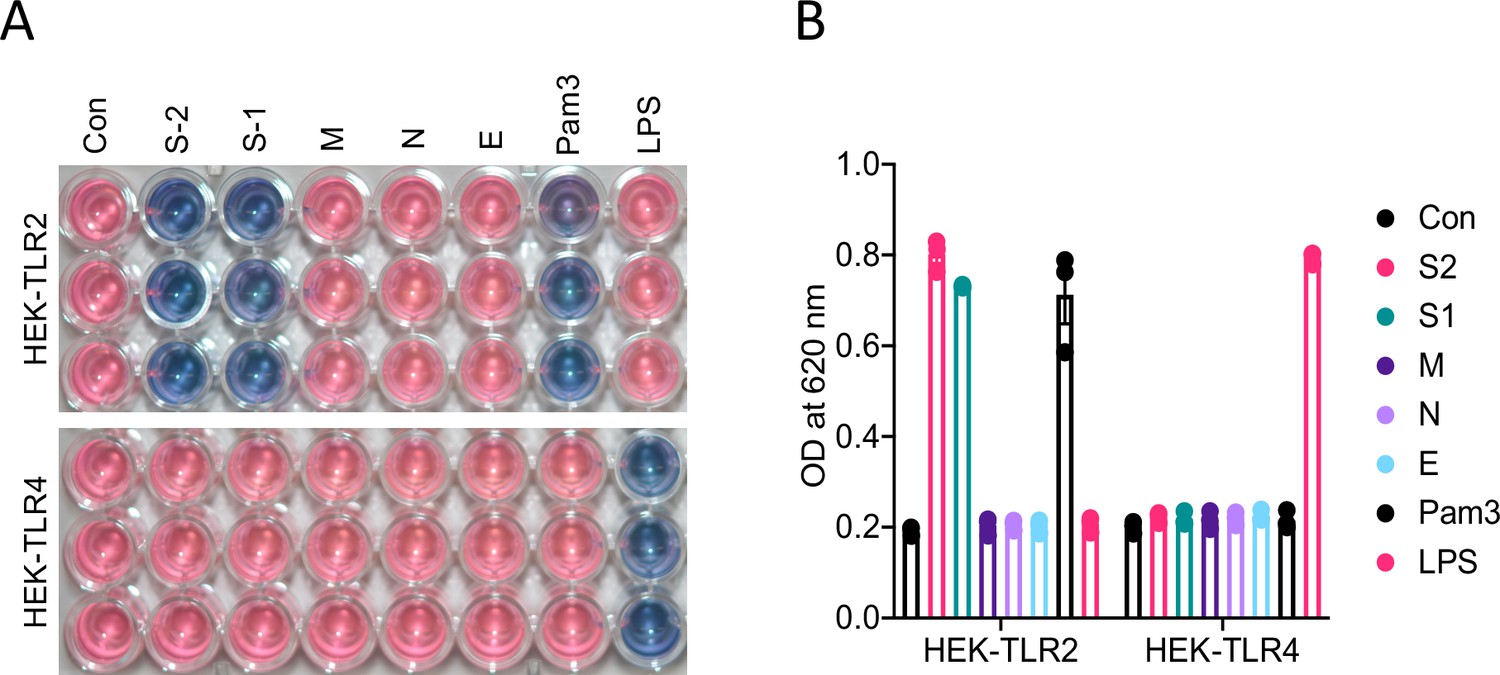
M, N, and E proteins do not activate TLR2 pathway.
HEK-Blue-TLR2 and HEK-Blue-TLR4 cells were stimulated with S1, S2, M, N, or E proteins (500 ng/ml of each protein). Six hours following stimulation, blue substrate activation was measured by optical density taken at 620 nm. Data represent mean ± SD (n=3). Experiments were repeated three times and data of representative experiments are presented.
-
Figure 6—figure supplement 1—source data 1
Raw source data.
- https://cdn.elifesciences.org/articles/68563/elife-68563-fig6-figsupp1-data1-v2.xlsx
Figure 6—figure supplement 2
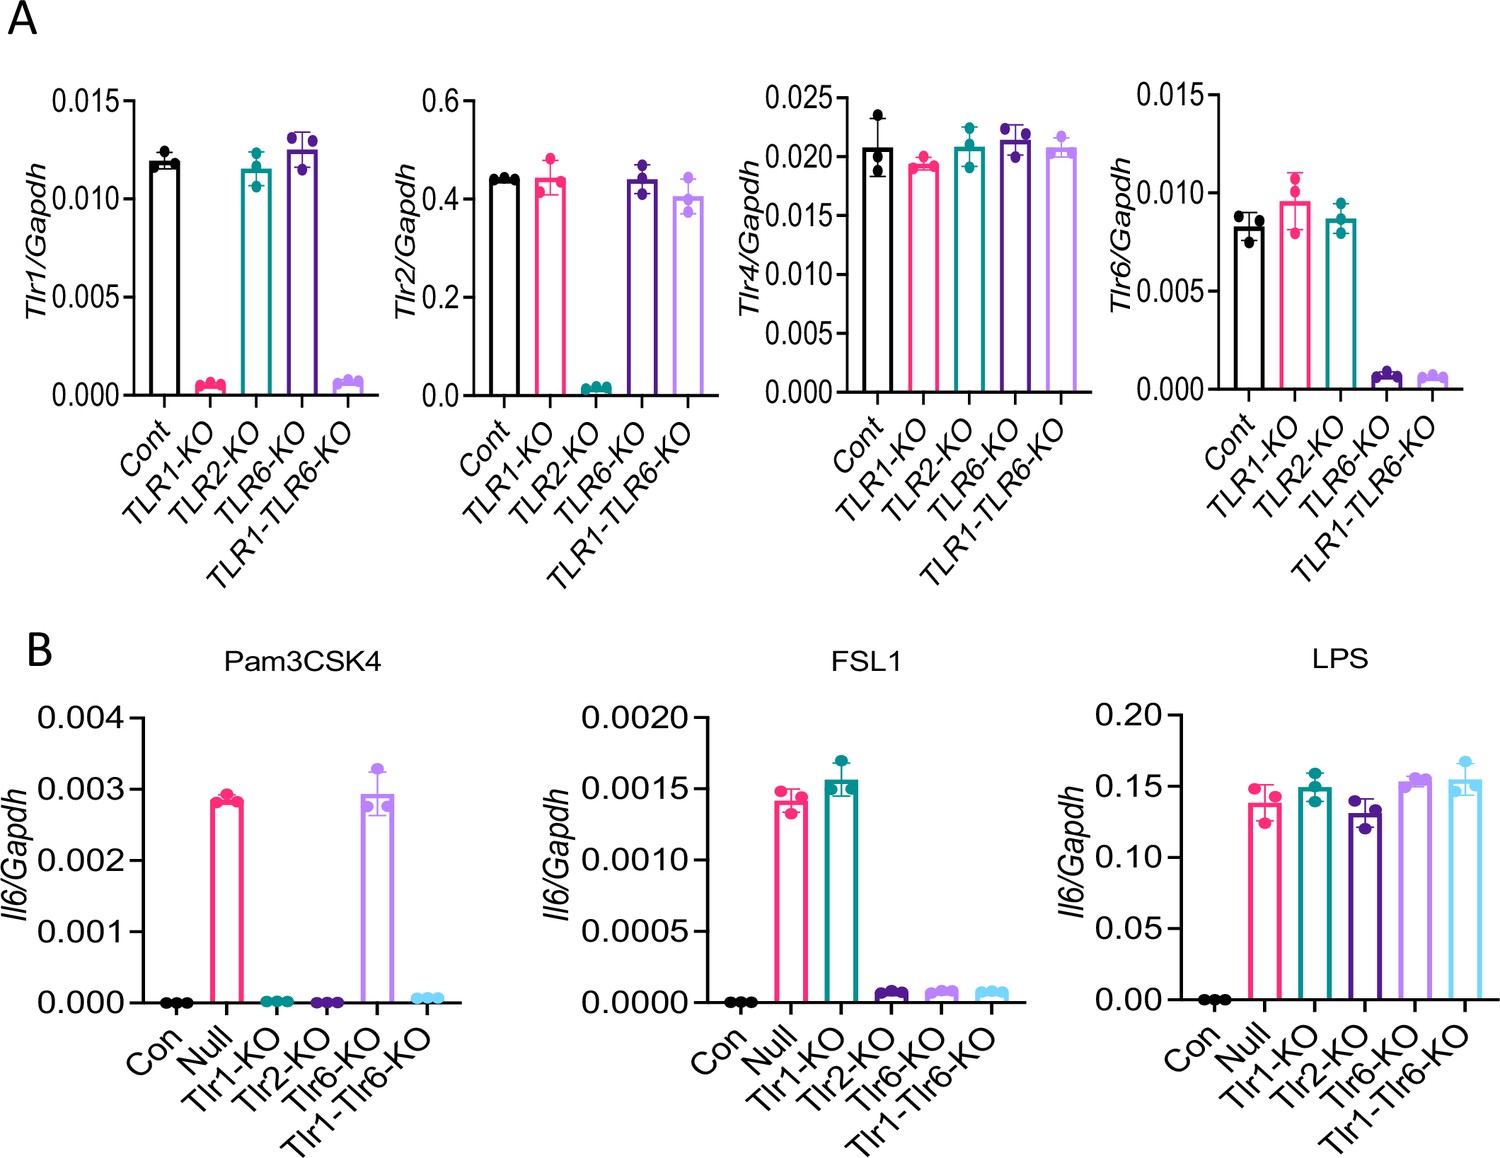
Knocking out of TLRs in Raw264.7 cells with CRISPR/Cas9.
Tlr1, Tlr2, Tlr6, or Tlr1/6 were knocked out in Raw264.7 cells with CRISPR/Cas9. (A) The expression of Tlr1, Tlr2, Tlr6, and Tlr4 was measured by real-time RT-PCR. (B) Knockout cells were stimulated with Pam3CSK4 (500 ng/ml), FSL1 (100 ng/ml), or LPS (100 ng/ml) for 4 hr. The expression of Il6 was measured by real-time RT-PCR. Data represent mean ± SD (n=3). Experiments were repeated two times and data of representative experiments are presented.
-
Figure 6—figure supplement 2—source data 1
Raw source data for A-B.
- https://cdn.elifesciences.org/articles/68563/elife-68563-fig6-figsupp2-data1-v2.xlsx
Tables
Appendix 1—key resources table
| Reagent type (species) or resource | Designation | Source or reference | Identifiers | Additional information |
|---|---|---|---|---|
| Genetic reagent (Mus musculus) | C57BL/6J | Jackson Laboratory | RRID:MGI:3028467JAX:000664 | |
| Genetic reagent (M. musculus) | Myd88−/− C57BL/6J | Jackson Laboratory | ||
| Genetic reagent (M. musculus) | Tlr2−/− C57BL/6J | Jackson Laboratory | B6.129-Tlr2tm 1kir/JStock No: 004650 | |
| Genetic reagent (M. musculus) | Tlr4−/− C57BL/6J | Jackson Laboratory | B6.B10ScN- Tlr4lps-del/JthJStock No: 007227 | |
| Cell line(Homo sapiens) | HEK-293T | ATCC | Cat# CRL-3216 | |
| Cell line(H. sapiens) | A549 | ATCC | Cat# CCL-185 | |
| Cell line(H. sapiens) | THP1 | ATCC | Cat# CRL-TIB-202 | Cat# CRL-TIB-202 |
| Cell line(H. sapiens) | Calu-3 | ATCC | Cat# HTB-55 | |
| Cell line(H. sapiens) | HEK-Blue-Null2 | InvivoGen | Cat# hkb-null2 | |
| Cell line(H. sapiens) | HEK-Blue-hTLR2 | InvivoGen | Cat# hkb-htlr2 | |
| Cell line(H. sapiens) | HEK-Blue-hTLR2-TLR1 | InvivoGen | Cat# hkb-htlr21 | |
| Cell line(H. sapiens) | HEK-Blue hTLR2-TLR6 | InvivoGen | Cat# hkb-htlr26 | |
| Cell line(H. sapiens) | HEK-Blue-hTLR4 | InvivoGen | Cat# hkb-htlr4 | |
| Cell line(H. sapiens) | Peripheral blood mononuclear cells | StemCell Technologies | Cat# 70025 | |
| Cell line(M. musculus) | Bone marrow- derived macrophage | This paper | See ‘Culture of mouse bone- marrow-derived macrophages’ in Materials and methods | |
| Cell line(M. musculus) | Primary lung epithelial cells | This paper | See ‘Culture of mouse primary lung epithelial cells’ in Materials and methods | |
| Cell line(M. musculus) | RAW264.7 | ATCC | Cat# TIB-71 | |
| Antibody | (Rabbit monoclonal) Phospho-NF- kB p65 | Cell Signaling | Cat# 3033 | WB (1:1000) |
| Antibody | (Mouse monoclonal) Phospho-IκBα | Cell Signaling | Cat# 9246 | WB (1:1000) |
| Antibody | (Rabbit monoclonal) IκBα | Cell Signaling | Cat# 4812 | WB (1:1000) |
| Antibody | (Rabbit monoclonal) anti-phospho p44/42 (ERK1/2) | Cell Signaling | Cat# 4370 | WB (1:2000) |
| Antibody | (Rabbit monoclonal) anti-p44/42 (ERK1/2) | Cell Signaling | Cat# 4695 | WB (1:2000) |
| Antibody | (Rabbit monoclonal) anti-phospho SAPK/JNK | Cell Signaling | Cat# 4668 | WB (1:1000) |
| Antibody | (Rabbit monoclonal) anti-phospho AKT | Cell Signaling | Cat# 4060 | WB (1:1000) |
| Antibody | (Rabbit monoclonal) anti-phospho STAT3 | Cell Signaling | Cat# 9145 | WB (1:1000) |
| Antibody | (Mouse monoclonal) anti-SARS-CoV-2 S | GeneTex | Cat# GTX632604 | WB (1:1000)FACS (1 μl/ 1×10⁶ cells) |
| Antibody | (Monoclonal) anti- CD16/CD32 | eBioscience | Cat# 14-0161-82 | FACS (1 μg/1×106 cells) |
| Antibody | (Mouse monoclonal) anti-β-actin | Sigma-Aldrich | Cat# A2228 | WB (1:10,000) |
| Recombinant DNA reagent | GFP-Flag (plasmid) | VectorBuilder | Cat# VB200507- 2985cmv | |
| Recombinant DNA reagent | SARS-CoV-2 S-Flag | VectorBuilder | Cat# VB200507- 2984jyv | |
| Recombinant DNA reagent | TLR1 CRISPR/Cas9 | Santa Cruz | Cat# sc-423418 | |
| Recombinant DNA reagent | TLR2 CRISPR/Cas9 | Santa Cruz | Cat# sc-423981 | |
| Recombinant DNA reagent | TLR6 CRISPR/Cas9 | Santa Cruz | Cat# sc-423420 | |
| Sequence- based reagent | m_Il1b_F | This paper | PCR primers | GCCTCGTG CTGTCGG ACCCATA |
| Sequence- based reagent | m_Il1b_R | This paper | PCR primers | TGCAGGGT GGGTGTG CCGTCTT |
| Sequence- based reagent | m_Il6_F | This paper | PCR primers | CAA GAA AGA CAA AGC CAG AGT C |
| Sequence- based reagent | m_Il6_R | This paper | PCR primers | GAA ATT GGG GTA GGA AGG AC |
| Sequence- based reagent | m_Tnfa_F | This paper | PCR primers | TCCCAGGTTC TCTTCAAGGGA |
| Sequence- based reagent | m_Tnfa_R | This paper | PCR primers | GGTGAGGAG CACGTAGTCGG |
| Sequence- based reagent | m_Ifng_F | This paper | PCR primers | GAAAGACAA TCAGGCCATCA |
| Sequence- based reagent | m_Ifng_R | This paper | PCR primers | TTGCTGTTGC TGAAGAAGGT |
| Sequence- based reagent | m_Ifnb_F | This paper | PCR primers | GCCTGGATG GTGGTC CGAGCA |
| Sequence- based reagent | m_Ifnb_R | This paper | PCR primers | TACCAGTCC CAGAGTCC GCCTCT |
| Sequence- based reagent | m_Ifna_F | This paper | PCR primers | TCTGATGCA GCAGGTGGG |
| Sequence- based reagent | m_Ifna_R | This paper | PCR primers | AGGGCTCT CCAGACTTC TGCTCTG |
| Sequence- based reagent | m_Cxcl1_F | This paper | PCR primers | TGAGCTGCG CTGTCA GTGCCT |
| Sequence- based reagent | m_Cxcl1_R | This paper | PCR primers | AGAAGCCA GCGTTCA CCAGA |
| Sequence- based reagent | m_Cxcl2_F | This paper | PCR primers | CAA GAA CAT CCA GAG CTT GAG TGT |
| Sequence- based reagent | m_Cxcl2_R | This paper | PCR primers | GCC CTT GAG AGT GGC TAT GAC TT |
| Sequence- based reagent | h_IL1B _F | This paper | PCR primers | AAATACCTG TGGCCTTGGGC |
| Sequence- based reagent | h_IL1B _F | This paper | PCR primers | TTTGGGATC TACACTC TCCAGCT |
| Sequence- based reagent | h_IL6 _F | This paper | PCR primers | GTAGCCGC CCCACACAGA |
| Sequence- based reagent | h_IL6 _R | This paper | PCR primers | CATGTCTCCT TTCTCAG GGCTG |
| Sequence- based reagent | h_TNFA_F | This paper | PCR primers | CCCAGGGA CCTCTCT CTAATCA |
| Sequence- based reagent | h_TNFA_R | This paper | PCR primers | GCTTGAGGG TTTGCTA CAACATG |
| Sequence- based reagent | h_IFNG_F | This paper | PCR primers | CCAACGCAAA GCAATACATGA |
| Sequence- based reagent | h_IFNG_R | This paper | PCR primers | CCTTTTTCG CTTCCCT GTTTTA |
| Sequence- based reagent | h_IFNB_F | This paper | PCR primers | ATTGCCTCAA GGACAGGATG |
| Sequence- based reagent | h_IFNB_R | This paper | PCR primers | GGCCTTCA GGTAA TGCAGAA |
| Sequence- based reagent | h_IFNA_F | This paper | PCR primers | GTGAGGAAAT ACTTCCAAA GAATCAC |
| Sequence- based reagent | h_IFNA_R | This paper | PCR primers | TCTCATGAT TTCTGCTCT GACAA |
| Sequence- based reagent | h_CXCL1_F | This paper | PCR primers | AACCGAAGT CATAGCCACAC |
| Sequence- based reagent | h_CXCL1_R | This paper | PCR primers | CCTCCCTTC TGGTCAGTT |
| Sequence- based reagent | h_CXCL2_F | This paper | PCR primers | CGCCCAAAC CGAAGTCAT |
| Sequence- based reagent | h_CXCL2_R | This paper | PCR primers | GATTTGCCATT TTTCAG CATCTTT |
| Sequence- based reagent | h_CCL2_F | This paper | PCR primers | AGGTGACTGG GGCATTGAT |
| Sequence- based reagent | h_CCL2_R | This paper | PCR primers | GCCTCCAGCA TGAAAGTCTC |
| Peptide, recombinant protein | SARS-CoV-2 S1 | RayBiotech | Cat# 230-30161 | |
| Peptide, recombinant protein | SARS-CoV-2 S1 | R&D | Cat# 10569- CV-100 | |
| Peptide, recombinant protein | SARS-CoV-2 S2 | RayBiotech | Cat# 230-30163 | |
| Peptide, recombinant protein | SARS-CoV-2 S2 | R&D | Cat# 10594- CV-100 | |
| Peptide, recombinant protein | SARS-CoV-2 S-trimer | R&D | Cat# 10549- CV-100 | |
| Peptide, recombinant protein | SARS-CoV-2 N | RayBiotech | Cat# 230-30164 | |
| Peptide, recombinant protein | SARS-CoV-2 M | MyBioSource | Cat# MBS8574735 | |
| Peptide, recombinant protein | SARS-CoV-2 E | MyBioSource | Cat# MBS9141944 | |
| Commercial assay or kit | Pierce BCA Protein Assay Kit | Thermo Fisher Scientific | Cat# 23227 | |
| Commercial assay or kit | Mouse IL-6 ELISA Kit | R&D Systems | Cat# DY406-05 | |
| Commercial assay or kit | Mouse IL-1β ELISA Kit | R&D Systems | Cat# DY401-05 | |
| Commercial assay or kit | Mouse TNF-α ELISA Kit | R&D Systems | Cat# DY410-05 | |
| Commercial assay or kit | Human IL-6 ELISA Kit | R&D Systems | Cat# DY206-05 | |
| commercial assay or kit | Human IL-1β ELISA Kit | R&D Systems | Cat#DY201-05 | |
| Commercial assay or kit | Human TNF-α ELISA Kit | R&D Systems | Cat# DY210-05 | |
| Commercial assay or kit | SARS-CoV-2 S ELISA Kit | RayBiotech | Cat# ELV-COVID19S2 | |
| Chemical compound, drug | Phorbol-12- myristate 13- acetate (PMA) | InvivoGen | Cat# tlrl | 100 ng/ ml |
| Chemical compound, drug | TLR2-IN-C29 | Selleckchem | S6597 | 150 μM/ ml |
| Chemical compound, drug | Pam3CSK4 | InvivoGen | tlrl-pms | |
| Chemical compound, drug | FSL-1 | InvivoGen | tlrl-fsl | |
| Chemical compound, drug | ACE2 Inhibitor, MLN-4760 | Sigma-Aldrich | 5306160001 | 10 μM/ ml |
| Chemical compound, drug | Lipofectamine 3000 | Thermo Fisher Scientific | Cat# L3000015 | |
| Chemical compound, drug | Ultrapure Escherichia coli- derived LPS | InvivoGen | Cat# tlrl-smlps | |
| Software, algorithm | Flowjo v10 | Treestar, Inc | RRID:SCR_008520 | |
| Software, algorithm | CytoFLEX- | Beckman Coulter | ||
| Software, algorithm | GraphPad Prism | Graphpad.com | RRID:SCR_00279 |
Additional files
Download links
A two-part list of links to download the article, or parts of the article, in various formats.
Downloads (link to download the article as PDF)
Open citations (links to open the citations from this article in various online reference manager services)
Cite this article (links to download the citations from this article in formats compatible with various reference manager tools)
SARS-CoV-2 spike protein induces inflammation via TLR2-dependent activation of the NF-κB pathway
eLife 10:e68563.
https://doi.org/10.7554/eLife.68563


