Niche partitioning facilitates coexistence of closely related honey bee gut bacteria
- Department of Fundamental Microbiology, University of Lausanne, Switzerland
- Institute of Molecular Systems Biology, ETH Zürich, Switzerland
Figures
Figure 1
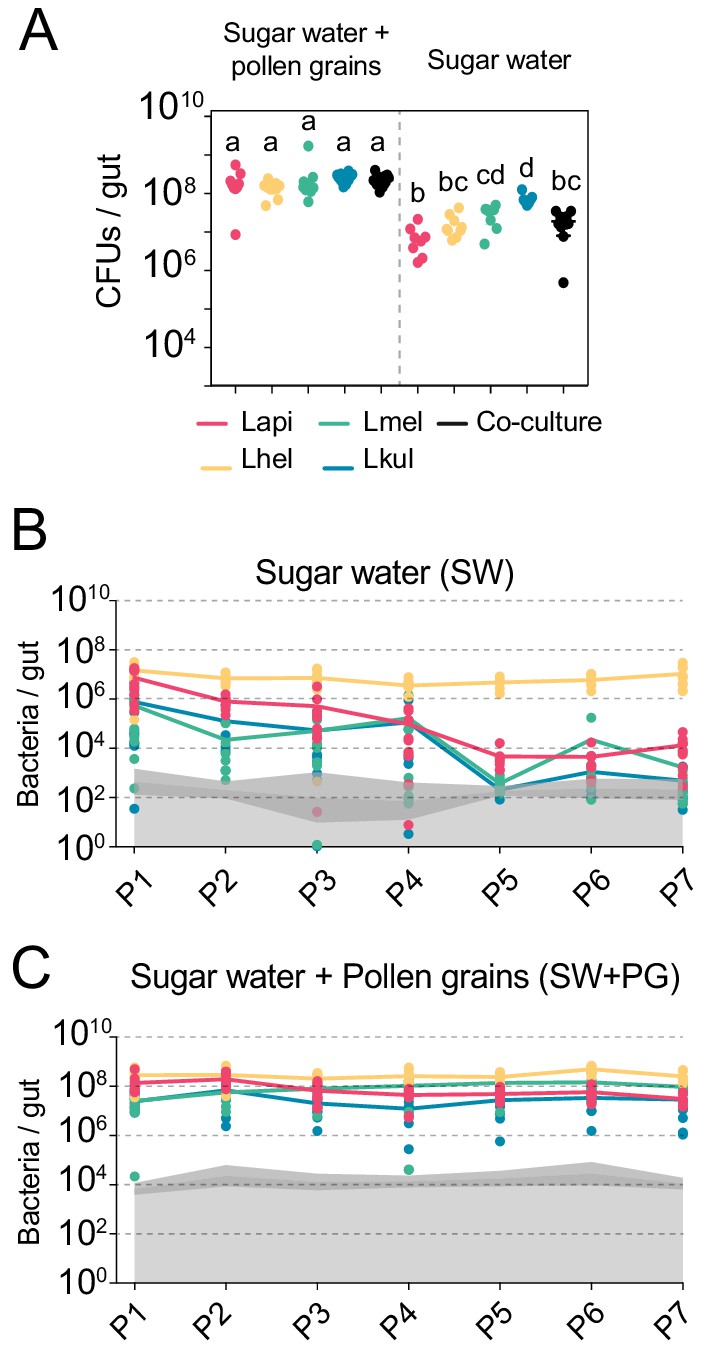
The presence of dietary pollen facilitates the stable coexistence of the four Lactobacillus species in the honey bee gut.
(A) Bacterial abundance (CFUs) in the gut of gnotobiotic bees (n = 7–10) colonized with the four species separately or together under two different dietary conditions. Bees were sampled five days after colonization. Statistical differences (ANOVA with Tuckey post-hoc test and BH correction) are depicted by different letters. (B, C) Changes in the absolute abundance of each member of the four-species community across the seven serial passages (P1–P7) through the gut of gnotobiotic bees. The absolute abundance of each species was determined by multiplying the total number of CFUs with the relative abundance of each species in the community. Grey areas represent the limit of detection which can vary depending on the sequencing depth of each replicate (see Materials and methods). Therefore, the average limit of detection and the 95% confidence intervals are shown.
Figure 2 with 2 supplements
The stable coexistence of the four Lactobacillus species can be recapitulated in vitro in the presence of pollen.
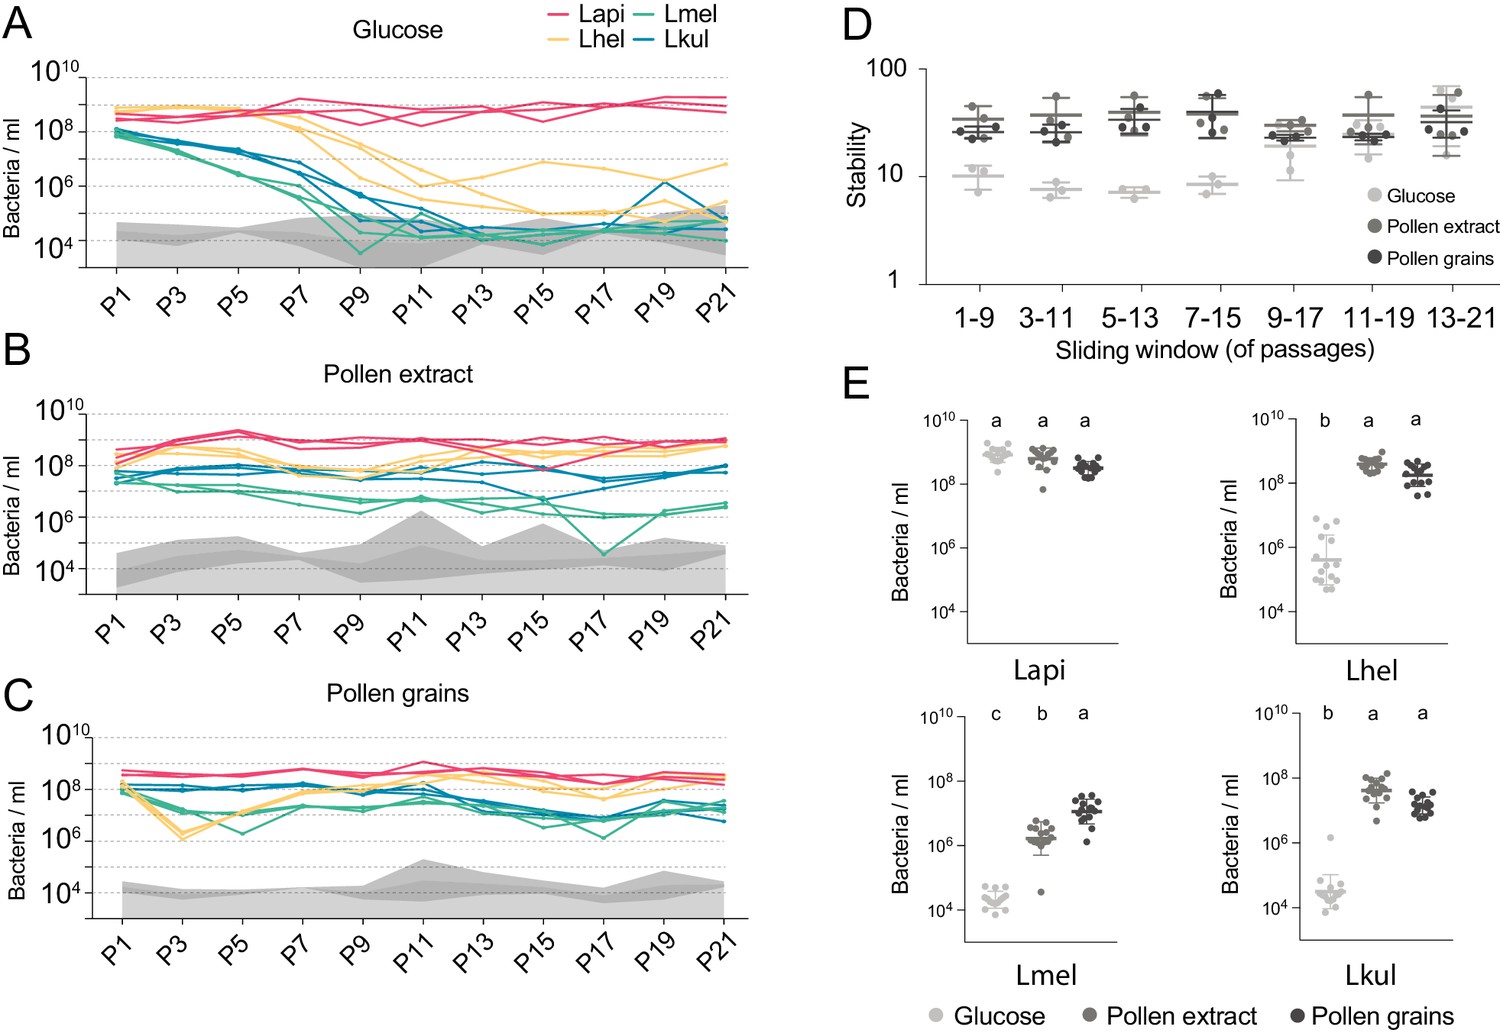
(A–C) Changes in total abundance of the four species when serial passaged in co-culture for 21 times in minimal medium supplemented with (A) 2% (w/v) glucose, (B) 10% (v/v) pollen extract, and (C) 10% (v/v) pollen grains. The absolute abundance of each species was determined by multiplying the total number of CFUs with the proportion of each strain in a given sample as based on amplicon sequencing (see Materials and methods). Gray areas indicate the limit of detection as explained in the Materials and methods. (D) Community stability of each replicate calculated based on the species abundances for a sliding window of five passages with a step size of 1. (E) Absolute abundance of each species across the three treatments considering the replicates of passages 13–21, which is when the community reached stability. Statistical differences (ANOVA with Tuckey post-hoc test and BH correction) are depicted by different letters.
Figure 2—figure supplement 1

Colony-forming units (CFUs) per ml of culture after 24 hr of growth of the four species in mono-cultures (n=3) or in co-culture (n=3) in the presence of 2% (w/v) glucose (G), 10% pollen extract (PE), or 10% pollen grains (PG).
Statistical differences: ANOVA with Tuckey post-hoc test (BH correction), represented by different letters.
Figure 2—figure supplement 2
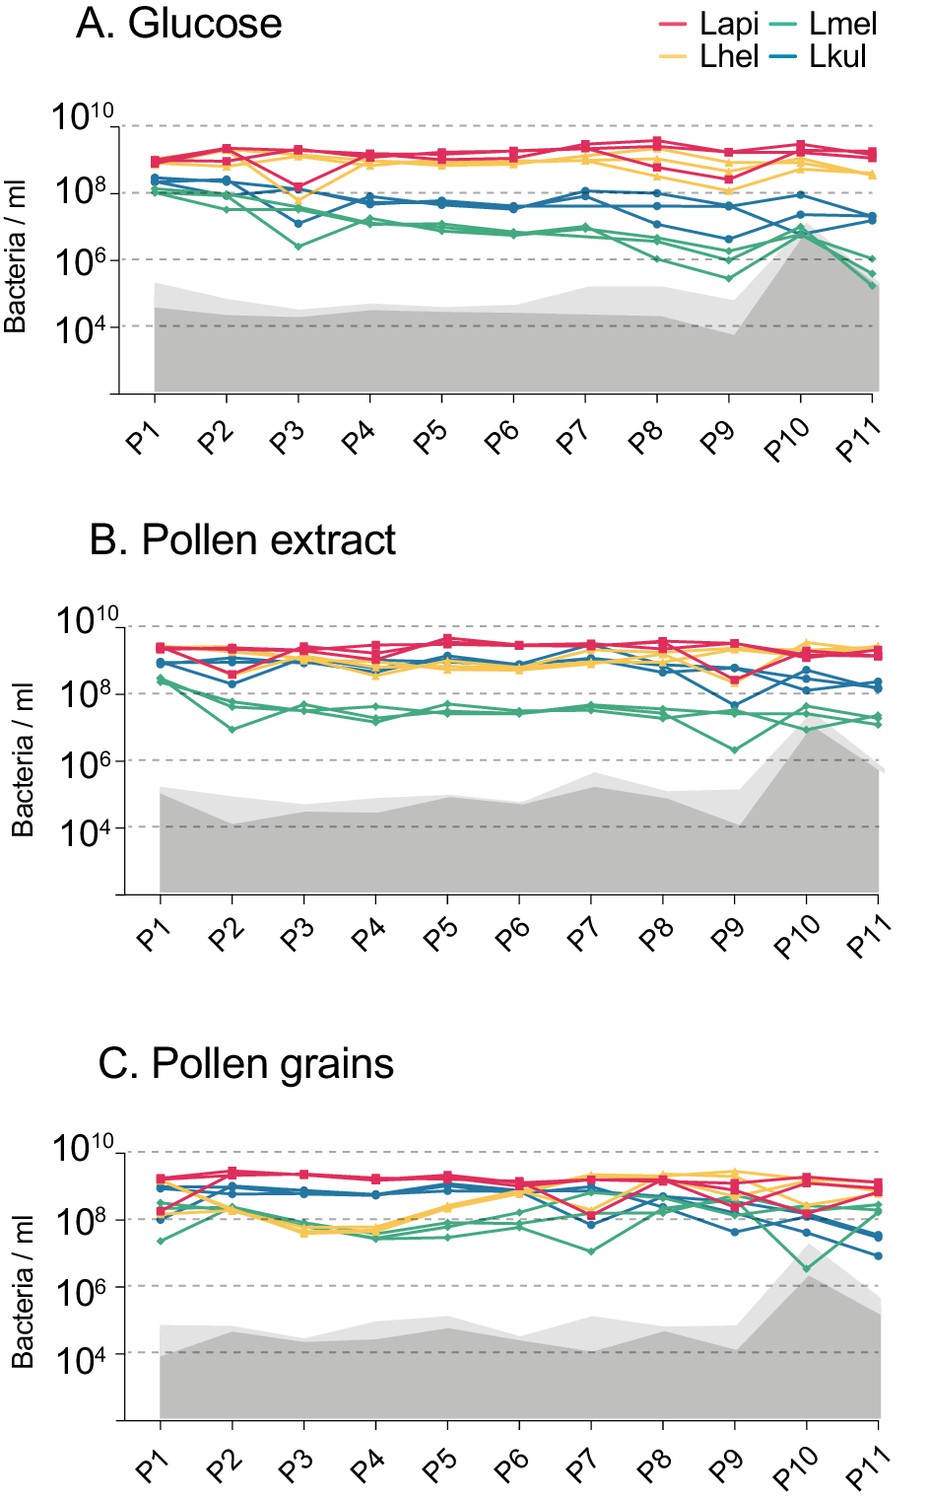
Second in vitro transfer experiment.
Changes in total bacterial abundance of the four species across the 11 serially passaged co-cultures in minimal medium supplemented with either 2% (w/v) glucose (A), 10% pollen extract (B), or 10% pollen grains (C). The absolute abundance of each species was determined by multiplying the total number of CFUs with the proportion of each strain in a given sample as based on amplicon sequencing. Gray areas (light gray = 95% CI) represent the limit of detection as explained in Figure 1 (see Materials and method).
Figure 3 with 1 supplement
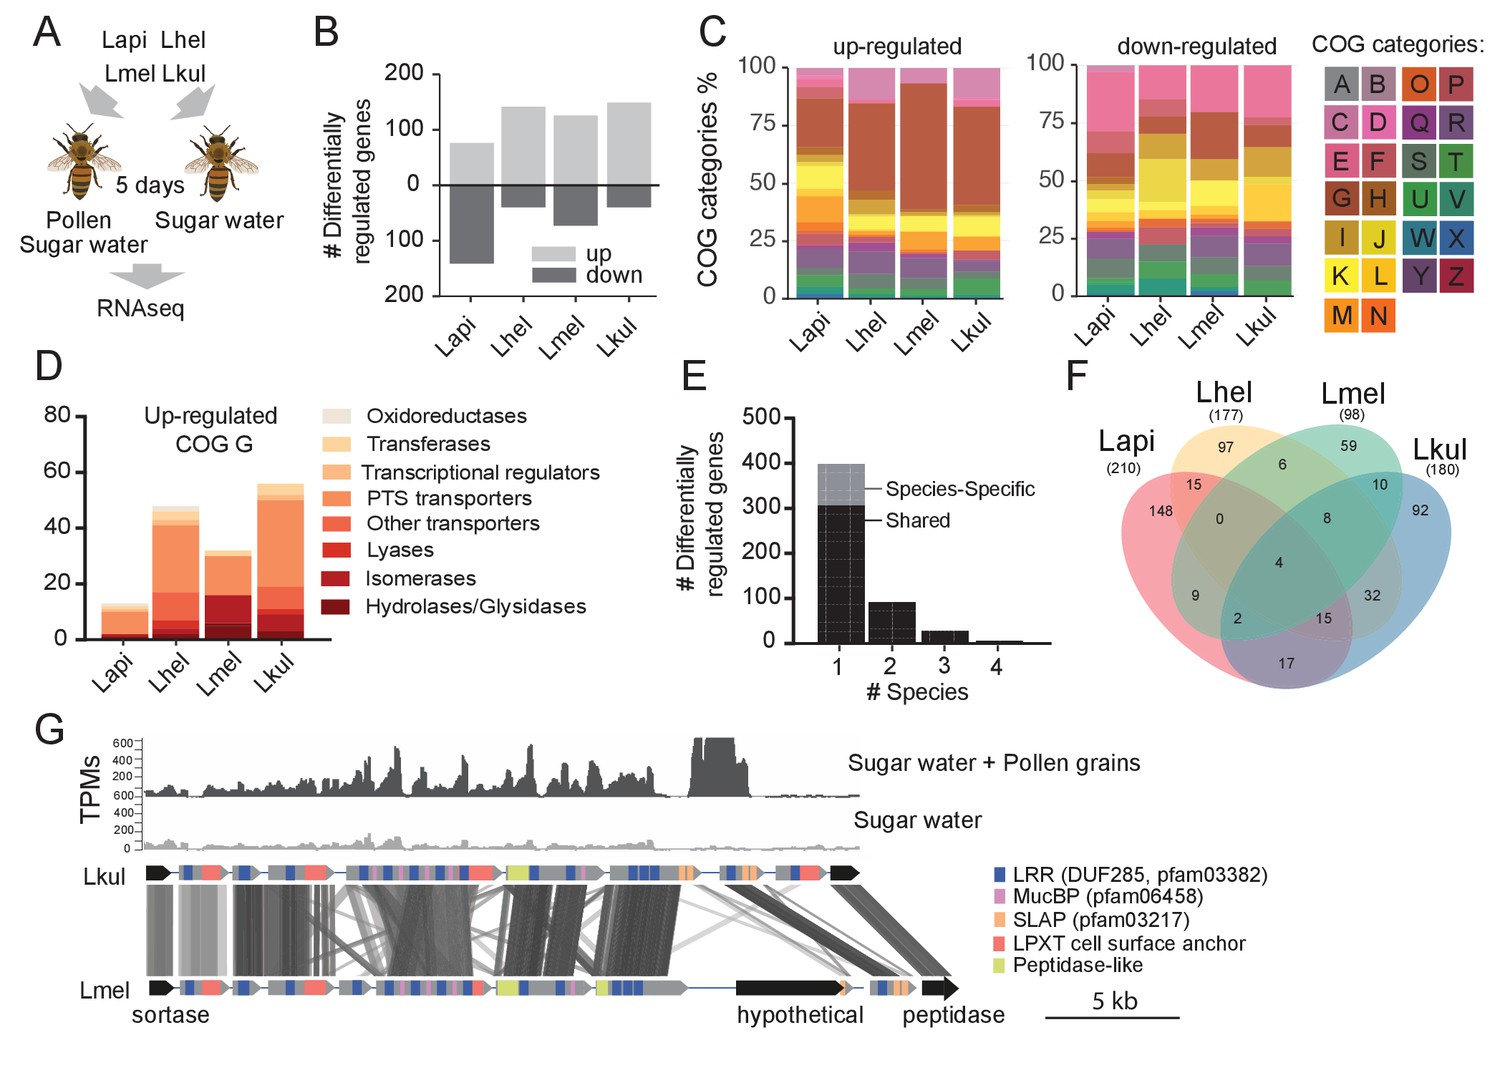
Transcriptome analysis of the four Lactobacillus species during co-colonization of gnotobiotic bees.
(A) Schematic outline of the RNA-Seq experiment. (B) Number of differentially regulated genes (log2FC ≥ |2| and p-value ≤ 0.01) in each species during co-colonization of gnotobiotic bees fed either pollen and sugar water (PG+SW) or sugar water only (SW). Up- and down-regulated genes are shown in different gray tones. (C) COG categories of genes up- or down-regulated by the four species in SW+PG if compared to SW. For COG definitions, see Supplementary file 2 (D) Functional sub-categories of COG ‘G’ genes upregulated in SW+PG if compared to SW. (E) Barplot displaying numbers of gene families differentially regulated in one species, two species, three species, or four species. Gene families differentially regulated in only one species are split into those that have homologs in the other species or that are species-specific.(F) Venn diagram showing overlap of gene families (based on gene homology) differentially regulated in the four species. (G) Transcripts per million (TPM) for two representative samples of the SW+PG and the SW treatments over a genomic region of Lkul encoding Lactobacillus-specific surface proteins. The genomic region of Lkul is compared to a similar region identified in Lmel which is also differentially regulated across the two treatments (expression profile not shown). Similarity between genes is shown by vertical lines. Gray tones indicate level of similarity. Surface protein-encoding genes are show in grey with the different domains and motifs shown according to the color legend.
Figure 3—figure supplement 1

MDS plots of in vivo RNA-seq samples.
Counts per million (cpm) were calculated for each sample (n=5) and visualized using multidimensional scaling (MDS) plots. X- and y-axis axes show first and second MDS dimension, respectively. Shapes size correspond to the samples libraries size. A few samples of the SW treatment did not cluster with the other replicates (two samples for Lmel, and one sample for each Lhel and Lkul), in part because relatively few reads mapped to the reference genomes of these strains.
Figure 4
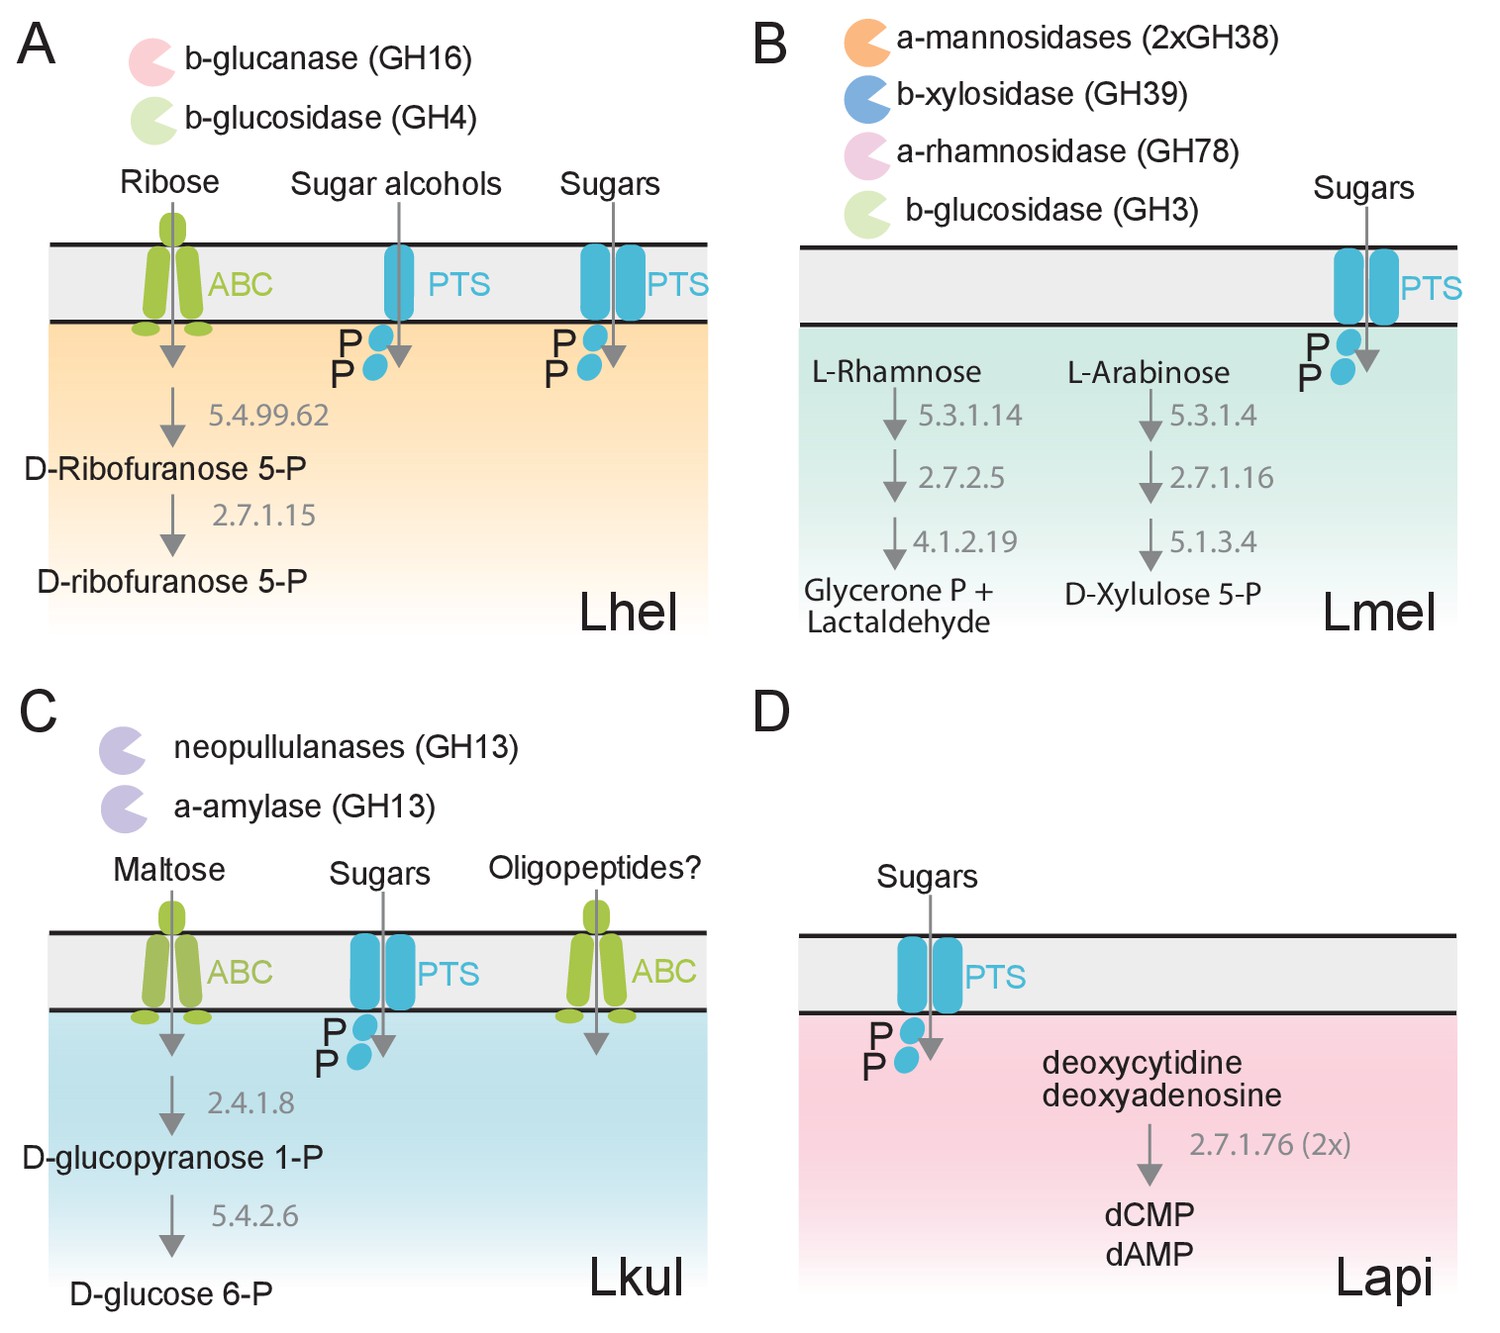
The four Lactobacillus species upregulate different carbohydrate metabolism functions during gut colonization of gnotobiotic bees.
(A) Lhel, (B) Lmel, (C) Lkul, (D) Lapi. Only enzymes and transporters that are upregulated in a species-specific manner in the pollen treatment versus the sugar water treatment are shown. The figure is not exhaustive, but highlights the main differences that could be identified based on gene annotations among all differentially regulated genes (Supplementary file 6). Glycosidases belonging to different CAZyme families are represented by different colors. ABC: ABC transporters, PTS: phosphotransferase system transporters. Numbers indicate EC numbers of upregulated enzymatic steps.
Figure 5 with 1 supplement
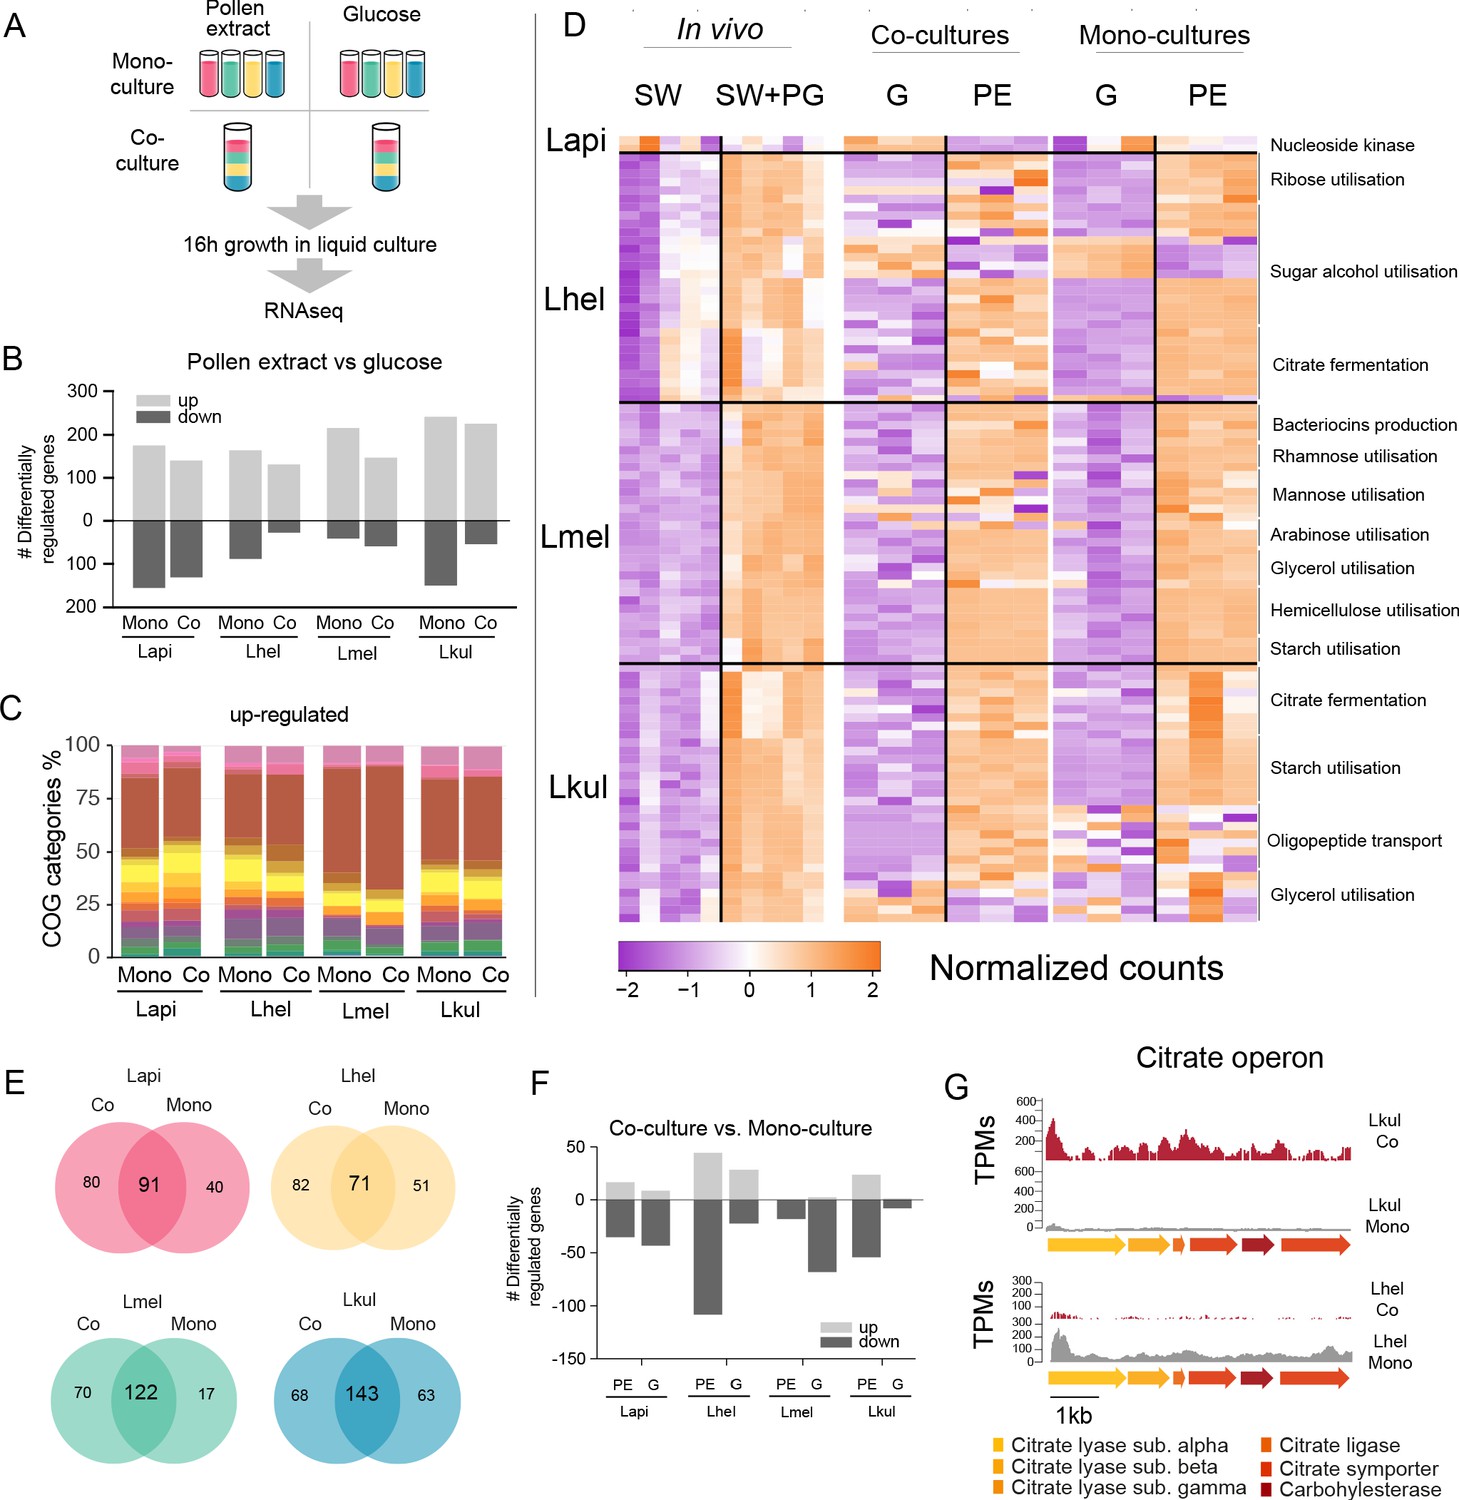
Transcriptome analysis of the four Lactobacillus species grown in vitro in pollen extract or in glucose.
(A) Scheme of the 2x2 experimental design. Species were grown alone or together, in either glucose (G) or pollen extract (PE). (B) Number of differentially regulated genes in each of the four species in the presence of PE if compared to G. Mono, mono-culture, Co, co-culture. Up- and down-regulated genes are shown in different gray tones. (C) COG categories of genes up-regulated by the four species in the presence of PE if compared to G. The colors are the same as in Figure 3C. For COG definitions, see Supplementary file 2 Heatmap displaying normalized counts of selected genes differentially regulated across the in vivo and in vitro RNA-Seq experiments. We selected metabolic genes and gene clusters that were identified in the in vivo experiment to be differentially regulated across the two treatments and which could be assigned a putative function based on annotation. Counts were normalized for each gene and dataset separately, that is in vivo, co-cultures, and mono-cultures. (E) Venn diagrams displaying the overlap of the genes differentially regulated between the PE and G treatment when the four species were grown in co-culture (Co) and mono-culture (Mono). (F) Number of differentially regulated genes in each of the four species in co-culture relative to mono-culture. Up- and down-regulated genes are shown in different gray tones. (G) Transcripts per million (TPM) over a genomic region of Lkul and Lmel encoding genes for citrate fermentation (i.e. citrate operon) for a representative sample of the co-culture and the mono-culture treatment when grown in PE.
Figure 5—figure supplement 1

MDS plots of in vitro RNA-seq samples.
Counts per million (cpm) were calculated for each sample (n=3) and visualized using multidimensional scaling (MDS) plots. X- and y-axis axes show first and second MDS dimension, respectively. Filled shapes represent mono-culture samples and empty shapes represent co-culture samples. Shapes size corresponds to the libraries size of that sample.
Figure 6 with 5 supplements
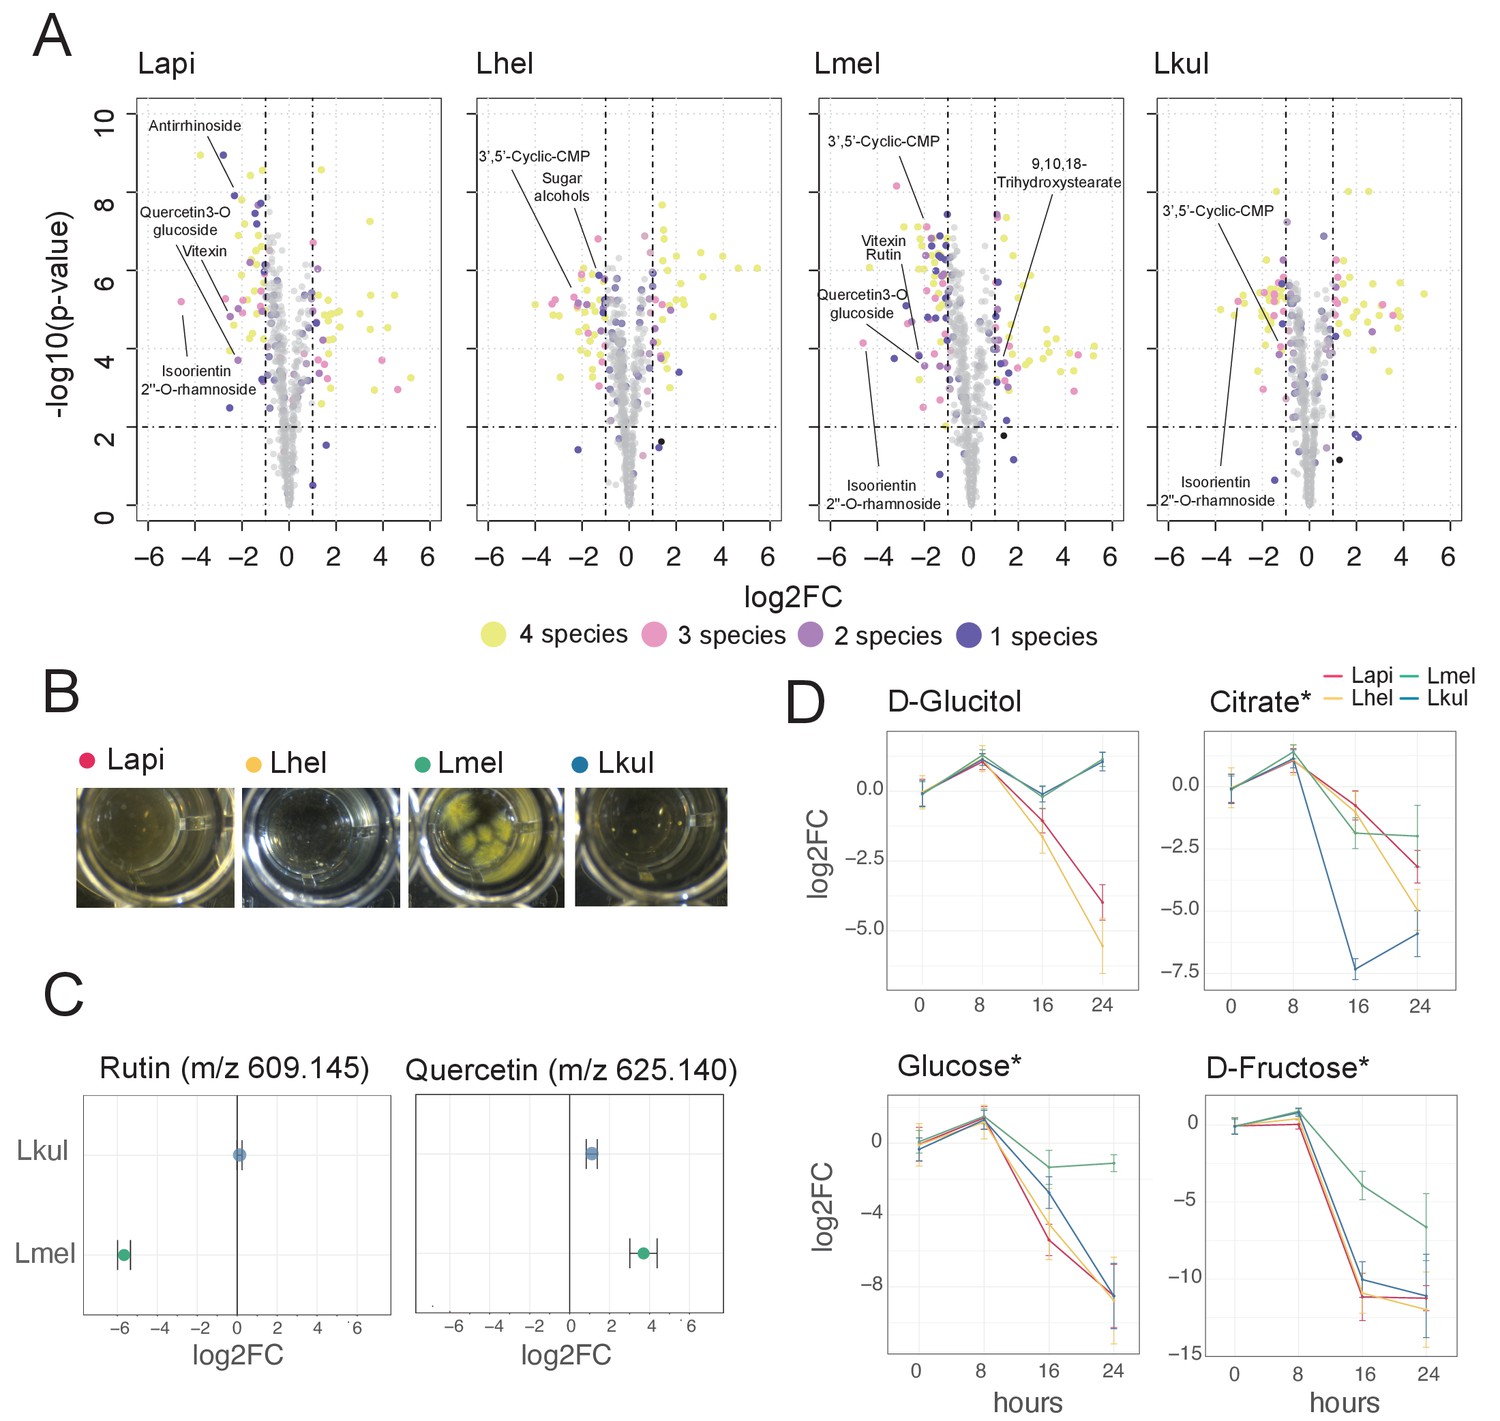
Metabolomics analysis shows differences in the utilization of pollen-derived glycosides across the four Lactobacillus species.
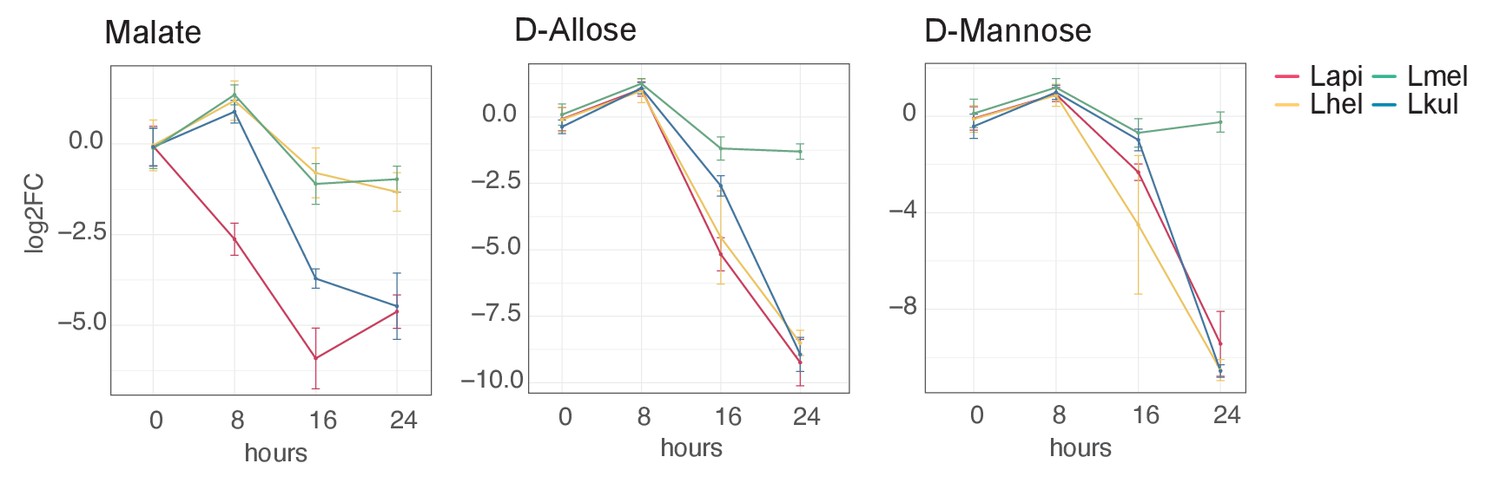
(A) Volcano plots displaying ions with significant fold changes (FC) for each of the four species after 16 hr of growth in pollen extract versus glucose. Each dot corresponds to an ion in the untargeted metabolomics dataset. Different colors represent ions that significantly change over time in one, two, three, or four species. Dashed black lines represent the significance thresholds: p-value < 0.01 and log2FC < −1 or > 1. (B) Culture wells of the four species grown in cfMRS + 0.05% rutin after 16 hr of incubation. The yellow precipitate is only visible for Lmel. (C) Rutin and quercetin detection in spent medium of Lmel and Lkul grown in cfMRS + 0.05% rutin after 16 hr of incubation (n=5). (D) Changes in key metabolites during growth measured by GC-MS (n=5). Log2FC relative to time point 0 is plotted. Time is reported in hours. * Indicates metabolites whose identity was confirmed using analytical standards. For m/z values see Supplementary file 10.
Figure 6—figure supplement 1

PCA in vitro metabolomics.
Principal component analysis (PCA) of the metabolome profile of each species based on the log2FC values calculated between the two time-points for each ion. The larger the distance between species on the PCA axes, the more they differ in their metabolome profiles. The arrows, that is the environmental vectors, point in the direction of the maximum correlation with the environmental variable, that is the ions. The ions on the tip of the longest arrows are the ones that explain the most of the distribution of the data within the PCA. Only the top 24 ions explaining the data distribution are displayed.
Figure 6—figure supplement 2

Definition of pollen-derived ions.
Volcano plot displaying R2 values obtained from the pollen dilution series regression lines and the log2FC calculated between undiluted pollen extract and water. The lines represent the thresholds that we set to define an ion as pollen-derived: log2FC > two and R2 > 0.75. Within the light green area are included the ions that we consider pollen-derived (n = 406).
Figure 6—figure supplement 3
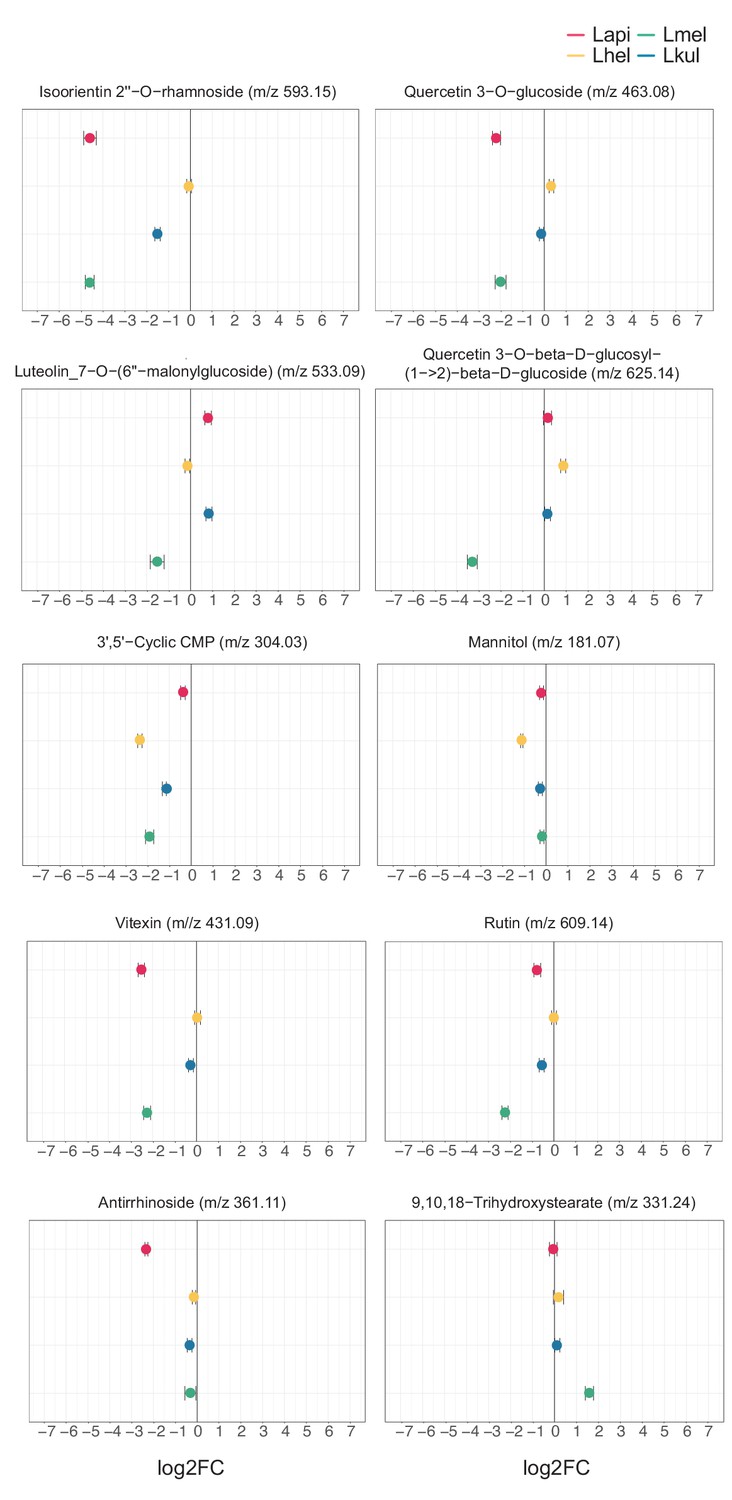
Untargeted metabolomics: key metabolites discussed in the main text.
In vitro metabolomics of spent medium of the four species grown in cfMRS + PE for 16 hr. The log2FC was obtained comparing the ion intensities at the end and at the beginning of the experiment.
Figure 6—figure supplement 4
GC-MS detection of key metabolites over time.
Log2FC relative to T0 is plotted. Time is reported in hours. For m/z values see Supplementary file 10.
Figure 6—figure supplement 5
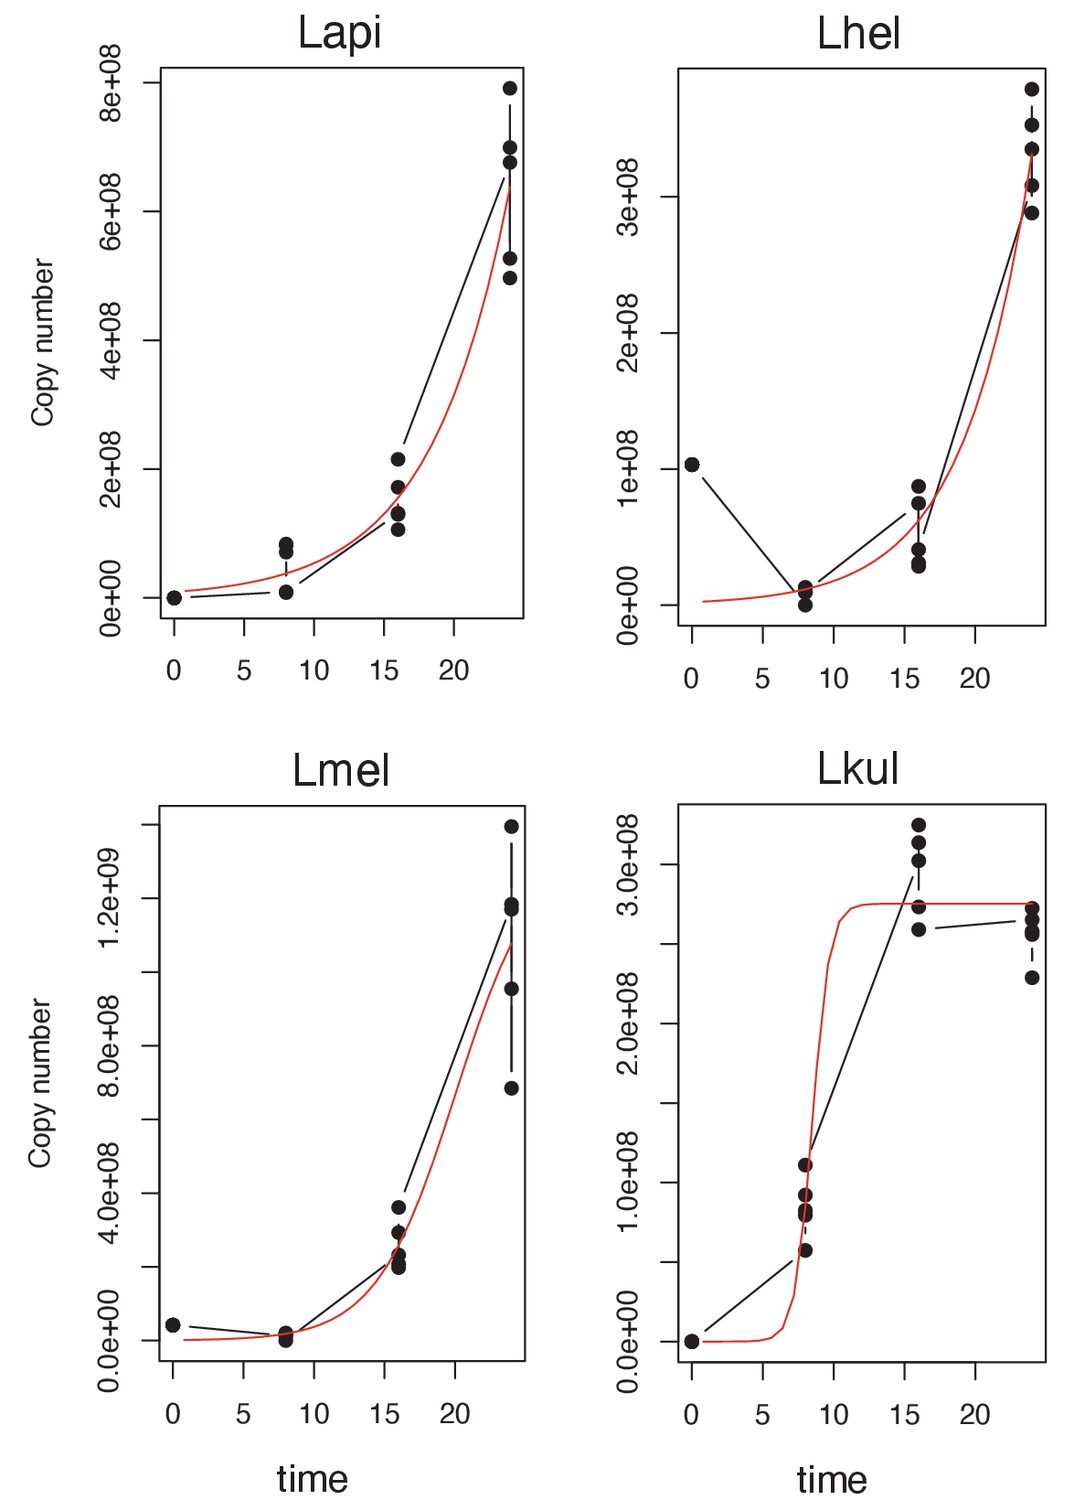
Logistic regression growth curve of the four species.
Growth-curve data were obtained for the four species at the four time-points included in the second metabolomics experiment (growth in presence of pollen extract) by qPCR (copy number) and fitted to a standard form of the logistic equation. Each point represents one replicate (n=5).
Tables
Key resources table
| Reagent type (species) or resource | Designation | Source or reference | Identifiers | Additional information |
|---|---|---|---|---|
| Strain, strain background (Lactobacillus apis) | Lapi | https://doi.org/10.1371/journal.pbio.2003467 | Genome ID: 2684622912 | |
| Strain, strain background (Lactobacillus helsingborgensis) | Lhel | https://doi.org/10.1371/journal.pbio.2003467 | Genome ID: 2684622914 | |
| Strain, strain background (Lactobacillus melliventris) | Lmel | https://doi.org/10.1371/journal.pbio.2003467 | Genome ID: 2684622913 | |
| Strain, strain background (Lactobacillus kullabergensis) | Lkul | https://doi.org/10.1371/journal.pbio.2003467 | Genome ID: 2684622911 | |
| Commercial assay or kit | QIAquick Gel Extraction Kit | Qiagen | #Cat 28706X4 | |
| Commercial assay or kit | Nucleospin RNA clean-up kit | Macherey-Nagel | #Cat 740903 | |
| Commercial assay or kit | Zymo-Seq RiboFree Total RNA Library kit | Zymo Research | #Cat R3000 | |
| Software, algorithm | R Studio software | R Studio (https://www.rstudio.com) | RRID:SCR_000432 | |
| Software, algorithm | Integrative Genomics Viewer | Integrative Genomics Viewer (https://software.broadinstitute.org/software/igv/) | RRID:SCR_011793 |
Additional files
-
Supplementary file 1
List of primers used in this study: the sample-specific barcodes used in the primers for the second PCR of the amplicon sequencing are highlighted in gray.
- https://cdn.elifesciences.org/articles/68583/elife-68583-supp1-v4.docx
-
Supplementary file 2
COG functional categories.
- https://cdn.elifesciences.org/articles/68583/elife-68583-supp2-v4.docx
-
Supplementary file 3
Bacterial abundance data (CFUs).
- https://cdn.elifesciences.org/articles/68583/elife-68583-supp3-v4.xlsx
-
Supplementary file 4
Amplicon sequencing processed data.
- https://cdn.elifesciences.org/articles/68583/elife-68583-supp4-v4.xlsx
-
Supplementary file 5
RNA sequencing processed data, statistical analysis results (enrichment tests), transcript per million data.
- https://cdn.elifesciences.org/articles/68583/elife-68583-supp5-v4.xlsx
-
Supplementary file 6
RNA sequencing processed data, statistical analysis results (enrichment tests), transcript per million data.
- https://cdn.elifesciences.org/articles/68583/elife-68583-supp6-v4.xlsx
-
Supplementary file 7
RNA sequencing processed data, statistical analysis results (enrichment tests), transcript per million data.
- https://cdn.elifesciences.org/articles/68583/elife-68583-supp7-v4.xlsx
-
Supplementary file 8
RNA sequencing processed data, statistical analysis results (enrichment tests), transcript per million data.
- https://cdn.elifesciences.org/articles/68583/elife-68583-supp8-v4.xlsx
-
Supplementary file 9
RNA sequencing processed data, statistical analysis results (enrichment tests), transcript per million data.
- https://cdn.elifesciences.org/articles/68583/elife-68583-supp9-v4.xlsx
-
Supplementary file 10
Metabolomics analysis data.
- https://cdn.elifesciences.org/articles/68583/elife-68583-supp10-v4.xlsx
-
Supplementary file 11
Differential expression analysis results.
- https://cdn.elifesciences.org/articles/68583/elife-68583-supp11-v4.xlsx
-
Transparent reporting form
- https://cdn.elifesciences.org/articles/68583/elife-68583-transrepform-v4.docx
Download links
A two-part list of links to download the article, or parts of the article, in various formats.
Downloads (link to download the article as PDF)
Open citations (links to open the citations from this article in various online reference manager services)
Cite this article (links to download the citations from this article in formats compatible with various reference manager tools)
Niche partitioning facilitates coexistence of closely related honey bee gut bacteria
eLife 10:e68583.
https://doi.org/10.7554/eLife.68583


