Neural control of growth and size in the axolotl limb regenerate
- Biology Department, University of Massachusetts, Boston, United States
Figures
Figure 1 with 2 supplements
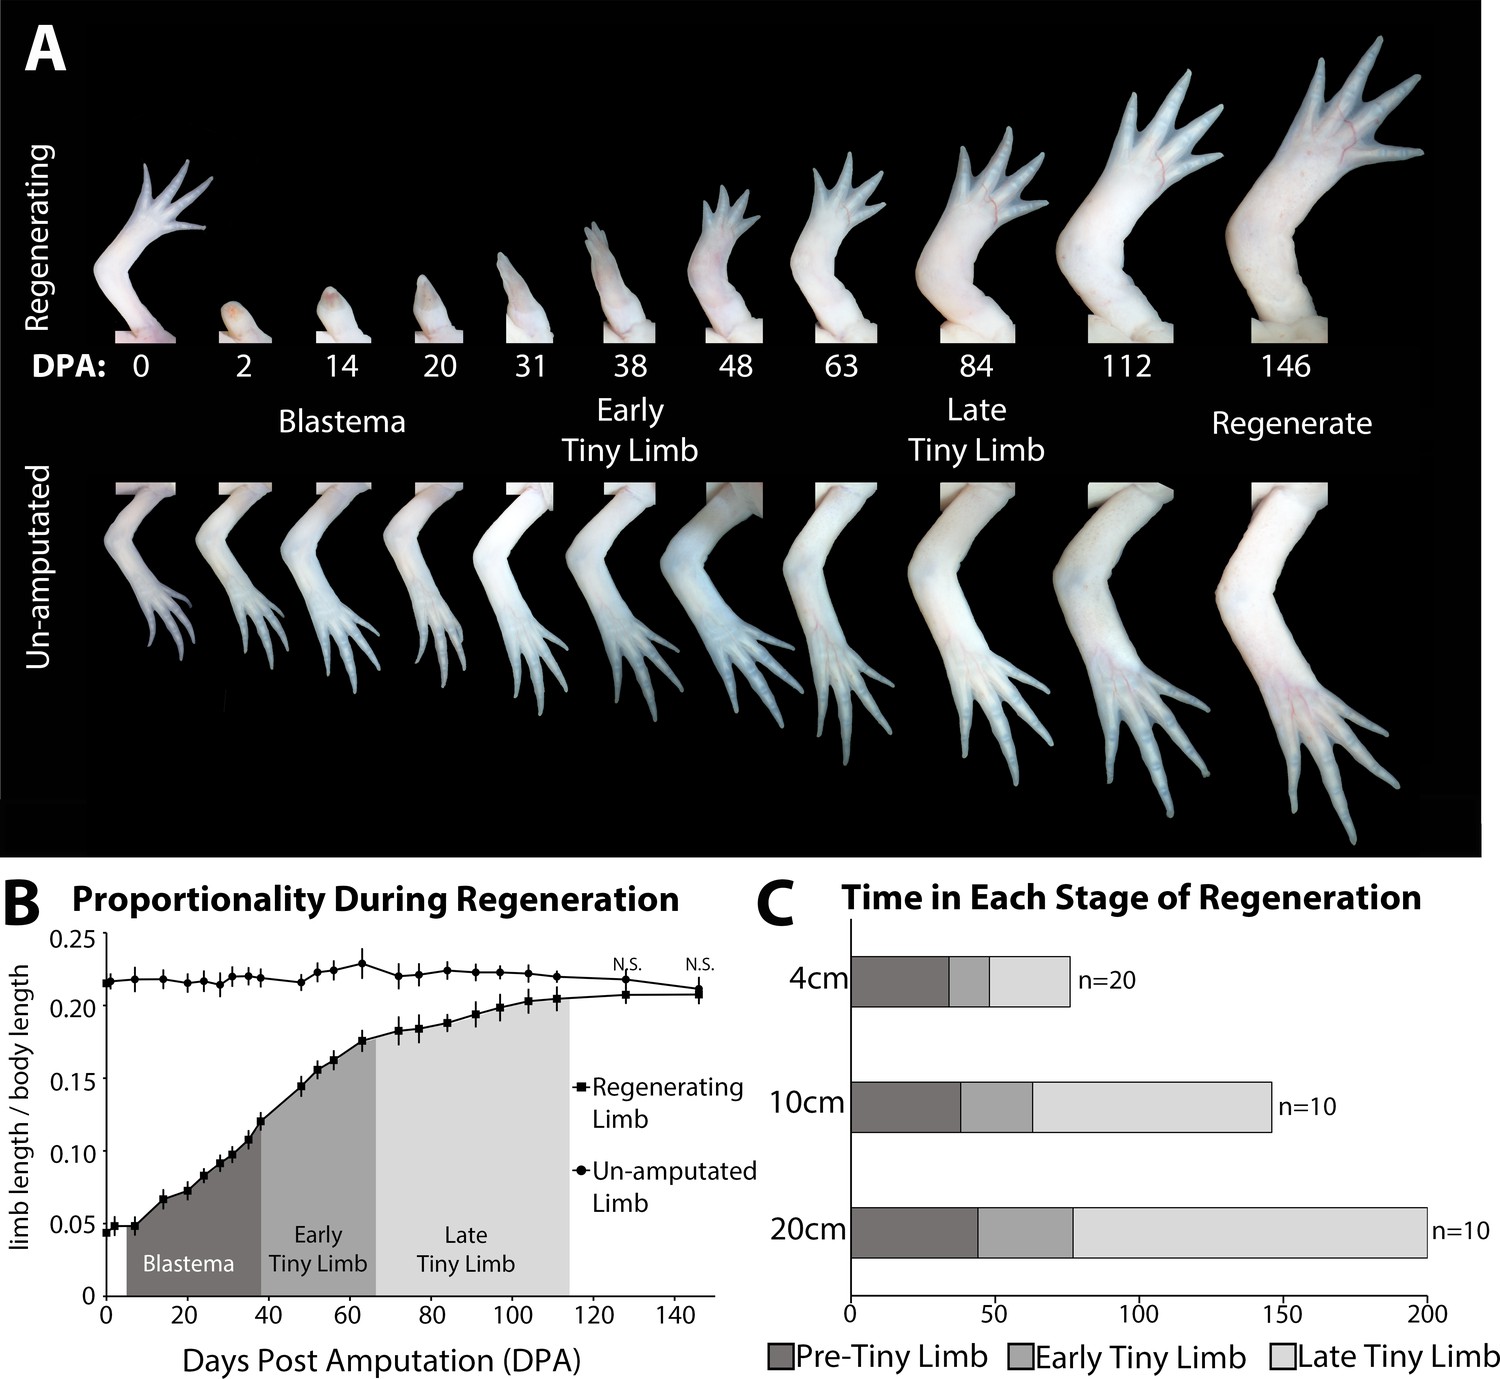
The tiny limb grows at an increased rate compared to an unamputated limb.
(A) Time course of growth in amputated (top panel) and the contralateral non-amputated (lower panel) limbs on a 10 cm animal over 146 days. (B) The ratio of limb to body length in regenerating and unamputated limbs was measured over time (10 cm animals; n = 10). We have separated the growth of the limb regenerate into three stages: the blastema stage (dark gray), the early tiny limb stage (medium gray), and the late tiny limb stage (light gray). Error bars = standard deviation. t-Test was used to evaluate significance between the regenerating and uninjured limb size at each time point. All data points not marked with N.S. had p-values less than 0.005. (C) Histogram showing the average amount of time in days that the regenerating limb is in each growth stage for animals of different sizes (4, 10, and 20 cm in length).
Figure 1—figure supplement 1

Axolotl size measurements.
Body length is measured from snout to tail tip. Limb length is measured by measuring from the limb/trunk junction to the elbow (A) and then from the elbow to the tip of the longest digit (B). All measurements are recorded in centimeter (cm).
Figure 1—figure supplement 2
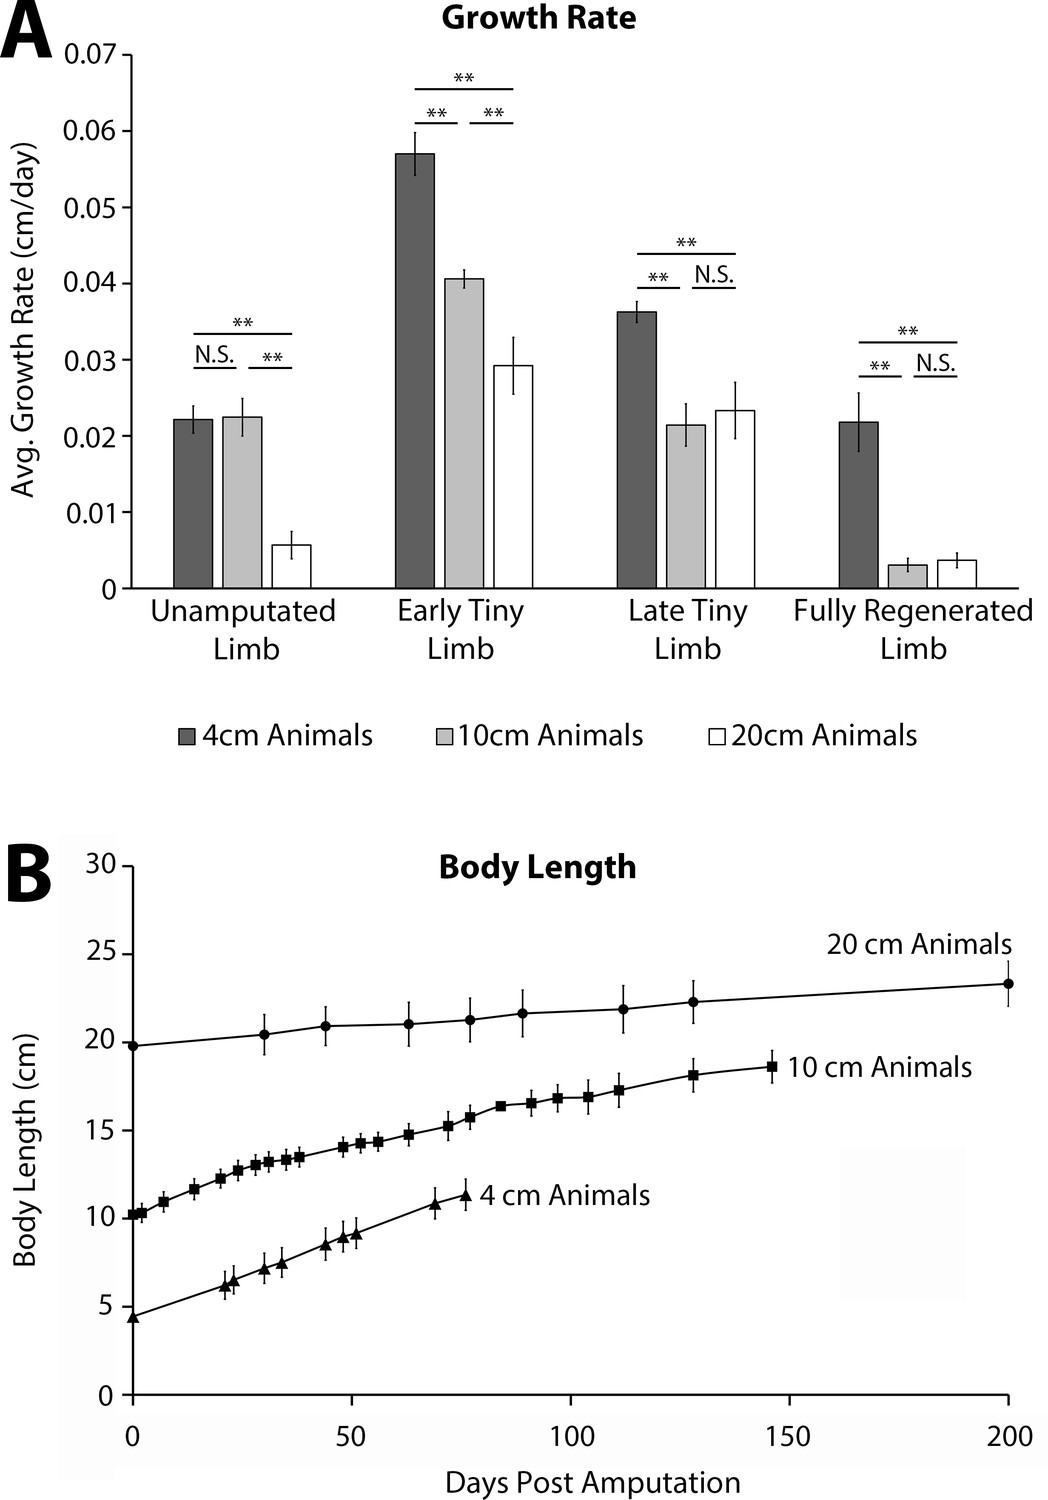
Animal size corresponds with growth rate during limb regeneration.
(A) Limb growth rates over the first 7 days of each growth phase were quantified using limb length measurements on unamputated limbs, early tiny limbs, late tiny limbs, and fully regenerated limbs of 4 cm (n = 20), 10 cm (n = 10), and 20 cm animals (n = 10). The body length represents their size at the time of amputation. Error bars = SEM. p-Values calculated by ANOVA and the Tukey post hoc test. * = p < 0.05 ** = p < 0.005. (B) Body length measurements of 4 cm (n = 20), 10 cm (n = 10), and 20 cm animals (n = 10) over time. Error bars = standard deviation. The body length represents their size at the time of amputation.
Figure 2 with 1 supplement
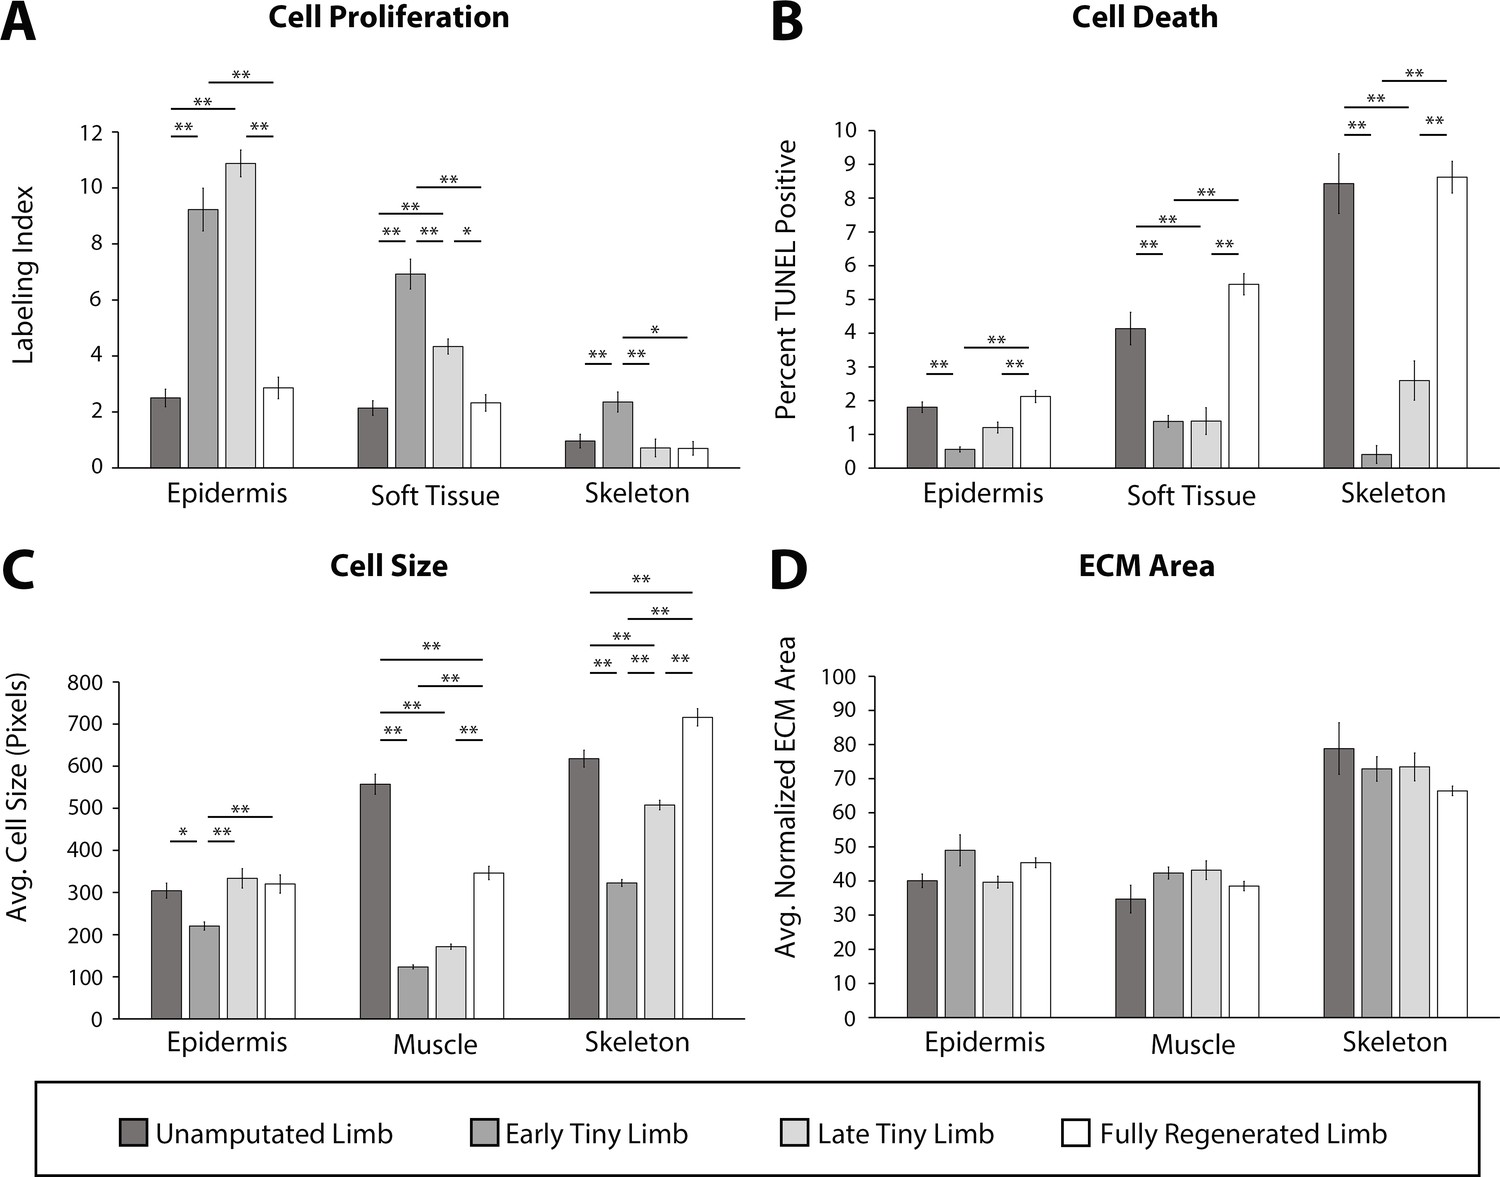
Tiny limb staged regenerates have increased proliferation, decreased cell death, and smaller cell sizes than uninjured or completely regenerated limbs.
Transverse sections through the zeugopod of limbs at different stages of regeneration were analyzed for cell proliferation (A), cell death (B), cell size (C), and extracellular matrix (ECM) size (D). (A and B) Cell proliferation and death were analyzed in the epidermis, soft tissue, and skeletal elements. (A) Cell proliferation was analyzed by EdU labeling (n = 5). (B) Cell death was analyzed using TUNEL labeling (n = 4). (C and D) Cell and ECM size measurements were quantified in the epidermis, muscle, and skeletal elements. (C) Cell size was quantified using fluorescently tagged wheat germ agglutinin (plasma membrane) for epidermal and muscular analysis and Alcian blue staining (collagen) for skeletal analysis (n = 4). (D) ECM area was calculated by [(tissue area – cellular area)/tissue area] (n = 4). Error bars = SEM. p-Values calculated by ANOVA and the Tukey post hoc test. * = p < 0.05 ** = p < 0.005.
Figure 2—figure supplement 1
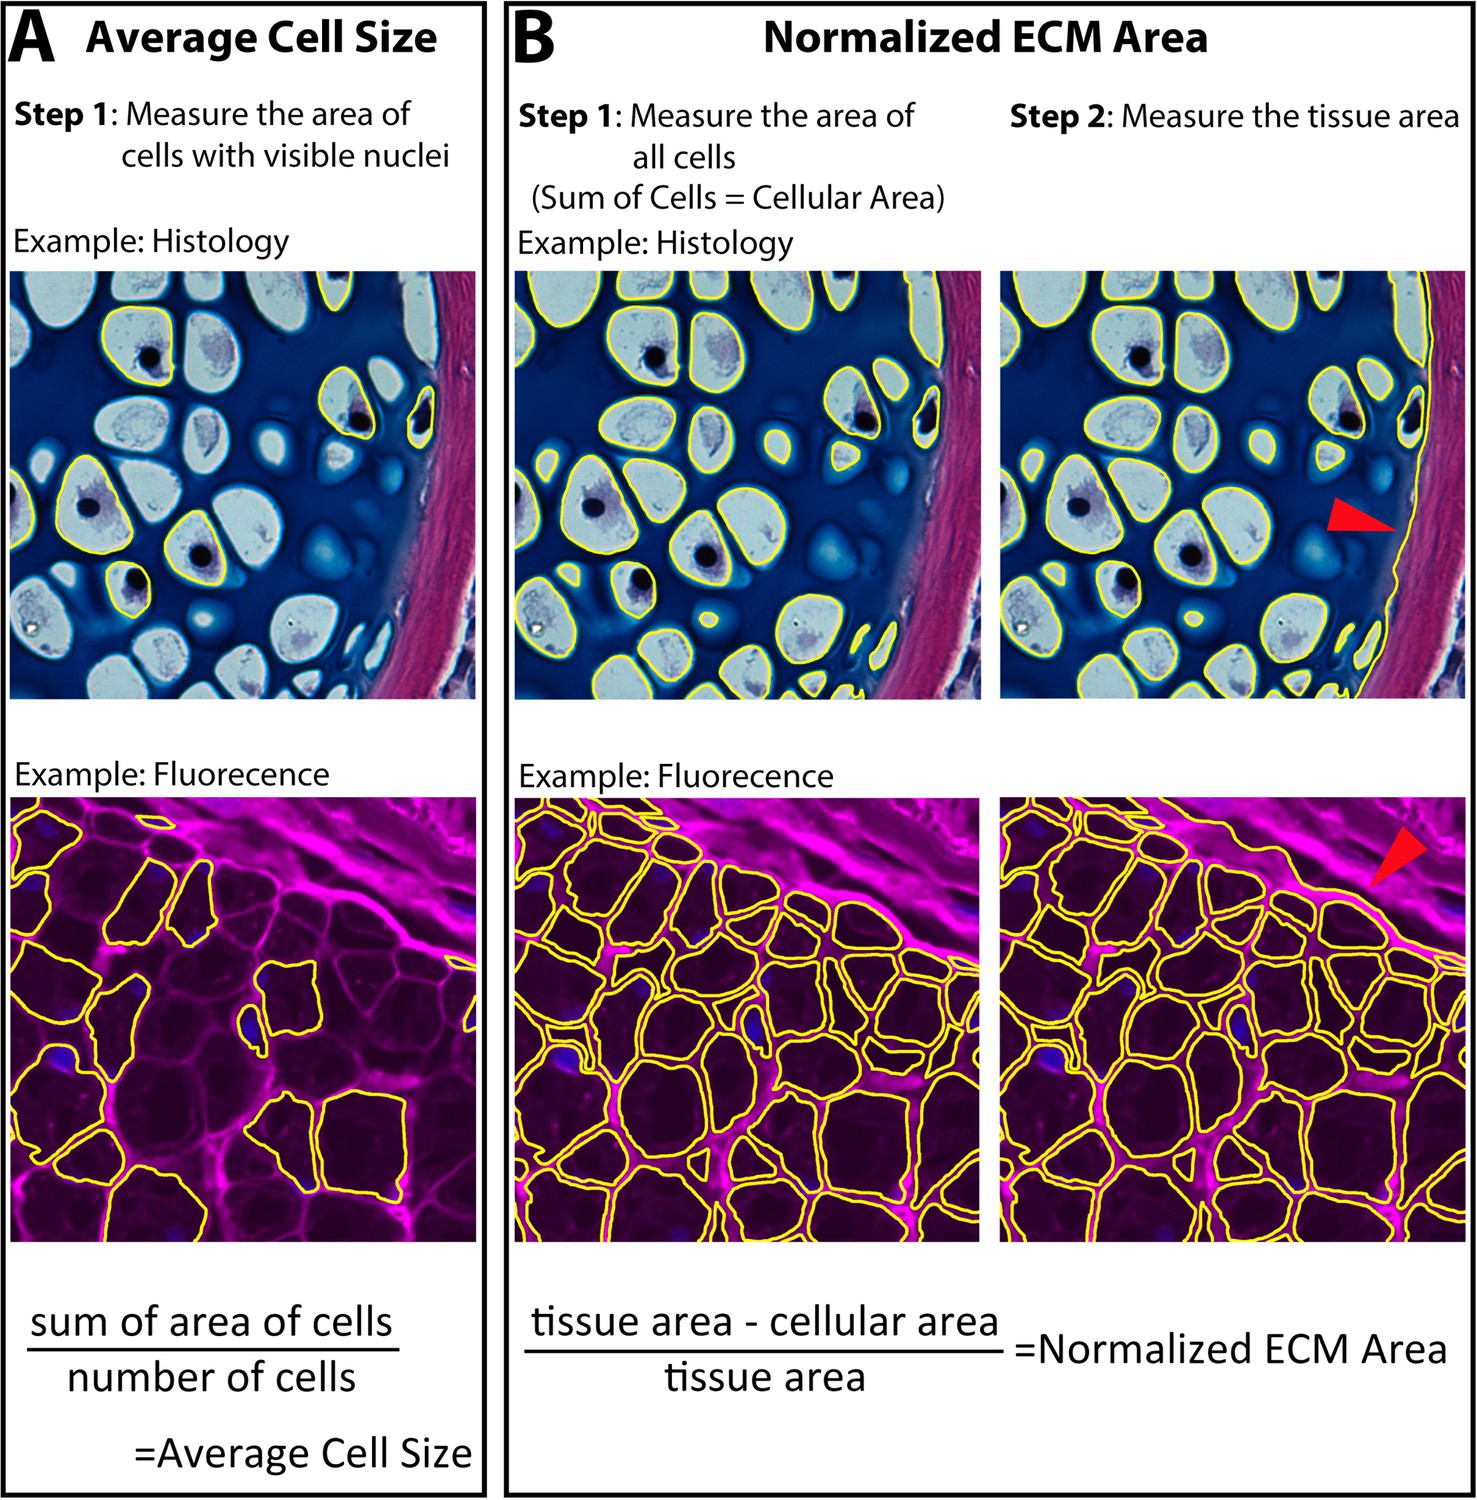
Measurement of cell and extracellular matrix (ECM) size.
Cell size and ECM area were quantified using 7 μm cross sections through the zeugopod. Skeletal tissue was analyzed using the histology stain of hematoxylin, eosin, and Alcian blue. The epidermis and muscle (represented) were analyzed using fluorescent stains of wheat germ agglutinin (WGA – magenta) and DAPI (blue). (A) Average cell size was quantified by measuring the area of nucleated cells. (B) Normalized ECM area was quantified by finding the sum of all the cellular area in a tissue. The sum was then subtracted from the total tissue area (red arrow indicating tissue boarder) and divided by the total tissue area to provide the normalized ECM area.
Figure 3 with 1 supplement
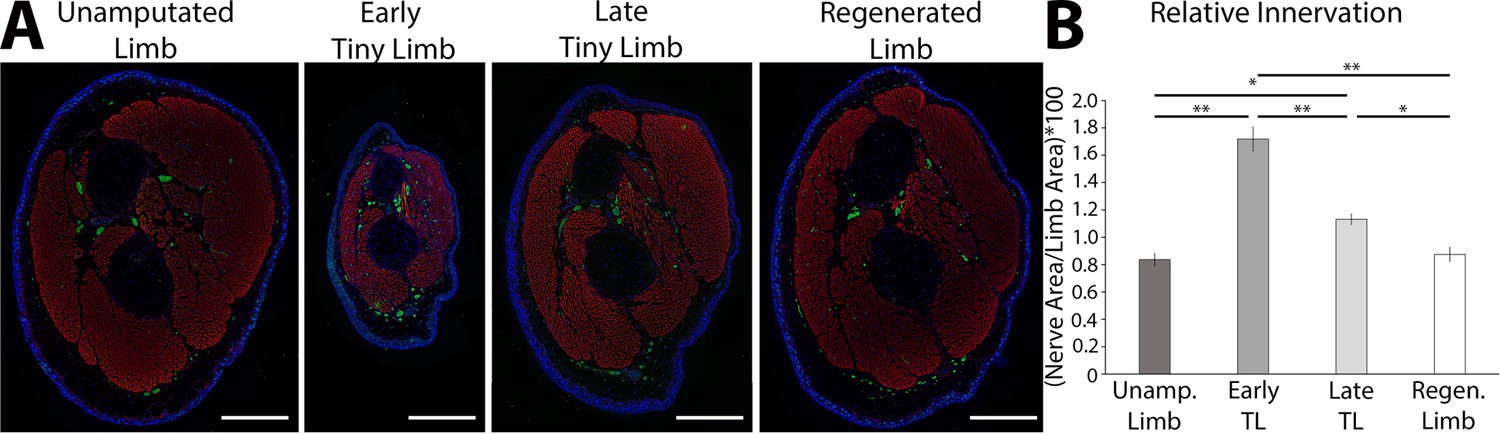
The tiny limb staged regenerate has increased relative nerve abundance.
(A) Fluorescent images were obtained of transverse sections of uninjured, early, and late tiny limb stages, and fully regenerated limbs (DAPI = blue, phalloidin (for actin filaments) = red, acetylated tubulin (for nerves) = green; scale bars are 1000 µm). (B) Nerve area relative to total limb area was quantified from the sections represented in A (n = 5). Error bars = SEM. p-Values calculated by ANOVA and the Tukey post hoc test. * = p < 0.05 ** = p < 0.005.
Figure 3—figure supplement 1
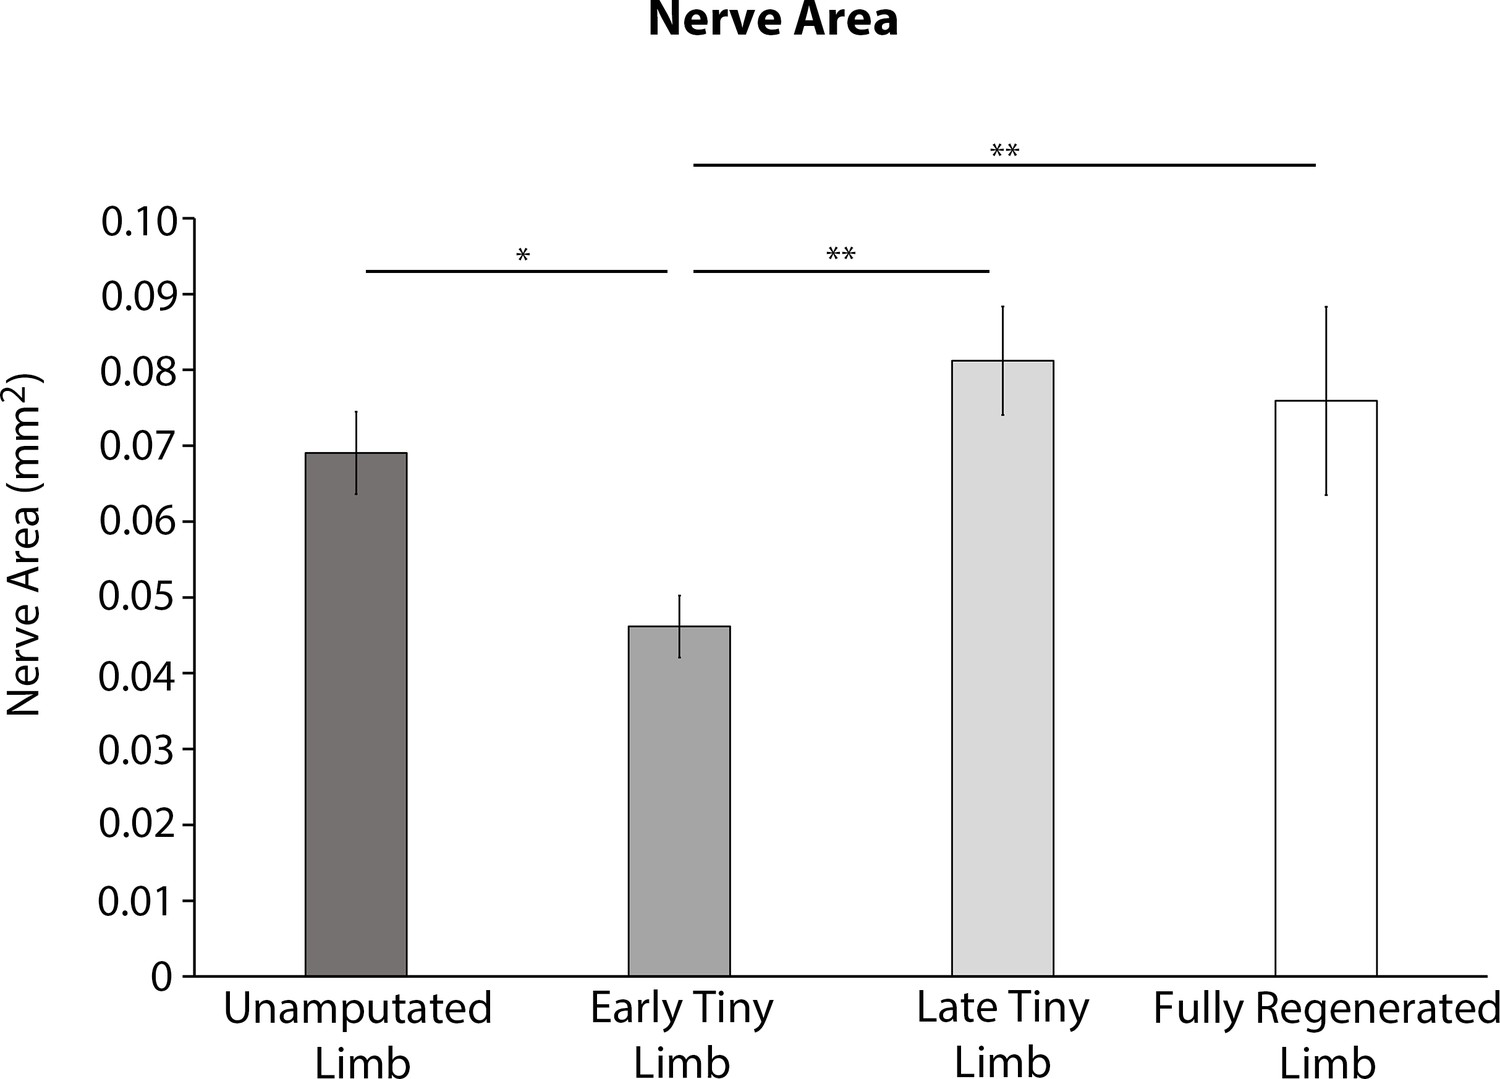
Absolute abundance of nerves in different staged regenerates.
Total nerve area was quantified from transvers limb sections of unamputated limbs, early tiny limbs, late tiny limbs, and fully regenerated limbs (n = 5). Error bars = SEM. p-Values calculated by ANOVA and the Tukey post hoc test. * = p < 0.05 ** = p < 0.005.
Figure 4 with 1 supplement
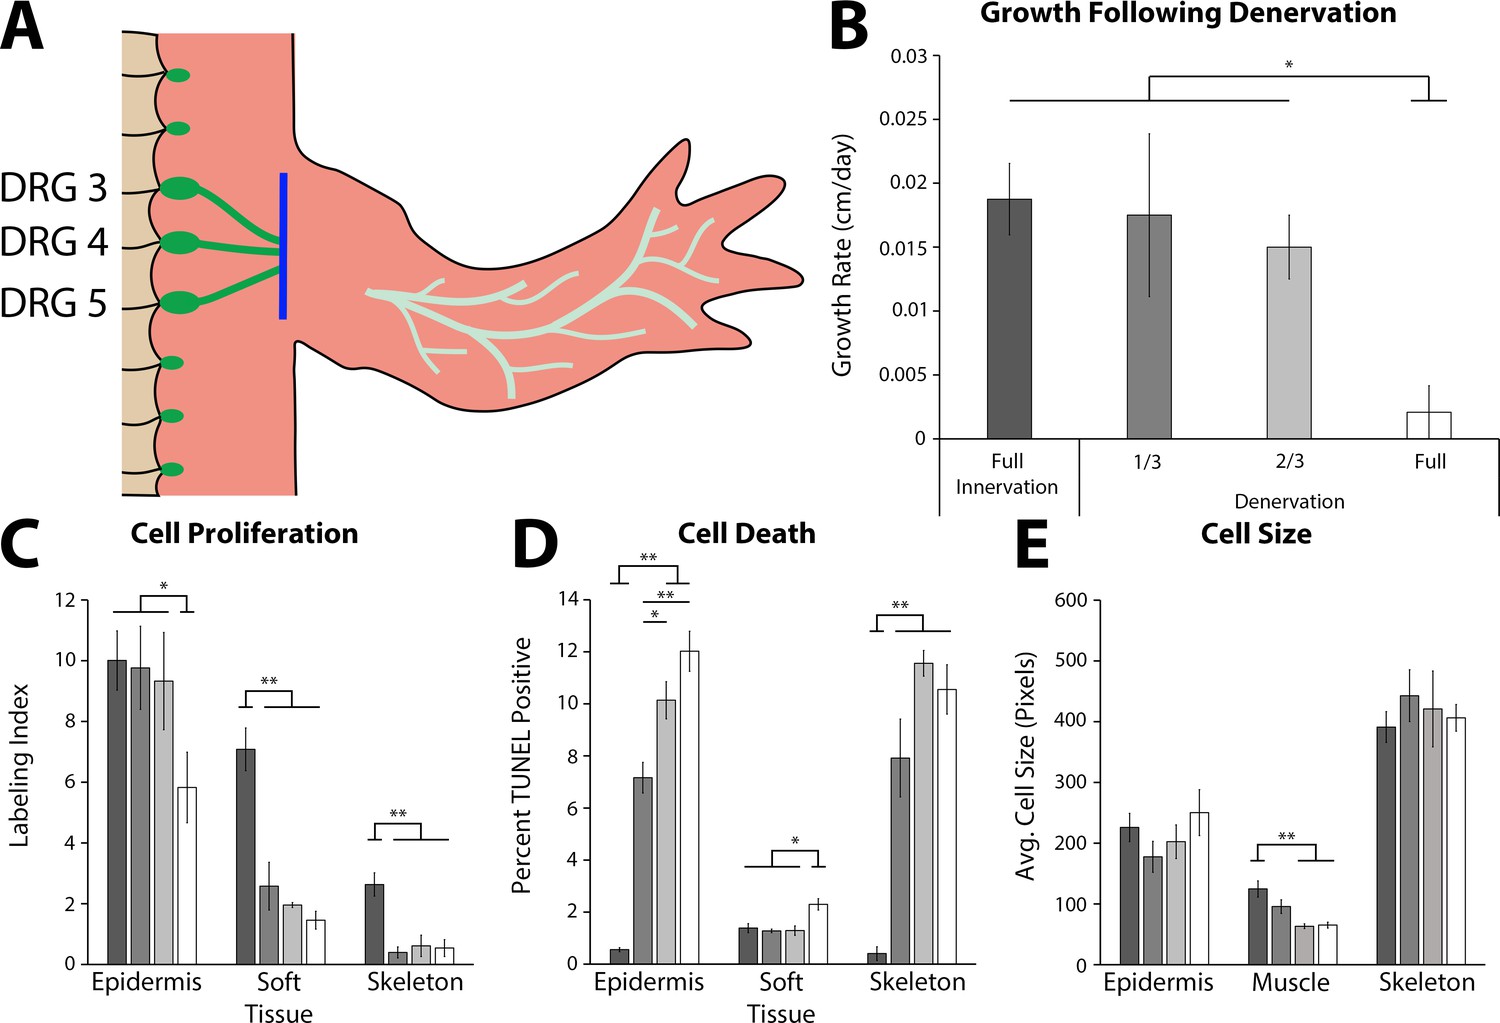
The effect of denervation on the growth of the tiny limb staged regenerate.
(A) Dorsal root ganglia (DRGs) 3, 4, and 5 (green dots) are located lateral to the spinal column and their nerve bundles (green lines) feed into the forelimbs. Limbs were amputated and permitted to regenerate to the early tiny limb stage, at which point, either a mock, partial (1/3 = DRG 5 or 2/3 = DRGs 4 and 5), or full denervation (represented) was performed by severing (blue line) and removing sections of the nerve bundles. Limbs were collected 4 days post denervation, and growth rate (B), cell proliferation (C), cell death (D), and cell size (E) were analyzed for limbs with mock denervations (n = 6), 1/3 denervations (n = 5), 2/3 denervations (n = 5), and full denervations (n = 6). The color of the bars in panels C–E refers to the color of the bars in panel B. Error bars = SEM. p-Values calculated by ANOVA and the Tukey post hoc test. * = p < 0.05 ** = p < 0.005.
Figure 4—figure supplement 1
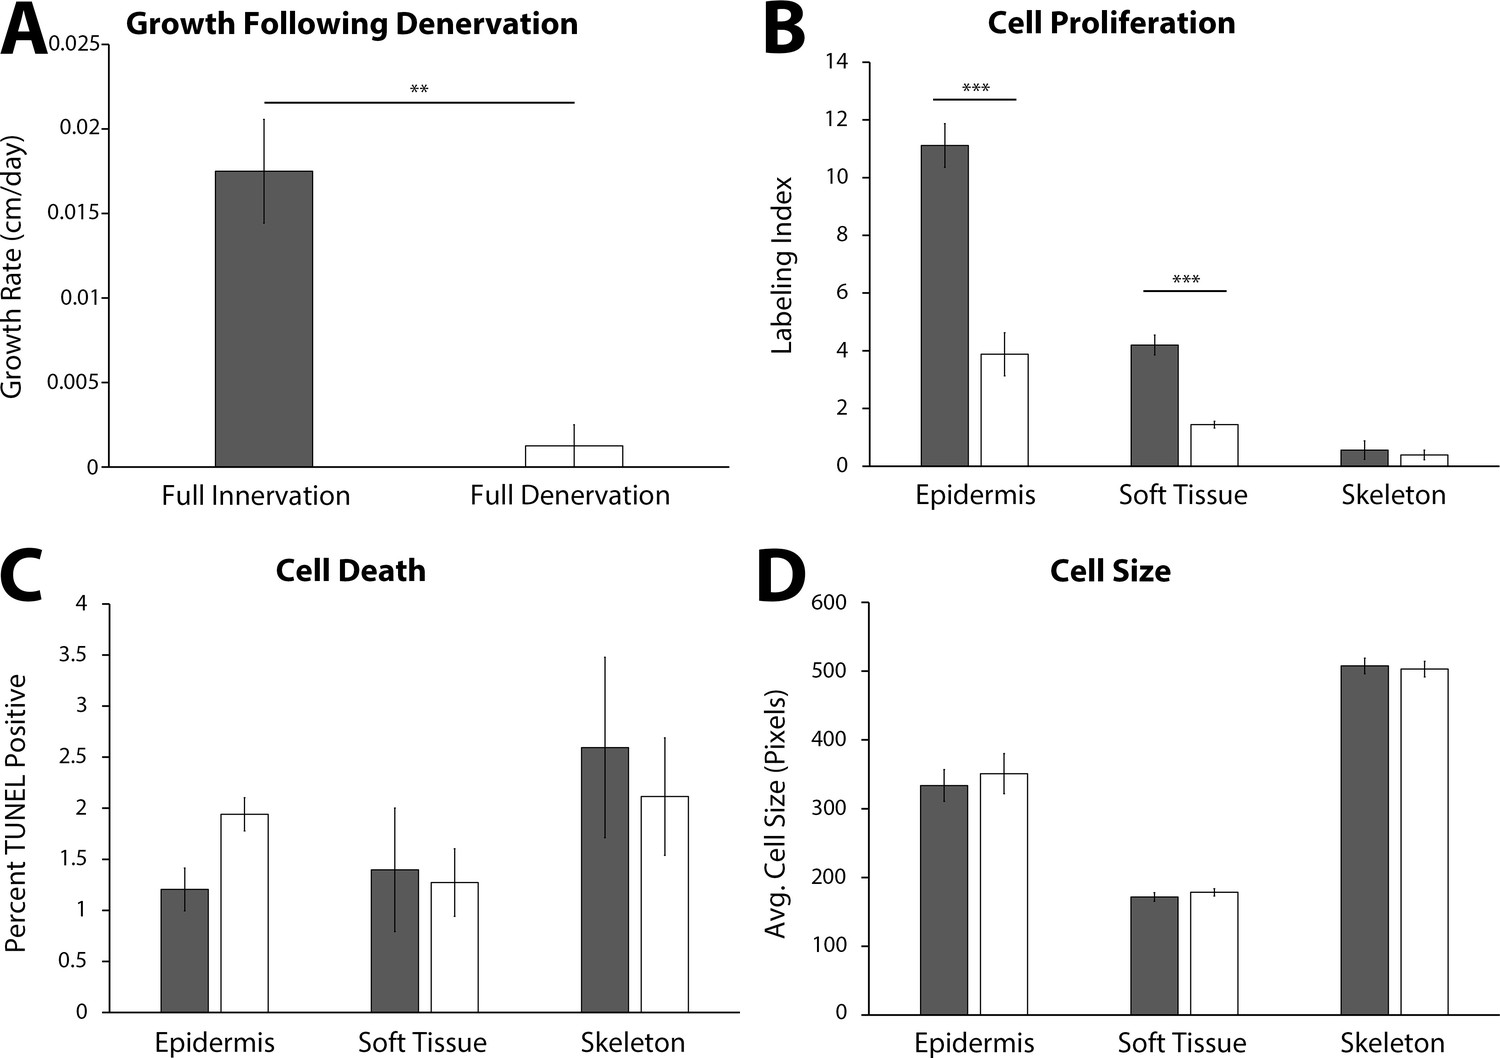
Impact of denervation on the growth characteristics of the late tiny limb (LTL) staged regenerate.
Amputated limbs were permitted to regenerate to the late tiny limb stage, at which point they underwent either a mock denervation (dark gray, n = 5) or a full denervation (white, n = 5). The limbs were collected and analyzed 4 days post denervation for growth rate (A), cell proliferation (B), cell death (C), and cell size (D) as previously described. Error bars = SEM. p-Values calculated by paired t-test. ** = p < 0.005 *** = p < 0.0005.
Figure 5 with 2 supplements
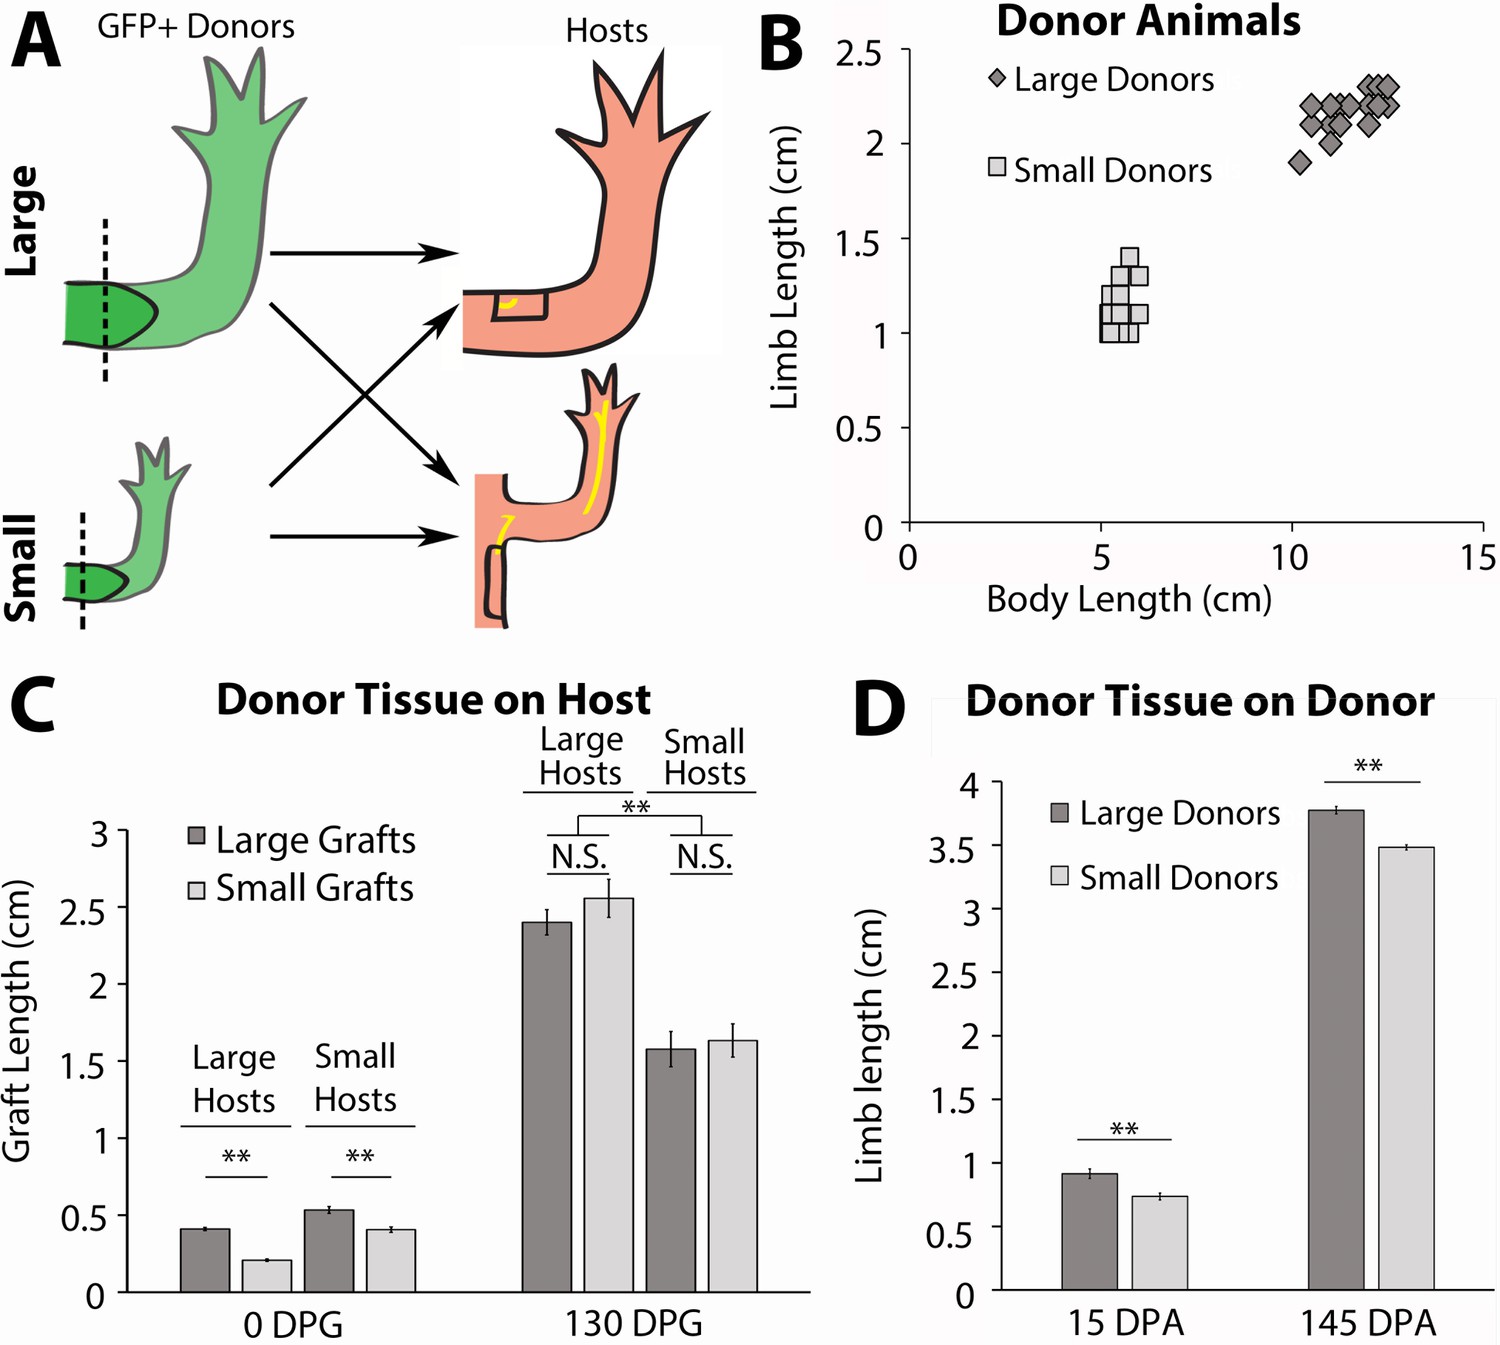
Host size correlates with the final size for the regenerated limb in the accessory limb model (ALM) assay.
(A) Blastemas with approximately 2 mm of stump tissue from large and small GFP+ donor animals were grafted onto a regenerative permissive environment, a wound site with a deviated limb nerve bundle, on large or small host animals. (B) Limb length and body length were measured on the GFP+ donor animals. (C) The regenerating grafted tissues were measured at 0 and 130 days post graft (DPG). Blastemas from large donors (dark gray) were grafted onto large (n = 7) and small (n = 9) host animals, and blastemas from small donors (light gray) were grafted onto large (n = 9) and small (n = 10) host animals. (D) The regenerating large (n = 10) and small (n = 20) animal donor limbs were measured at 15- and 145 days post amputation. Error bars = SEM. p-Values calculated by ANOVA and the Tukey post hoc test. * = p < 0.05 ** = p < 0.005.
Figure 5—figure supplement 1
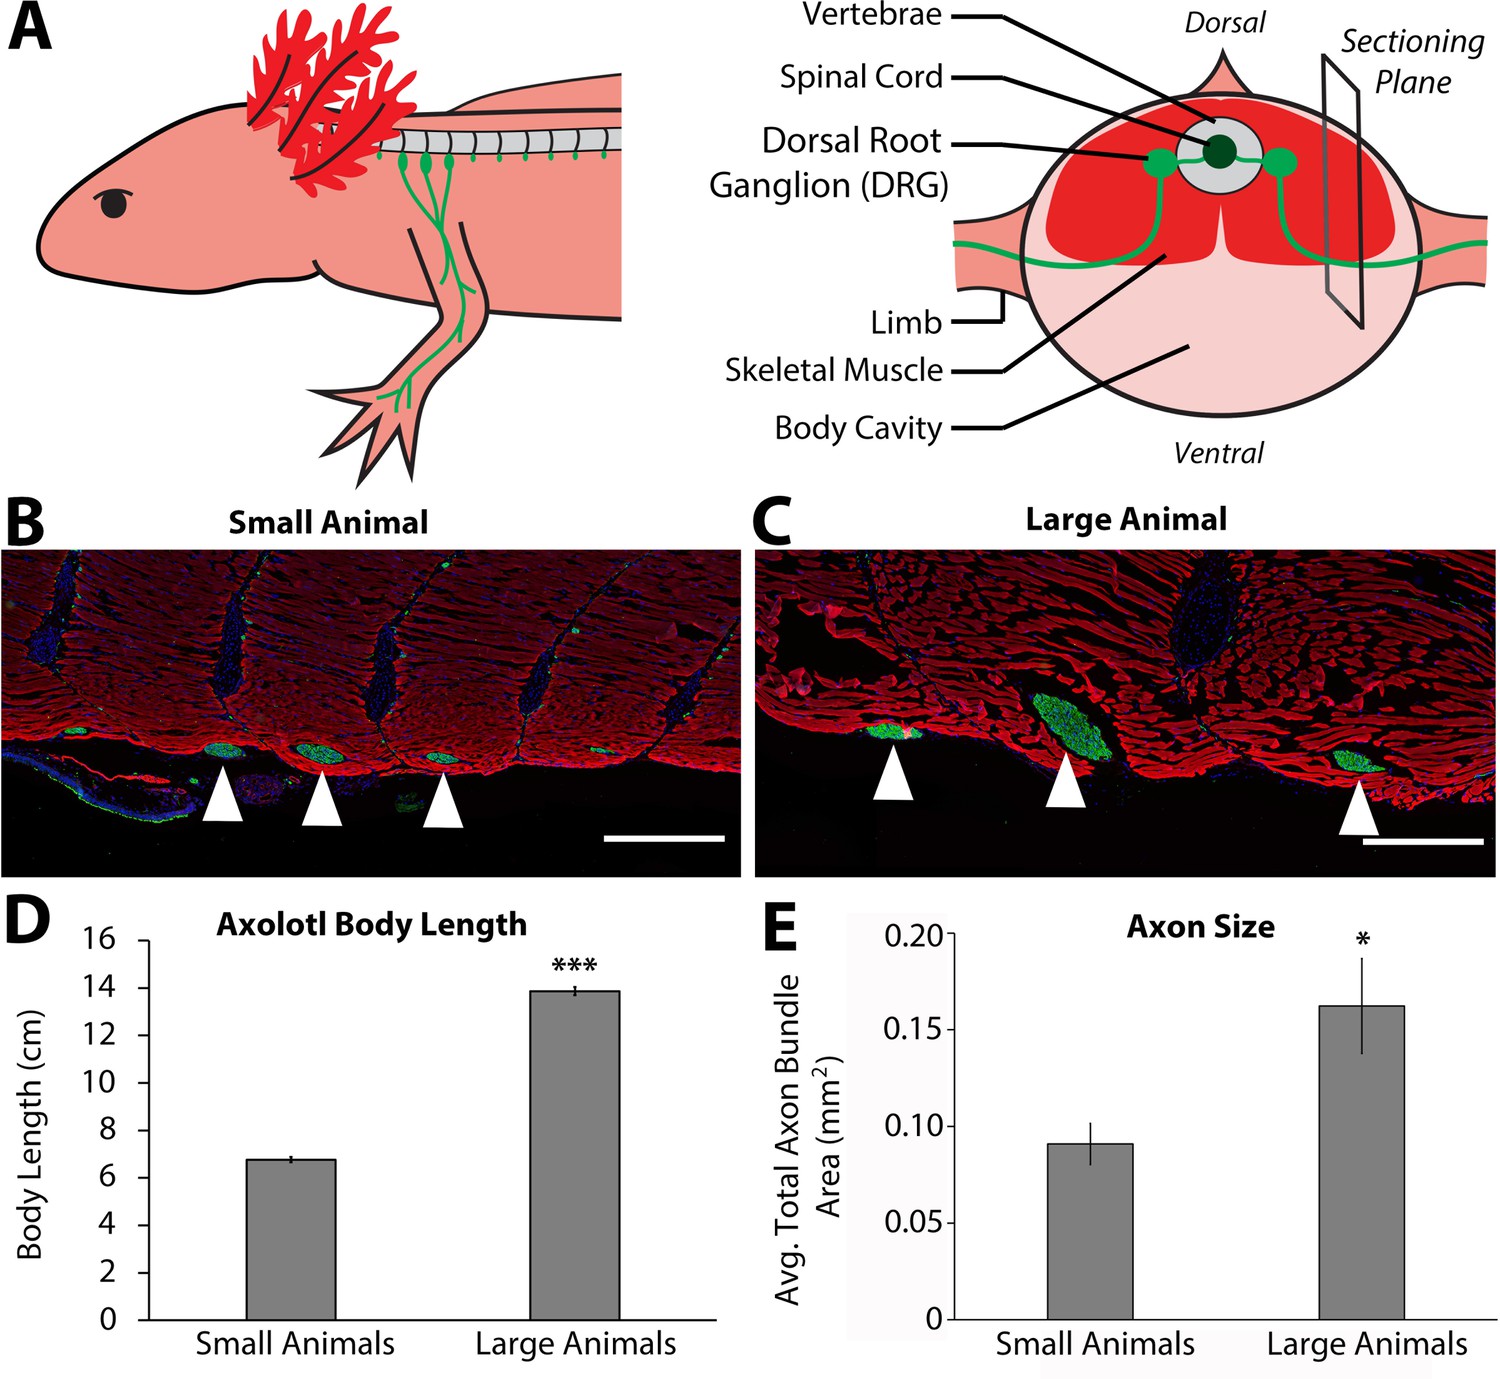
Size of nerve bundles in the peripheral nervous system correlate with animal size.
(A) Three spinal dorsal root ganglia (DRGs) (3, 4, and 5, light green) extend through the spinal skeletal muscle (red) and enter the limb. The right panel shows that the sectioning plane for B and C is located at the point where the limb-bound axon bundles emerge from the skeletal muscle. (B–C) Representative immunofluorescent images of sections where the limb axon bundles (anti-acetylated tubulin antibodies – green) are emerging from the skeletal muscle (rhodamine phalloidin – red) and co-stained with DAPI (blue) in both small (n = 4, B) and large (n = 3, C) animals. Scale bars = 500 μm. White triangles indicate limb-bound axon bundles from DRGs 3, 4, and 5 (from left to right). (D) Body length, snout to tail tip was measured on small (n = 4) and large (n = 3) animals, and the average length is represented in the graph. (E) The cross-sectional area of the nerve bundles was quantified in millimeters squared, and the averages of the sum of the three axon bundles are represented in E. The large animals (n = 3) have a significantly larger cross-sectional area than the small animals (n = 4). Error bars = SEM. p-Values calculated by t-tests. * = p < 0.05 *** = p < 0.0005.
Figure 5—figure supplement 2
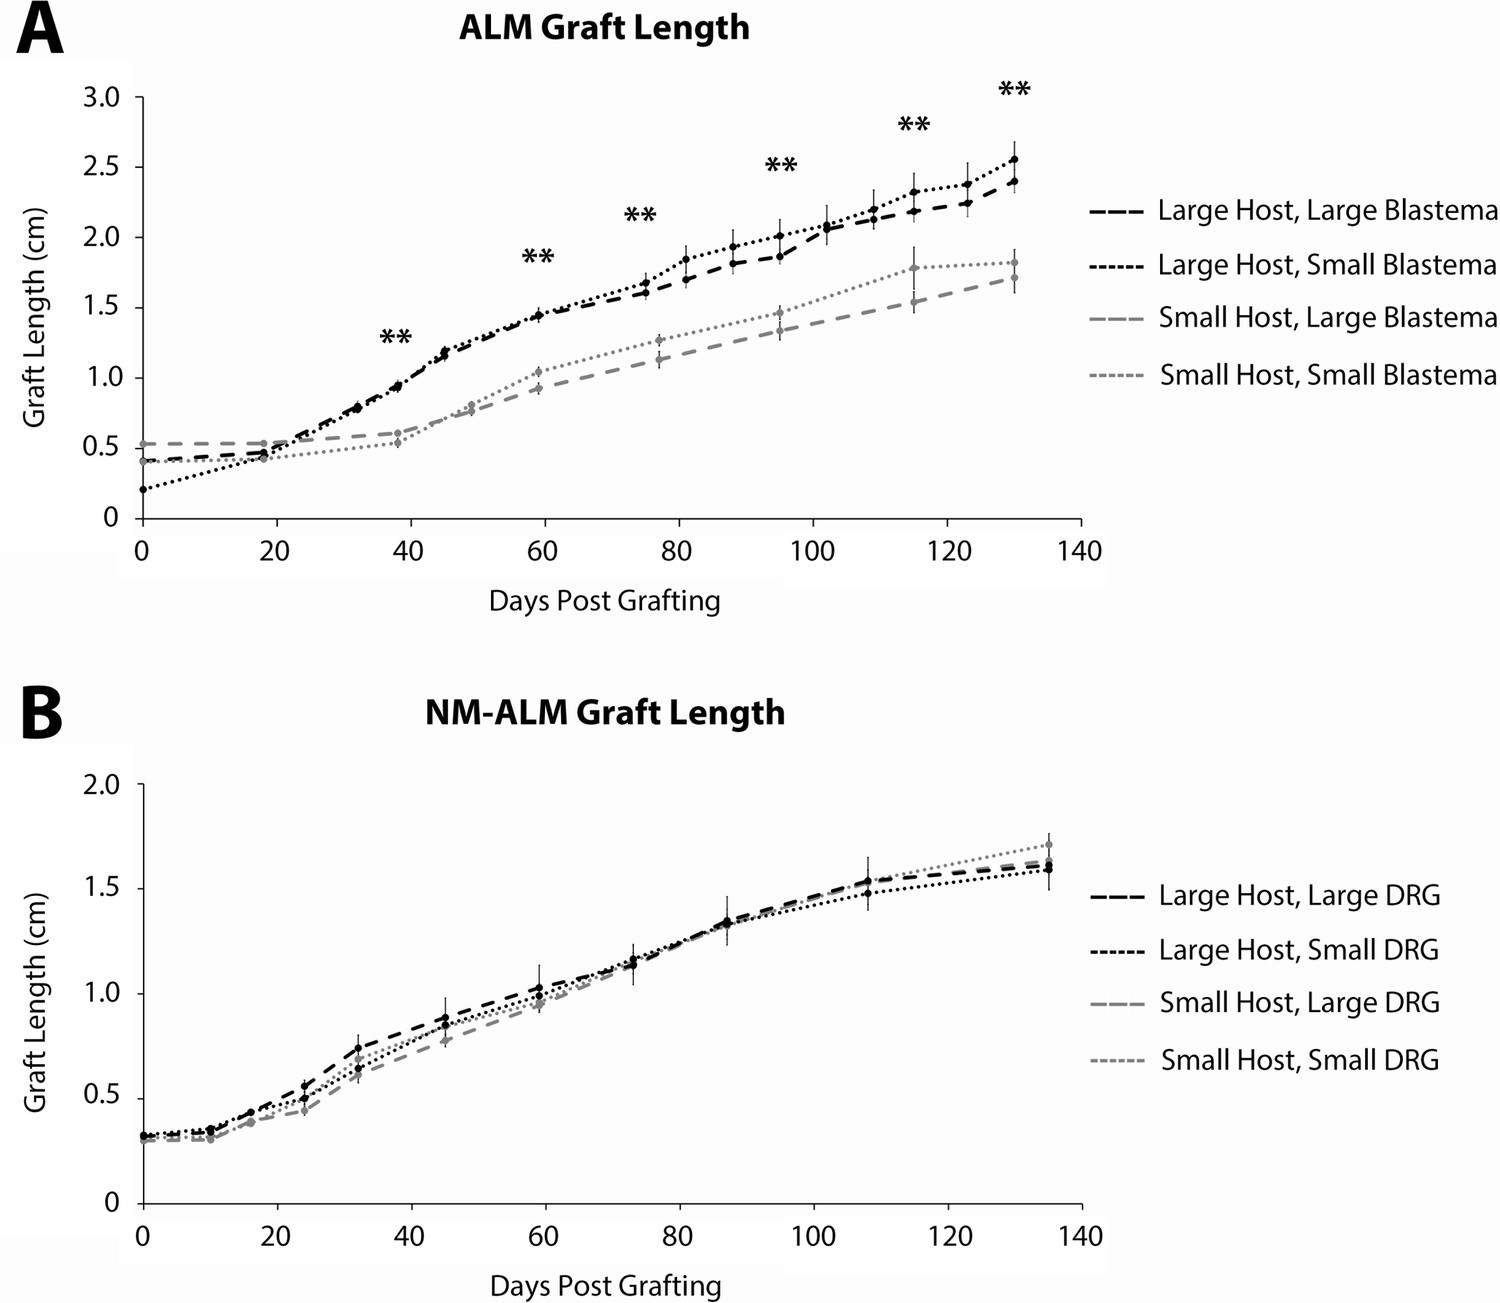
Growth of grafted limbs in accessory limb models (ALMs) and neural-modified ALMs (NM-ALMs).
(A) The ectopic limbs on the large and small host animals, generated from large and small blastema donor animals via traditional ALM surgery, were measured over time from 0 to 130 days post grafting. (B) The ectopic limbs on the large and small host animals, generated from large and small dorsal root ganglia (DRG) donor animals via NM-ALM surgery, were measured over time from 0 to 135 days post grafting. Error bars = SEM. p-Values calculated by ANOVA and the Tukey post hoc test. ** = p < 0.005. Statistical comparisons were made between the limbs on the differently sized host animals.
Figure 6
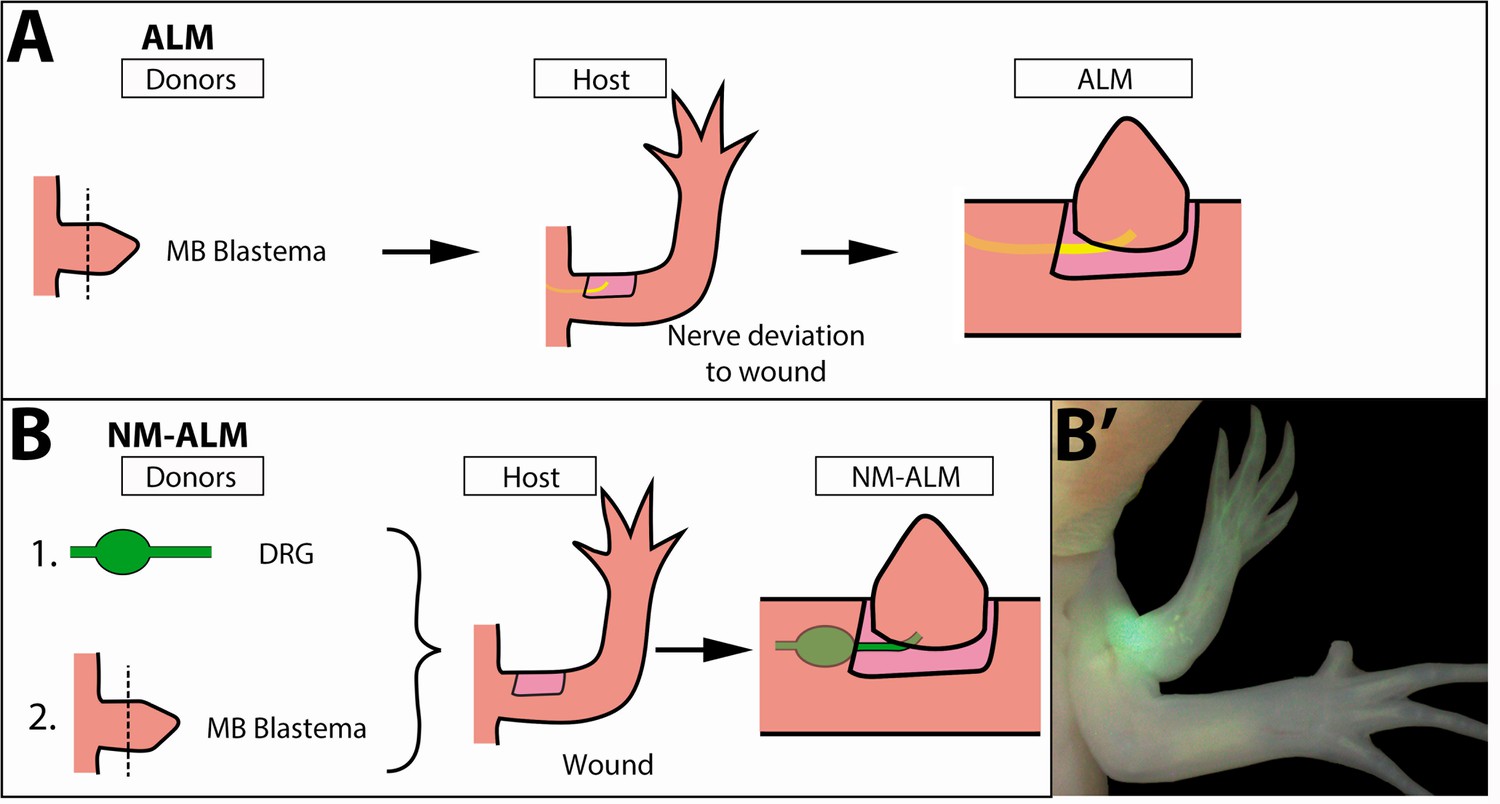
Decoupling host environment with nerve abundance using the neural-modified accessory limb model (NM-ALM).
(A) The traditional ALM (as used in Figure 5) requires a blastema donor and a host animal with a nerve bundle deviated to the wound site. (B) The NM-ALM requires a GFP+ dorsal root ganglia (DRG) donor, blastema donor, and host limb with a wound site. (B’) The DRG’s GFP+ axons regenerate and innervate the ectopic limb.
Figure 7
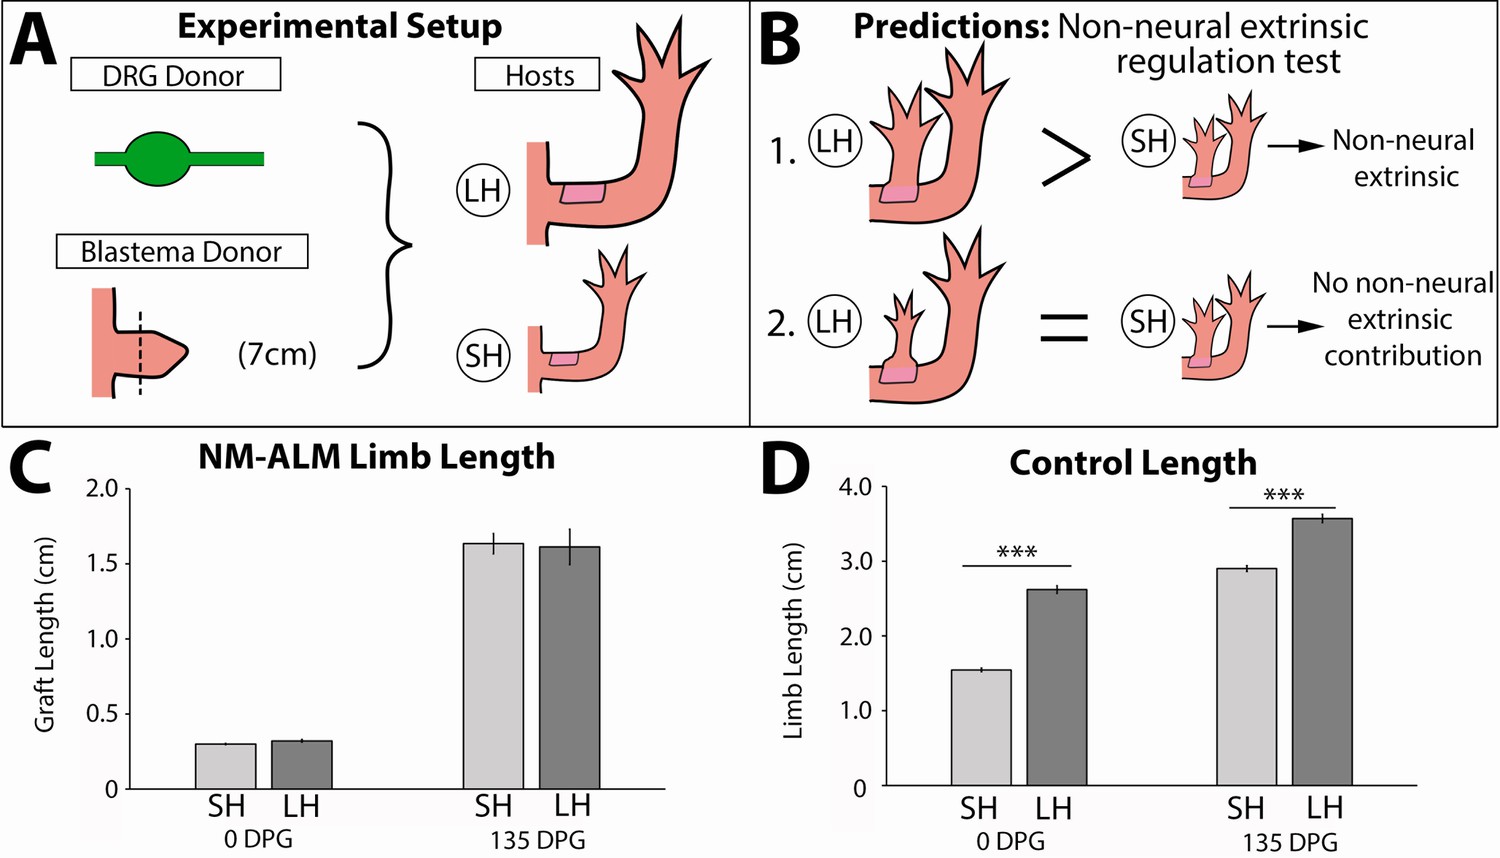
Regenerate scaling is not impacted by non-neural extrinsic factors in the neural-modified accessory limb model (NM-ALM).
(A) Dorsal root ganglia (DRGs) from GFP+ donor animals (~14 cm) were grafted into wound sites on large (~14 cm, n = 12) and small (~7 cm, n = 19) host animals followed by mid-bud blastemas from (~7 cm) donor animals. (B) If non-neural extrinsic factors play an instructive role in size regulation, then the large host animals would produce a larger ectopic limb than those on the small host animal. If non-neural factors do not play an instructive role, then the ectopic limbs will be the same size, regardless of host size. (C) The ectopic limb lengths were the same size at 0 day post graft (DPG) and remained the same throughout regeneration (135 DPG). (D) The unamputated limbs on the control animals remained different sizes throughout the course of the experiment (n = 10). Error bars = SEM. p-Values calculated by t-tests. *** = p < 0.0005.
Figure 8
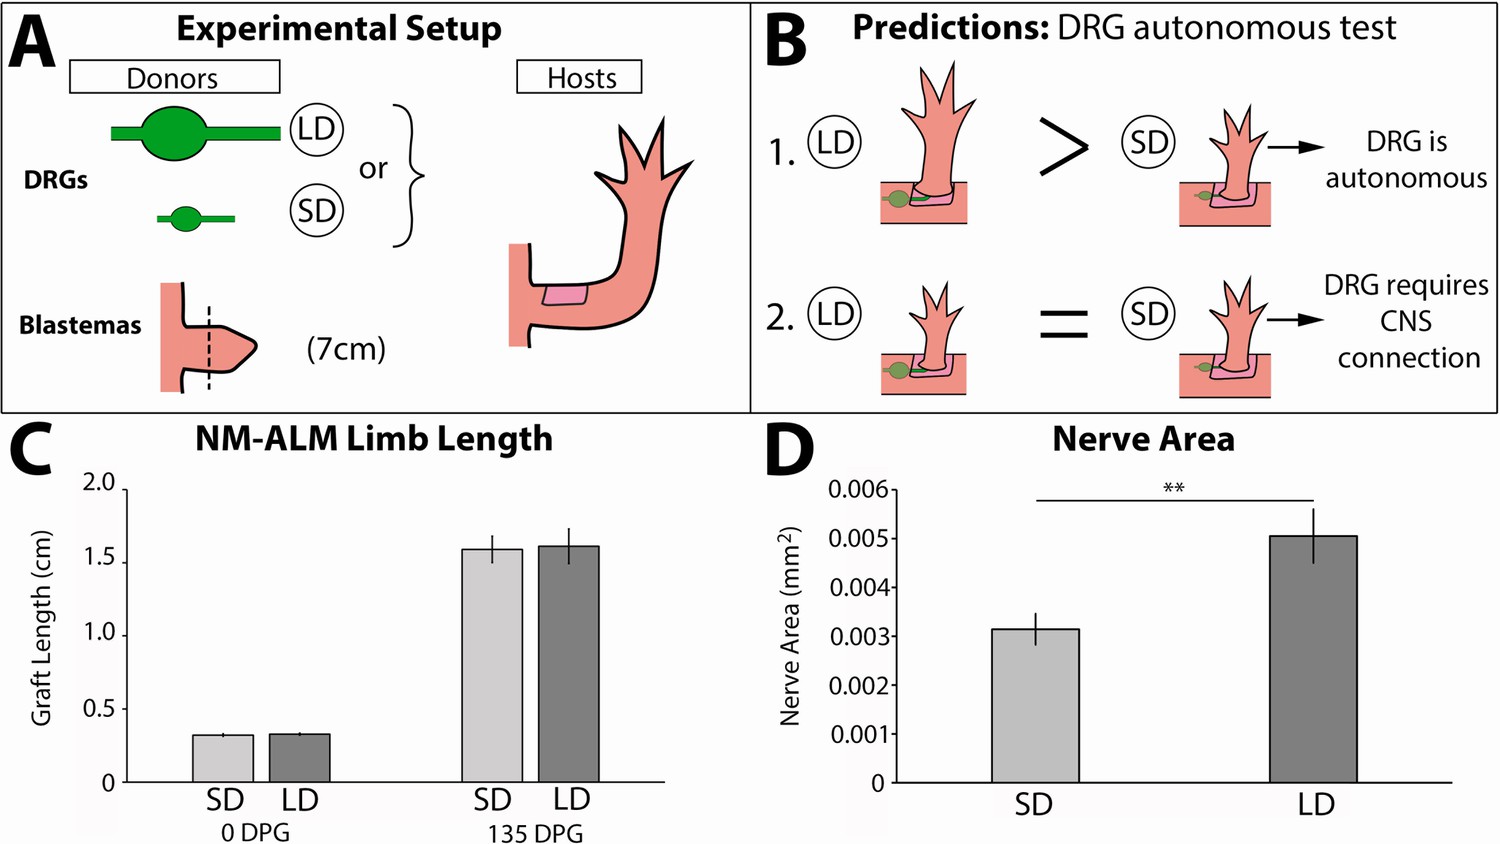
Neurons lose the ability to regulate allometric growth in the neural-modified accessory limb model (NM-ALM).
(A) Dorsal root ganglia (DRGs) from large (~14 cm, n = 12) and small (~7 cm, n = 16) GFP+ animals were grafted into wound sites on host animals (~14 cm) followed by mid-bud blastemas from (~7 cm) donor animals. (B) If the ability to regulate size is autonomous to the DRGs, the DRGs from large animals will produce larger ectopic limbs than those from small animals. If size regulation is not autonomous, there will be no difference in ectopic limb size between grafts supplied by large or small animal DRGs. (C) The ectopic limb lengths were the same size at 0 day post graft (DPG) and remained the same throughout regeneration (135 DPG). Error bars = SEM. p-Values calculated by t-tests. (D) GFP+ innervation abundance was quantified in transverse sections of the ectopic limbs, showing significantly more nerve area (mm2) in the NM-ALMs grafted with DRGs from large donors compared to small donors (n = 5). Error bars = SEM. p-value = 0.0079, calculated by Mann-Whitney test.
Tables
Key resources table
| Reagent type (species) or resource | Designation | Source or reference | Identifiers | Additional information |
|---|---|---|---|---|
| Genetic reagent (Ambystoma mexicanum) | White-strain 518 | Ambystoma Genetic Stock Center at the University of Kentucky | RRID: AGSC_101J | |
| Genetic reagent (Ambystoma mexicanum) | GFP-strain | Ambystoma Genetic Stock Center at the University of Kentucky | RRID: AGSC_110J | |
| Genetic reagent (Ambystoma mexicanum) | RFP-strain | Ambystoma Genetic Stock Center at the University of Kentucky | RRID: AGSC_112J | |
| Chemical compound, drug | MS-222 | Sigma-Aldrich | E10521-50G | |
| Chemical compound, drug | Formaldehyde | RICCA Chemical Company | R3190000-1A | |
| Other | DAPI | Sigma-Aldrich | D9542-5MG | (1:1000) dilution |
| Chemical compound, drug | Ethylenediaminetetraacetic acid (EDTA) | VWR | VWRV0105-500G | |
| Commercial assay or kit | In Situ Cell Death Detection Kit, Fluorescein | Roche | 11684795910 | |
| Commercial assay or kit | Click-iT Plus EdU Proliferation Kit | Roche | C10337 | 100 ng EdU/Animal |
| Software, algorithm | ZenPro software | Zeiss | 410138-1104-260 | |
| Software, algorithm | FIJI ImageJ | Open Source | ||
| Other | Tissue-Tek OCT Compound | Sakura | 4583 | |
| Other | Permount Mounting Medium | Thermo Fisher Scientific | SP15-100 | |
| Other | VECTASHIELD612 Antifade Mounting Medium | Vector Laboratories | H-1000–10 | |
| Other | Wheat-Germ Agglutinin | Thermo FisherScientific | W32466 | |
| Other | Rhodamine phalloidin | Thermo Fisher Scientific | R415 | |
| Other | Hematoxylin Solution, Harris Modified | Sigma-Aldrich | HHS16-500ml | |
| Other | Eosin Y | Thermo Fisher Scientific | E511-100 | |
| Other | Alcian Blue | Sigma-Aldrich | A-5268 | |
| Antibody | (Mouse Monoclonal) Anti-Acetylated Tubulin antibody | Sigma-Aldrich | T7451-200UL | (1:200) dilution |
| Antibody | (Goat polyclonal) Anti-Mouse IgG Alexa Fluor 488 | Abcam | ab150173 | (1:200) dilution |
Additional files
Download links
A two-part list of links to download the article, or parts of the article, in various formats.
Downloads (link to download the article as PDF)
Open citations (links to open the citations from this article in various online reference manager services)
Cite this article (links to download the citations from this article in formats compatible with various reference manager tools)
Neural control of growth and size in the axolotl limb regenerate
eLife 10:e68584.
https://doi.org/10.7554/eLife.68584


