Phagocytic ‘teeth’ and myosin-II ‘jaw’ power target constriction during phagocytosis
- Department of Biology and Howard Hughes Medical Institute, University of Washington, United States
- Department of Cell and Developmental Biology, State University of New York Upstate Medical University, United States
- Department of Mechanical Engineering, Stanford University, United States
- IFOM, FIRC Institute of Molecular Oncology, Italy
Figures
Figure 1 with 3 supplements
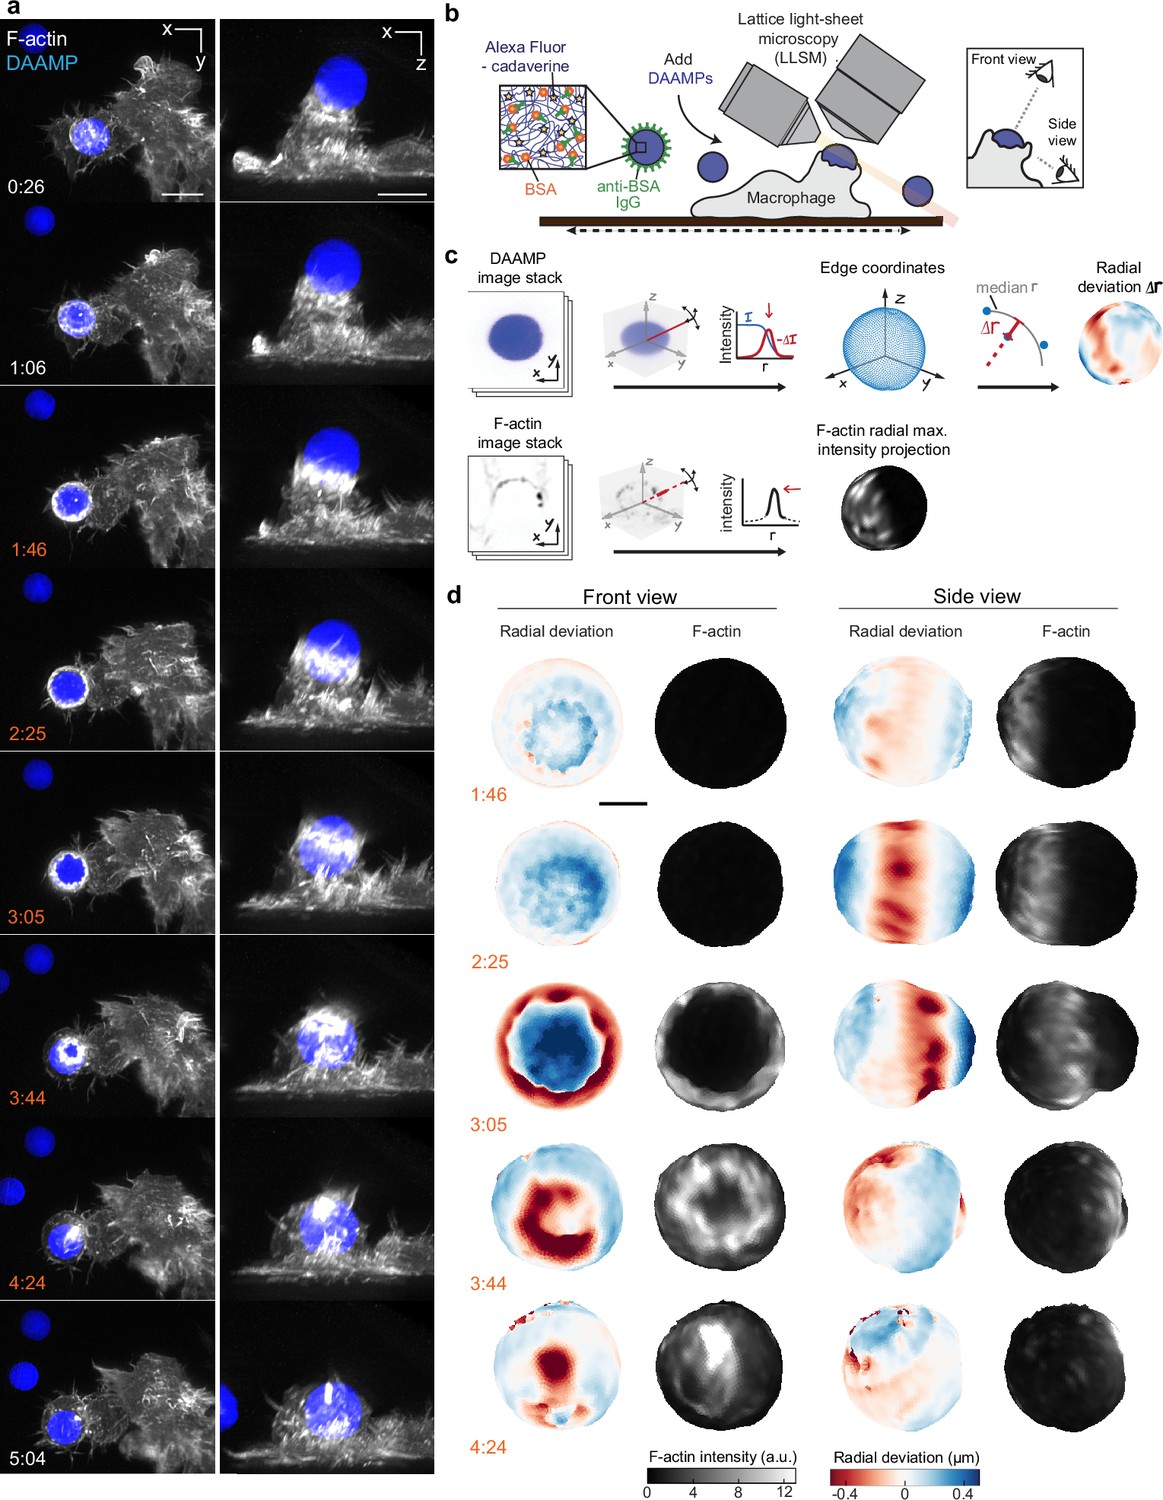
Combined microparticle traction force microscopy (MP-TFM) and lattice light-sheet microscopy (LLSM) reveals phagocytic force-induced deformations in real time.
RAW macrophages transfected with mEmerald-Lifeact were fed soft deformable acrylamide-co-acrylic acid micro (DAAM)-particles (9 μm,1.4 kPa) functionalized with IgG and AF647-Cadaverineand imaged using LLSM. (a) Time lapse montage (min:s) of maximum intensity projections in x/y and x/z. Scale bar, 5 μm. (b,c) Schematic of the combined LLSM and MP-TFM experimental approach and analysis, respectively. (d) Front and side view of reconstructed DAAM-particle internalized in (a) showing target deformations and F-actin localization on particle surface. Colorscale represents the deviation of each vertex from a perfect sphere with radius equal to the median radial distance of edge coordinates to the particle centroid. Scale bar, 3 μm.
-
Figure 1—source data 1
Numeric data for Figure 1—figure supplement 1a–c,e,f and Figure 1—figure supplement 2c–f.
- https://cdn.elifesciences.org/articles/68627/elife-68627-fig1-data1-v2.xlsx
Figure 1—figure supplement 1
Constriction and bulk compressive stresses during phagosome formation and maturation.
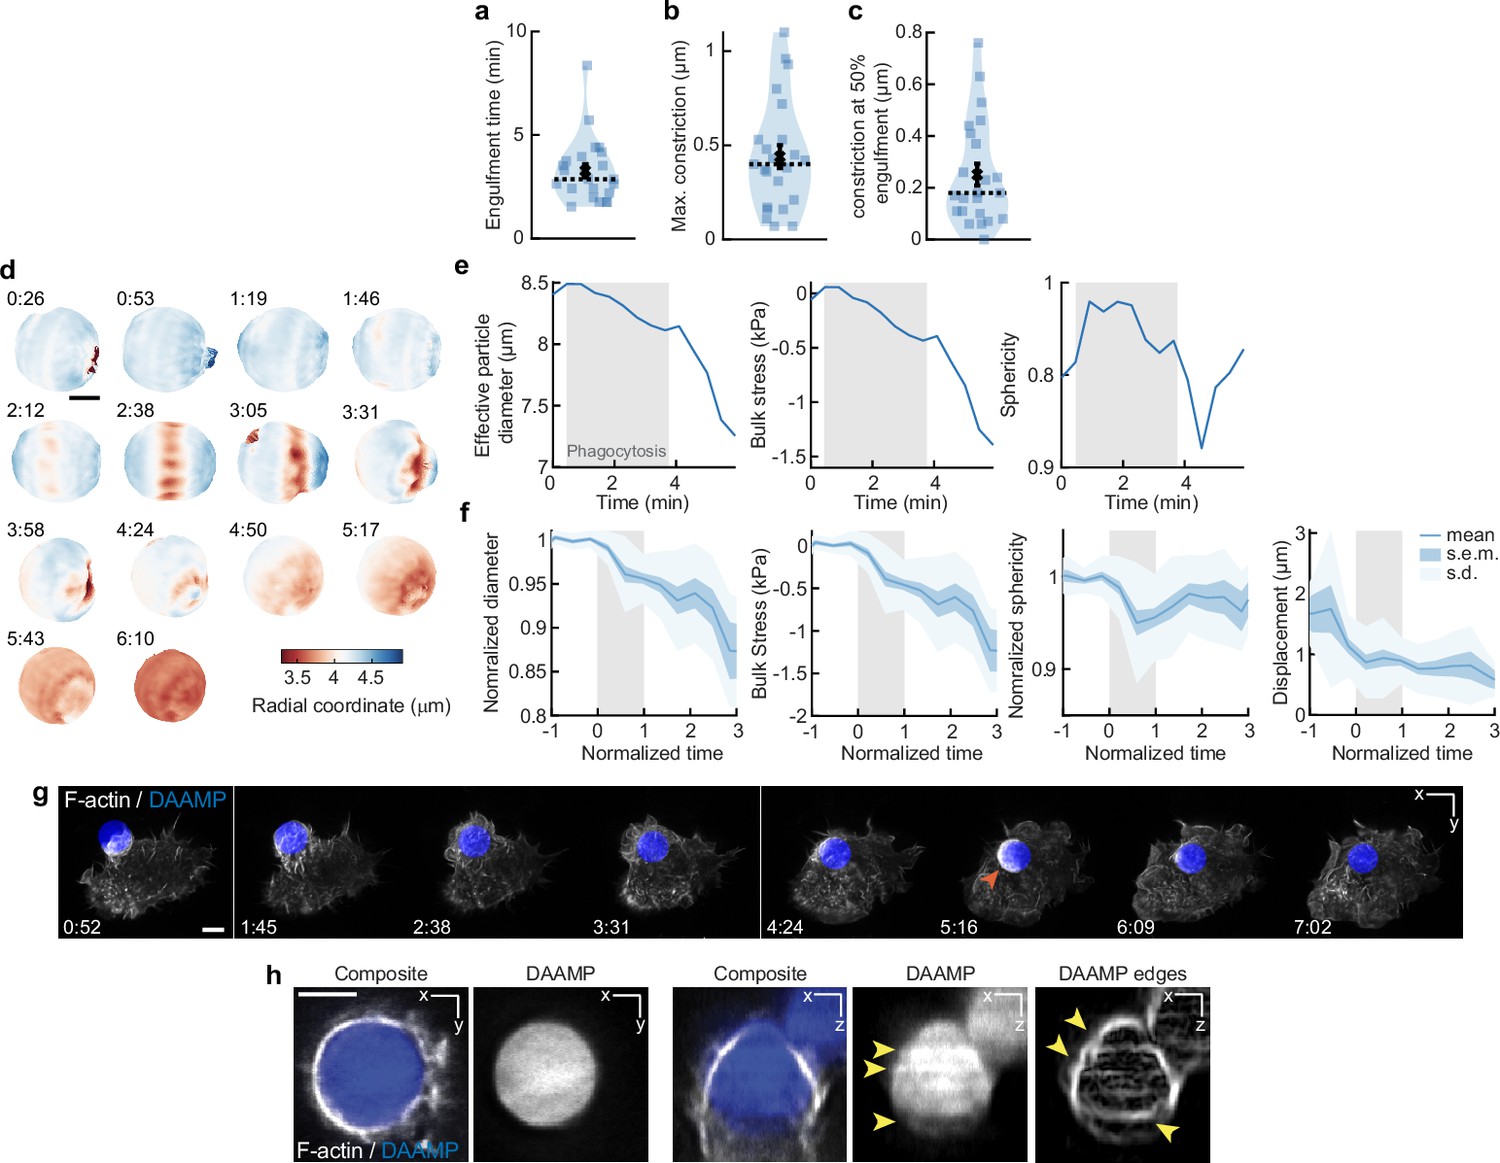
(a,b,c) Violin plot shows individual phagocytic events (colored markers, n = 23), mean (black cross), and median (dashed line). (a) Engulfment time for individual phagocytic events. (b) Maximum target constriction by live-cell imaging using lattice light-sheet microscopy (LLSM). For each movie, the single time point in which target constriction was maximal was identified, and the exact constriction value was determined as described in Figure 3—figure supplement 1. (c) Average target constriction at 50% engulfment. Average is 0.25 ± 0.04 μm (s.e.m., n = 23 cups), which is ~40% larger than observed with fixed cell data at similar stage at 0.18 ± 0.02 μm (s.e.m., n = 19) (Figure 2i). This indicates that partial relaxation of the particle to a more spherical shape occurs during fixation, and that the fixed cell force measurements are likely a slight underestimate of the real phagocytic forces. (d) Volume of deformable acrylamide-co-acrylic acid-microparticles (DAAMPs) decreases with phagocytic internalization. Since hydrogel microparticles are not completely incompressible, their volume can decrease under exertion of bulk forces (Vorselen et al., 2020b). Same event is shown as in Figure 1a and d. Colorscale denotes radial distance to the centroid. Time stamps are provided in min:s, and internalization is complete at the 3:58 time point. Scale bar, 3 μm. (e) Quantification of effective particle diameter, bulk stress, and sphericity over time for DAAMP in (d) Bulk compressive forces can be estimated from the previous DAAMP bulk modulus measurements (~3.8 kPa) (Vorselen et al., 2020b). Gray area indicates time interval of phagocytosis. Compressive stresses arise during phagocytosis and are increased after completion of internalization. (f) Quantification of bulk stresses, target sphericity, and displacement of 23 live-cell phagocytic events. Compressive stresses are exerted during phagocytosis (~0.5 kPa) and increase after completion (~1.3 kPa). Particle sphericity dips during phagocytosis, but the particles return to a more spherical shape after internalization completion. Gray area indicates the duration of phagocytosis, where normalized time t = 0 indicates the start of the phagocytic event, and t = 1 internalization completion for individual events. Particle diameter and sphericity (because it could be strongly affected by imaging artifacts, see h) were normalized to 1, using the measurements before the start of phagocytosis. (g) Brief F-actin accumulation (orange arrow) observed on DAAMP phagosome following internalization. Time lapse montage (min:s) of RAW macrophage transfected with mEmerald-Lifeact internalizing a DAAMP (9 μm, 6.5 kPa) functionalized with IgG and AF647-Cadaverine and imaged using LLSM. Scale bar, 5 μm. (h) Typical LLSM images showing artifacts that hinder particle reconstruction and force analysis. Artifacts are not obvious in the xy-plane, but a strong ‘striping’ artifact, with strong fluctuations in fluorescent intensity (yellow arrows) are visible along the optical axis. Shape reconstruction in microparticle traction force microscopy (MP-TFM) is critically dependent on particle edge detection, which shows clear irregularities (yellow arrows) because of the striping artifact. Such artifacts result in large apparent particle deformations inside and outside the cell-target contact area, and can make it impossible to converge on a solution when solving the elasticity theory problem to infer tractions from target deformations. Because of this, we only used the confocal image data for force analysis. Scale bar, 5 μm.
Figure 1—figure supplement 2
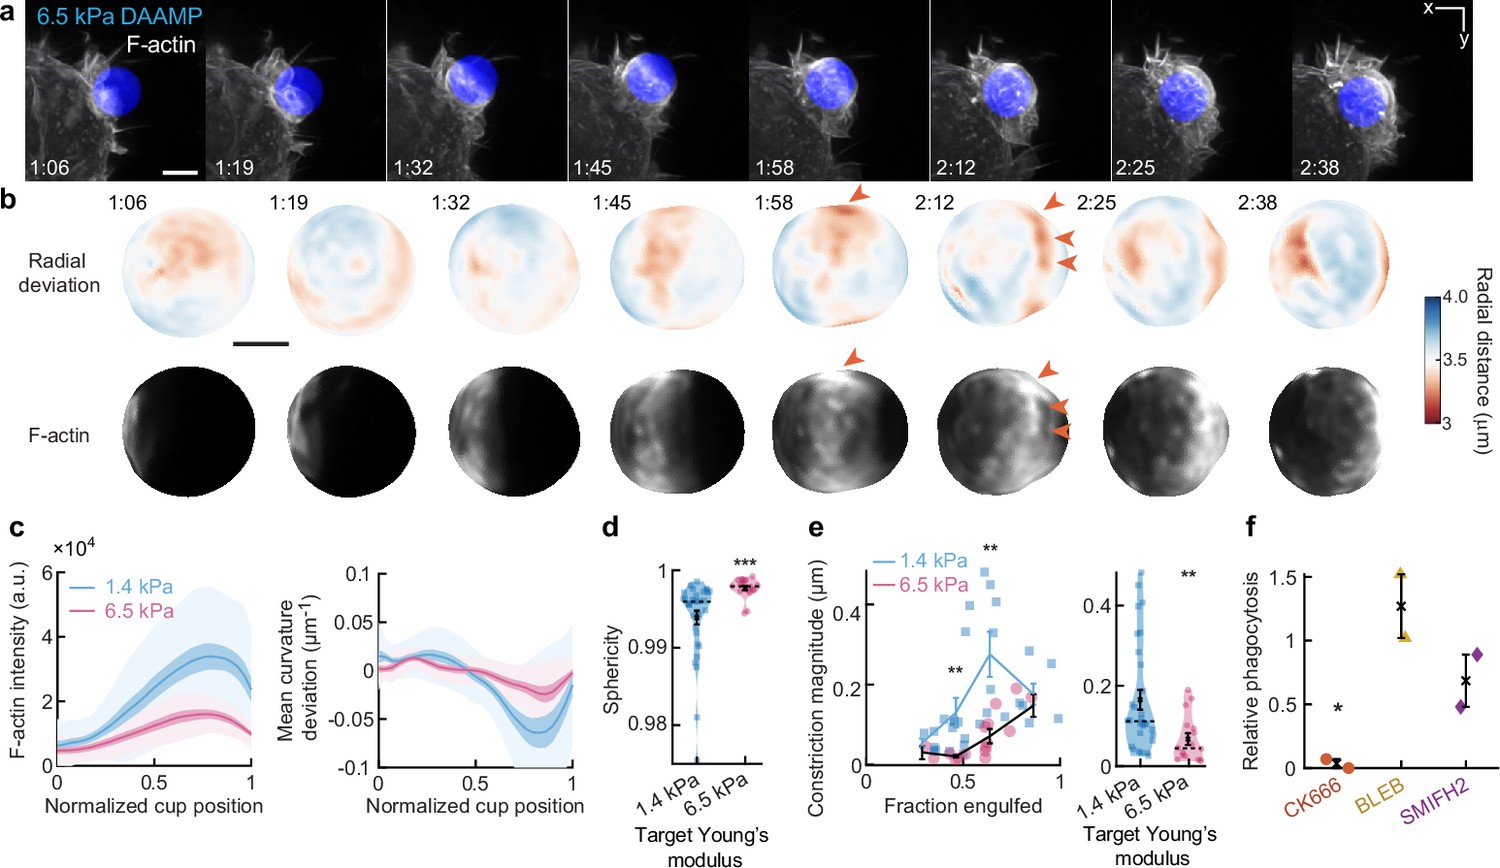
Phagocytosis of stiffer targets follows a qualitatively similar mechanical progression as for softer targets.
(a) Time lapse montage (min:s) of RAW macrophage transfected with mEmerald-Lifeact internalizing a deformable acrylamide-co-acrylic acid-microparticle (DAAMP) (9 μm, Young’s modulus 6.5 kPa) functionalized with IgG and AF647-Cadaverine and imaged using lattice light-sheet microscopy (LLSM). Maximum intensity projections in x/y are shown. Scale bar, 5 μm. (b) Side view of reconstructed DAAMP internalized in (a) showing target deformations and F-actin localization on particle surface. Arrows point at loci of F-actin accumulation and protrusion into the target, similar to those observed for 1.4 kPa particles (Figure 1b). Scale bar, 3 μm. (c) Average deformation and F-actin intensity profiles along the phagocytic axis to the cup rim for fixed RAW cells imaged using confocal microscopy. Signals were first processed on a per-particle basis by averaging over the surface along the phagocytic targets (in 30 bins). Only targets beyond 40% engulfment were included (n = 28, 17 for 1.4 and 6.5 kPa particles, respectively). (d) Target sphericity. Violin plots show individual phagocytic events (markers) (n = 33, 19 for 1.4 and 6.5 kPa particles, respectively), mean (black cross) and median (dashed line). ***Two-sided Wilcoxon rank sum test: p = 5.9 × 10⁻⁶. (e) Analysis of constriction magnitude for all phagocytic events (n = 33, 19 for 1.4 and 6.5 kPa particles, respectively). Individual markers indicate individual measurements, lines indicate averages within the five bins. **Two-sided Wilcoxon rank sum test: p < 0.01. Unsurprisingly, the average target constriction is higher for 1.4 kPa targets (170 ± 25 nm, s.e.m.) than for 6.5 kPa targets (70 ± 15 nm, s.e.m.). Modeling this constriction as a simple cylindrical indentation into a flat surface (), where F is the force, E is the target Young’s modulus, and d is the target Young’s modulus, rough force estimates can be obtained. With ~7 and ~13 nN for the 1.4 and 6.5 kPa targets, respectively, moderately higher total contractile forces are observed on the stiffer targets. All error bars indicate s.e.m. (f) Phagocytic efficiency upon drug treatment follows the same trends as for softer particles (see Figure 3g and Figure 3—figure supplement 5). Efficiency was evaluated as the number of internalized particles divided by the total number of cell-associated particles. Uptake was evaluated 15 min after addition of particles and normalized to internalization by DMSO-treated cells. Two independent experiments were performed where 40–200 particles were measured per condition for each experiment. *p = 0.04 (t-test result for hypothesis, mean = 1).
Figure 1—figure supplement 3
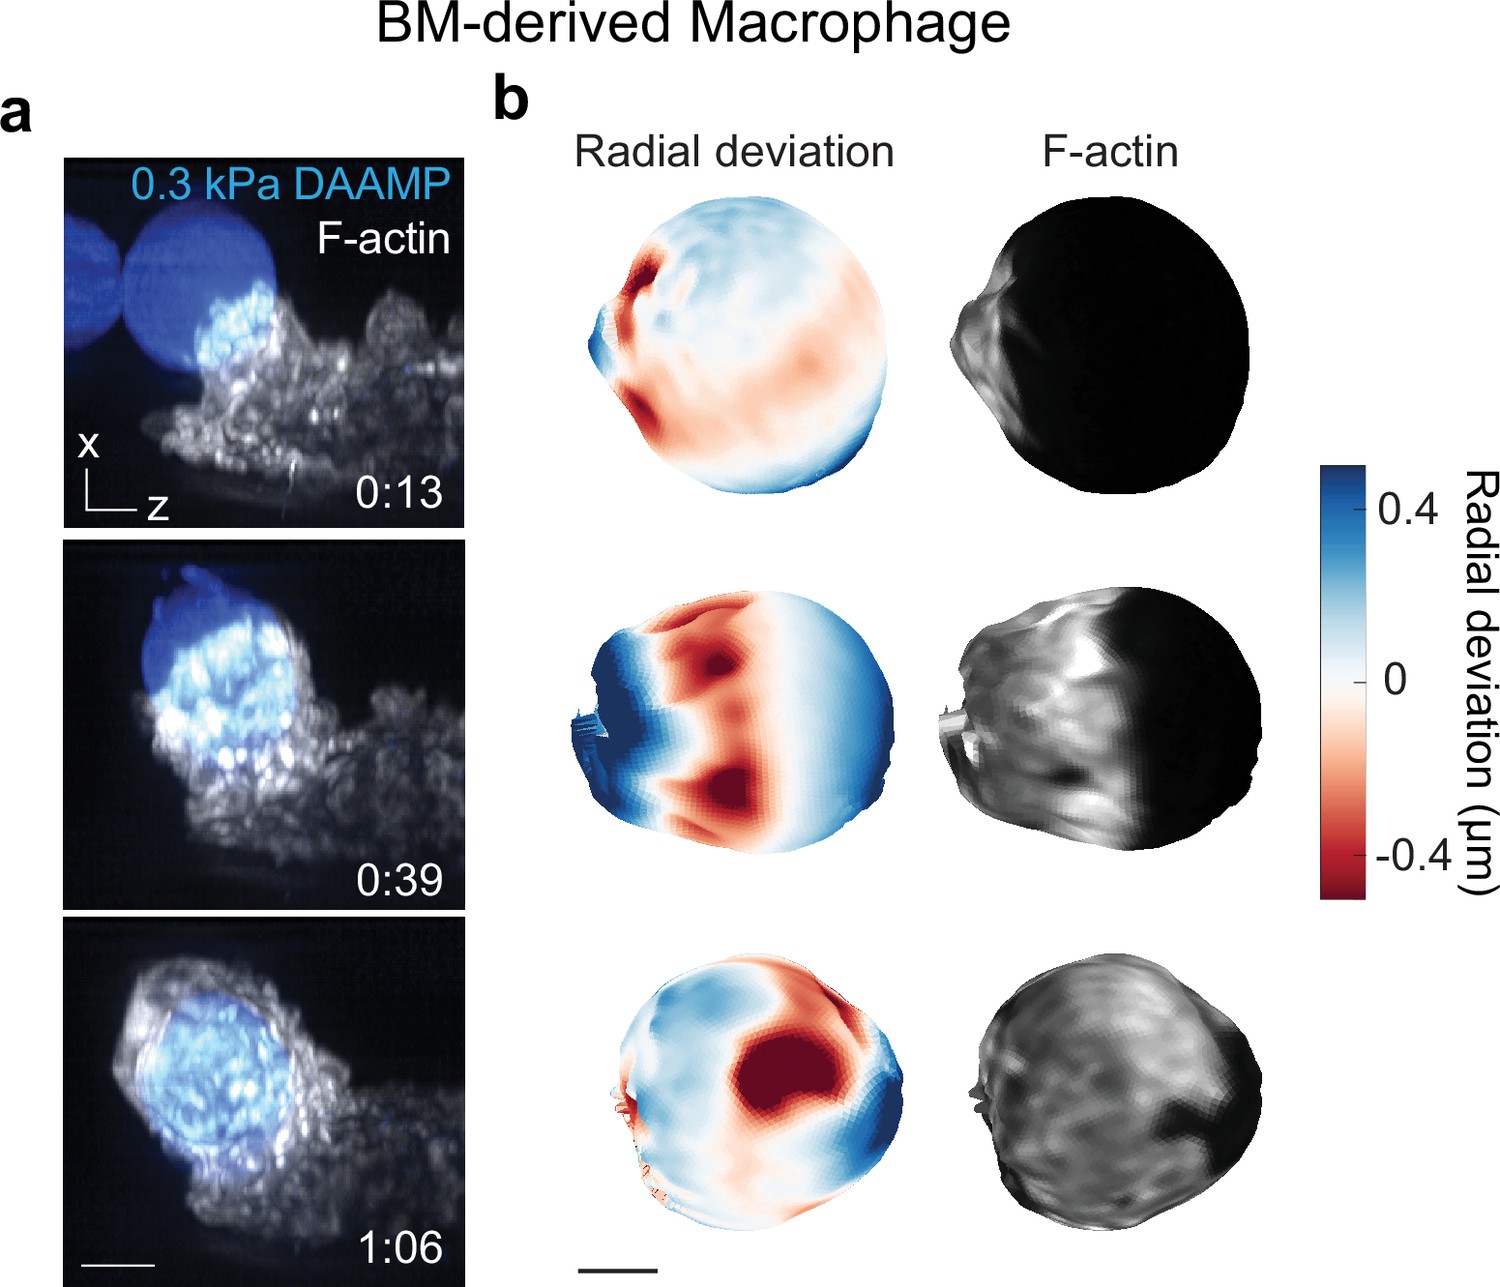
Murine bone marrow-derived macrophage (BMDM) phagocytosis is mechanically qualitatively similar to RAW macrophage phagocytosis.
(a) Time lapse montage (min:s) of a BMDM transfected with mEmerald-Lifeact internalizing a soft deformable acrylamide-co-acrylic acid-microparticle (DAAMP) (9 μm, Young’s modulus 0.3 kPa) functionalized with IgG and AF647-Cadaverine and imaged using lattice light-sheet microscopy (LLSM). Maximum intensity projections in x/z are shown. Softer targets were chosen than those for RAW cells, because BMDMs induced less strong target deformations. Scale bar, 5 μm. (b) Side view of reconstructed DAAMP internalized in (a) showing target deformations and F-actin localization on particle surface. Similar spots of F-actin accumulation and protrusion into the target can be observed as for RAW cells engulfing 1.4 or 6.5 kPa particles (Figure 1b and Figure 1—figure supplement 1b, Lim et al., 2017). Scale bar, 3 μm.
Figure 2 with 1 supplement
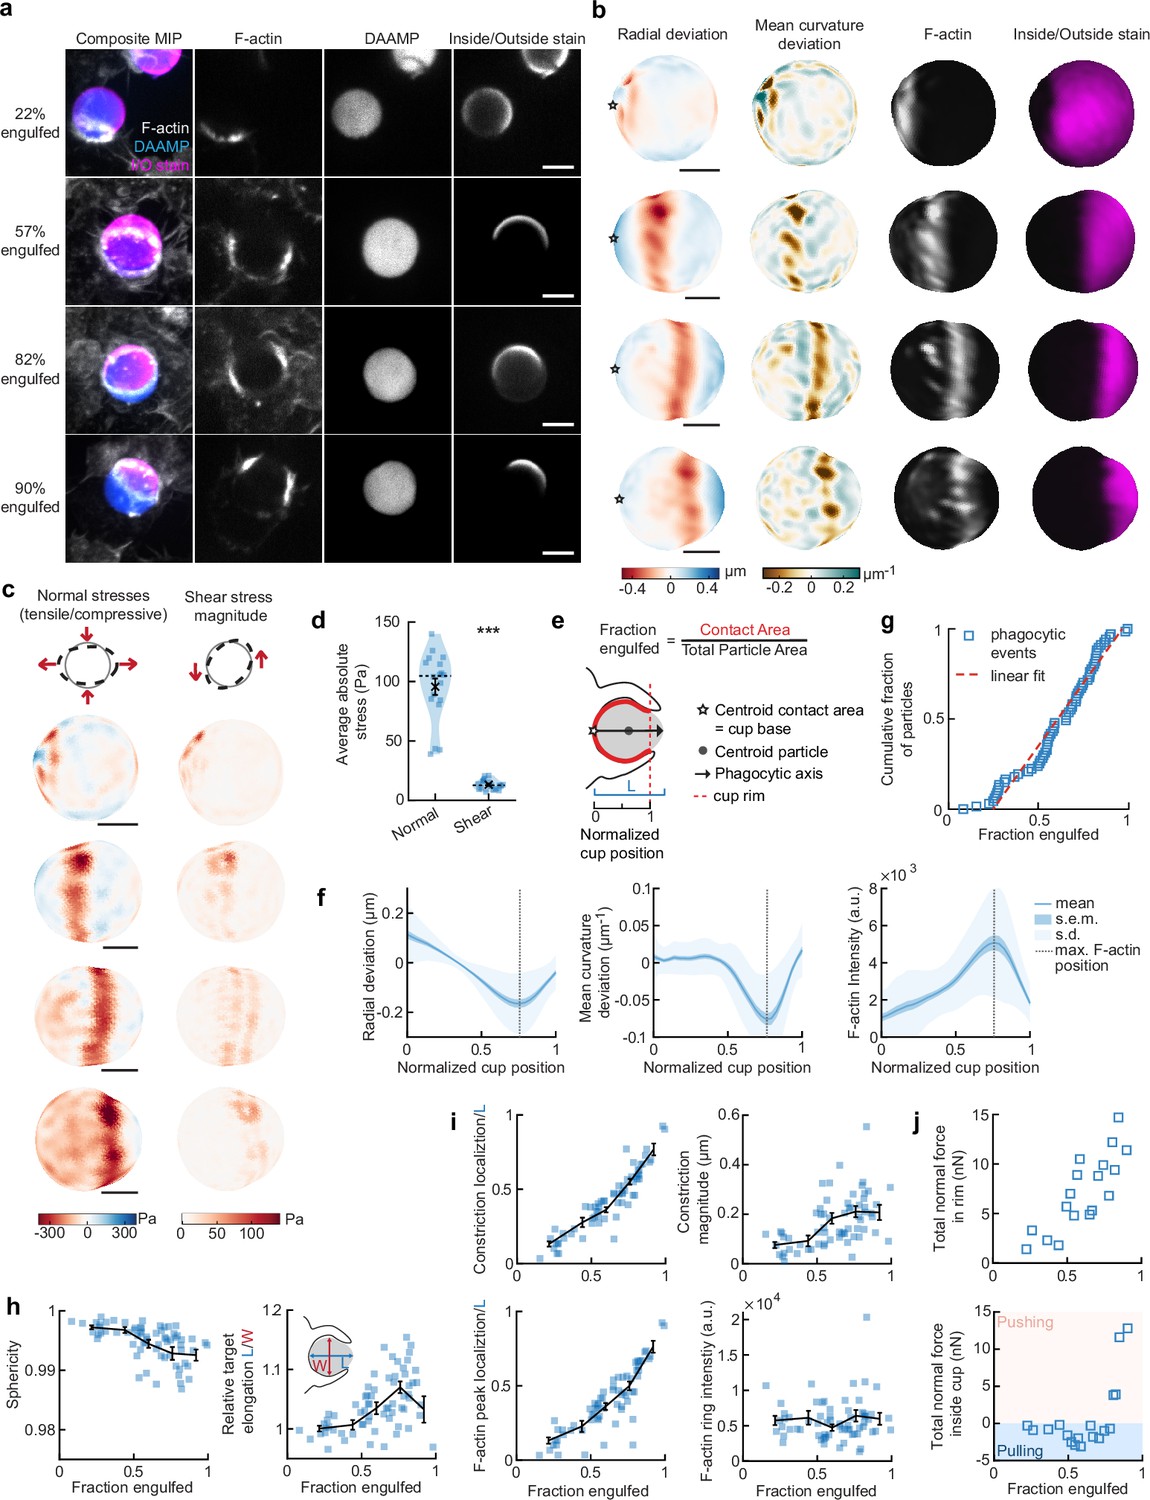
Phagocytic forces include strong actin-mediated constriction and increase with phagocytic progression.
(a) Confocal images of fixed RAW macrophages phagocytosing soft deformable acrylamide-co-acrylic acid micro (DAAM)-particles functionalized with IgG, and AF488-Cadaverine for visualization. Cells were stained for F-actin, and particles with a fluorescent secondary antibody to reveal the exposed surface. Left column: composite maximum intensity projections (MIP) of confocal z-stacks, second to fourth column: single confocal slices through particle centroid. Scale bar, 5 μm. (b) 3D shape reconstructions of deformable acrylamide-co-acrylic acid-microparticle (DAAMP) in (a) revealing detailed target deformations induced during phagocytosis and localization of F-actin over the particle surface. Stars mark the base of the phagocytic cup, and cups are aligned with the phagocytic axis (see e) from left to right. Scale bars, 3 μm. (c) Normal and shear stresses inferred from the shape deformations of the targets in (a,b). Negative normal forces denote (inward) pushing forces. (d) Averages of absolute magnitudes of normal and shear stresses in phagocytic cups (n = 18). Violin plots show individual phagocytic events (blue markers), mean (black cross) and median (dashed line). *Two-sided Wilcoxon rank sum test: p = 2.0 × 10⁻⁴. (e) Schematic representation of phagocytic parametrization. Normalized cup position indicates the position along the phagocytic axis relative to the rim of the cup, with 0 the cup base and 1 the rim of the phagocytic cup. (f) Average profiles of target deformation and F-actin intensity along the phagocytic axis, where 0 and 1 are the cup base and rim, respectively. Signals were first processed on a per-particle basis by averaging over the surface along the phagocytic targets (in 30 bins). Only targets beyond 40% engulfment were included (54 out of 68 events in total). (g) Cumulative distribution function of the engulfment stage of randomly selected phagocytic events before completion of engulfment (n = 68). Dashed red line indicates a linear fit. (h) Target sphericity and elongation dependence on phagocytic stage. Blue squares indicate individual measurements, black lines indicate averages within five bins. Middle graph inset schematic shows how relative elongation was determined. (i) Analysis of the radially symmetric component of particle deformation and F-actin fluorescence along the phagocytic axis for all phagocytic events (n = 68). Marker and line styles as in (h). (j) Analysis of forces in the contractile ring at the cup rim and throughout the remainder of the cup for 18 cups selected for force analysis. All error bars indicate s.e.m. unless indicated otherwise. Raw data are available in Figure 2—source data 1 and raw images are available on a FigShare repository (Barger et al., 2021a).
-
Figure 2—source data 1
Numeric data for Figure 2d,f–i.
- https://cdn.elifesciences.org/articles/68627/elife-68627-fig2-data1-v2.xlsx
Figure 2—figure supplement 1
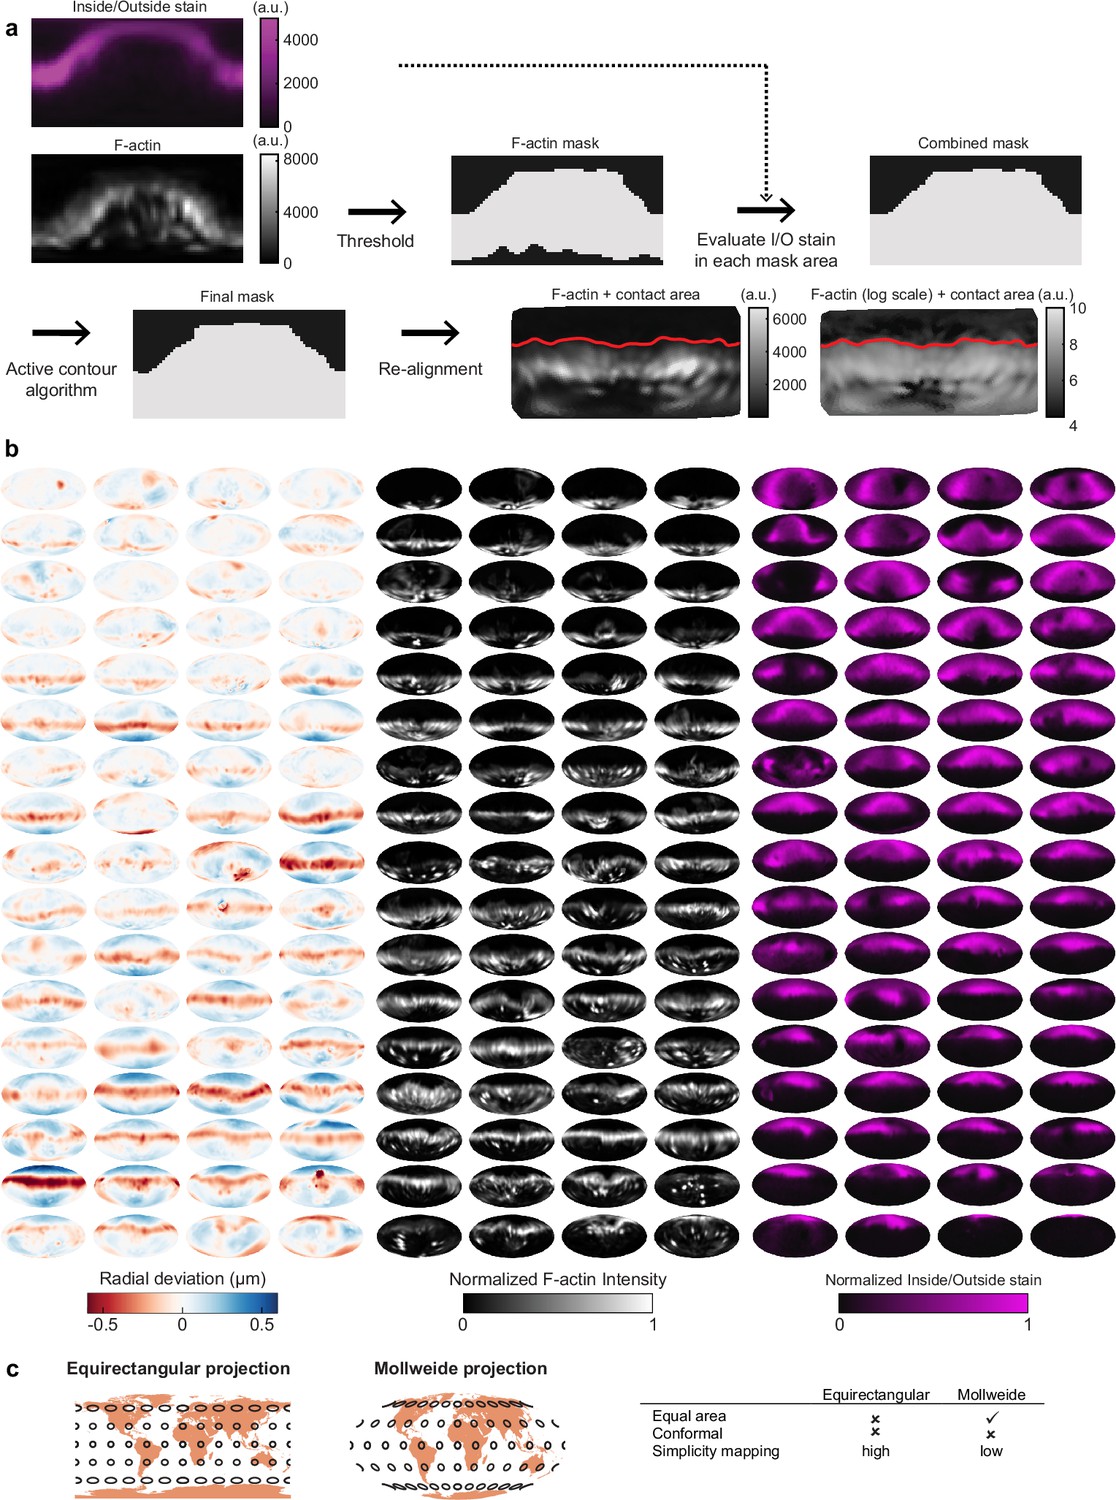
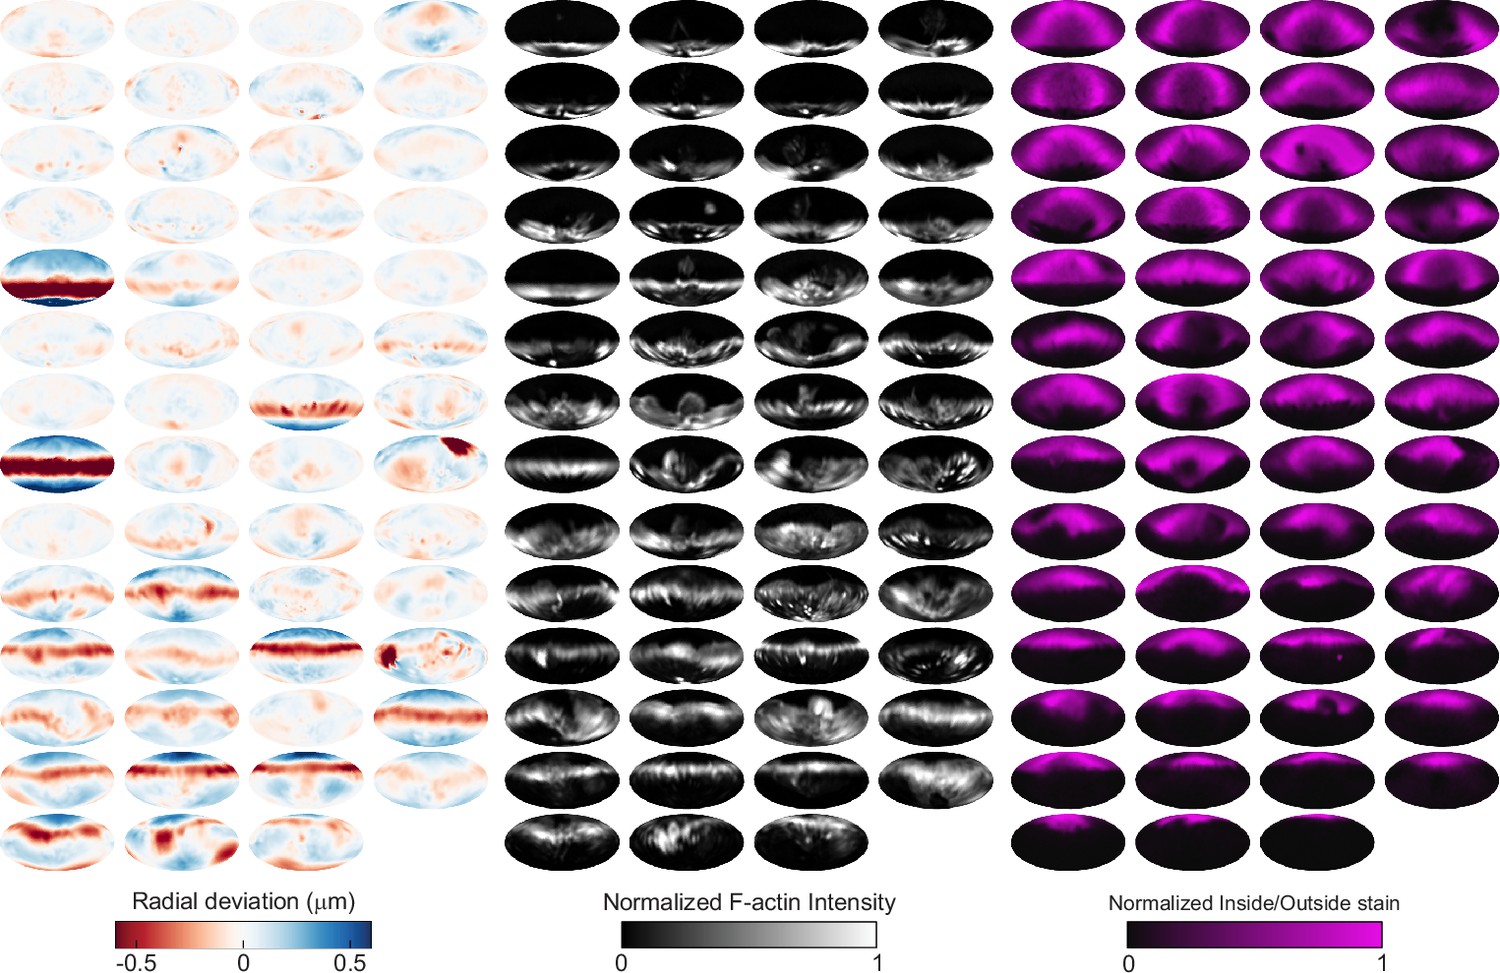
Automated image analysis reveals deformation, F-actin localization, and inside/outside (I/O) stain for 68 phagocytic events.
(a) Determination of contact area between cell and target was calculated using both I/O signal (immunostain of exposed particle surface) and the F-actin signal for confocal microscopy data. First, an initial mask was determined based on thresholding the logarithm of the F-actin signal. Then, for each area with low F-actin intensity, the I/O stain is compared to the mean I/O stain, and each area is marked as inside (when the I/O stain is below average) or outside (when the I/O stain is above average). A region-based active contour algorithm was used to optimize the mask (Lankton and Tannenbaum, 2008; Vorselen et al., 2020b). Finally, particles were aligned, and their fraction engulfed (masked area/total area) calculated. (b) Visualization of deformations, F-actin intensity, and I/O stain for all 68 control particles (being phagocytosed by DMSO-treated cells) used in this manuscript shown using Mollweide projections (see c). The particles are sorted by phagocytic stage, with the upper left the lowest percentage of the particle surface area engulfed and the bottom right the highest percentage. (c) Comparison of equirectangular projection and Mollweide projection for mapping spherical surface for 2D visualization. All 2D projections of a sphere are necessarily distorted. The Mollweide projection is an equal area projection, and therefore does not lay emphasis on the polar regions. Angles are, however, not preserved in this mapping.
Figure 3 with 5 supplements

Arp2/3-mediated actin polymerization and myosin-II have distinct roles in phagocytic force generation and progression.
(a) Confocal images of drug-treated fixed RAW cells phagocytosing deformable acrylamide-co-acrylic acid micro (DAAM)-particles functionalized with IgG and AF488-Cadaverine for visualization. Cells were treated with DMSO, CK666 (150 μM), and Blebbistatin (15 μM) for 30 min prior to phagocytic challenge. Each target is approximately 60% engulfed. Fixed cells were stained for F-actin, and particles were labeled with a fluorescent secondary antibody to reveal the exposed surface. Left column: composite maximum intensity projections (MIP) of confocal z-stacks, second to third column: single confocal slices through particle centroid. Scale bar, 5 μm. (b) Particle shape reconstructions from (a) revealing cell-induced target deformations and localization of F-actin over the particle surface. Stars mark the base of the phagocytic cup, cups are aligned with the phagocytic axis (see Figure 2e) from left to right. Scale bars, 3 μm. (c) Normal and shear stresses derived from target deformations. Negative normal forces denote (inward) pushing forces. (d) Average profiles of target deformation and F-actin intensity along the phagocytic axis. Signals were first processed on a per-particle basis by averaging over the surface along the phagocytic targets in 30 bins. Targets before 40% engulfment were excluded. (e, f) Violin plots showing individual phagocytic events (colored markers), mean (black cross), and median (dashed line). (e) F-actin peak intensity and band width. (f) F-actin intensity in the cup (behind the rim), measured right (3 μm) behind the main peak for each particle. (g) Phagocytic efficiency upon drug treatment evaluated as the number of internalized particles divided by the total number of cell-associated particles. Uptake was evaluated 15 min after addition of particles and normalized to internalization by DMSO-treated cells. Three independent experiments were performed where 80–200 particles were measured per condition for each experiment. ***p = 0.0007 (t-test result for hypothesis, mean = 1). (h) Upper panel, cumulative distribution function of the engulfment stage of randomly selected phagocytic events before completion of engulfment (n = 68, 63, 73 respectively) from three independent experiments. Two sample Kolmogorov-Smirnov test was used (p = 0.016*). Lower panel, fraction late-stage cups. Error bars indicate st.d. estimated by treating phagocytosis as a Bernoulli process. Fisher’s exact test was used to compare fractions (p = 1.9 × 10⁻⁴)***. (i) Sphericity and (j) constriction magnitude of DAAM-particle changes with phagocytic progression upon drug treatment. Colored markers indicate individual events, black lines indicate averages of five bins. Right column, violin plots of all events. Marker and line styles as in (e). All statistical tests were two-sided Wilcoxon rank sum test comparing with the DMSO control (gray) over the same bin with significance levels: p < 0.05*; p < 0.01**; p < 0.001***, unless otherwise indicated. All error bars indicate s.e.m. unless indicated otherwise. Raw data are available in Figure 3—source data 1 and raw images are available on a FigShare repository (Barger et al., 2021a).
-
Figure 3—source data 1
Numeric data for Figure 3d–j and Figure 3—figure supplement 1a–e.
- https://cdn.elifesciences.org/articles/68627/elife-68627-fig3-data1-v2.xlsx
Figure 3—figure supplement 1
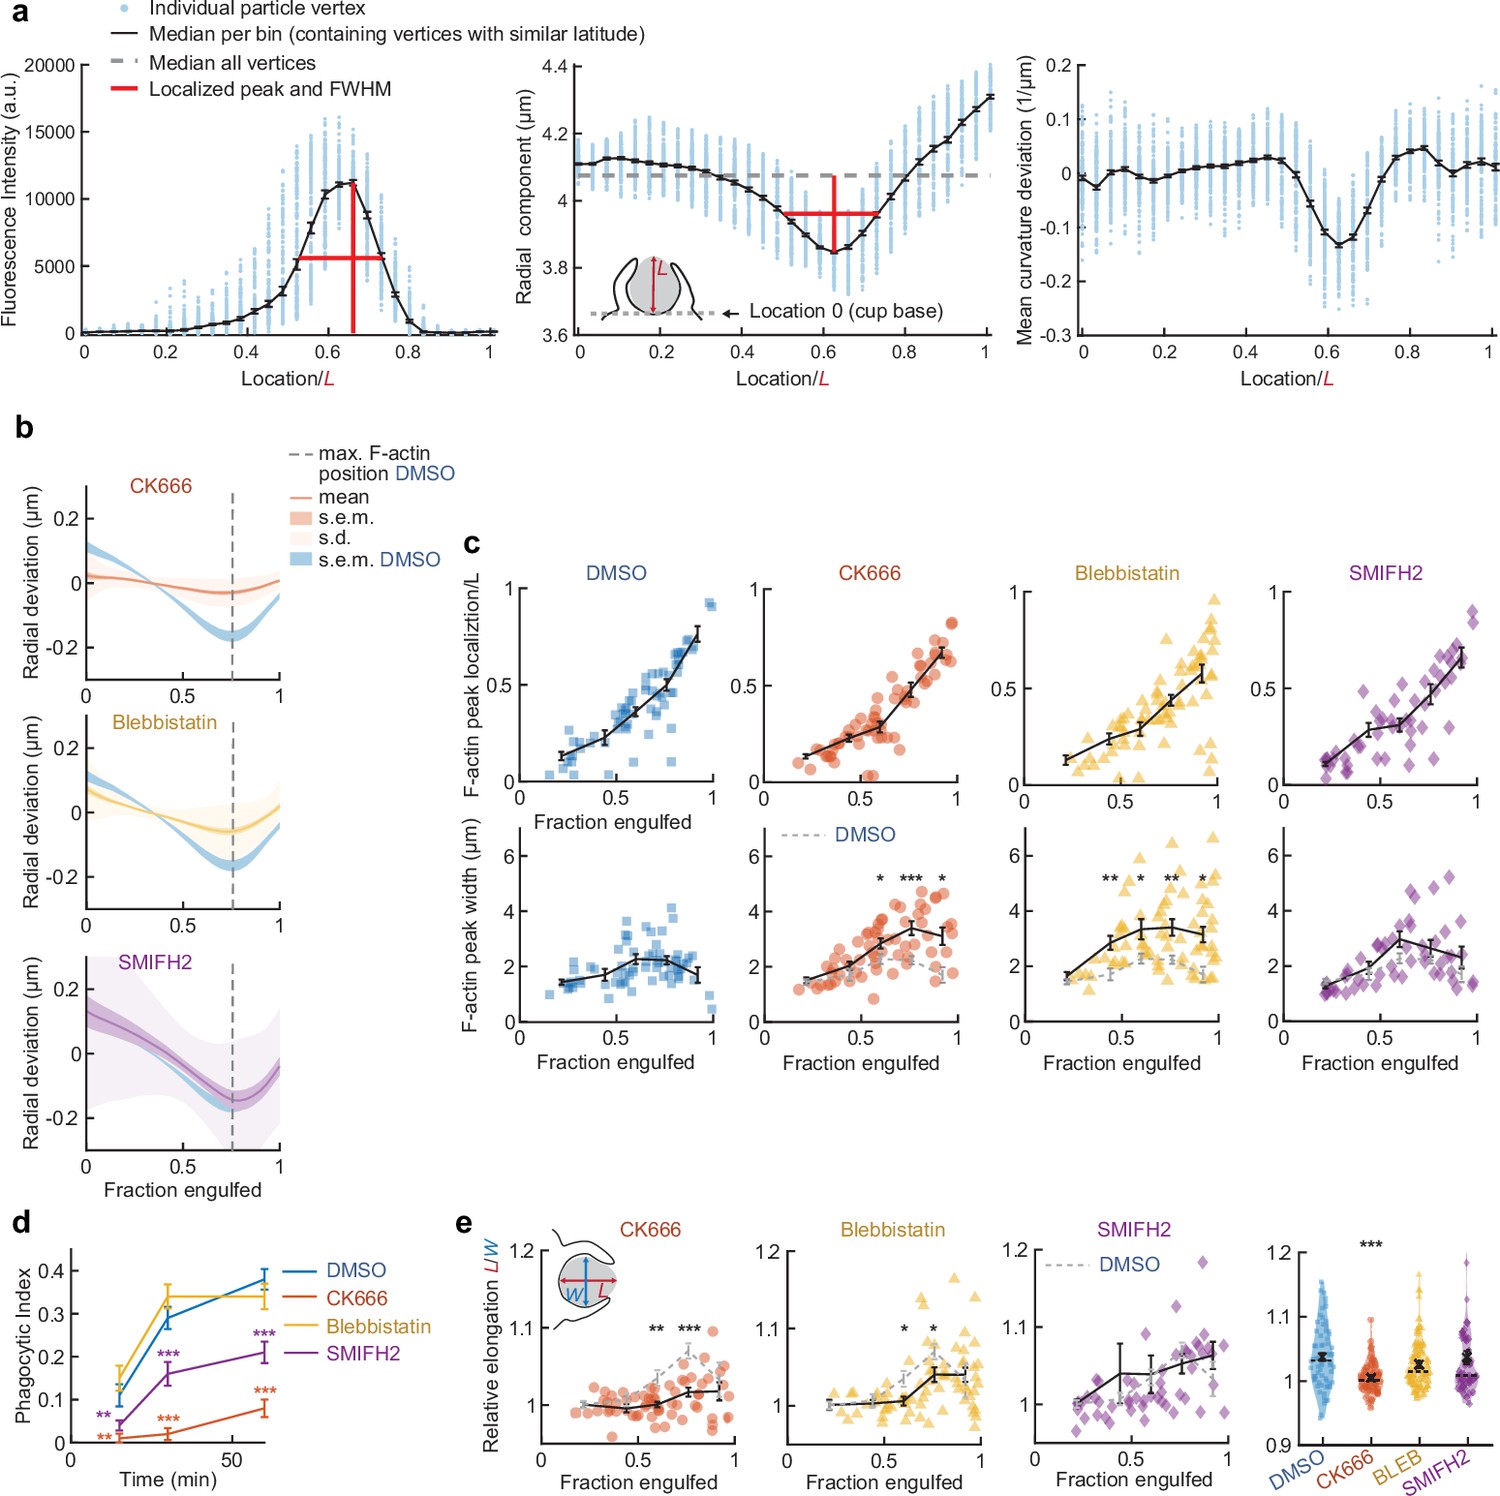
Actin organization and target deformation along the phagocytic axis are affected by perturbation of actomyosin activity.
(a) Determination of F-actin and contractile ring localization, peak magnitude, and peak width. Particles were aligned with the centroid of the cell-target contact area (base of the cup) at the south pole (see inset middle panel). All particle edge coordinates (~4250) were then divided into bins per latitude of which the median was calculated. Finally, peak height, location, and full width at half maximum (FWHM) were determined. Data shown corresponds to the particle in the third column, second to last row in Figure 2—figure supplement 1. (b) Average target deformation profiles along the phagocytic axis until the cup rim. Signals were first processed on a per-particle basis by averaging over the surface along the phagocytic targets in 30 bins. (c) Determination of F-actin statistics along the phagocytic axis for all phagocytic events (n = 68, 63, 73, and 55 respectively). Colored markers indicate individual measurements, black lines indicate averages within five bins. (d) Uptake efficiency over time. Cells were fixed at various time points and immunostaining of the deformable acrylamide-co-acrylic acid-microparticle (DAAMP) surface was used to differentiate internalized from external particles. Shown is a single time course representative for two experiments with 80–400 cups measured for each condition/time point. Phagocytic index is defined as the number of internalized particles divided by all cell-associated particles. Error bars indicate st.d. estimated by treating phagocytosis as a Bernoulli process. Fisher’s exact test was used to compare fractions (p < 0.01**; p < 0.001***). (e) Target elongation changes with phagocytic progression upon drug treatment. Marker and line styles as in (c). Inset in leftmost panel shows schematically how relative elongation was determined. Right column, violin plots of all events, showing individual phagocytic events (colored markers) mean (black cross), median (dashed line). Statistical tests for all figure panels are two-sided Wilcoxon rank sum test comparing with the DMSO control over the same bin with significance levels: p < 0.05*; p < 0.01**; p < 0.001***, unless otherwise indicated.
Figure 3—figure supplement 2
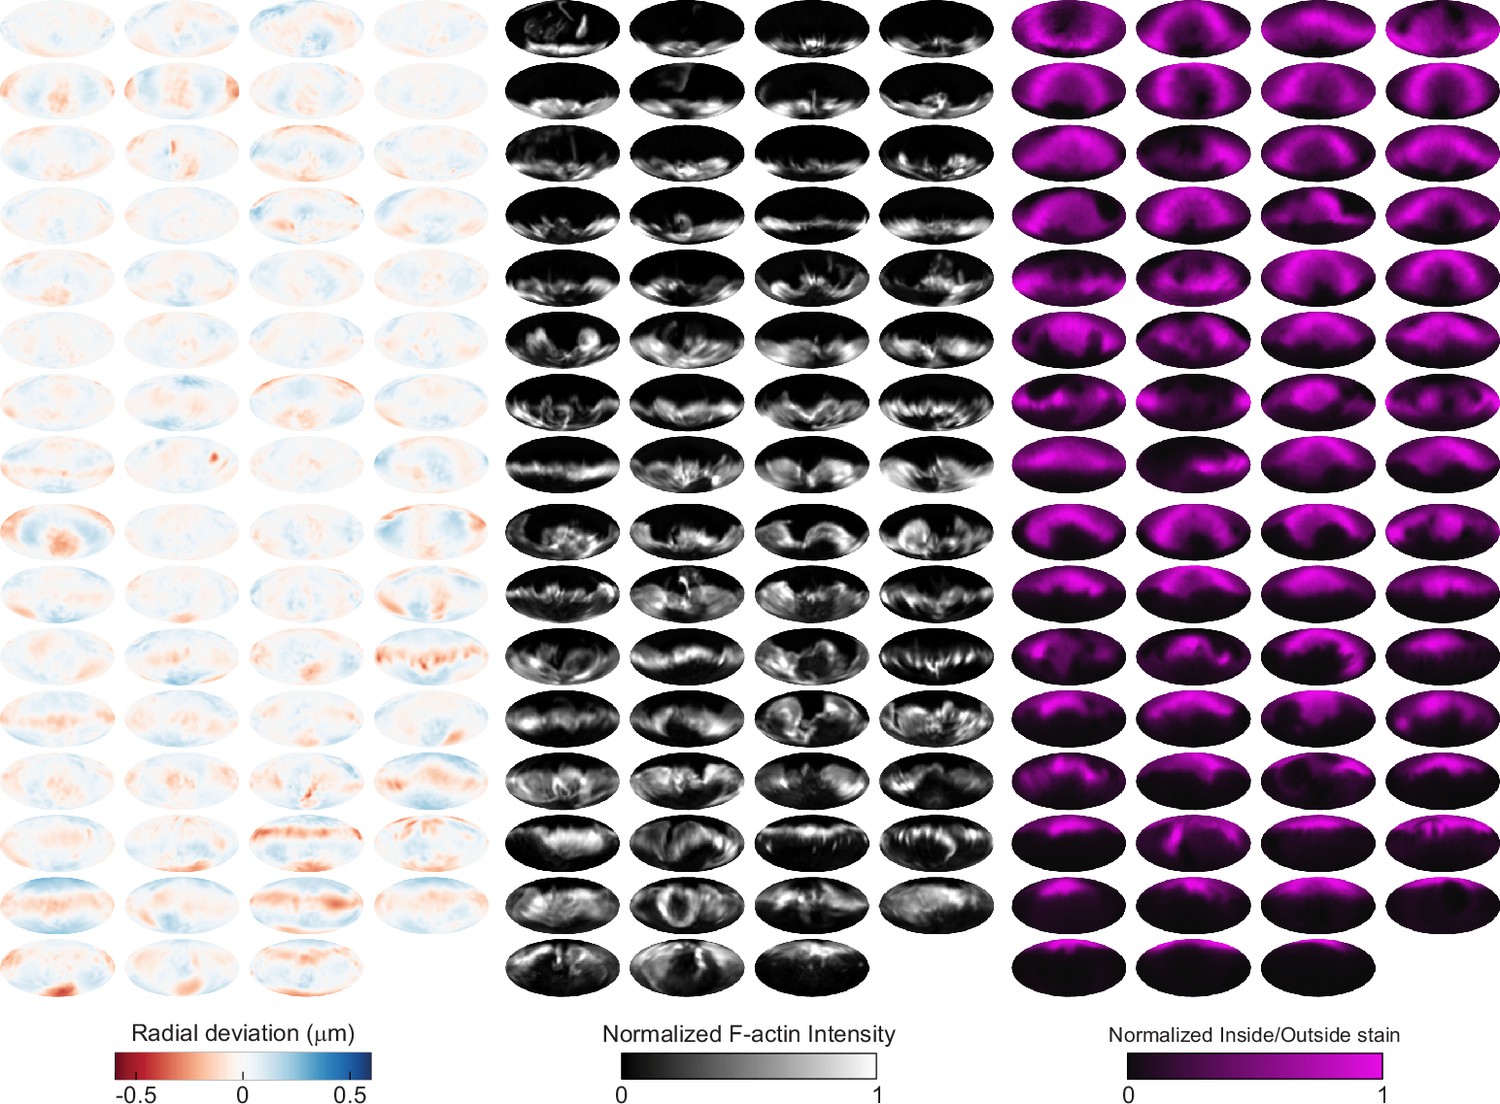
Automated image analysis reveals deformation, F-actin localization, and inside/outside (I/O) stain for 63 phagocytic events in CK666-treated cells.
Visualization of deformations, F-actin intensity, and I/O stain for all 63 particles being phagocytosed by CK666-treated cells used in this manuscript shown using Mollweide projections. Particles are sorted by phagocytic stage, with the upper left the lowest percentage of the particle surface area engulfed and the bottom right the highest percentage.
Figure 3—figure supplement 3

Automated image analysis reveals deformation, F-actin localization, and inside/outside (I/O) stain for 75 phagocytic events in Blebbistatin-treated cells.
Visualization of deformations, F-actin intensity, and I/O stain for all 75 particles being phagocytosed by Blebbistatin-treated cells used in this manuscript shown using Mollweide projections. Particles are sorted by phagocytic stage, with the upper left the lowest percentage of the particle surface area engulfed and the bottom right the highest percentage.
Figure 3—figure supplement 4
Automated image analysis reveals deformation, F-actin localization, and inside/outside (I/O) stain for 55 phagocytic events in SMIFH2-treated cells.
Visualization of deformations, F-actin intensity, and I/O stain for all 55 particles being phagocytosed by SMIFH2-treated cells used in this manuscript shown using Mollweide projections. Particles are sorted by phagocytic stage, with the upper left the lowest percentage of the particle surface area engulfed and the bottom right the highest percentage.
Figure 3—figure supplement 5
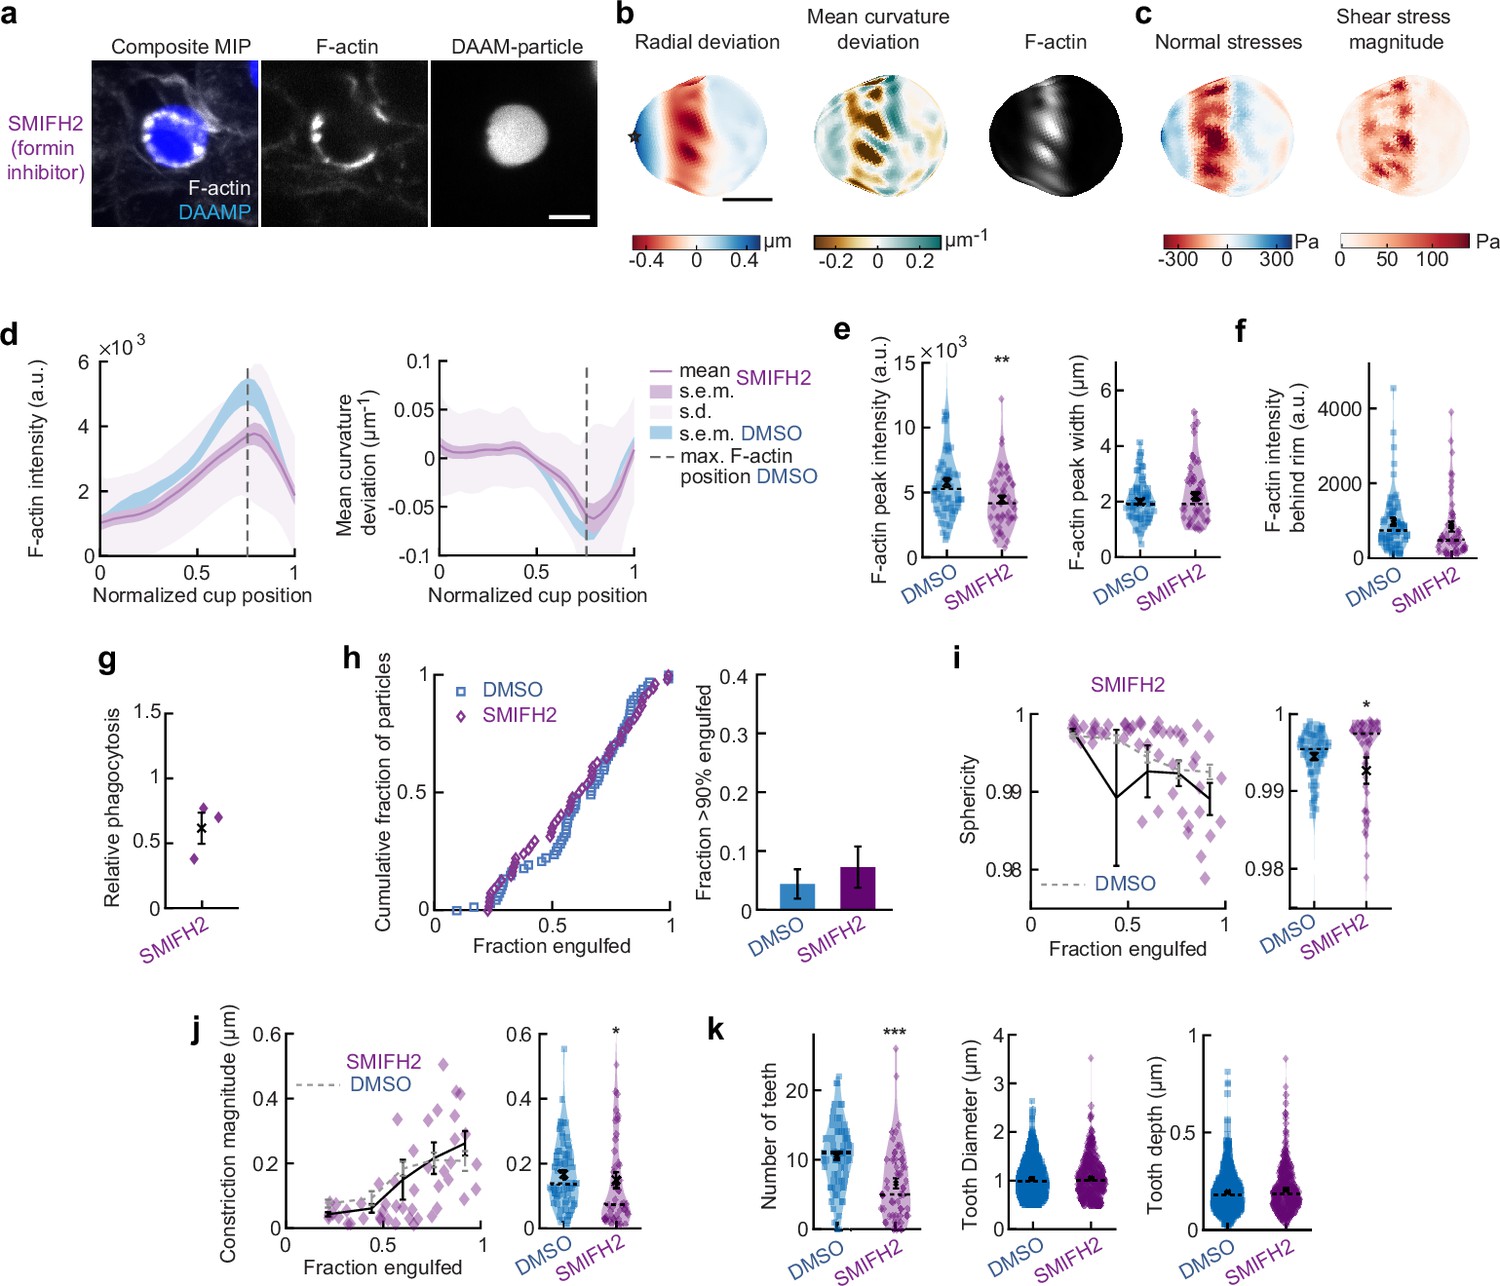
SMIFH2 treatment has modest effect on force generation and F-actin distribution during phagocytosis.
(a) Confocal images of representative SMIFH2-treated fixed RAW cell phagocytosing deformable acrylamide-co-acrylic acid-micro (DAAM)-particle functionalized with IgG and AF488-Cadaverine for visualization. Cells were treated with 10 μM SMIFH2 for 30 min prior to phagocytic challenge. The target is approximately 60% engulfed. Fixed cells were stained for F-actin, and particles were labeled with a fluorescent secondary antibody to reveal the exposed surface. Left column: composite maximum intensity projection (MIP) of confocal z-stacks, second to third column: single confocal slices through particle centroid. Scale bar, 5 μm. (b) Particle shape reconstructions from (a) revealing cell-induced target deformations and localization of F-actin over the particle surface. Stars mark the base of the phagocytic cup, cups are aligned with the phagocytic axis (see Figure 1e) from left to right. Scale bars, 3 μm. (c) Normal and shear stresses derived from target deformations. Negative normal forces denote (inward) pushing forces. (d) Average profiles of target deformation and F-actin intensity along the phagocytic axis. Signals were first processed on a per-particle basis by averaging over the surface along the phagocytic targets in 30 bins. Targets before 40% engulfment were excluded. (e, f) Violin plots showing individual phagocytic events (colored markers), mean (black cross), and median (dashed line). (e) F-actin peak intensity and band width. (f) F-actin intensity in the cup (behind the rim), measured right (3 μm) behind the main peak for each particle. (g) Phagocytic efficiency evaluated as the number of internalized particles divided by the total number of cell-associated particles upon SMIFH2 treatment. Three independent experiments were performed, and uptake was evaluated 15 min after addition of particles and normalized to internalization by DMSO-treated cells. t-Test result for hypothesis that the mean = 1 revealed no significant (n.s.) difference to DMSO control cells (p = 0.09). (h) Left panel, cumulative distribution function of the engulfment stage of randomly selected phagocytic events before completion of engulfment (n = 68 DMSO control and 55 SMIFH2-treated) from three independent experiments. Two sample Kolmogorov-Smirnov test revealed no significant difference. Right panel, fraction late-stage cups. Error bars indicate st.d. estimated by treating phagocytosis as a Bernoulli process. Fisher’s exact test was used to compare fractions (n.s.). (i) Sphericity and (j) constriction magnitude of DAAM particle is not affected by SMIFH2 treatment. Colored markers indicate individual events, black lines indicate averages of five bins. Right columns, violin plots of all events. Marker and line styles as in (e). Two-sided Wilcoxon rank sum test comparing with the DMSO control (gray) over the same bins revealed no significant differences. (k) SMIFH2 treatment reduces formation of actin-based teeth within the phagocytic cup. Teeth size and shape are not affected. *** indicates Wilcoxon rank sum test results comparing with the DMSO control with p < 0.001. All error bars indicate s.e.m. unless indicated otherwise. Raw data are available in Figure 3—source data 1 and Figure 4—source data 1.
Figure 4 with 2 supplements
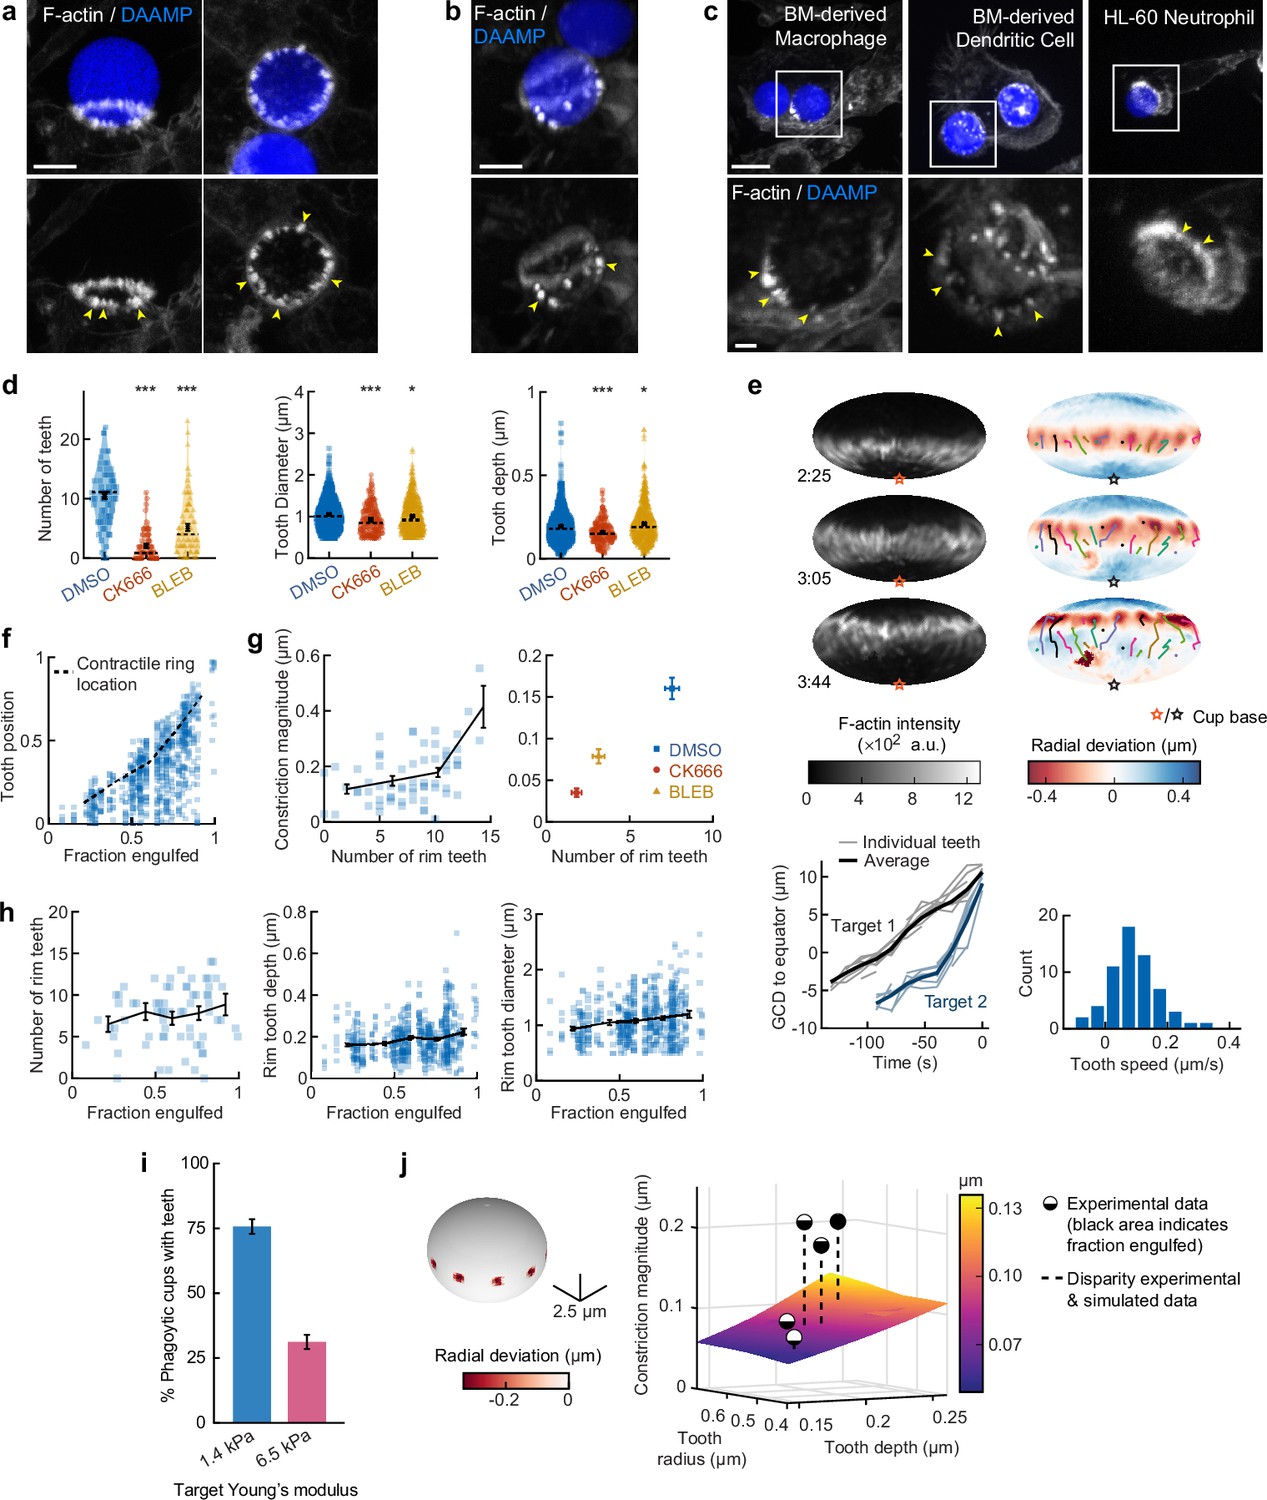
Actin-based teeth are dynamic, and likely interconnected, structures whose protrusive activity contributes to target constriction.
(a,b) RAW macrophages were fed 1.4 kPa deformable acrylamide-co-acrylic acid-microparticles (DAAMPs) and stained for F-actin. Images represent maximum intensity projections of confocal z-stacks. Yellow arrows point to actin-based ‘teeth’. (a) Representative images of teeth at the rim of the phagocytic cup deforming the target. Scale bar, 5 μm. (b) Example of actin-based teeth observed within the phagocytic cup. Scale bar, 5 μm. (c) Primary murine bone marrow-derived macrophage (BMDM), as well as primary bone marrow-derived dendritic cell (BMDC) and HL-60 neutrophil-like cells also form actin teeth in response to DAAMP internalization. Scale bar, 5 μm. Zoom scale bar, 2 μm. (d) CK666 and Blebbistatin treatments reduce formation of actin-based teeth within the phagocytic cup. Teeth size and shape are also modestly affected. Violin plots with individual particles (colored markers), means (black cross), median (dashed line). Stars indicate Wilcoxon rank sum test results comparing with the DMSO control with significance levels: p < 0.05*; p < 0.001***. (e) Manually tracked actin teeth trajectories from DAAMP internalization imaged by lattice light-sheet microscopy (LLSM). Particle surface is shown using Mollweide projection (Figure 2—figure supplement 1). Three time points of a single phagocytic event are shown, with different colors representing unique teeth. Circles indicate current or final position of a tracked tooth. Lines connect the previous positions of tracked teeth. Lower left: great circle distance (GCD) of teeth to the equator for two events. Target 1 is visualized above, time 0 corresponds to the time at which engulfment was completed. Lower right: distribution of tooth speeds with average 0.094 ± 0.08 μm/s (=5.6 μm/min) from three phagocytic events (60 teeth in total from targets 1 and 2 in this panel, and from Figure 4—figure supplement 1). Tooth speeds were averaged over the trajectory of individual teeth. (f) Teeth are mostly located at the rim of the cup. Markers represent individual teeth (n = 716). (g) Constriction magnitude correlates with the number of teeth with Spearman’s rank correlation coefficient (r) = 0.42 (p = 4.4*10–4) for individual DMSO phagocytic events (left) and between drug treatments (right). (h) Teeth number and features change with phagocytic progression, with, from left to right, r = 0.2 (p = 0.11 n.s.), r = 0.17 (p = 1.0 × 10⁻⁴), r = 0.16 (p = 2.1 × 10⁻⁴). (i) Phagocytic cups with actin teeth appear more frequently when cells are challenged with softer targets. RAW macrophages were challenged with 9 μm DAAMPs of 1.4 or 6.5 kPa, fixed and stained for F-actin. (j) Elasticity theory simulations of the relation between tooth size and depth and overall constriction magnitude. Inset shows teeth, simulated as spherical indenters on a spherical target. Bar graph represents pooled data (n = >150 cups) from three independent experiments. Error bars indicate st.d. estimated by treating phagocytosis as a Bernoulli process. Pooled data was compared using Fisher’s exact test to compare fractions (p = 1.5 × 10⁻²⁴***). All error bars indicate s.e.m. unless otherwise indicated. Raw data are available in Figure 4—source data 1.
-
Figure 4—source data 1
Numeric data for Figure 4d–j, Figure 4—figure supplement 1d–g and Figure 4—figure supplement 2c.
- https://cdn.elifesciences.org/articles/68627/elife-68627-fig4-data1-v2.xlsx
Figure 4—figure supplement 1
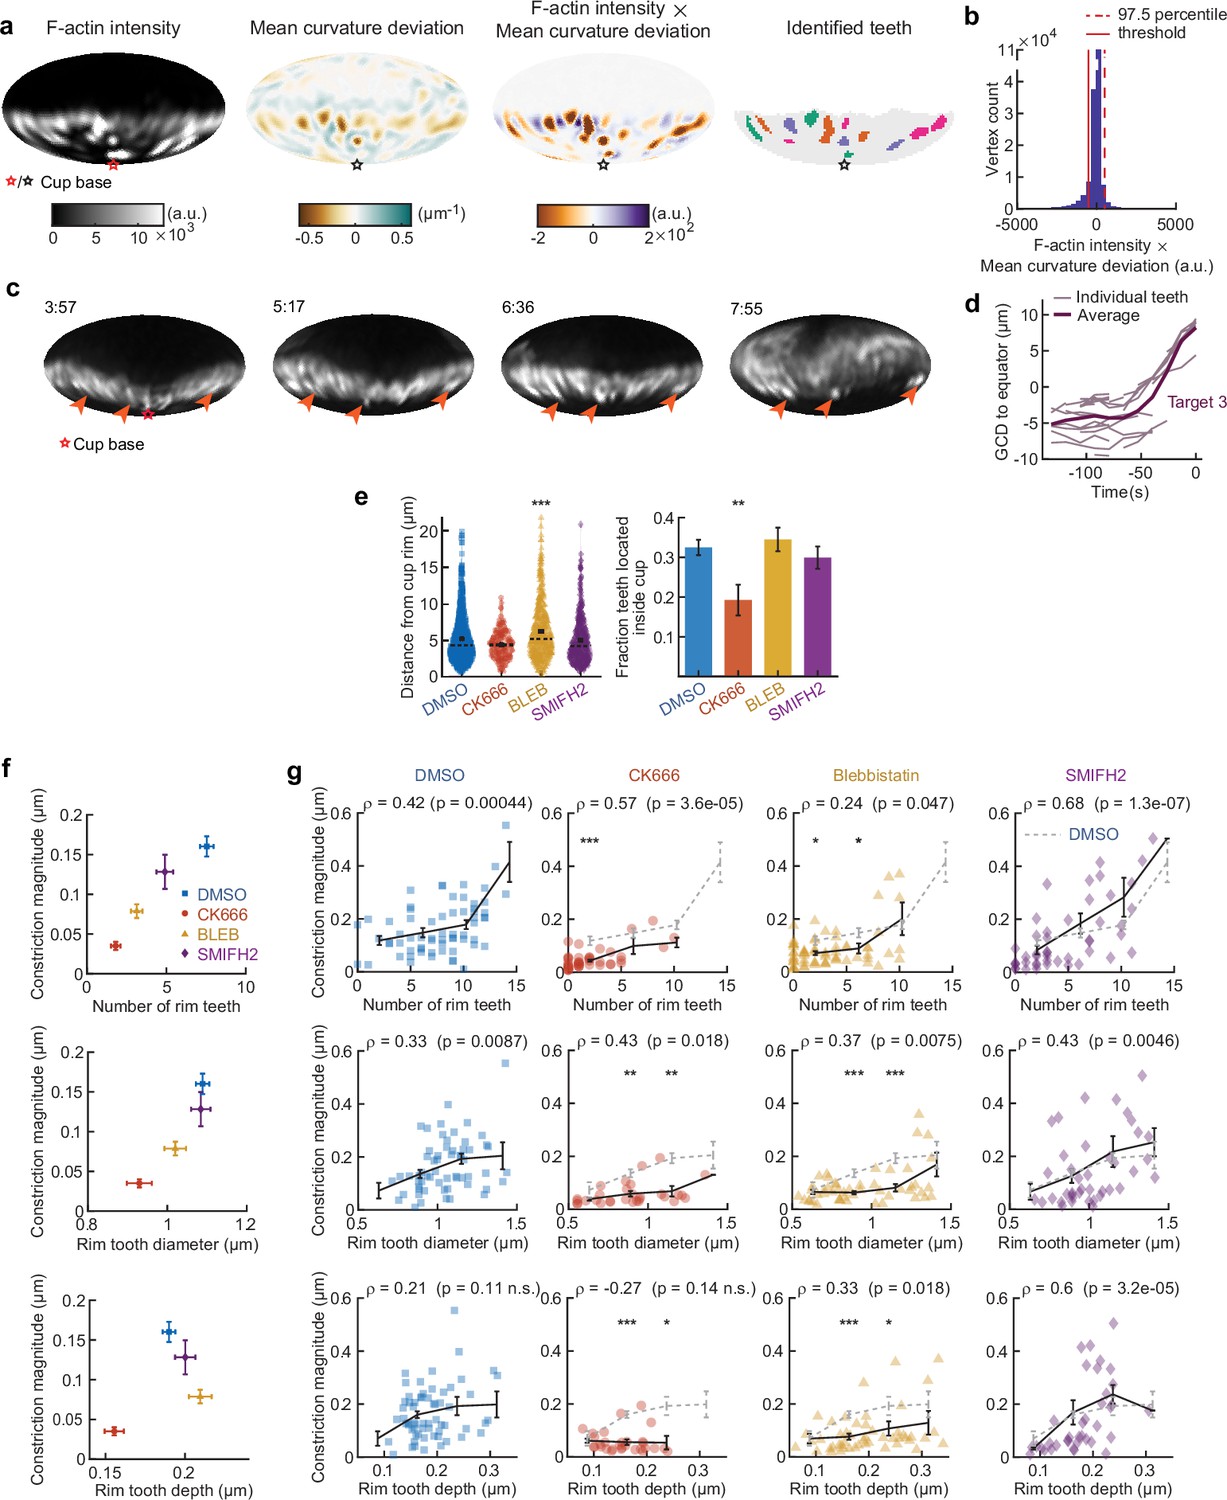
Automated teeth identification reveals how teeth number, size, and indentation correlate with overall target constriction.
(a) Example of teeth identification method. Teeth were defined as areas of high-actin intensity and inward protrusion. For the mean curvature, the average value of mean curvature for edge coordinates (vertices) at similar latitude (with the base of the cup at the south pole) were subtracted to negate any influence of the typical ring of target constriction at the rim of the cup. Then the values of corrected mean curvature deviation and F-actin intensity were multiplied for each vertex. Vertices with values above the threshold were identified as teeth, and a watershed algorithm was used to separate clusters of teeth. Base of the phagocytic cup is at the south pole. (b) Determination of the threshold for tooth identification is based on the product of F-actin intensity and mean curvature deviation. Generally, there is a negative correlation between F-actin intensity and mean curvature (high F-actin concentration is found at regions of indentation). The threshold was set as the negative of the 97.5 percentile value, which represents an estimate of the mean – two standard deviations in the case that F-actin would not have correlated with inward deformation. (c) Time lapse montage (min:s) showing example of stationary F-actin teeth during phagocytosis. F-actin signal reconstructed over the target surface from lattice light-sheet microscopy (LLSM) data. Particle surface is shown using Mollweide projection (Figure 2—figure supplement 1). Four time points of a single phagocytic event are shown. Arrows point at locations of F-actin puncta that can be tracked from an early stage and are still present at the same location in late-stage phagocytosis, when they are far behind the rim of the phagocytic cup. (d) Great circle distance (GCD) of manually tracked teeth to the equator for a third phagocytic event. Data of the other phagocytic events are presented in Figure 4i. (e) Actomyosin activity affects teeth localization. Markers represent individual teeth (n = 716, 138, 377, and 363 from left to right) for all recorded phagocytic events (n = 68, 63, 73, and 55, respectively). Violin plots show individual teeth (colored markers), means (black cross), median (dashed line). Right: fraction of teeth localized in the rim as opposed to deeper in the cup. The threshold for differentiating teeth in the rim from teeth throughout the cup was based on the distribution of teeth distances from the rim in the DMSO condition. Specifically, it was set as the mode of the distribution (see left panel) summed with 2× the 2.5 percentile value of the distribution, which represents an estimate of the mean tooth distance from the cup edge – two standard deviations of the teeth specifically localized in the rim. Fisher’s exact test was used to compare fractions (p = 0.0076**). Error bars indicate st.d. estimated by treating phagocytosis as a Bernoulli process. (f) Number of rim teeth and tooth diameter variation between drug treatment groups correlates with constriction magnitude. (g) Teeth statistics correlate with constriction magnitude within drug treatment groups. Markers indicate individual measurements; black lines indicate averages within five bins. Spearman’s rank correlation coefficient (r) is given above each graph. All statistical tests were two-sided Wilcoxon rank sum test comparing with the DMSO control over the same bin with significance levels: p < 0.05*; p < 0.01**; p < 0.001***. All error bars indicate s.e.m.
Figure 4—figure supplement 2

Indentation simulations of phagocytic teeth allow comparison of teeth number, size, and indentation with and total target constriction.
(a) Parametrization of the model. Ten rigid teeth indent a target around the equator of the particle, with Rteeth the tooth radius, Rtarget the target radius (3.7 μm), d the absolute indentation depth, and a the contact radius. Red arrows indicate direction of simulated forces. (b) Displacement result for d = 0.3 μm, Rtooth = 0.5 μm. (c) Derivation of quantities that are obtained from experimental data from the simulation results. The indentation depth variation is shown along the equator of the particle in blue, for the same parameters as (b). Averaging this profile allows us to find the average constriction depth. The effective tooth depth is then found by subtracting the minimum indentation from the maximum indentation.
Figure 5 with 1 supplement
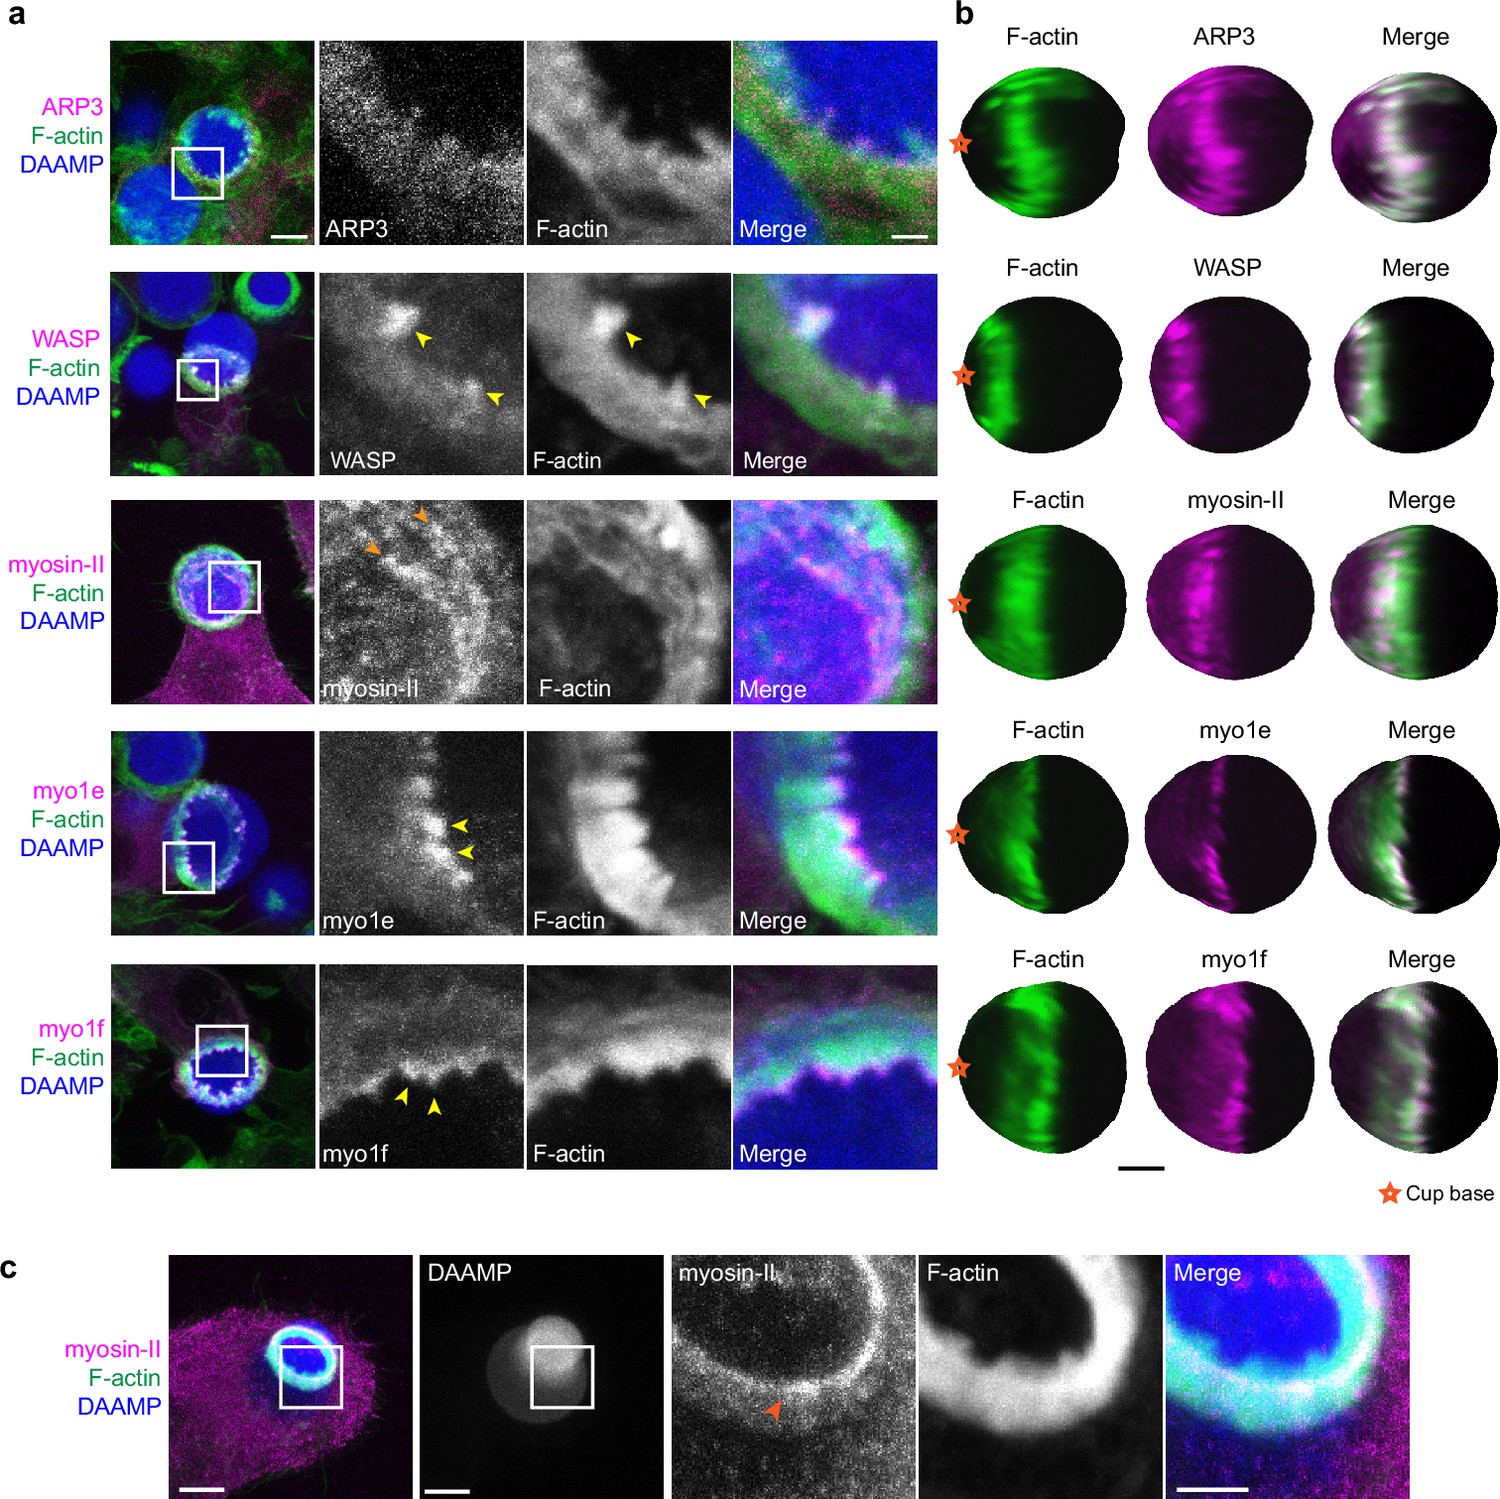
Multiple actin regulatory proteins localize to phagocytic teeth.
(a) RAW macrophages were transfected with fluorescently tagged actin-binding proteins and challenged to ingest deformable acrylamide-co-acrylic acid-microparticles (DAAMPs) (11 μm, 1.4 kPa) functionalized with IgG and AF647-Cadaverine to assess localization to actin teeth (yellow arrowheads). Images are maximum intensity projections of confocal z-stacks. White boxes in leftmost panels indicate the site of the zoomed images to the right. Scale bar, 5 μm. Zoom scale bar, 1 μm. (b) DAAM-particle reconstructions for examples shown in (a) showing target deformations and localization of fluorescent proteins with respect to actin teeth. Scale bar, 3 μm. (c) Myosin-II condensing into thick concentric rings (marked by orange arrowheads) during late-stage phagocytosis of a highly deformed target. Images are maximum intensity projections of confocal z-stacks. Scale bar, 5 μm. Zoom scale bar, 1 μm. Raw images are available on a FigShare repository (Barger et al., 2021b).
Figure 5—figure supplement 1
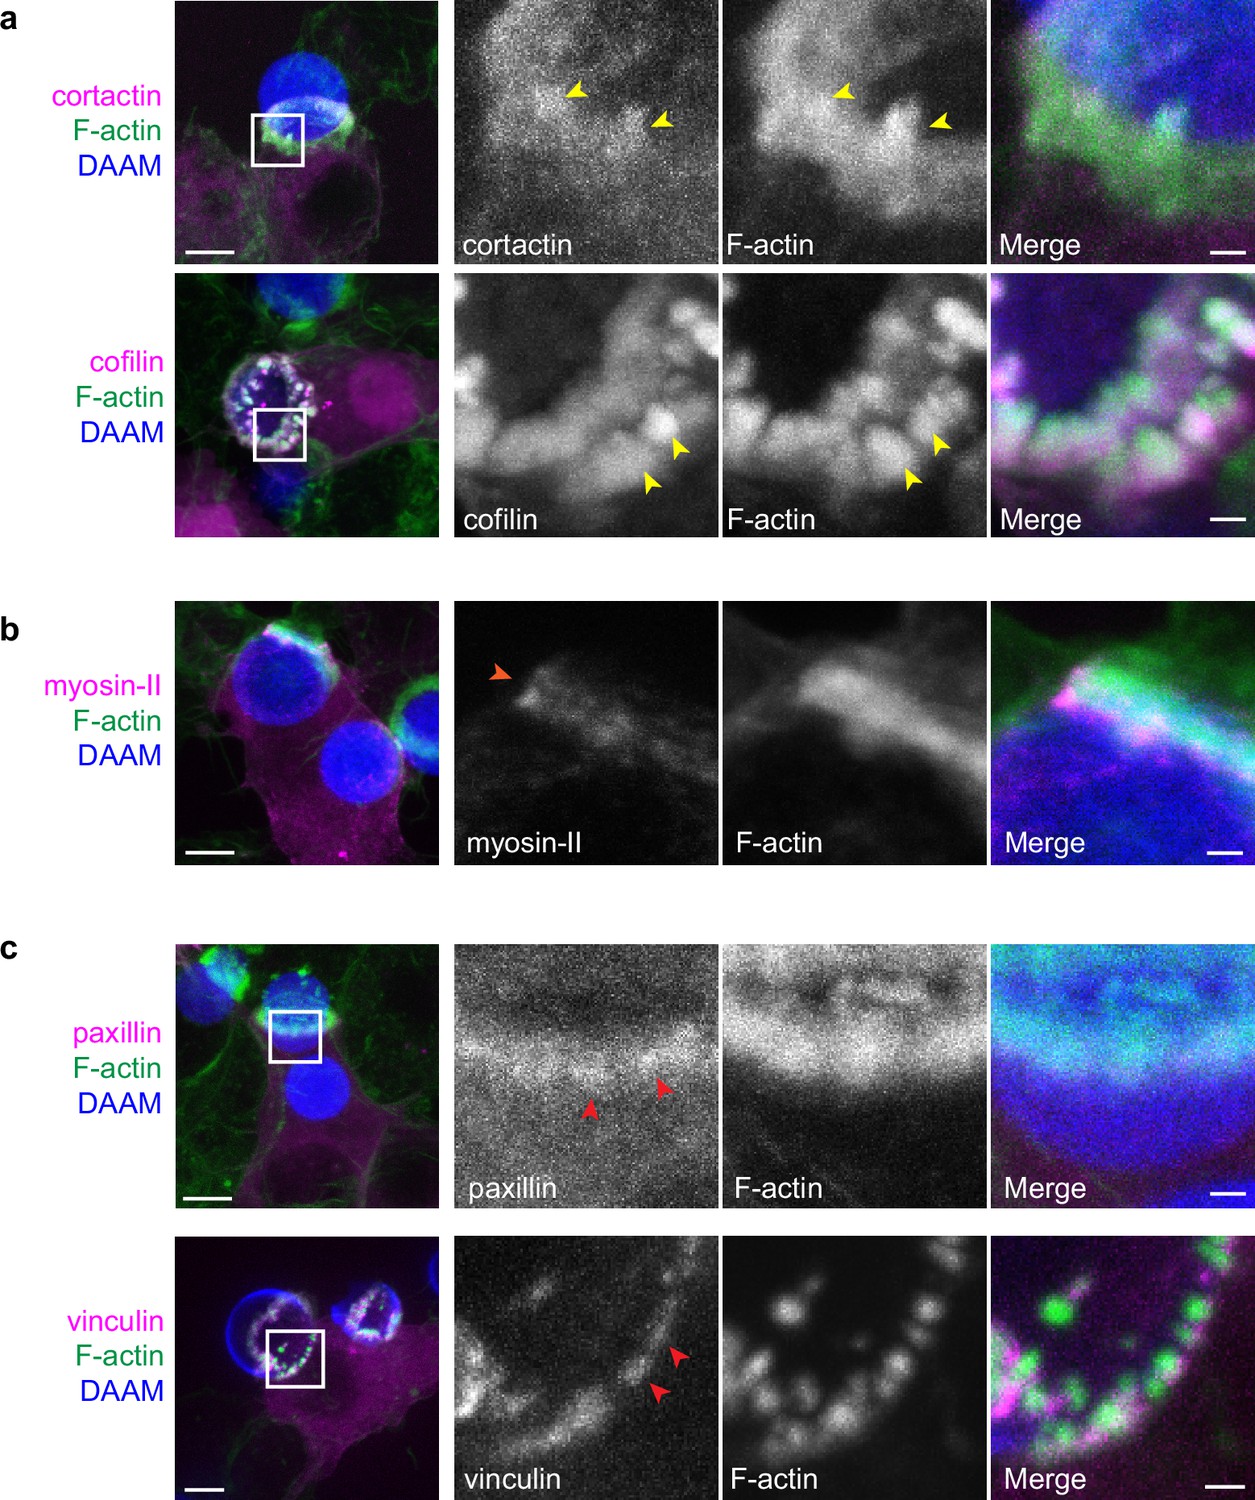
Multiple actin-binding proteins localize to phagocytic teeth.
RAW macrophages were transfected with fluorescently tagged actin binding proteins and challenged to ingest deformable acrylamide-co-acrylic acid-micro (DAAM)-particles (11 μm, 1.4 kPa) functionalized with IgG and AF647-Cadaverine. (a) Actin-binding proteins, cortactin, and cofilin localize to phagocytic teeth (yellow arrowheads) during DAAM-particle internalization. (b) Myosin-II forming concentric rings (orange arrowhead) during late-stage phagocytosis. (c) Adaptor proteins, vinculin and paxillin, localize at the base of phagocytic teeth in a punctate pattern (red arrowheads). DAAMPs are 9 μm, 1 kPa. Images are maximum intensity projections of confocal z-stacks. Scale bar, 5 μm. Zoom scale bar, 1 μm.
Figure 6 with 1 supplement

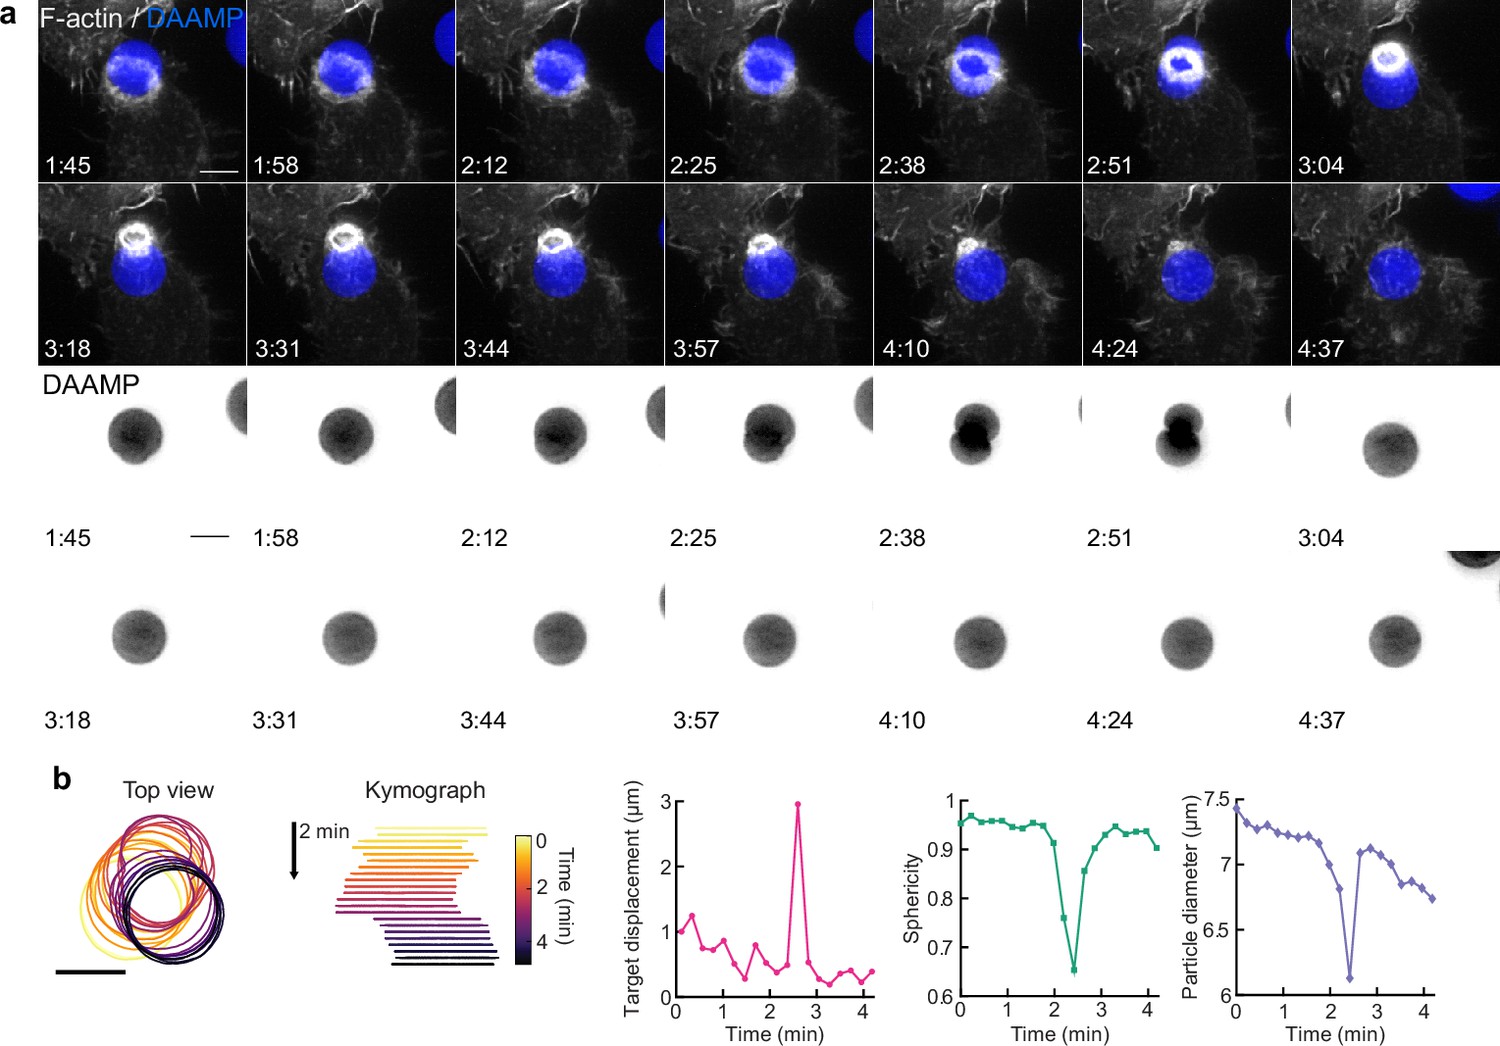
Contractile activity may enable resolving conflicts by partial target eating and a popping release mechanism.
(a) Maximum intensity projections (MIP) of lattice light-sheet microscopy (LLSM) stacks showing failed internalization attempt of RAW macrophage with IgG-functionalized 1.4 kPa deformable acrylamide-co-acrylic acid-microparticle (DAAMP). Zoomed images of the area marked by the white box showing only the DAAMP channel (inverse grayscale LUT) are shown below. (b) 3D reconstructions showing both the particle shape and F-actin signal over the particle surface corresponding to the event in (a). Scale bar, 3 μm. (c) Maximum intensity projections (MIP) of LLSM stacks showing myosin-II accumulation (orange arrows) during a partial eating event. RAW macrophages (marked by *) were transfected with EGFP-NMMIIA (non-muscle myosin-IIa) to label myosin-II and challenged with IgG-functionalized 1.4 kPa DAAMP. (d) Top: MIPs of LLSM stacks of RAW macrophage suddenly releasing heavily deformed target. Red dashed line outlines DAAMP. Middle: particle position and outline (left), and kymograph of particle position (right). Bottom: particle displacement, sphericity, and apparent diameter over time of the same event shows the sudden nature of the release. (e) Sudden forfeit by a popping mechanism and attempted partial eating are common for 1.4 kPa targets, with ~24% and ~ 14% occurrence of all phagocytic events, respectively. (f) Percentage of failed phagocytic events is dependent on particle rigidity. Data from two to three independent experiments was pooled (n = 89, 91 phagocytic events) and compared using Fisher’s exact test (p = 7.4 × 10⁻⁴). (g) Schematic representation of the multiple ways in which target constriction may enable resolving macrophage conflicts in which two cells attempt a single target. All scale bars are 5 μm, unless otherwise indicated. All error bars indicate s.d. estimated by treating phagocytosis as a Bernoulli process. Raw data are available in Figure 6—source data 1.
-
Figure 6—source data 1
Numeric data for Figure 6d–f and Figure 6—figure supplement 1b.
- https://cdn.elifesciences.org/articles/68627/elife-68627-fig6-data1-v2.xlsx
Figure 6—figure supplement 1
Target squeezing can result in the target popping into the phagocytic cup.
(a) Top, maximum intensity projections (MIP) of lattice light-sheet microscopy (LLSM) time lapse (min:s) showing successful internalization attempt of RAW macrophage with IgG-functionalized 1.4 kPa deformable acrylamide-co-acrylic acid-micro (DAAM)-particle, showing strong deformation and a sudden internalization step. Bottom: DAAM-particle-only channel (inverted grayscale). (b) Left: particle position and outline with color-coded kymograph of particle position. Right: particle displacement, sphericity, and apparent diameter over time of the same event shows the sudden nature of the internalization. Scale bars, 5 μm.
Figure 7
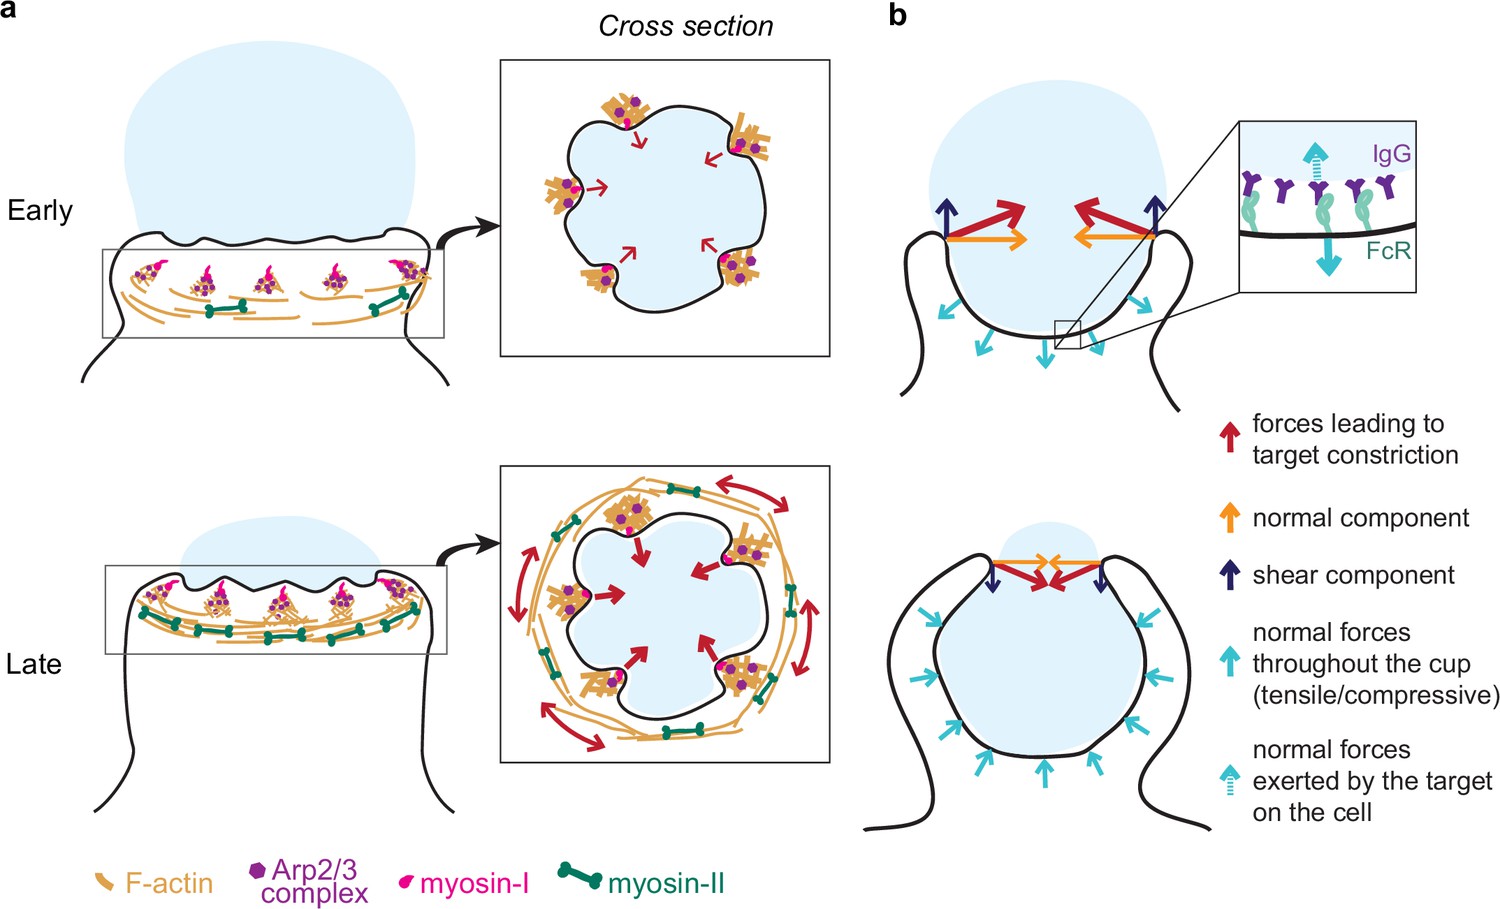
Model of the molecular players and force balance during phagocytosis.
(a) Graphical model: Arp2/3-mediated actin teeth, guided by myosin-I motors, and organized in a ring drive phagocytic progression and inward target deformation. Teeth are potentially interconnected through myosin-II filaments located behind the actin teeth. (b) Ring-like target constriction by protrusive actin teeth and myosin-II activity (red arrows) can be decomposed in forces orthogonal to the phagocytic axis, which are balanced within the ring (yellow arrows) and along the phagocytic axis, which result in a net force exerted by the ring (purple arrows). The local target geometry at the protruding rim of the cup determines the direction of the net force. Before 50% engulfment, this force points outward and is balanced by pulling forces throughout the base of the phagocytic cup (push and lock). Inset, the pulling forces from the cell (dashed arrow) on the target and paired forces from the target on the cell (solid arrow) likely put the receptor-ligand interactions under tension. After 50% engulfment, the net ring force points inward, and is balanced by compressive forces (cyan arrows) throughout the phagocytic cup.
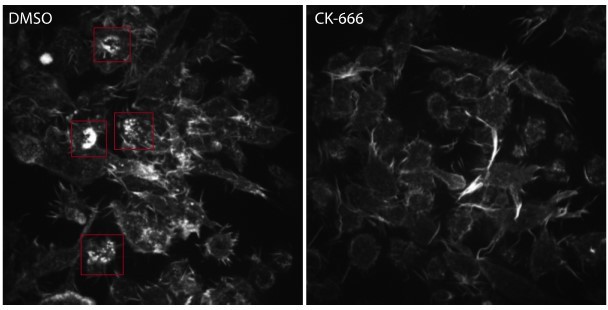
Author response image 1
Videos
Video 1
RAW macrophage ingesting deformable acrylamide-co-acrylic acid-microparticle (DAAMP) imaged by lattice light-sheet microscopy.
RAW macrophages transfected with mEmerald-Lifeact (gray) were fed DAAM-particles (9 μm,1.4 kPa) (blue) functionalized with AF647-Cadaverine, BSA, and anti-BSA IgG. Maximum intensity projections in xy (left) and xz (right). Lower left time stamp: min:s. Scale bar, 5 μm.
Video 2
3D microparticle shape reconstruction shows phagocytic force-induced deformations in real time.
Base, side, and front views of reconstructed deformable acrylamide-co-acrylic acid-microparticle (DAAMP) internalized in Figure 1, Video 1 showing target deformations (above) and F-actin localization on particle surface (below). Color scales for radial deviation and F-actin intensity shown on right. Upper right time stamp: min:s. Scale bar, 3 μm.
Video 3
RAW macrophage ingesting stiffer deformable acrylamide-co-acrylic acid-microparticle (DAAMP) shows similar phagocytic force-induced deformation patterns by lattice light-sheet microscopy.
Maximum intensity projection of RAW macrophage transfected with mEmerald-Lifeact (gray) ingesting DAAM-particles (9 μm, 6.5 kPa) (blue) functionalized with AF647-Cadaverine, BSA, and anti-BSA IgG. Lower left time stamp: min:s. Scale bar, 5 μm.
Video 4
Deformable acrylamide-co-acrylic acid-microparticle (DAAMP) phagosome briefly accumulates F-actin, imaged by lattice light-sheet microscopy.
Maximum intensity projection of RAW macrophage transfected with mEmerald-Lifeact (gray) ingesting DAAM-particles (9 μm, 6.5 kPa) (blue) functionalized with AF647-Cadaverine, BSA, and anti-BSA IgG. Lower left time stamp: min:s. Scale bar, 5 μm.
Video 5
Failed deformable acrylamide-co-acrylic acid-microparticle (DAAMP) phagocytosis imaged by lattice light-sheet microscopy.
Maximum intensity projections of RAW macrophages transfected with mEmerald-Lifeact (gray) challenged with DAAM-particles (9 μm,1.4 kPa) (blue). Merged images (left) with single DAAMP channel in gray (right) to highlight target deformations. Time stamp: min:s. Scale bar, 5 μm.
Video 6
Primary bone marrow-derived macrophage (BMDM) partakes in deformable acrylamide-co-acrylic acid-microparticle (DAAMP) meal sharing imaged by lattice light-sheet microscopy.
Murine BMDMs transfected with mEmerald-Lifeact (gray) were fed DAAM-particles (11 μm,1.4 kPa) (blue) functionalized with TRITC-Cadaverine, BSA, and anti-BSA IgG. Merged maximum intensity projections (left) with single DAAMP channel in gray (right) to highlight target deformation. Transfected macrophage attempts to bite DAAMP in half with second untransfected macrophage on the other end, whose presence is implicated by local deformations on the side of the particle not in contact with the transfected cell. Time stamp: min:s. Scale bar, 5 μm.
Video 7
Contractile activity involved in phagocytic conflict marked by myosin-II.
Maximum intensity projections of RAW macrophages transfected with EGFP-NMMIIA (non-muscle myosin-IIa) (gray) challenged with deformable acrylamide-co-acrylic acid-micro (DAAM)-particles (9 μm,1.4 kPa) (blue). Time stamp: min:s. Scale bar, 5 μm.
Video 8
Contractile activity leads to sudden forfeit of phagocytic target.
Lattice light-sheet microscopy (LLSM) maximum intensity projections of RAW macrophage expressing mEmerald-Lifeact (gray) challenged with deformable acrylamide-co-acrylic acid-micro (DAAM)-particles (DAAMPs) (9 μm,1.4 kPa) (blue). Transfected cell attempts to internalize second DAAMP target leading to meal sharing event with second, untransfected cell. Dramatic biting of the DAAMP in two leads to the sudden forfeit of the phagocytic target. Merged images (left) with single DAAMP channel in gray (right) to highlight target deformations. Time stamp: min:s. Scale bar, 5 μm.
Video 9
Contractile activity leads to sudden completion of phagocytic internalization.
Lattice light-sheet microscopy (LLSM) maximum intensity projections of RAW macrophage expressing mEmerald-Lifeact (gray) ingesting deformable acrylamide-co-acrylic acid-micro (DAAM)-particles (DAAMPs) (9 μm,1.4 kPa) (blue). Contractile activity on the DAAMP leads to sudden ‘popping’ of target toward the cell to complete ingestion. Concentrated F-actin ring appears to lag behind this event. Merged images (left) with single DAAMP channel in gray (right) to highlight target displacement. Time stamp: min:s. Scale bar, 5 μm.
Tables
Key resources table
| Reagent type (species) or resource | Designation | Source or reference | Identifiers | Additional information |
|---|---|---|---|---|
| Cell line (Mus musculus) | RAW264.7 | ATCC | TIB-71RRID:CVCL_0493 | Macrophage-like cell line |
| Cell line (Homo sapiens) | HL-60 | ATCC | CCL-240RRID:CVCL_0002 | Differentiated into neutrophil-like cells |
| Biological sample (mouse) | Primary bone marrow cells | Barger et al., 2019 | ||
| Antibody | Goat polyclonal anti-rabbit-Alexa Fluor-405 | Invitrogen | A31556RRID:AB_221605 | (1:400) |
| Antibody | Rabbit polyclonal anti-mouse BSA | MP Bio | 0865111RRID: AB_2335061 | (3 mg/mL) |
| Recombinant DNA reagent | EGFP-myo1e (plasmid) | Krendel et al., 2007 | Plasmid construct to transfect and examine myo1e localization | |
| Recombinant DNA reagent | EGFP-myo1f (plasmid) | Barger et al., 2019 | Plasmid construct to transfect and examine myo1f localization | |
| Recombinant DNA reagent | mEmerald-Lifeact (plasmid) | Addgene (a gift from Michael Davidson) | #54148 | Plasmid construct to transfect and monitor F-actin dynamics |
| Recombinant DNA reagent | EGFP-RLC (plasmid) | Plasmid construct to transfect and examine myosin-II localization | ||
| Recombinant DNA reagent | pUB-Halo-WASP (plasmid) | This paper | Plasmid construct to transfect and examine WASP localization | |
| Recombinant DNA reagent | CMV-GFP-NMHCII-A (plasmid) | Addgene | #11347 | Plasmid construct to transfect and examine myosin-II localization |
| Recombinant DNA reagent | EGFP-ARP3 (plasmid) | This paper | Plasmid construct to transfect and examine Arp2/3 complex localization | |
| Recombinant DNA reagent | mEmerald-cortactin (plasmid) | This paper | Plasmid construct to transfect and examine cortactin localization | |
| Recombinant DNA reagent | Cofilin-EGFP(plasmid) | Addgene | #50859 | Plasmid construct to transfect and examine cofilin localization |
| Recombinant DNA reagent | mScarlet-i-paxillin(plasmid) | This paper | Plasmid construct to transfect and examine paxillin localization | |
| Recombinant DNA reagent | pUB-mEmerald-vinculin(plasmid) | This paper | Plasmid construct to transfect and examine vinculin localization | |
| Peptide, recombinant protein | BSA | Sigma | A3059 | 20 mg/mL |
| Peptide, recombinant protein | Alexa Fluor-488 conjugated phalloidin | Life Technologies | A12379 | 1:300 |
| Peptide, recombinant protein | Alexa Fluor-568 conjugated phalloidin | Life Technologies | A12380 | 1:300 |
| Peptide, recombinant protein | Alexa Fluor-488 Cadaverine | Thermo Fisher Scientific | A30679 | 0.2 mM final concentration |
| Peptide, recombinant protein | Alexa Fluor-647 Cadaverine | Thermo Fisher Scientific | A30676 | 0.2 mM final concentration |
| Commercial assay or kit | Neon Transfection System 100 µL Kit | Thermo Fisher Scientific | MPK10096 | |
| Chemical compound, drug | CK666 | EMD Millipore | SML0006 | 150 μM |
| Chemical compound, drug | SMIFH2 | EMD Millipore | S4826 | 10 μM |
| Chemical compound, drug | Blebbistatin | EMD Millipore | B0560 | 15 μM |
| Chemical compound, drug | DAAM-particles | Vorselen et al., 2020b | Can be obtained by contacting Julie A Theriot | |
| Software, algorithm | Fiji (ImageJ) | NIH | RRID:SCR_002285 | |
| Software, algorithm | Imaris | Bitplane | RRID:SCR_007370 | |
| Software, algorithm | MATLAB | Mathworks | RRID:SCR_001622 | |
| Software, algorithm | Python | Python Software foundation | RRID:SCR_008394 | |
| Software, algorithm | Custom MATLAB code | Other | https://gitlab.com/dvorselen/DAAMparticle_Shape_Analysis | |
| Software, algorithm | Custom Python code | Other | https://gitlab.com/micronano_public/ShElastic | |
| Other | VECTASHIELD Antifade Mounting Medium | Vector Laboratories | H-1000 |
Additional files
Download links
A two-part list of links to download the article, or parts of the article, in various formats.
Downloads (link to download the article as PDF)
Open citations (links to open the citations from this article in various online reference manager services)
Cite this article (links to download the citations from this article in formats compatible with various reference manager tools)
Phagocytic ‘teeth’ and myosin-II ‘jaw’ power target constriction during phagocytosis
eLife 10:e68627.
https://doi.org/10.7554/eLife.68627


