Pupal behavior emerges from unstructured muscle activity in response to neuromodulation in Drosophila
- National Institute of Mental Health, National Institutes of Health, United States
- National Institute of Biomedical Imaging and Bioengineering, National Institutes of Health, United States
- National Institute of Diabetes and Digestive and Kidney Diseases, National Institutes of Health, United States
Figures
Figure 1

Pupal ecdysis behavior and muscle anatomy.
(A) Timeline of metamorphosis from puparium formation (PF at 0 hr) to eclosion (~100 hr) with the time of pupal ecdysis (arrow) indicated. Other significant events in pupal development include two major periods of tissue histolysis prior to and following pupal ecdysis as well as the times of larval-to-pupal and pupal-to-adult apolysis when separation from the cuticle of the previous developmental stage occurs. L3: third larval instar; APF: after puparium formation. (B) Timeline of pupal ecdysis with phases indicated. Arrows indicate times of hormone release. T = 0, onset of P1. (C) Schematics show puparium (brown) and pupa (beige) from dorsal view. Arrows indicate directionality of body wall movements for each phase. (D) Pupal muscles of hemisegment (HS) A3 stained with phalloidin (gray) and for postsynaptic marker DLG1 (cyan). Scale bar, 25 μm. (E) Pupal and larval musculature stained with phalloidin (gray) showing left HSA1–A7 (A3, boxed). Scale bar, 250 μm. (F) Larval muscles in a representative HS (e.g., dotted box in (E), right; based on six fillets). Outlined muscles degrade before pupal ecdysis. Muscles are labeled and coded blue (ventral), green (lateral), and fuchsia (dorsal). (G) Pupal muscles in a representative HS (e.g., dotted box in E, left; based on 17 fillets). Dotted lines indicate those present only in anterior segments. Colors as in (F). See also Video 1.
Figure 2 with 2 supplements
Pupal ecdysis muscle activity.
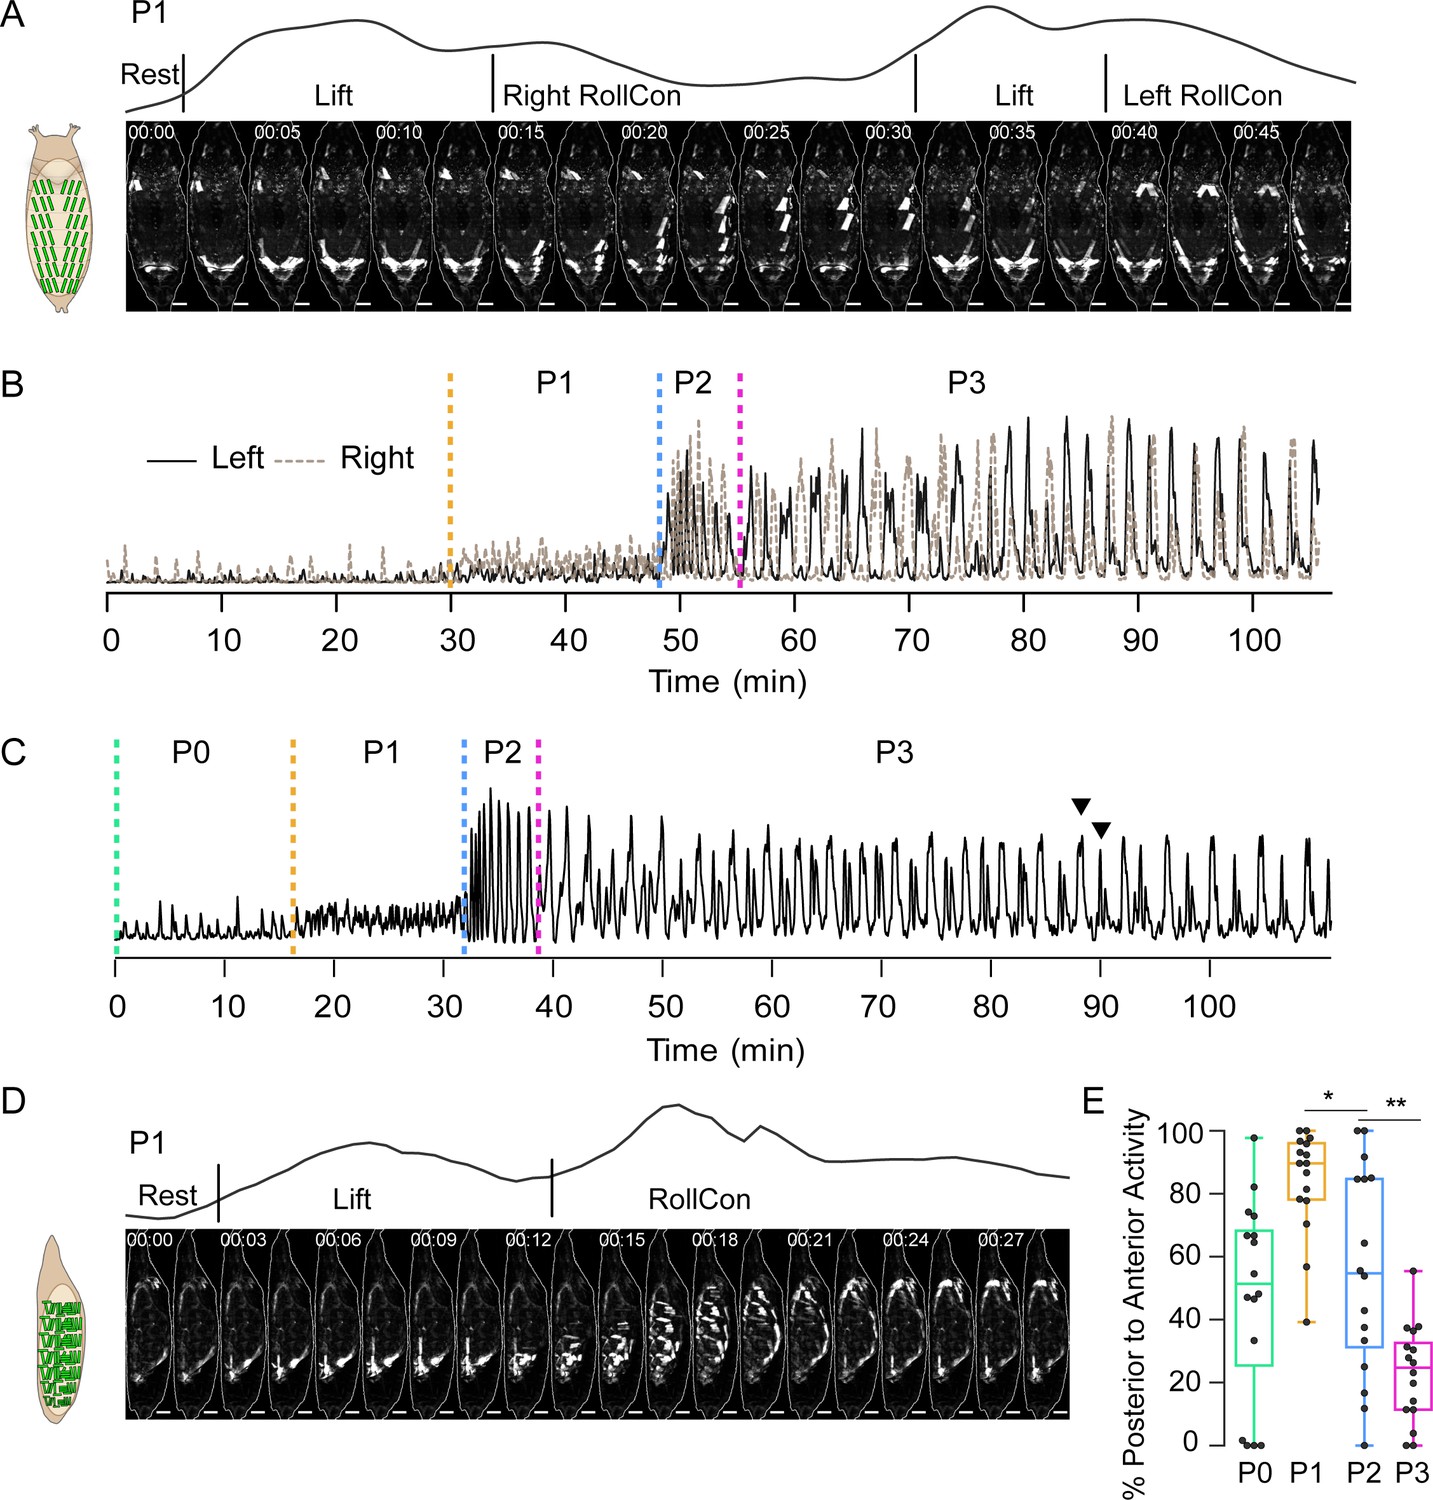
(A) Muscle activity in a P1 bout (dorsal view) from a pupa expressing hlk>GCaMP6s. Schematic on left shows dorsal muscle anatomy. Trace above images shows bulk Ca++ activity signal with movements (see Table 1). Times in min:s format. Scale bar, 250 μm. T = 0, bout onset. (B) Time traces of bulk Ca++ activity on the left (black) and right (brown dotted) sides of a pupa executing the pupal ecdysis sequence and imaged from the dorsal side, as in (A). Alternating activity is evident. Dotted lines: onset of ecdysis phases. T = 0, imaging onset. (C) Time trace of bulk Ca++ activity from a pupa imaged from the lateral side. Dotted lines, onset of ecdysis phases. Arrowheads, peak-double peak bouts of late P3. T = 0, imaging onset. (D) Muscle activity in a P1 bout (lateral view) from a pupa expressing hlk>GCaMP6s. Times in min:s format. Schematic on left shows lateral muscle anatomy. Trace above images shows bulk Ca++ activity signal with movements (see Table 1). Scale bar, 250 μm. T = 0, bout onset. (E) Bouts in each phase (%) with P-to-A activity, such as shown in (D). N = 16 pupae. *p<0.05; **p<0.01. See also Figure 2—figure supplement 1, Table 1, and Videos 2 and 3 Data presented in this and other figures are available on Figshare DOI: https://doi.org/10.6084/m9.figshare.c.5489637.v1.
Figure 2—figure supplement 1
Workflow for muscle imaging.
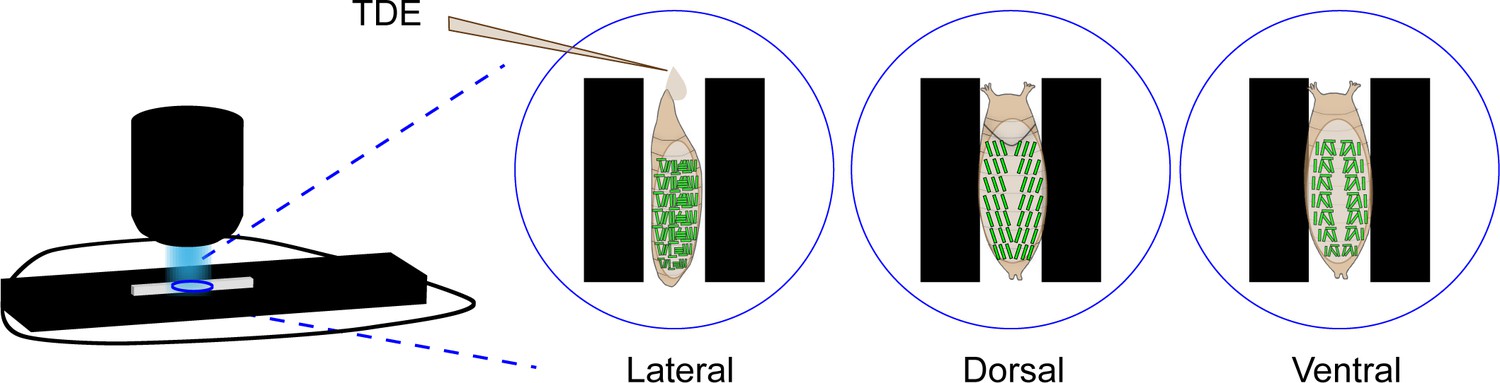
Schematic of imaging workflow for single-muscle resolution data collection. Epi-illuminated stereomicroscope on the left was used to image coverslips containing TDE-filled chambers and animals oriented as shown enlarged on the right for live imaging (sampling rate 2 Hz).
Figure 2—figure supplement 2
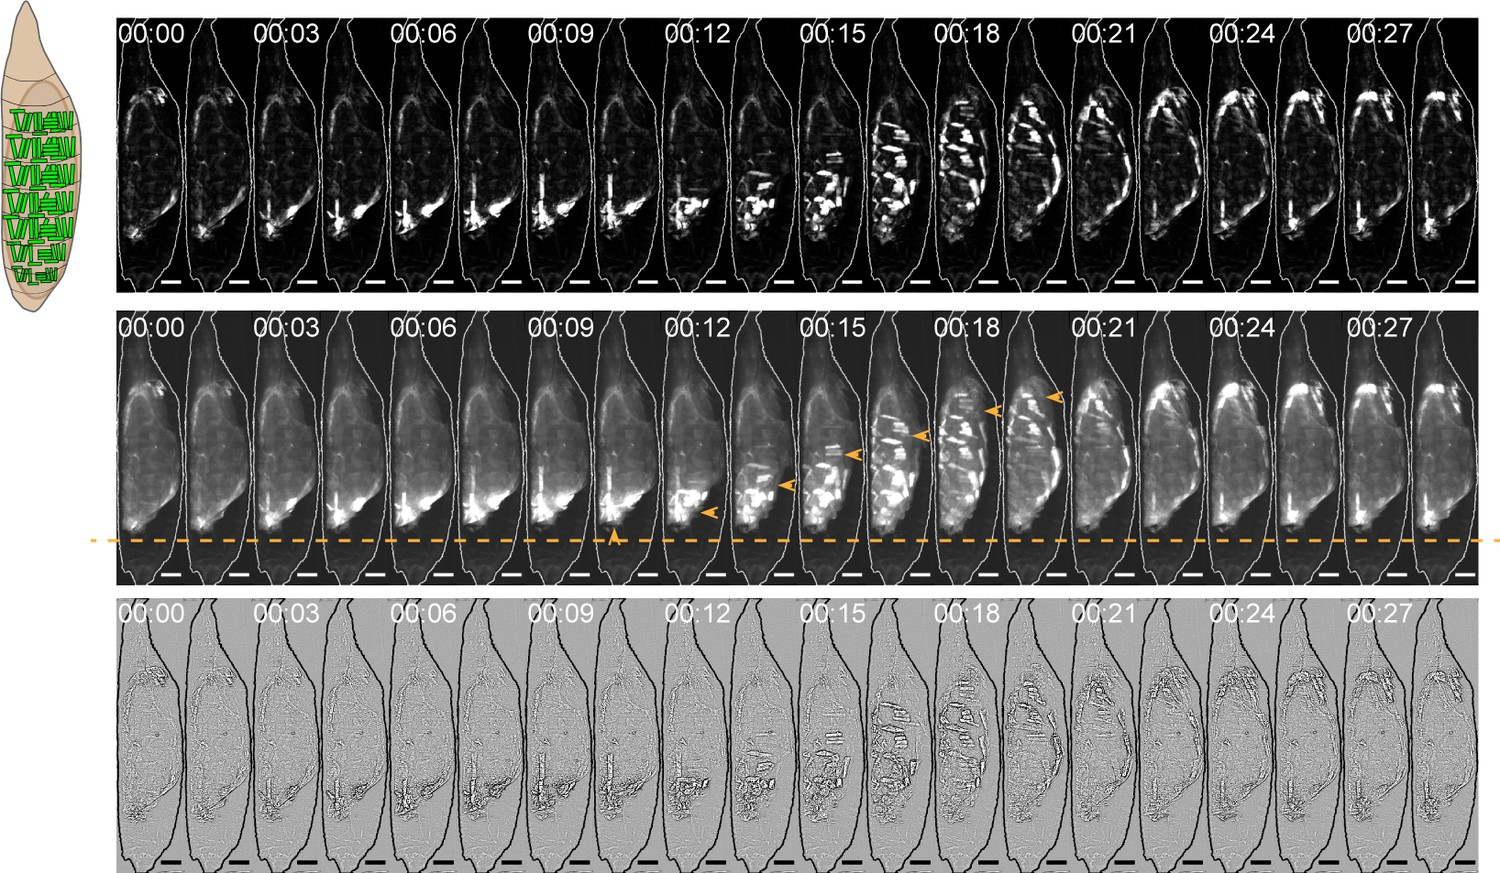
Image analysis for muscle activity and body wall movements.
On left, schematic of hlk>GCaMP6s pupa (muscles in green) from the lateral view. On right, three representations of an image montage from a P1 activity bout taken from the lateral view: (top) background-subtracted and scaled to show muscle activation; (middle) not background-subtracted to show abdominal body wall deflections (orange arrowheads) via autofluorescence; and (bottom) Laplacian transformed to enhance body wall deflections. Orange line, posterior limit of body. T=0, bout onset. Scale bars, 250 μm.
Figure 3 with 2 supplements
Stochastic muscle activity precedes the ecdysis sequence.
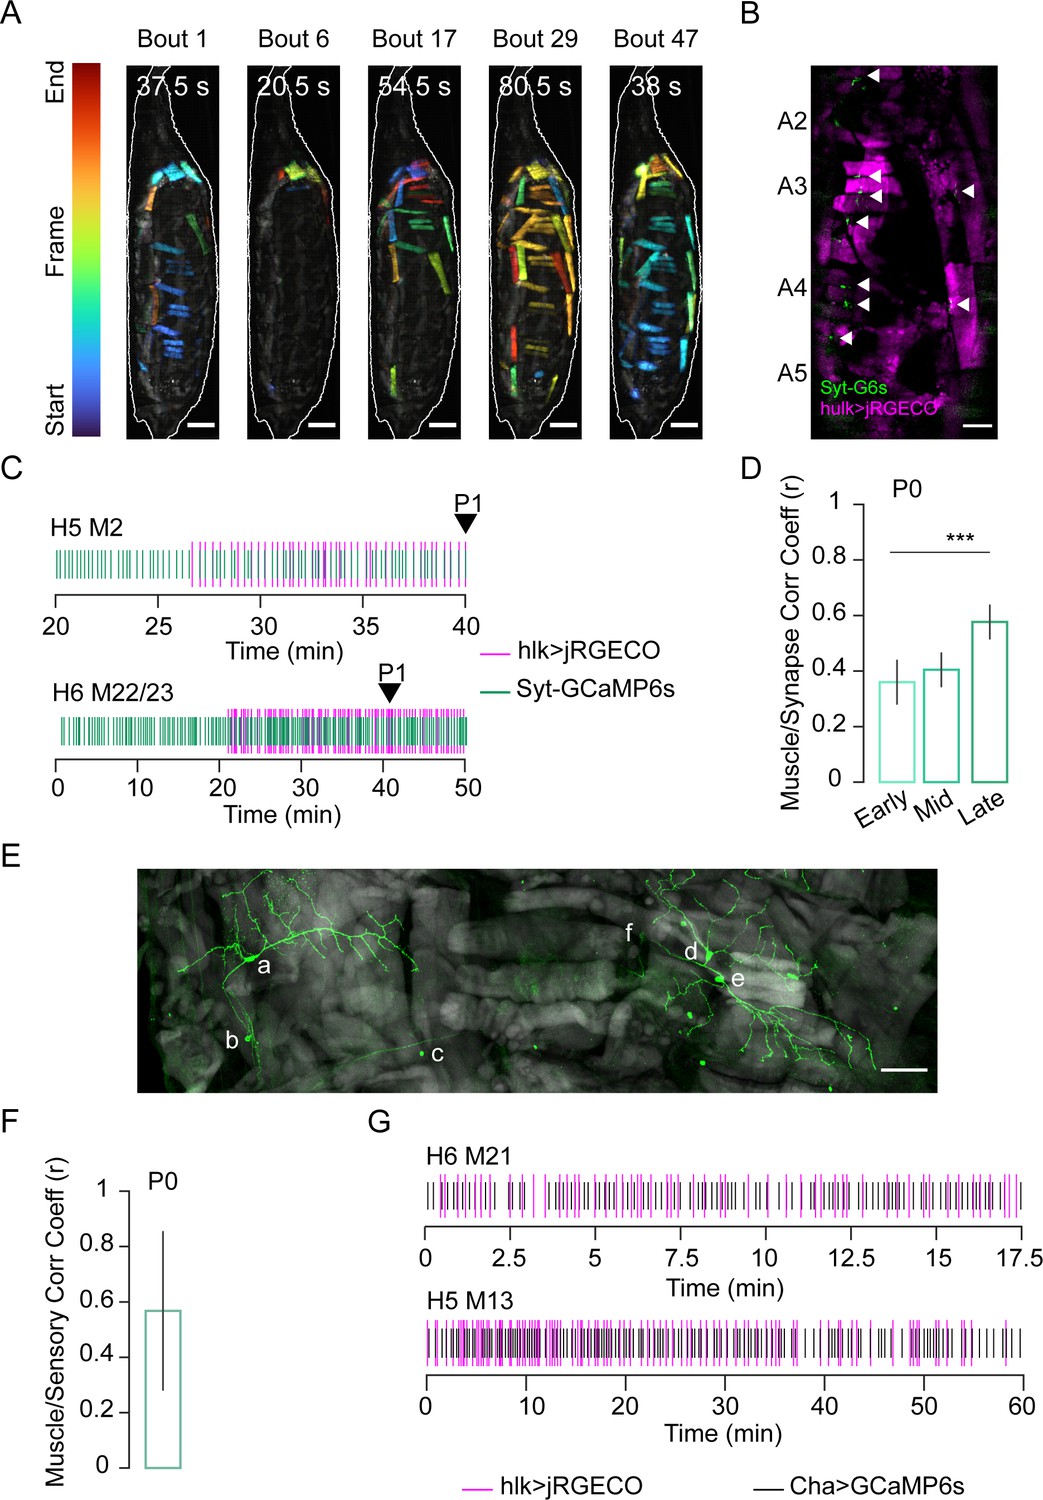
(A) Time-coded projections of muscle Ca++ activity (lateral view) in five P0 bouts. Muscle activity is distinct for each bout. Bout durations as indicated; image frames were color-coded according to color scale (left). Scale bar, 250 μm. (B) Muscle (magenta; hlk>jRGECO) and neuromuscular junction (NMJ, green; VGlut>Syt-GCaMP6s) activity in body wall hemisegments (HS) A2–A5. Arrows, active NMJs. Scale bar, 200 μm. (C) Representative raster plots generated from peaks in hlk>jRGECO (magenta) and VGlut>Syt-GCaMP6s (green) activity for the indicated muscles and their respective NMJs. Arrow, P1 onset. T = 0, imaging onset. (D) Pearson correlation coefficients for VGlut>Syt-GCaMP6s and hlk>jRGECO activity peaks in multiple muscle/NMJ pairs during early, mid, and late temporal bins, relative to P1 onset. Early P0, N = 19 muscles; mid P0, N = 89; late P0, N = 35. ***p≤0.001. (E) HS A3 from pupa expressing mCD8-GFP (green) in class I dendritic arbor (da) neurons using the 410-Gal4 driver (Vaadia et al., 2019). Phalloidin-stained muscles (gray). Neuronal somata: a: vpda, b: vbd, c: dbd, d: ddaD, e: ddaE, f: dmd1. Scale bar, 50 μm. (F) Pearson correlation coefficient for bulk Ca++ activity peaks in muscles labeled with hlk>jRGECO and sensory neurons labeled with ChaT>GCaMP6s. N = 10 pupae. (G) Rasters compare Ca++ activity peaks of the indicated muscle (magenta; hlk>jRGECO) with those in an adjacent sensory neuron (black; ChaT-GCaMP6s) during P0. T = 0, imaging onset. See also Figure 3—figure supplements 1 and 2 and Video 4.
Figure 3—figure supplement 1
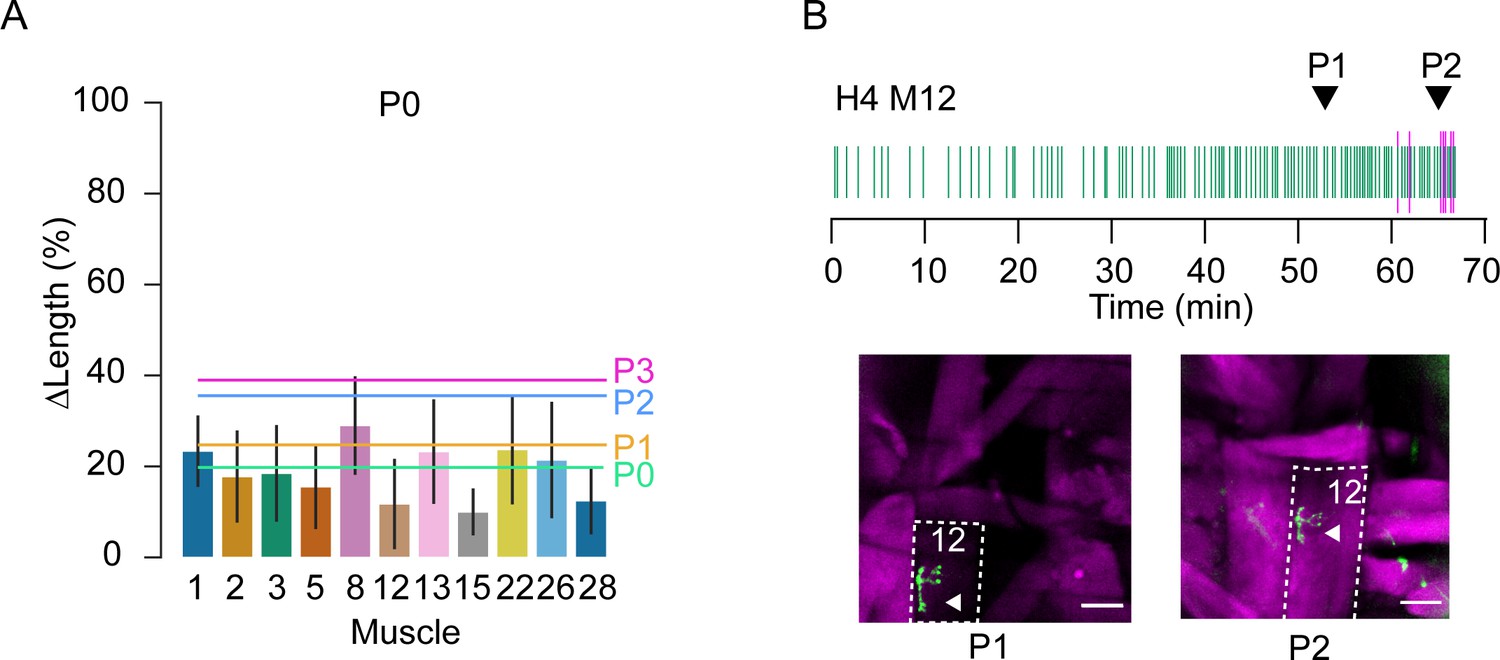
Muscle length changes in P0 and M12 responsiveness.
(A) Bar plots with percent change in length (ΔL/L) plotted as mean ± SD for muscles measured during P0. Colored lines represent mean length changes of all muscles for each phase (green, P0; orange, P1; blue, P2; pink, P3). N = 11 muscles, three hemisegments, eight animals. (B) Raster plot of peaks in muscle M12 Ca++ activity (magenta) measured with hlk>jRGECO and M12 neuromuscular junction (NMJ) activity (green) measured with Syt-GCaMP6s during P0, P1, and P2, as indicated. Coincidence in NMJ and muscle activity begins near the onset of P2. Images of M12 (outlined) in hemisegment 4 showing that during P1 (left), M12 muscle activity (magenta) is low in response to NMJ activation (arrowhead, green), whereas in P2 (right) activity is high. Scale bars, 50 μm. T = 0, imaging onset.
Figure 3—figure supplement 2
Effects of proprioceptor suppression on muscle Ca++.
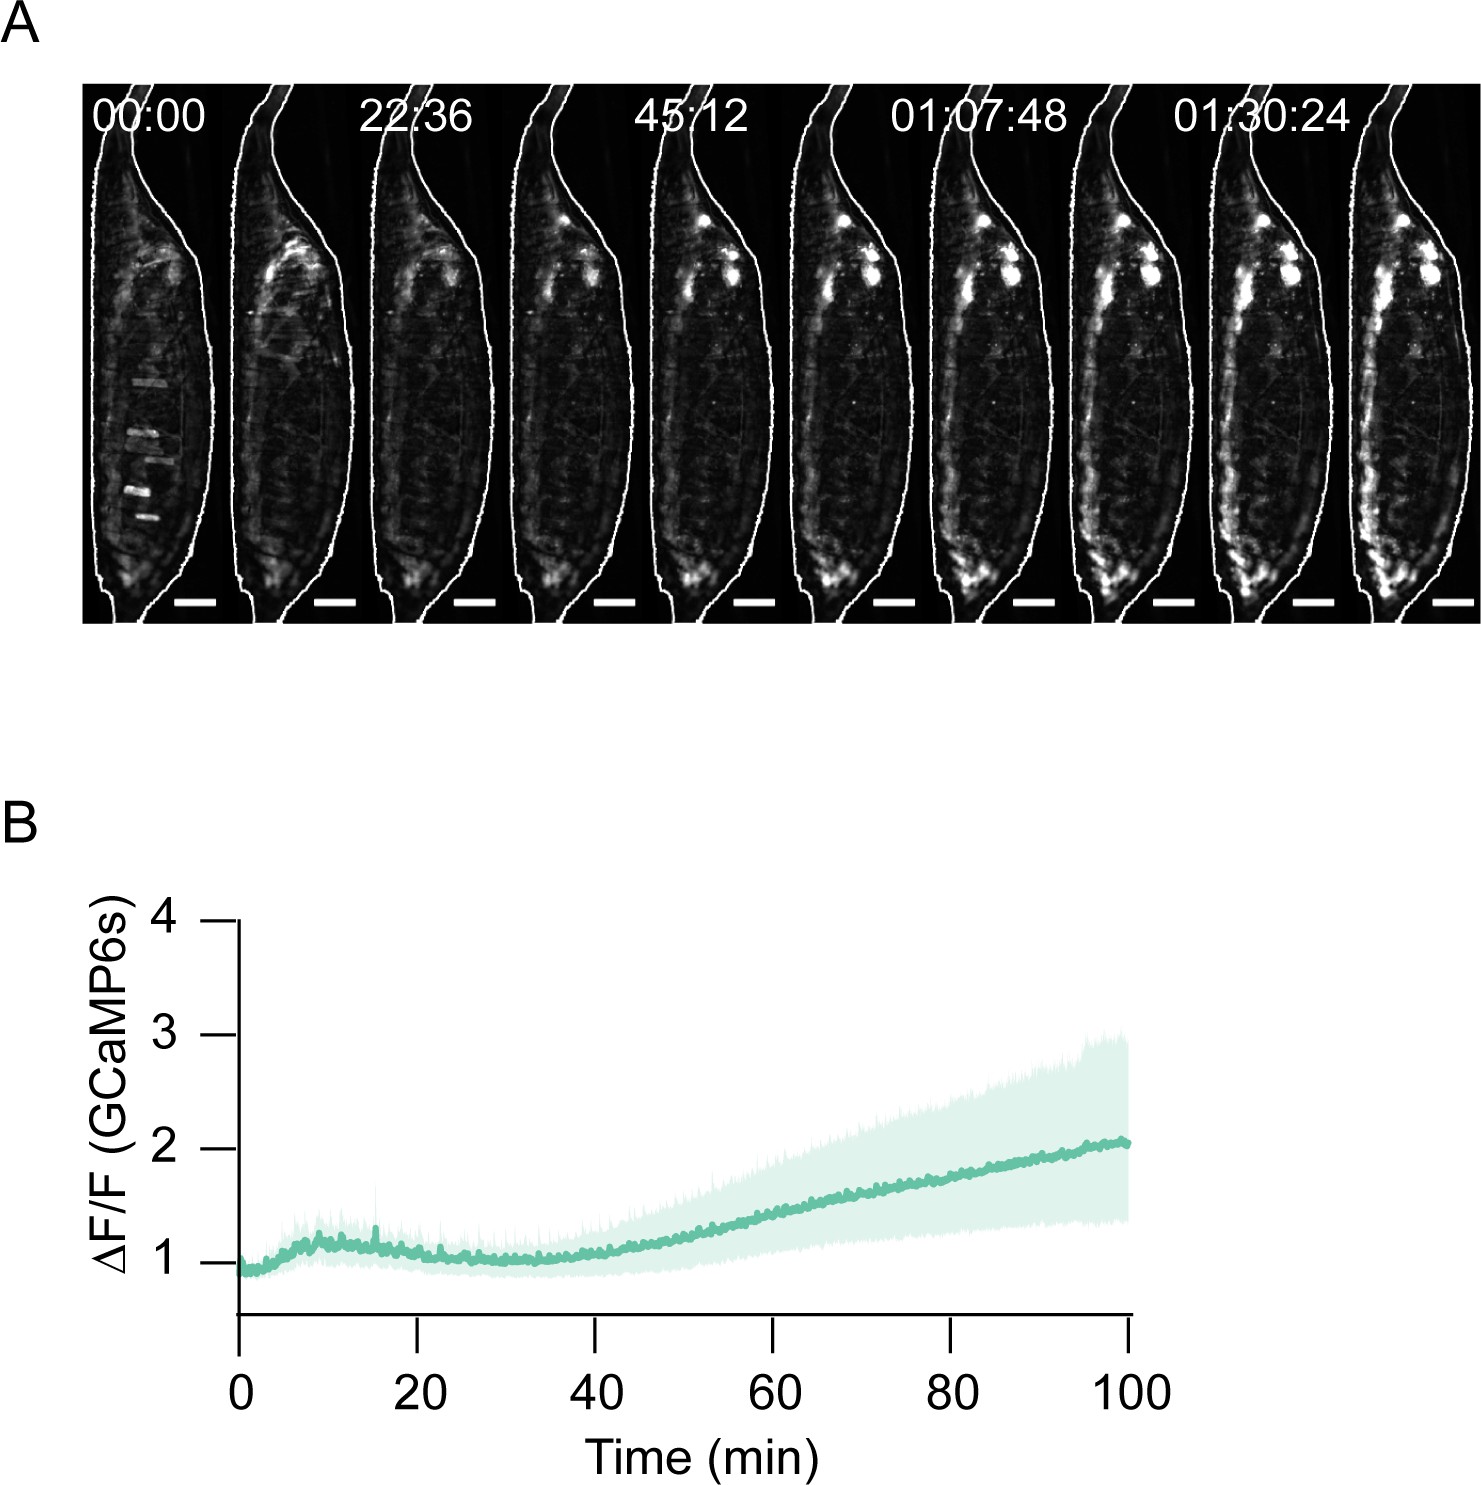
(A) Image montage of bulk muscle activity in a hlk>GCaMP6s animal with class I dendritic arbor (da) proprioceptors suppressed by two copies of Kir2.1. Scale bars, 250 μm. T = 0, imaging onset. Times in hr:min:s format. (B) Bulk Ca++ fluorescence trace (mean ± SD) for N = 10 animals like the one shown in (A). Stochastic activity is lost, followed by death before ecdysis onset. T = 0, imaging onset.
Figure 4 with 1 supplement
Muscle activity patterns identify elementary movements.
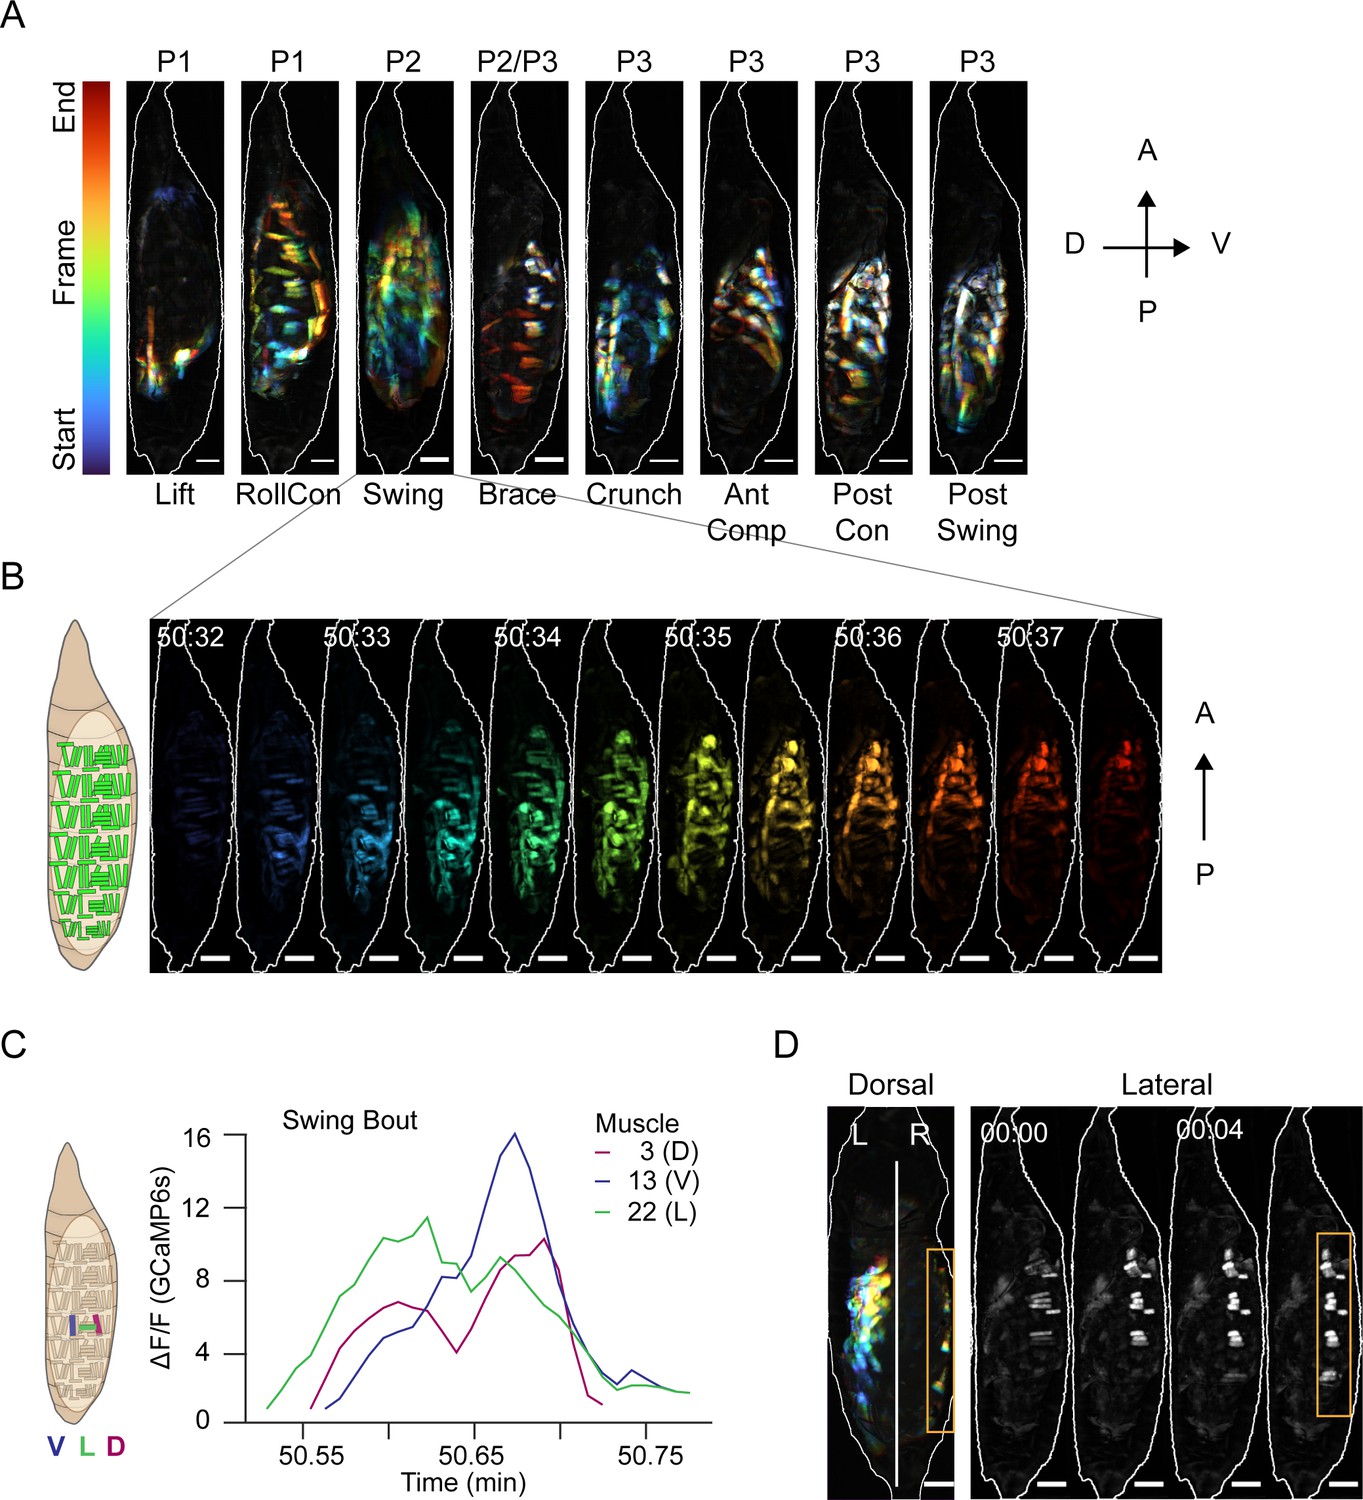
(A) Time-coded projections of muscle activity (lateral view) executed during labeled movements of the indicated phases. Scale bars, 250 μm. (B) Muscle activity comprising a Swing from (A) color-coded by time showing the P-to-A wave of coordinated activation across the dorsoventral axis. Times in min:s format. Schematic on left indicates muscle anatomy. Scale bars, 250 μm. (C) Representative Ca++ traces from a single Swing bout measured for dorsal (M3), ventral (M13), and lateral (M22) muscles in hemisegment (HS) A4 show co-incident activity across dorsoventral compartments. (D) Dorsal and lateral P2 muscle Ca++ activity during the Brace. Orange boxes, active lateral Brace muscles, coincident with Swing movement on the opposite side of the animal (dorsal view). White, dorsal midline. Times in min:s format. Scale bars, 250 μm. T = 0, movement onset. See also Figure 4—figure supplement 1 and Video 5.
Figure 4—figure supplement 1
Automated movement detection by convolutional neural network (CNN).
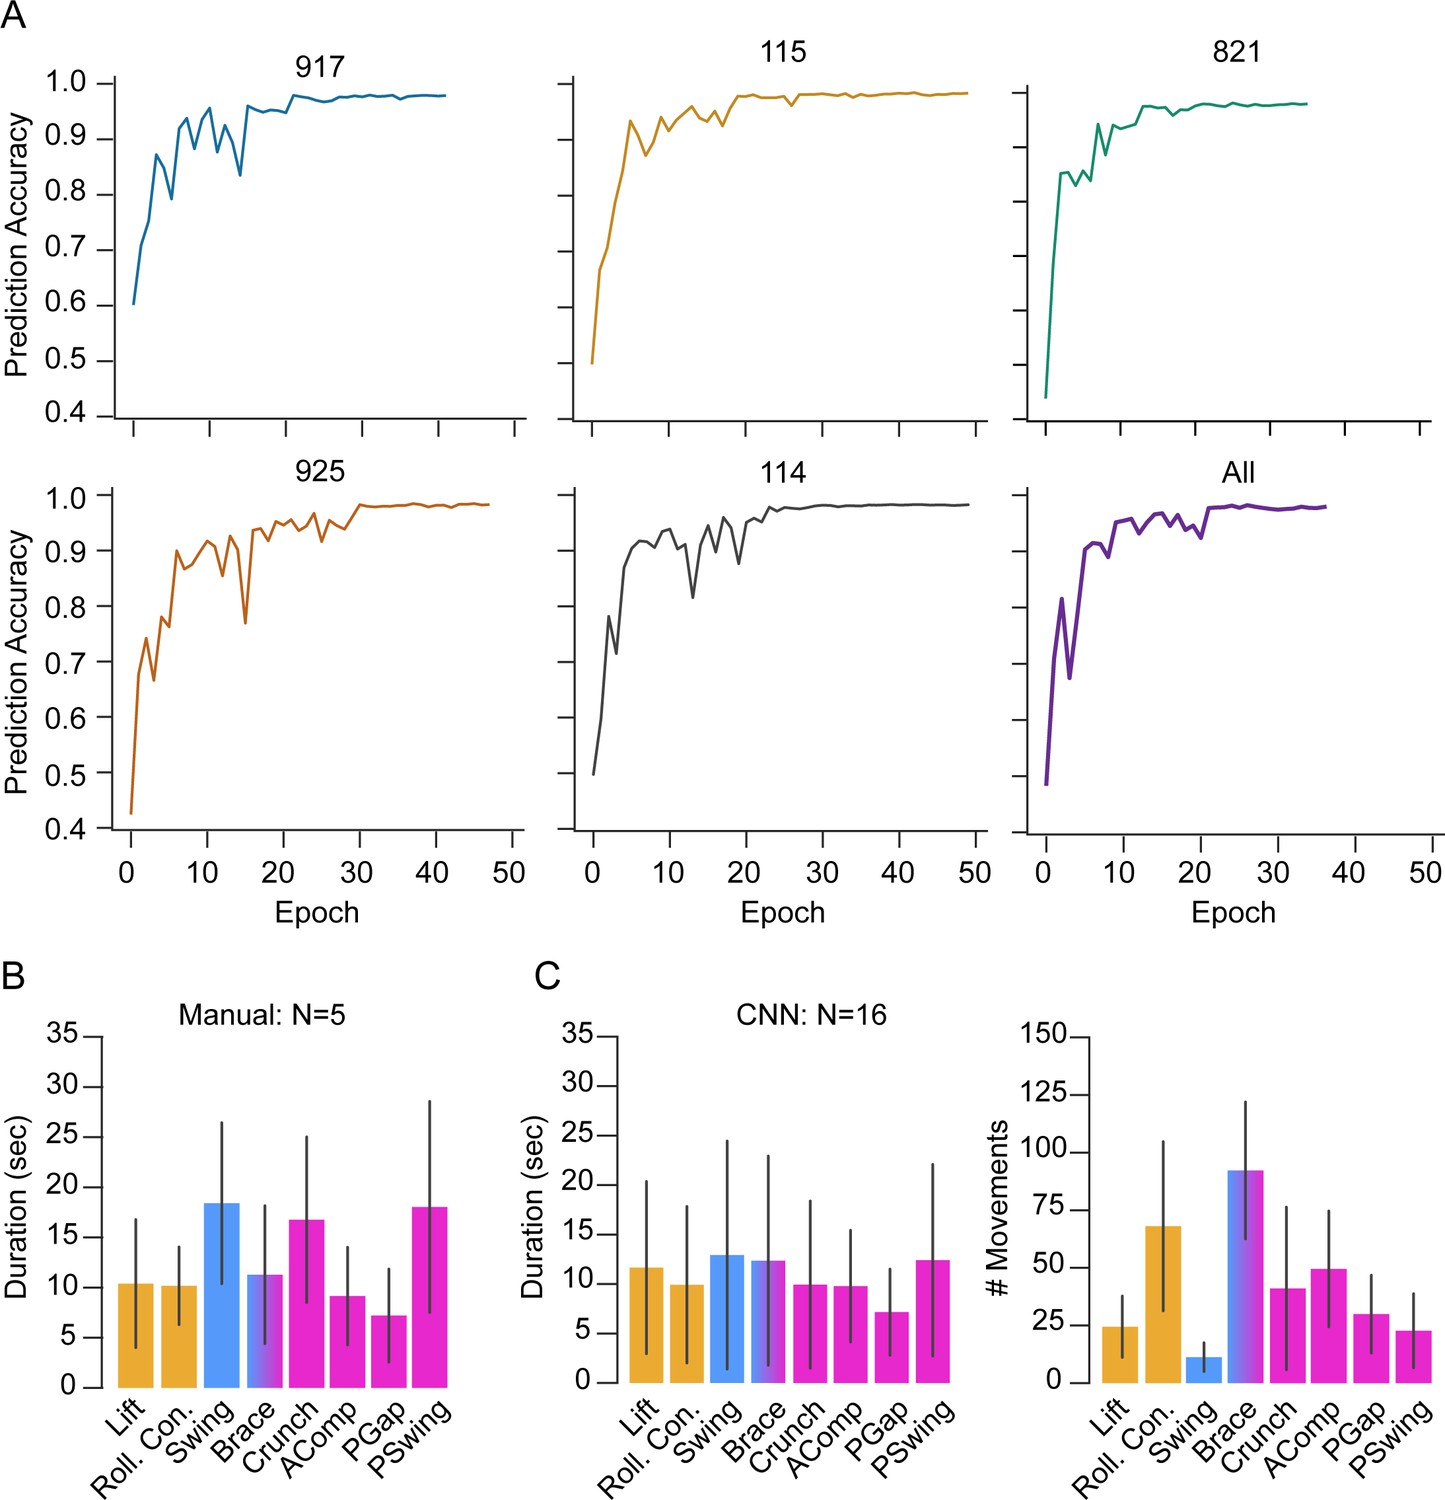
(A) Graphs showing the CNN’s accuracy of movement prediction per epoch for the five training samples (named 917, 115, 821, 925, 114) from a ‘leave-one-out’ cross-validation. The last graph (labeled ‘All’) shows the training accuracy using all five training samples, which represents the model used on the other animals (N = 16). T = 0, imaging onset. (B) Movement durations shown as mean ± SD for the five manually annotated animals, color-coded by phase: orange, P1; blue, P2; pink, P3. (C) Movement durations (left) and numbers (right) as determined by the CNN (mean ± SD), color-coded as in (B). N = 16 animals.
Figure 5
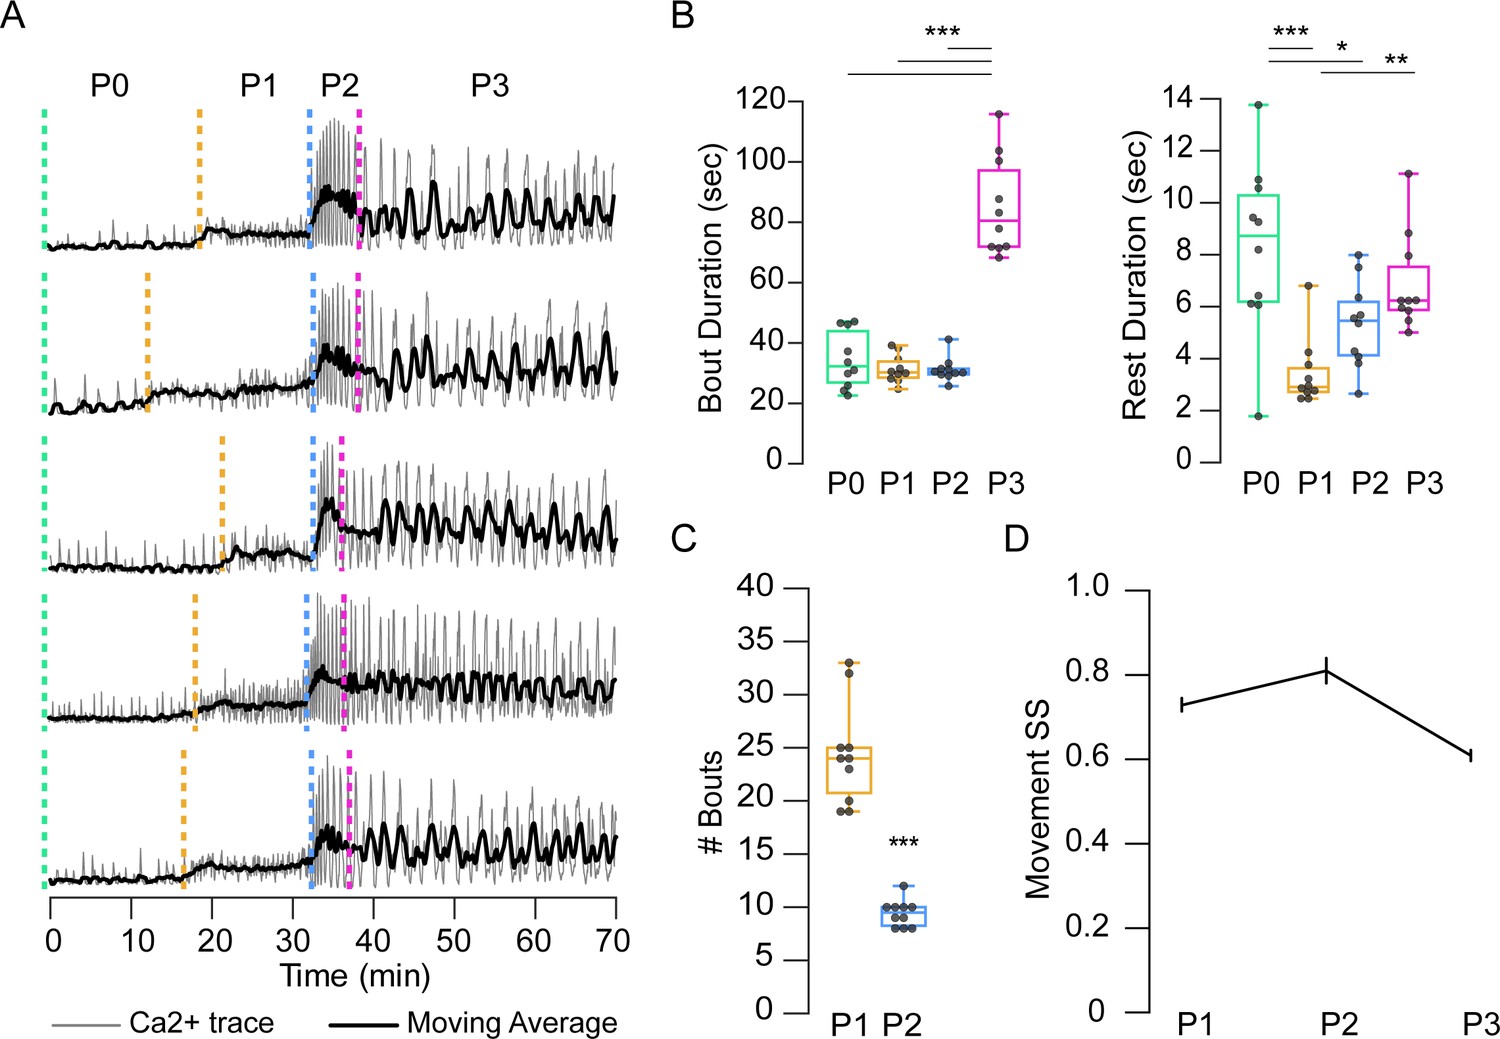
Temporal variability in muscle activity.
(A) Muscle Ca++ traces for five representative pupae imaged from the lateral side. Gray, bulk activity; black, 100 frame moving average. Phases as indicated. T = 0, imaging onset, all traces aligned to P2 start. (B) Bout (left) and interbout interval (right, ‘Rest’) durations, for manually annotated pupae (N = 10). *p<0.05; **p≤0.01; ***p≤0.001. (C) Number of P1 and P2 activity bouts for pupae in (B). ***p≤0.001. (D) SequenceMatcher similarity scores (SS) for movement sequences of P1, P2, and P3. See also Supplementary files 1 and 2.
Figure 6
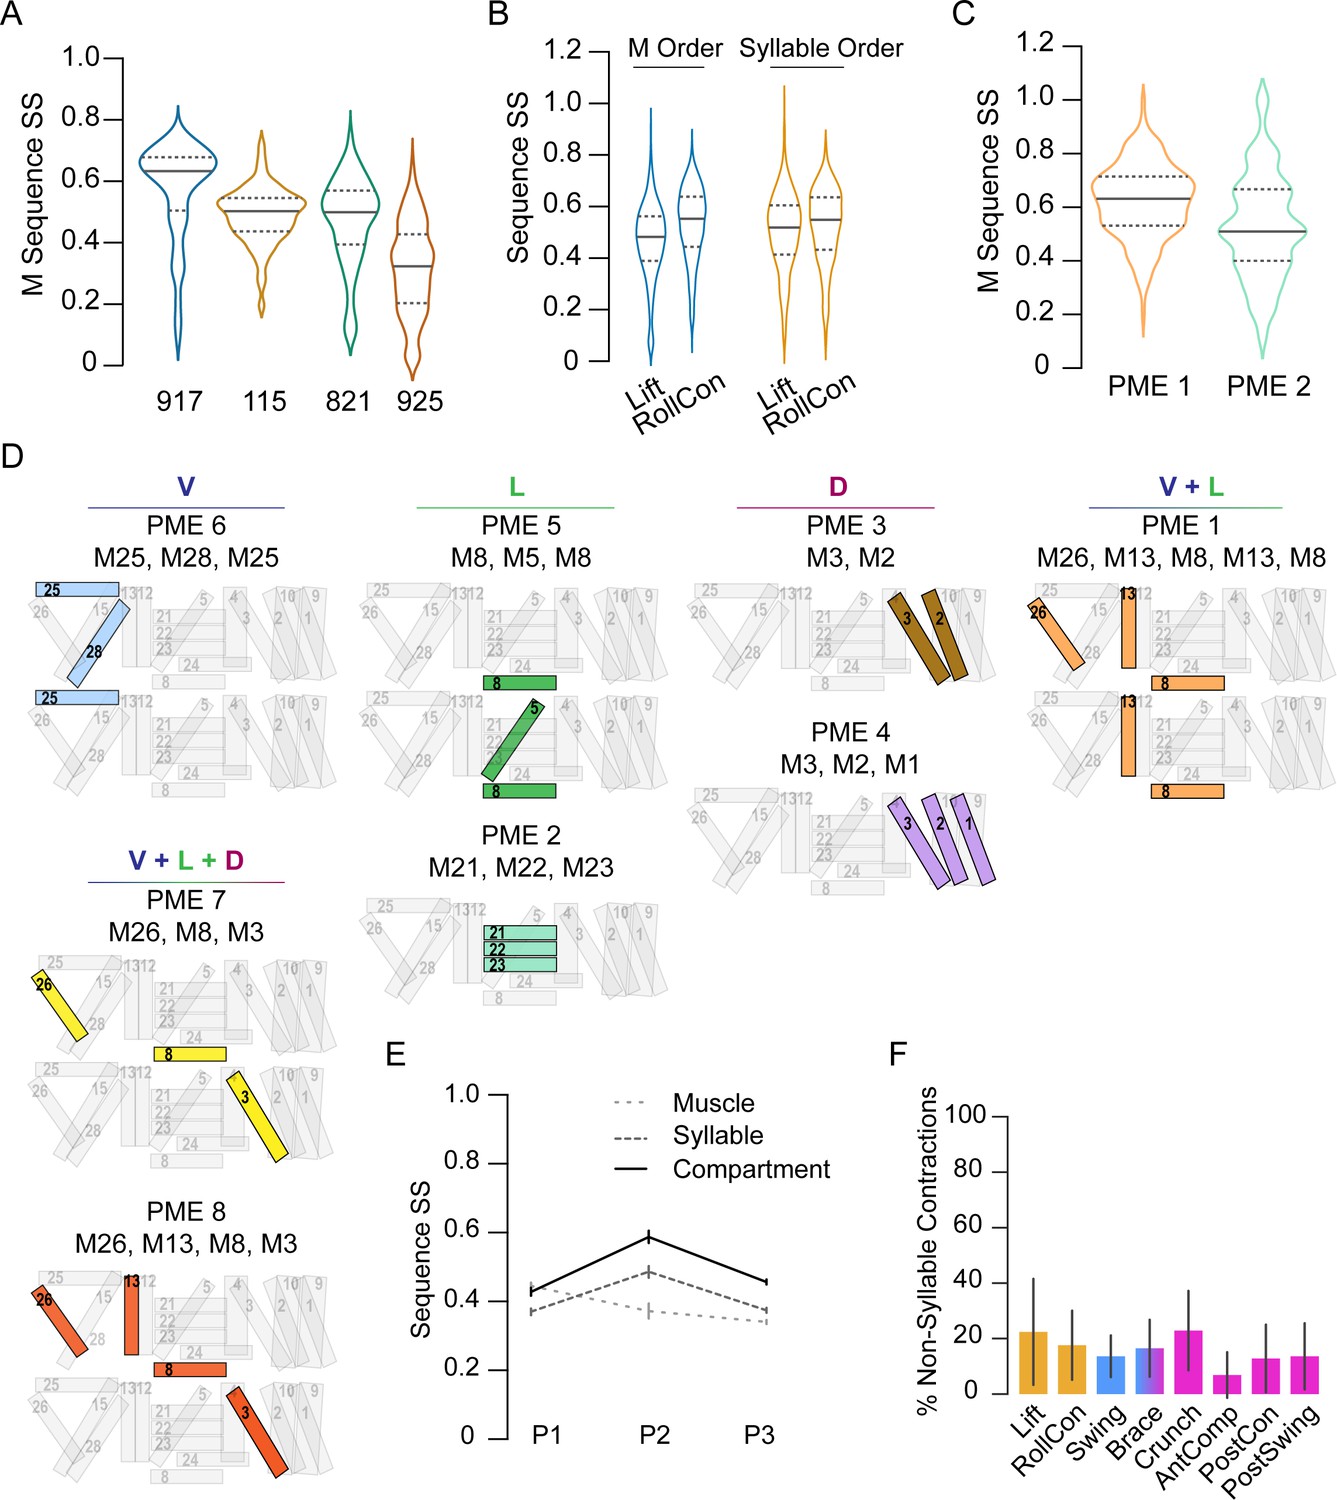
Co-active muscles define movement syllables.
(A–C) Distribution of similarity scores (SS) for single-muscle (M) activation sequences or syllable sequences in four manually annotated hlk>GCaMP6s animals, named 917, 115, 821, 925. (A) M activation sequences in P1 bouts. (B) M activation sequences (blue plots) and syllable sequences (orange plots) in P1 movements across pupae. (C) M activation sequences in PME1 and PME2. (D) Pupal muscle ensembles (colored) shown schematically on hemisegment musculature and organized by anatomical compartment. (E) Mean SS (± SD) for activation sequences of compartments (solid line), syllables (dark dashes), and single muscles (light dashes) for each phase by bout. N = 4 pupae. (F) Percentage of muscle activations not annotated as part of a syllable, color-coded by phase: orange, P1; blue, P2; pink, P3. N = 4.
Figure 7 with 1 supplement

Pupal syllable activation drives movement.
(A–C) Syllables associated with (A) Lift, (B) RollCon, and (C) Swing muscle activity are illustrated in images from the lateral, dorsal, and ventral views. Scale bars, 250 μm. (D, E) Phase relationships between syllables visible from the lateral view that form the Lift, RollCon, and Swing in both anterior (A4, top) and posterior (A6, bottom) hemisegments during characteristic bouts of (D) P1 and (E) P2. The average onset and offset times (± SD; N = 10) are shown, and each syllable is color-coded according to which D-V compartment(s) are occupied by its component muscles. Key at right indicates anatomical compartments: ventral, blue; lateral, green; dorsal, fuschia; and anterior (A)-posterior (P) boundary between A4 and A5 (magenta line). Hemisegments A4 and A6 are boxed and enlarged schematics on right show muscle composition of each. In A6, white muscles are absent. Dotted lines in (E) indicate the average midpoint of activation for all syllables for each hemisegment during the P2 bout. See also Figure 7—figure supplement 1.
Figure 7—figure supplement 1
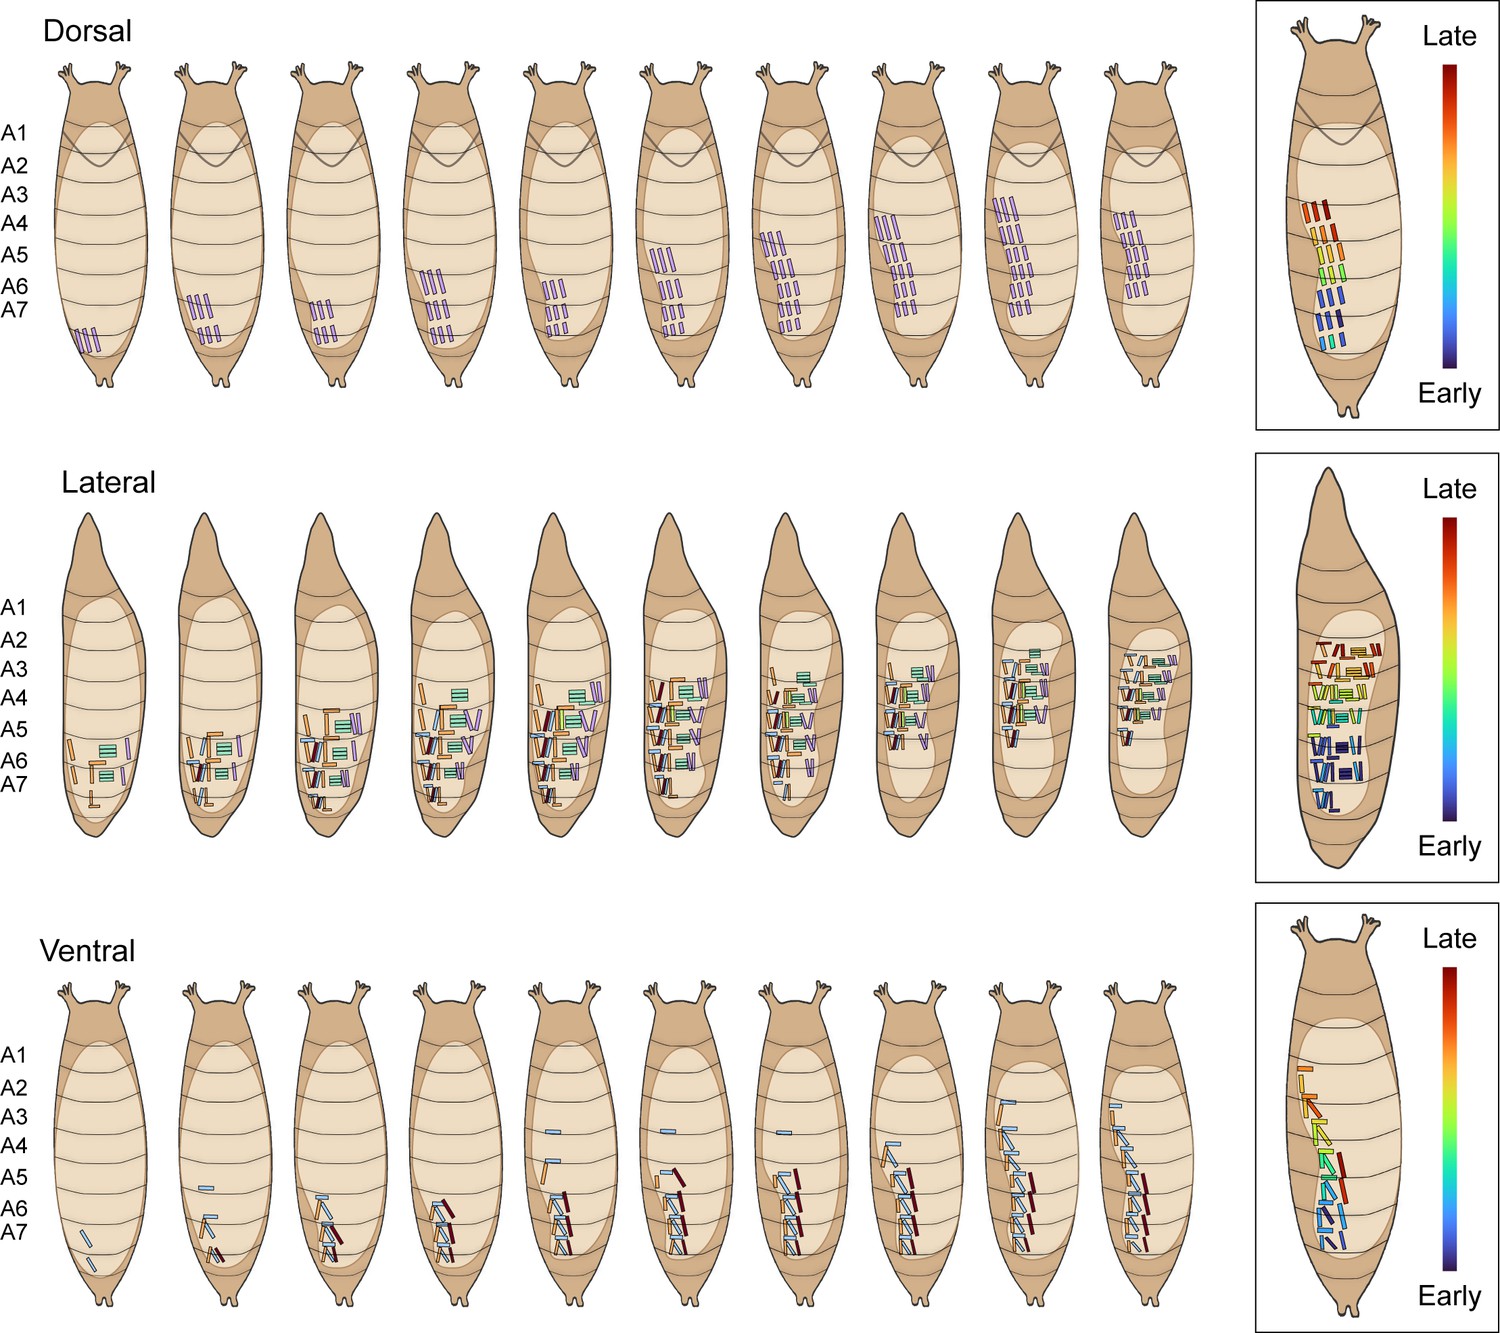
Timecourse of pupal muscle ensemble activation during a swing.
Schematics show the timecourse of muscle activity during a single swing from dorsal (top), lateral (middle), and ventral (bottom) views. PMEs in each labeled segment are colored as in Figure 6D. Boxes on the right show the order of single muscle recruitment. Order of activation in a representative is indicated by color: blue, earliest; red, latest.
Figure 8 with 2 supplements
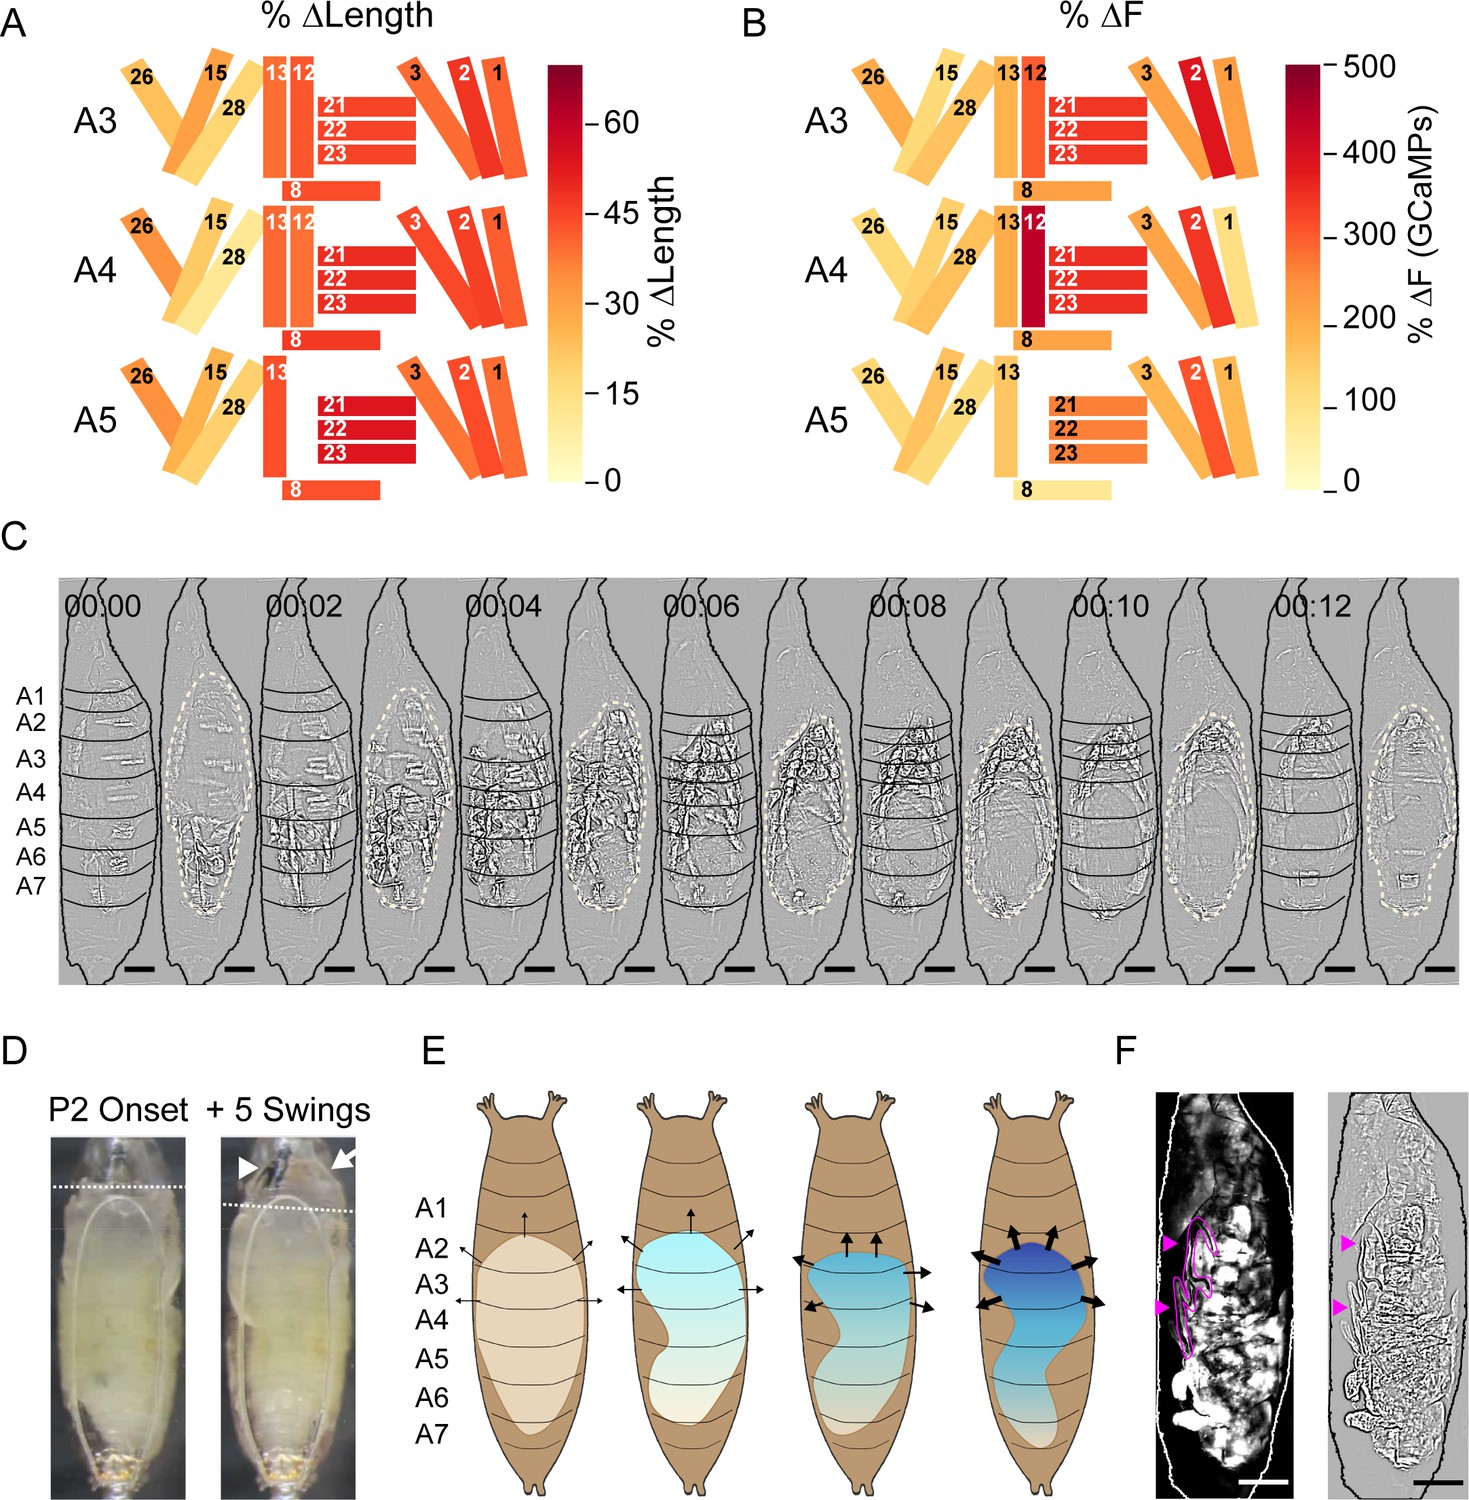
Muscle mechanics during P2 and P3 behaviors.
(A, B) Changes in muscle properties during contraction of indicated muscles in hemisegments (HS) A3–A5 during P2. (A) Change in muscle fiber length (ΔL/L). (B) Change in GCaMP6s fluorescence (ΔF/F). % changes were calculated from values at activity onset and at maximum activity for N = 24 pupae and color-coded as indicated. (C) Muscle activity of a Swing after Laplace transform to show body wall distortion during movement (black, HS boundaries; beige outlines, pupal body). Scale bars, 250 μm. T = 0, movement onset. Times in min:s format. (D) Images before (left) and after (right) head eversion. Dotted lines indicate anterior end of the body prior to head eversion. Head, arrow; larval mouth hooks, arrowhead. Scale bars, 200 μm. (E) Illustrated effects of the Swing movement on internal pressure. The P-to-A bending of the body wall pushes hemolymph forward, increasing pressure (blue gradient and arrows) in the anterior compartment. Darker blue and thicker arrows, increased pressure. (F) Larval dorsal tracheal trunks (magenta arrows) are deposited on the puparium wall during P2 Swings by a pupa expressing tdTomato in muscles. Trachea are visualized by scattered light from fluorescent muscles (grayscale, left) and highlighted in magenta in Laplace transformed image (right) for clarity. Scale bar, 250 μm. See also Figure 8—figure supplements 1 and 2, Table 1, Video 5.
Figure 8—figure supplement 1
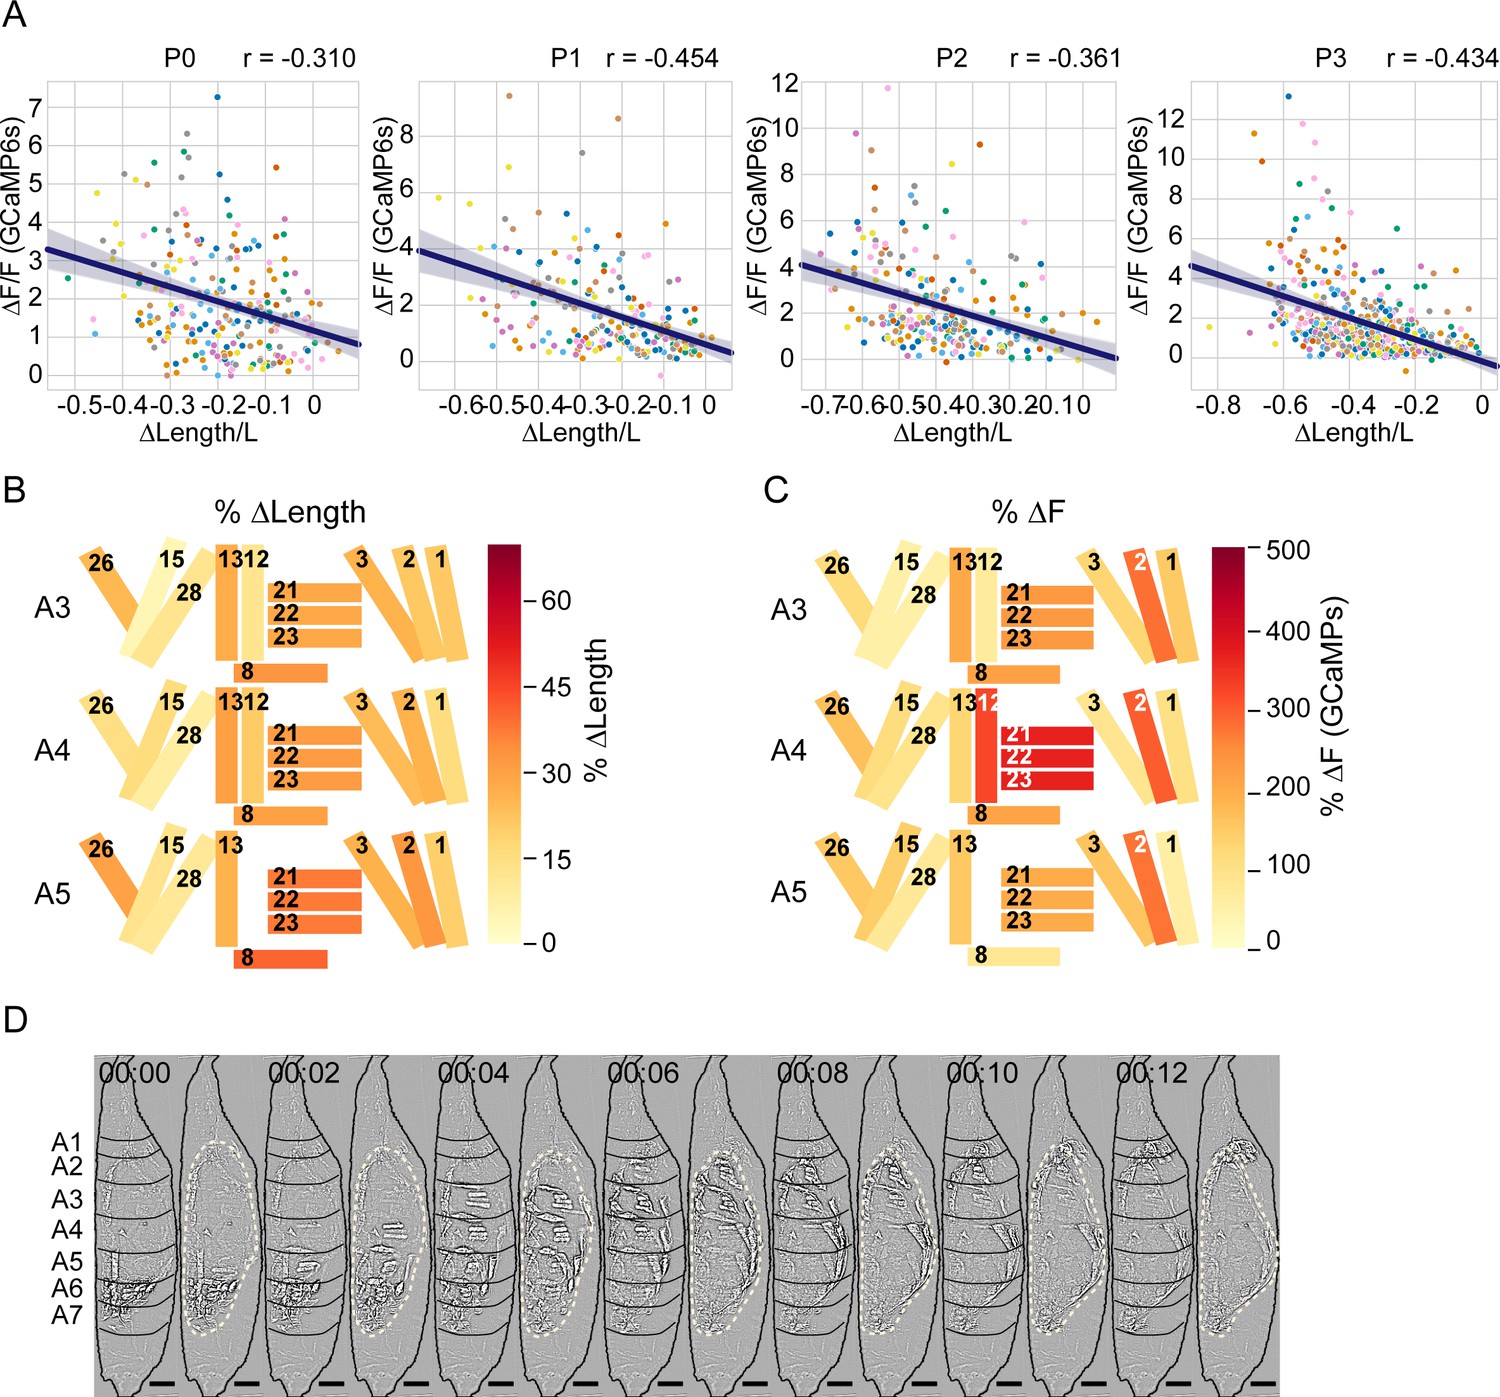
Analysis of muscle length and activity changes in P1.
(A) Scatter plots of normalized change in length (ΔL/L) vs. normalized change in fluorescence (ΔF/F) for muscles from eight animals (colored by animal) for each phase. Line shows Pearson correlation; r indicated. (B, C) Heatmaps of changes in muscle properties during contraction of the indicated muscles in hemisegments A3–A5 during P1 RollCon activity. (B) % change in muscle fiber length (ΔL/L). (C) % change in GCaMP6s fluorescence (ΔF/F). In both cases, changes were measured at the onset of activity and at maximum activity for N = 24 animals. (D) Image montage of muscle activity comprising a P1 RollCon after Laplace transformation to show body wall distortion during movement (black lines, segments; beige dotted lines, pupal body). Scale bars, 250 μm. T = 0, movement onset. Times in min:s format.
Figure 8—figure supplement 2
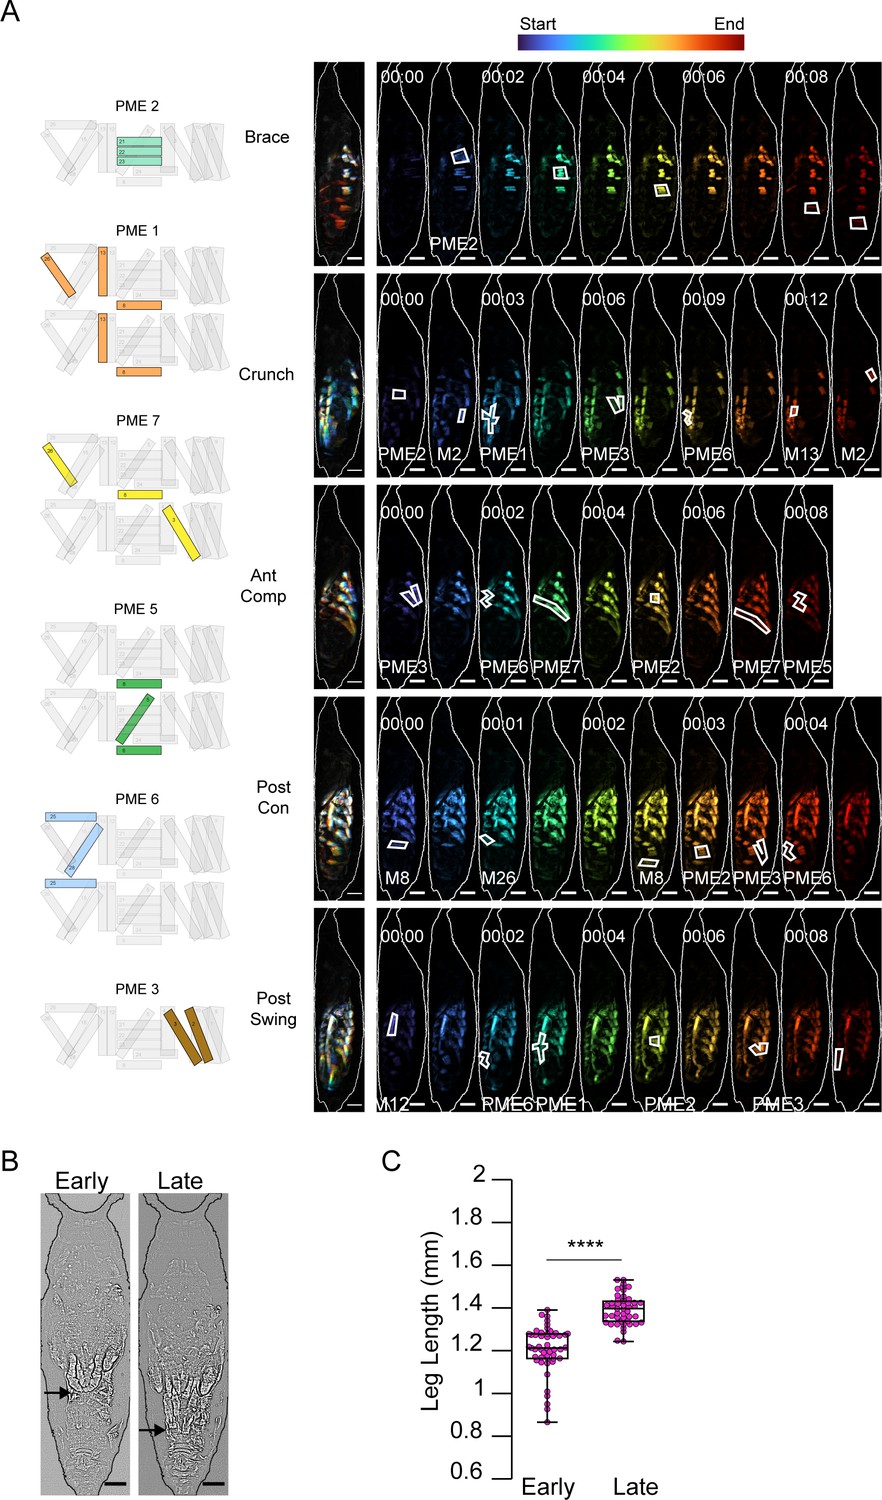
P3 movements and appendage extension.
(A) Muscle activity comprising P3 movements color-coded by time. Schematics on left indicate pupal muscle ensembles (PMEs) represented in white outlines on the time-series montages (right), as labeled. Scale bars, 250 μm. Times in min:s format. (B) Leg extension during P3 imaged from the ventral side. Ends of the extending legs (arrows) are shown at early and late P3. (C) Leg length during the first (Early) and last (Late) 10 bouts recorded of P3. Scale bars, 250 μm. ****p≤0.0001.
Figure 9 with 1 supplement
Roles of ecdysis triggering hormone (ETH) and crustacean cardioactive peptide (CCAP) in ecdysis behavior.
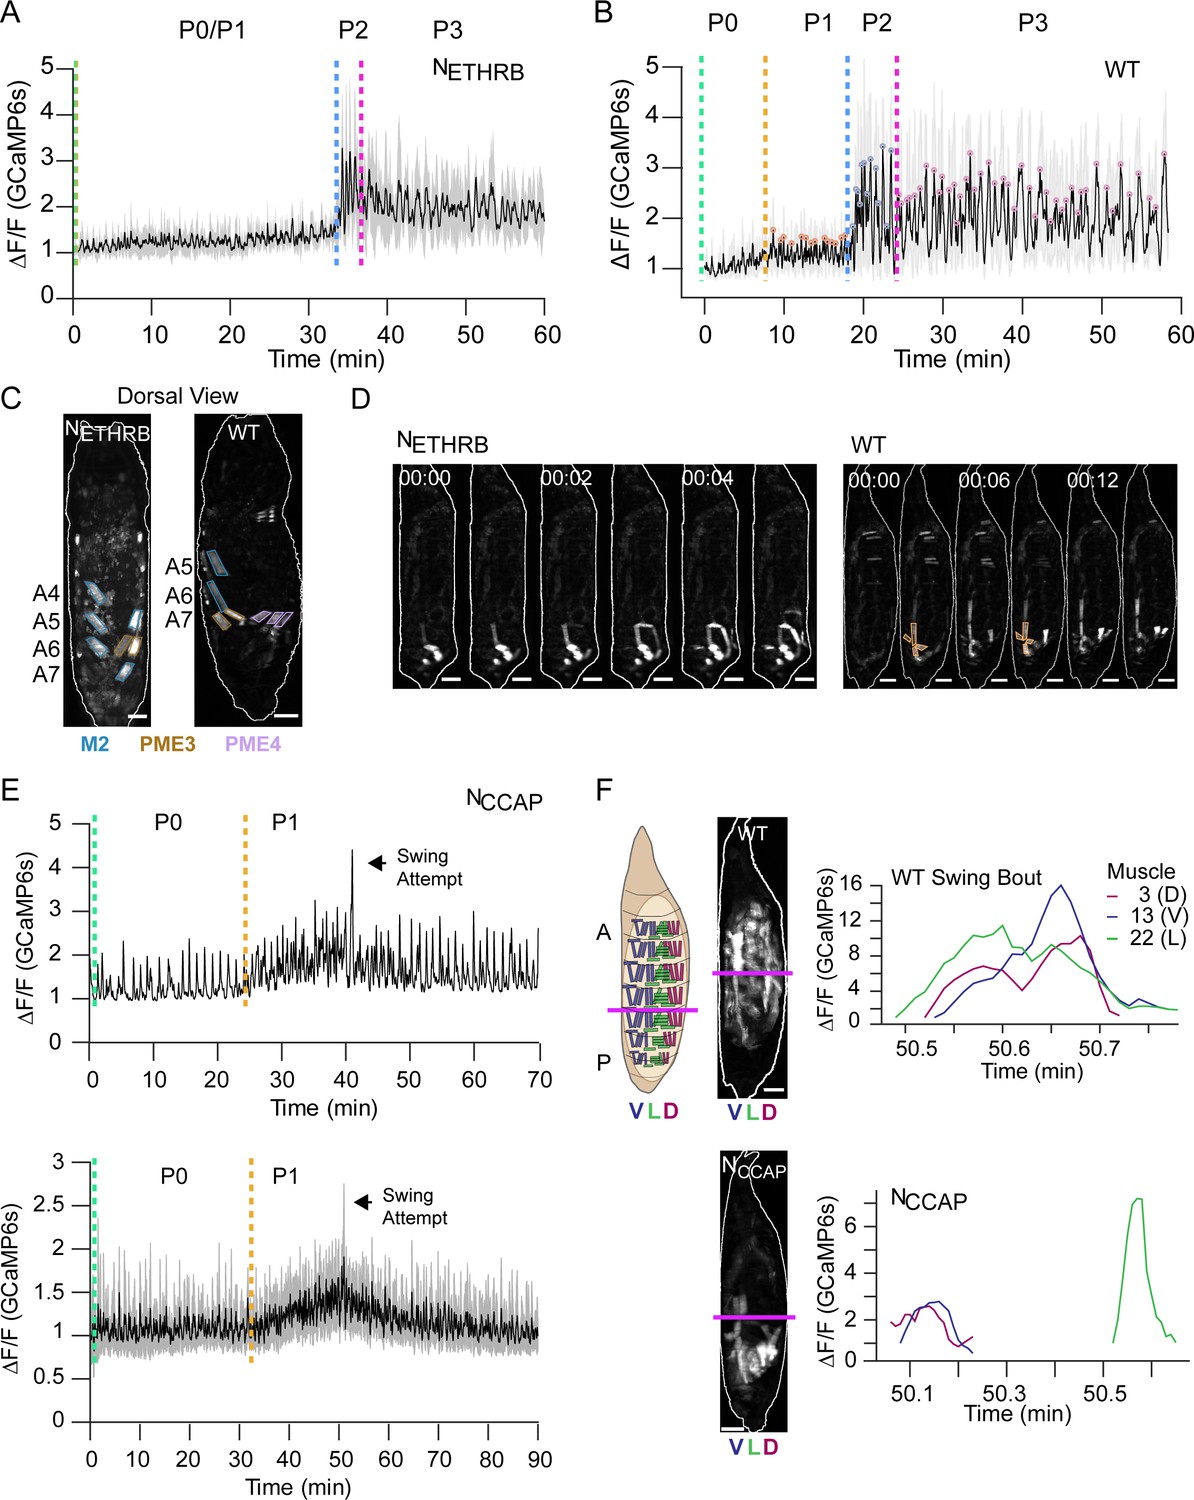
(A, B) Lateral view bulk Ca++ activity traces, mean (black), and SD (gray) for (A) animals with suppressed NETHRB (N = 6) and (B) wild-type (WT) pupae (N = 16). Lack of change in activity precludes discrimination between P0 and P1 for NETHRB-suppressed animals. T = 0, imaging onset, all traces aligned to P2 start. (C) Comparison of muscle activity in NETHRB-suppressed (NETHRB) and WT animals during the execution, or attempted execution, of the RollCon movement. Syllables are outlined. Scale bars, 250 μm. (D) Muscle activity montages for NETHRB-suppressed and WT pupae show disruption in posterior muscle activation. PME1 is outlined in WT image. Scale bars, 250 μm. T = 0, movement onset. Times in min:s format. (E) Top: Ca++ activity trace (lateral view) for an animal with suppressed CCAP-expressing neurons (NCCAP). Dotted lines indicate identifiable phase onset times. Black arrow indicates a single partial swing-like movement where P2 typically begins. T = 0, imaging onset. Bottom: mean Ca++ activity (± SD) for 10 NCCAP-suppressed pupae. T = 0, imaging onset, all traces aligned to P1 start. (F) Images of muscle activity during a Swing in WT or a partial swing-like movement in NCCAP-suppressed animals. Schematic on left indicates the A-P boundary (magenta) and ventral, lateral, and dorsal compartments. On the right are Ca++ traces for M3, M13, and M22 in hemisegment (HS) A4 from a single swing for a WT and NCCAP-suppressed animal. Co-incidence across the dorsal (D), lateral (L), and ventral (V) compartments is lost in NCCAP. Scale bars, 250 μm.
Figure 9—figure supplement 1
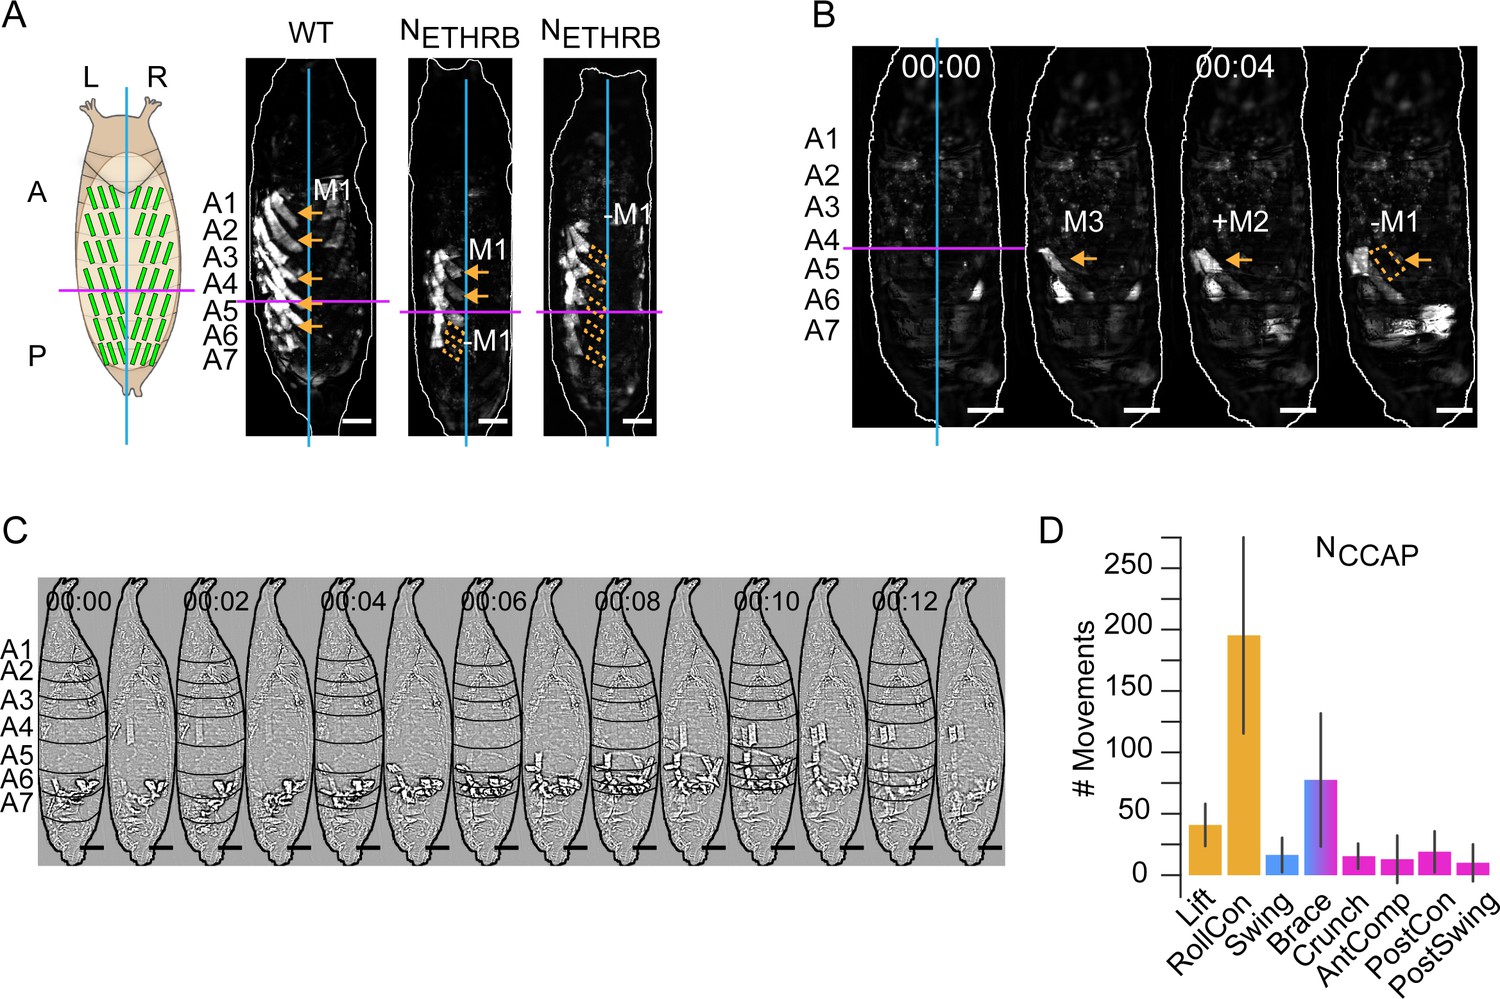
Neuromodulatory neuron suppression disrupts pupal muscle ensembles (PMEs).
(A) Schematic on left shows L-R and A-P axes with lines indicating the dorsal midline (cyan) and the A-P boundary between segments A4 and A5 (magenta). Dorsal images of a left Swing from wildtype (left) and two NETHRB-suppressed animals (middle and right) showing disrupted M1 activity. Orange arrows, M1 activity; dotted boxes, missing M1 activity. Scale bars, 250 μm. (B) Image montage (dorsal view) of muscle activity comprising the single, partial ‘P2’ swing of an animal with suppressed NCCAP. PME4 incompletely forms (orange arrowheads) and the P-to-A activity reaches only segment 4. Left image indicates the dorsal midline (green line) and P-A boundary (magenta line). Scale bars, 250 μm. T = 0, movement onset. Times in min:s format. (C) Image montage (lateral view) of muscle activity comprising the single, swing-like movement of an animal with suppressed NCCAP after Laplace transformation to show segmental compressions. Black lines, segmental boundaries. Scale bars, 250 μm. T = 0, movement onset. Times in min:sec format. (D) The number of movements in NCCAP-suppressed animals as detected by convolutional neural network (CNN) and plotted as mean (± SD), color-coded by phase: orange, P1; blue, P2; pink, P3. N = 10 animals.
Figure 10
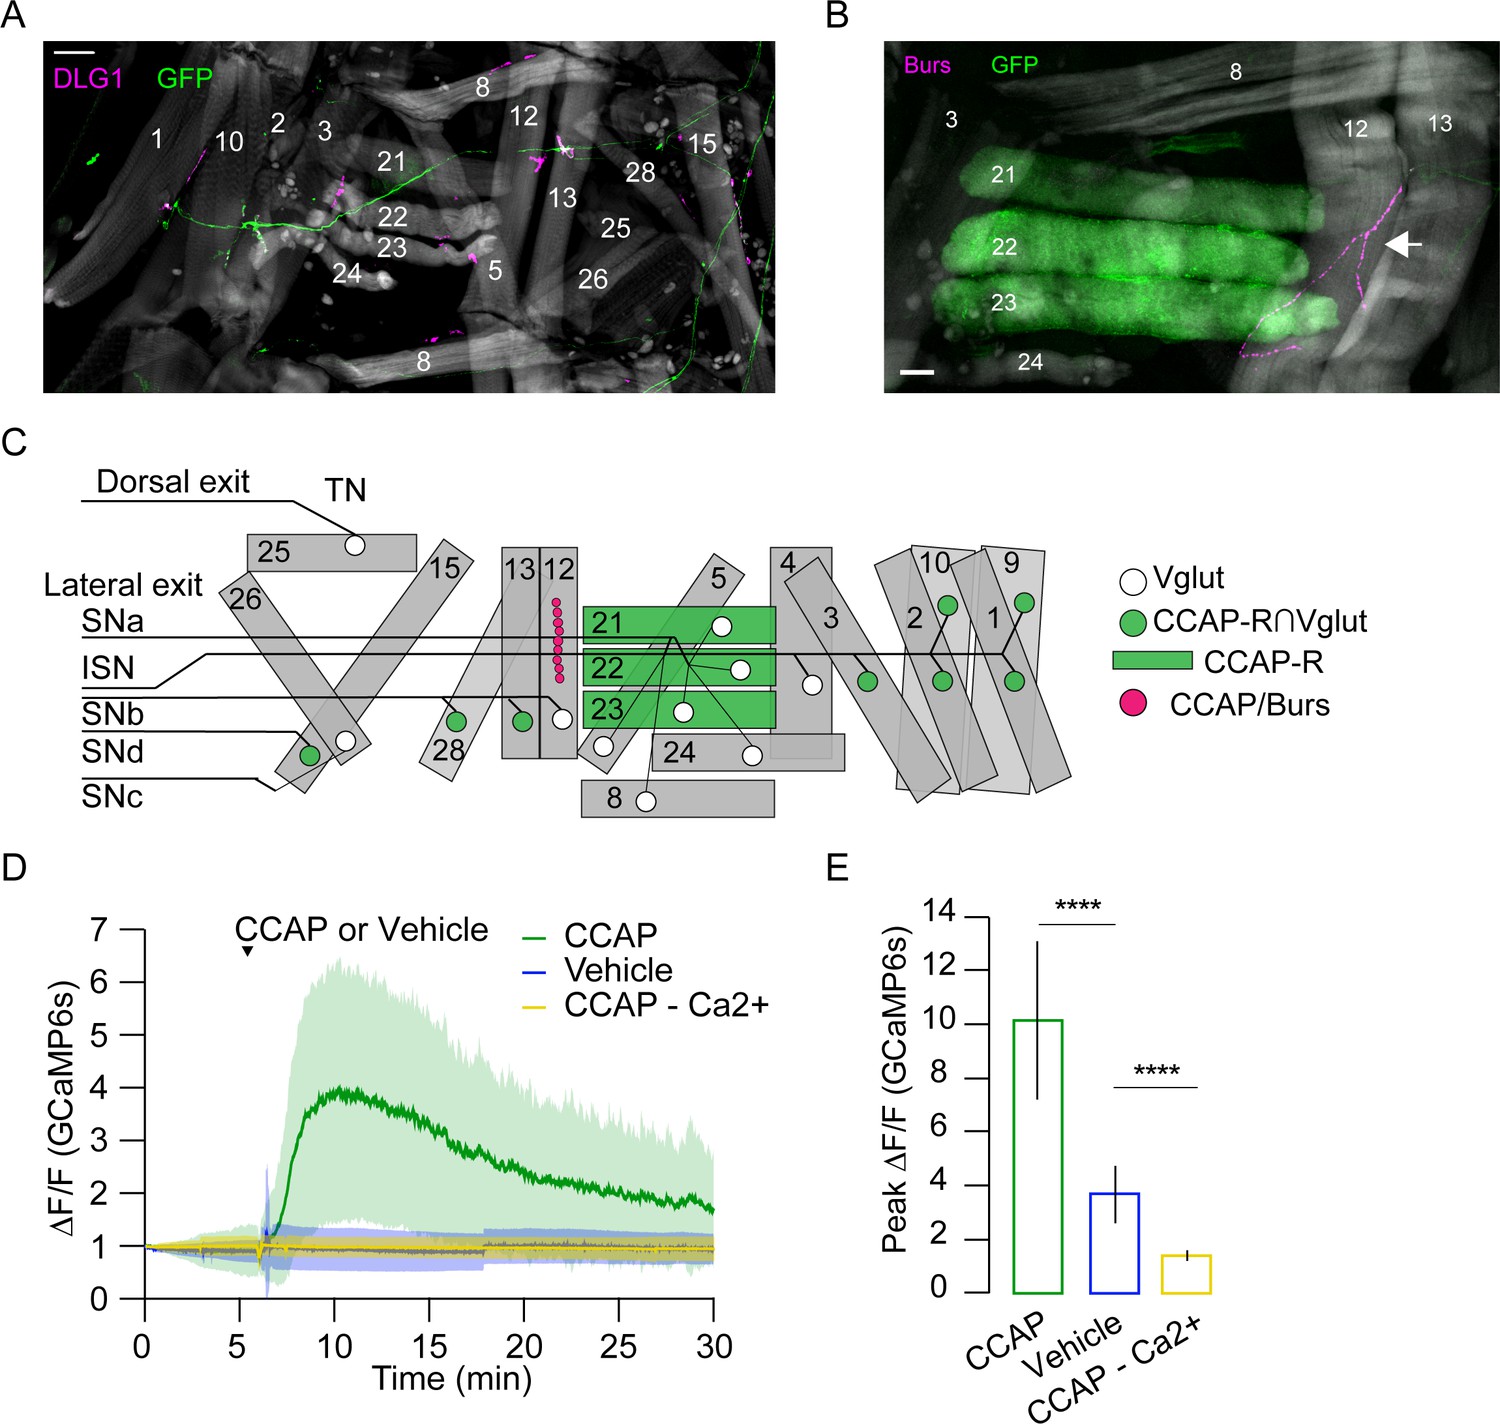
Crustacean cardioactive peptide (CCAP) targets a subset of lateral-tranverse muscles.
(A) Motor axons expressing mCD8-GFP (green) under the control of the CCAP-R∩Vglut Split Gal4 driver innervate a subset of muscles (phalloidin, gray) at synapses stained for the postsynaptic marker DLG1 (magenta). Hemisegment (HS) A3 is shown. Scale bar, 50 μm. (B) CCAP-R-expressing muscles M21–M23, visualized with CCAP-R-Gal4>mCD8-GFP (green), are located adjacent to the type III terminal on M12, which is immunopositive for CCAP and Bursicon (magenta, white arrow). HS A4 is shown. Gray, phalloidin-stained muscles. Scale bar, 50 μm. (C) Map of CCAP-R motor neuron innervation (green circles) of pupal muscles. Innervation by motor neurons expressing only VGlut, and not CCAP-R (white circles), is also shown, as are muscles expressing CCAP-R (green rectangles) and the type III synapse on M12 that releases CCAP and Bursicon (fuchsia circles). (D) CCAP application elicits robust Ca++ responses from M21–M23 (green; mean ± SD) in live, filleted hlk>GCaMP6s animals. No response is seen with vehicle only (blue line; mean ± SD) or in Ca++-free media (yellow; mean ± SD). N = 7–10 pupae, 12 HS/pupa. T = 0, imaging onset. (E) Peak GCaMP6s (ΔF/F) activity from experiments in (D) expressed as mean ± SD. See also Supplementary file 1 and Videos 6 and 7.
Figure 11
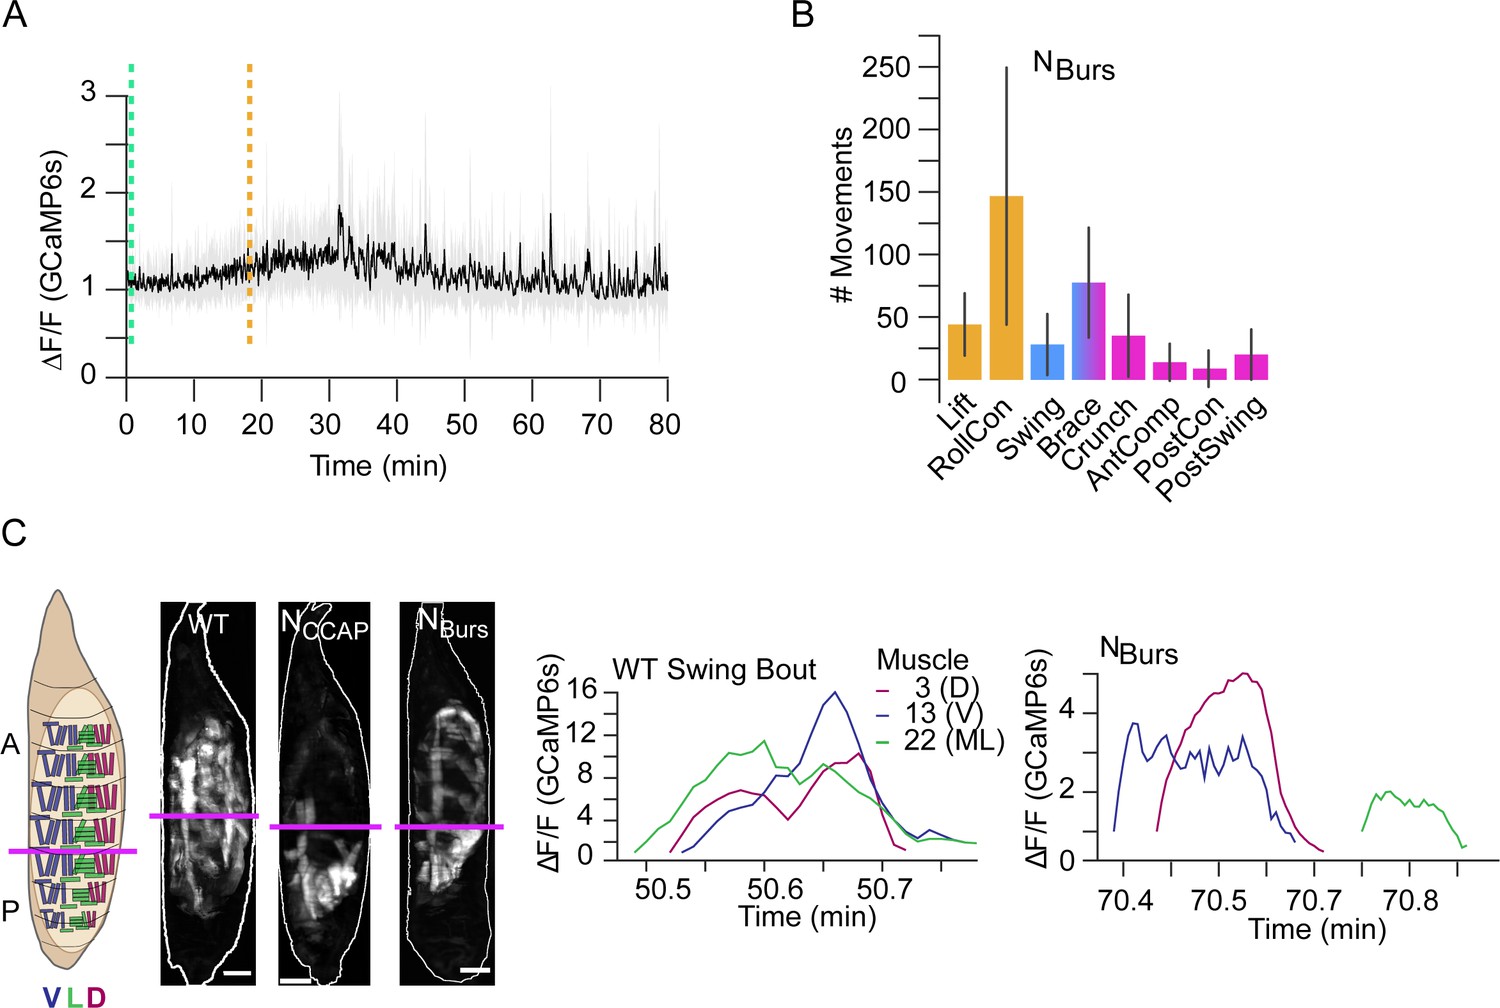
Compartmental muscle synchrony for swing requires Bursicon neurons.
(A) Bulk Ca++ activity trace (lateral view) for animals in which the Bursicon-expressing neurons (NBurs) are suppressed. Mean activity (black) ± SD (gray) is shown for 10 animals. Dotted lines indicate identifiable phase onset times. P2 consists of a single attempted swing, though subsequent attempts and some P3-like activity follows. T = 0, imaging onset, all traces aligned to P1 start. (B) The number of movements as detected by convolutional neural network (CNN) in NBurs animals plotted as mean (±) SD, color-coded by phase: orange, P1; blue, P2; pink, P3. N = 10 animals. (C) Images on the left show muscle activity comprising Swing, or swing-like, movements in wildtype (WT), NCCAP-suppressed, and NBurs-suppressed animals (schematic as in Figure 9F); Ca++ traces on right show activity of muscles M3, M13, and M22 in hemisegment (HS) A4 from a single Swing bout in a WT animal (left) compared with traces for the same muscles from the swing-like bout in a NBurs-suppressed animal (right). As for NCCAP-suppressed animals, coincidence across the dorsal (D), lateral (L), and ventral (V) compartments is lost in NBurs-suppressed animals. Scale bars, 250 μm.
Videos
Video 1
Pupal ecdysis behavior (lateral view).
Bright-field video taken from the lateral side showing a pupa performing the pupal ecdysis sequence. Phases 1–3 are labeled. Sped up to 50 fps. Scale bars, 250 μm. Time, seconds.
Video 2
P1 muscle activity.
Dorsal view of a P1 bout with Lift and RollCon movements alternating bilaterally in a hlk>GCaMP6s animal; data were sampled at 2 Hz and sped up to 10 fps. Scale bars, 250 μm. Time, seconds.
Video 3
P1 muscle activity.
Lateral view of a P1 bout with Lift and RollCon movements in a hlk>GCaMP6s animal; data were sampled at 2 Hz and sped up to 10 fps. Scale bars, 250 μm. Time, seconds.
Video 4
P0 muscle activity.
Lateral view of P0 in a hlk>GCaMP6s animal; data were sampled at 2 Hz and sped up to 10 fps. Scale bars, 250 μm. Time, seconds.
Video 5
Muscle activity of the eight canonical movements (lateral view) in a hlk>GCaMP6s animal; data were sampled at 2 Hz and sped up to 10 fps, except the posterior contraction, which is 5 fps.
Scale bars, 250 μm. Time, seconds.
Video 6
Partial swing and subsequent activity bouts in an NCCAP-suppressed pupa (lateral view, top), with wildtype P2 bouts for comparison (bottom); data were sampled at 2 Hz and sped up to 5 fps.
Scale bars, 250 μm. Time, seconds.
Video 7
Response of lateral transverse muscles to crustacean cardioactive peptide (CCAP): live fillet of a hlk>GCaMP6s animal before and after bath application of synthetic CCAP; data were sampled at 2 Hz and sped up to 10 fps.
Scale bars, 250 μm. Time, seconds.
Tables
Table 1
Composition and function of pupal ecdysis movements.
| P0 | P1 | P2 | P3 | ||||||
|---|---|---|---|---|---|---|---|---|---|
| Movements | - | Lift | RollCon | Swing | Brace | Crunch | AntComp | PostCon | PostSwing |
| Compartments | - | P D/L/V | A/P D/L/V | A/P D/L/V | A/P L | A/P D/L/V | A D/L/V | P D/L/V | P D/L/V |
| Syllables | |||||||||
| PME1 | ✓ | ✓ | ✓ | ✓ | |||||
| PME2 | ✓ | ✓ | ✓ | ✓ | ✓ | ✓ | ✓ | ✓ | |
| PME3 | ✓ | ✓ | ✓ | ✓ | ✓ | ||||
| PME4 | ✓ | ✓ | ✓ | ||||||
| PME5 | ✓ | ✓ | |||||||
| PME6 | ✓ | ✓ | ✓ | ✓ | ✓ | ✓ | ✓ | ✓ | |
| PME7 | ✓ | ||||||||
| PME8 | ✓ | ||||||||
| M1 | ✓ | ✓ | |||||||
| M2 | ✓ | ✓ | ✓ | ||||||
| M8 | ✓ | ✓ | ✓ | ✓ | ✓ | ✓ | |||
| M12 | ✓ | ✓ | ✓ | ||||||
| M13 | ✓ | ✓ | |||||||
| M15 | ✓ | ✓ | ✓ | ✓ | |||||
| M26 | ✓ | ||||||||
| L-R rhythm | L-R | - | L-R | L-R | L-R | L-R | - | L-R | L-R |
| A-P rhythm | - | P-A | P-A | P-A | A-P | A-P P-A | A-P | - | A-P |
| Function | - | Fragment trachea | Evert head, shed trachea | Elongate appendages | |||||
Key resources table
| Reagent type (species) or resource | Designation | Source or reference | Identifiers | Additional information |
|---|---|---|---|---|
| Antibody | Rabbit polyclonal anti-pBurs | Aaron Hsueh/ Willi Honegger | (1:250) | |
| Antibody | Alexa Fluor 555 Phalloidin | ThermoFisher/ Invitrogen | A34055 | (1:500) |
| Antibody | Rabbit polyclonal anti-GFP | ThermoFisher/ Invitrogen | A11122; RRID:AB_221569 | (1:250) |
| Antibody | Mouse monoclonal anti-DLG | Developmental Studies Hybridoma Bank | 4F3; RRID:AB_528203 | (1:500) |
| Antibody | Goat anti-Mouse IgG Alexa Fluor 647 | ThermoFisher/ Invitrogen | A21236; RRID:AB_2535805 | (1:500) |
| Antibody | Goat anti-Rabbit IgG Alexa Fluor 488 | ThermoFisher/ Invitrogen | A11008 RRID:AB_143165 | (1:500) |
| Peptide, recombinant protein | CCAP | BACHEM | 4015114 | (1 µM) |
| Chemical compound, drug | Schneider’s insect medium | Sigma-Aldrich | S0416 | |
| Chemical compound, drug | Schneider’s insect medium w/o calcium | Sigma-Aldrich | s9895 | |
| Chemical compound, drug | 2,2-Thiodiethanol | Sigma-Aldrich | 166782 | |
| Chemical compound, drug | ProLong Diamond Antifade Mountant | ThermoFisher/ Invitrogen | P36961 | |
| Genetic reagent (Drosophila melanogaster) | D. melanogaster: ETHRB-Gal4 (ETHRBMI00949-Gal4) | Diao et al., 2016 | ||
| Genetic reagent (D. melanogaster) | D. melanogaster: CCAP-R-Gal4 (CCAP-RMI05804-GAL4) | Diao et al., 2017 | ||
| Genetic reagent (D. melanogaster) | D. melanogaster: CCAPR-p65AD (CCAP-RMI05804-p65AD) | Diao et al., 2017 | ||
| Genetic reagent (D. melanogaster) | D. melanogaster: w; CCAP-Gal4; + | Gift of J. Ewer | ||
| Genetic reagent (D. melanogaster) | D. melanogaster: VGlut-Gal4DBD (VGlutMI04979-Gal4DBD) | Diao et al., 2015 | ||
| Genetic reagent (D. melanogaster) | D. melanogaster: UAS-GCaMP6S, insertions on Chromosomes II and III | Bloomington Drosophila Stock Center (BDSC) | RRID:BDSC_42746; RRID:BDSC_42749 | |
| Genetic reagent (D. melanogaster) | D. melanogaster: UAS-Kir2.1 insertion on Chromosomes II and III | BDSC | RRID:BDSC_6596; RRID:BDSC_6595 | |
| Genetic reagent (D. melanogaster) | D. melanogaster: yw; UAS-mCD8GFP/Cyo; + | Gift of L. Luo | ||
| Genetic reagent (D. melanogaster) | D. melanogaster: hlk-T2A-LexA::QFAD | This paper | ||
| Genetic reagent (D. melanogaster) | D. melanogaster: hlk-T2A-Gal4 | This paper | ||
| Genetic reagent (D. melanogaster) | D. melanogaster: LexAOp-GCaMP6s, insertion on Chromosomes II and III | BDSC | RRID:BDSC_44589; RRID:BDSC_44274 | |
| Genetic reagent (D. melanogaster) | D. melanogaster: UAS-jRGECO1a, insertion on Chromosomes II and III | BDSC | RRID:BDSC_64426; RRID:BDSC_63794 | |
| Genetic reagent (D. melanogaster) | D. melanogaster: 410-Gal4 | BDSC | RRID:BDSC_63298 | |
| Genetic reagent (D. melanogaster) | D. melanogaster: ChaT-Gal4 | Diao et al., 2015 | ||
| Genetic reagent (D. melanogaster) | D. melanogaster: UAS-sytGCaMP6s insertion on Chromosome III | BDSC | RRID:BDSC_64416 | |
| Software, algorithm | Illustrator | Adobe | RRID:SCR_010279 | |
| Software, algorithm | Python 3.7 (Anaconda) | Anaconda | RRID:SCR_018317; RRID:SCR_008394 | |
| Software, algorithm | MATLAB | MathWorks | RRID:SCR_001622 | |
| Software, algorithm | LasX | Leica | RRID:SCR_013673 | |
| Software, algorithm | NIS-Elements | Nikon | RRID:SCR_014329 | |
| Software, algorithm | Fiji, ImageJ | NIH | RRID:SCR_002285 |
Additional files
-
Supplementary file 1
Pupal neuromuscular anatomy.
- https://cdn.elifesciences.org/articles/68656/elife-68656-supp1-v2.docx
-
Supplementary file 2
Variability of phase parameters.
- https://cdn.elifesciences.org/articles/68656/elife-68656-supp2-v2.docx
-
Transparent reporting form
- https://cdn.elifesciences.org/articles/68656/elife-68656-transrepform-v2.docx
Download links
A two-part list of links to download the article, or parts of the article, in various formats.
Downloads (link to download the article as PDF)
Open citations (links to open the citations from this article in various online reference manager services)
Cite this article (links to download the citations from this article in formats compatible with various reference manager tools)
Pupal behavior emerges from unstructured muscle activity in response to neuromodulation in Drosophila
eLife 10:e68656.
https://doi.org/10.7554/eLife.68656


