Principles of RNA recruitment to viral ribonucleoprotein condensates in a segmented dsRNA virus
- Max Planck Institute of Biochemistry, Germany
- Department of Biochemistry, University of Cambridge, United Kingdom
- Molecular Immunology Laboratory, International Centre for Genetic Engineering and Biotechnology, Italy
- Department of Physics and Center for Nanoscience, Ludwig Maximilian University, Germany
Figures
Figure 1 with 2 supplements
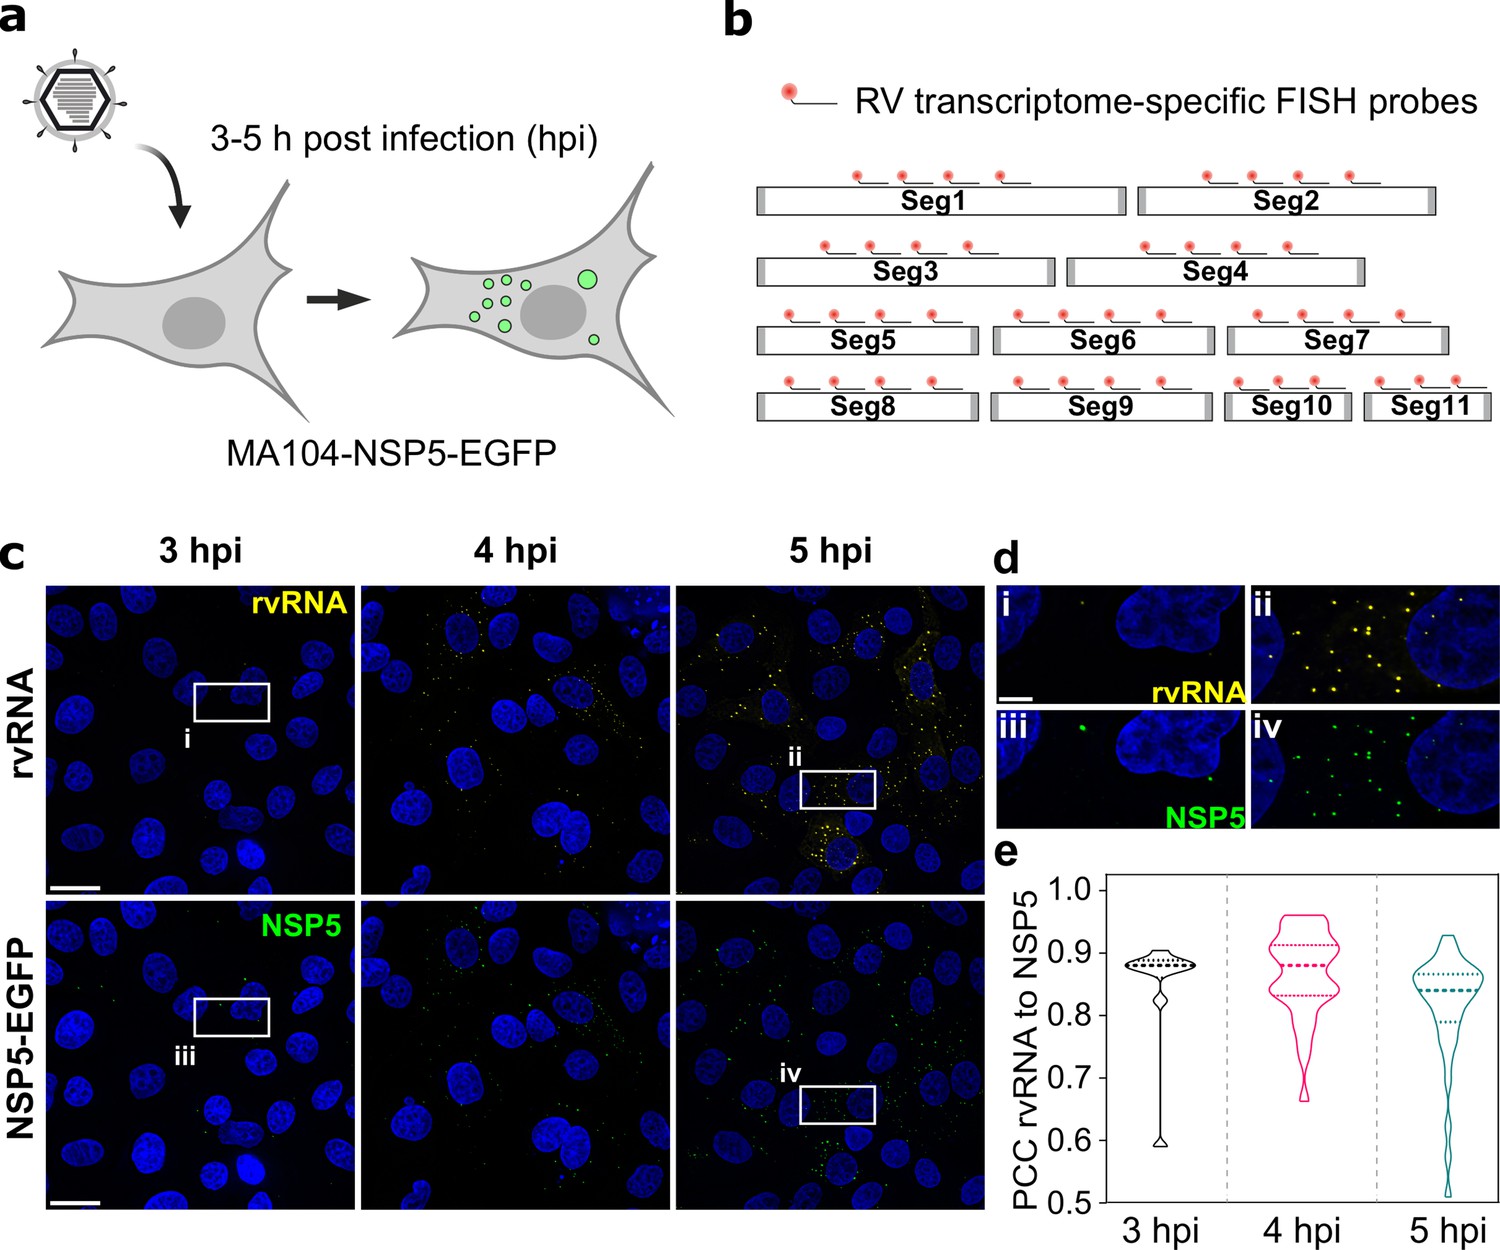
RNA ccumulation during Rotavirus infection.
(a) Experimental design for detecting EGFP-tagged viroplasms during early infection (3–5 hpi) stages. (b) Schematics of the FISH probe design for detecting all 11 RV transcripts. A pooled set of 3–4 segment-specific probes labelled with Quasar570 dye were used for visualising RV transcripts in EGFP-tagged viroplasms. (c) RV RNA accumulation in viral factories during early infection. Top: RV transcripts (yellow) visualized by smFISH using a combined set of 3–5 segment-specific probes targeting each genomic transcript. Bottom: NSP5-EGFP-tagged viral factories (green). Images represent maximum intensity Z-projections acquired using identical settings and brightness levels for both channels. DAPI-stained nuclei are shown in blue. Scale bars, 25 µm. (d) RV transcripts and NSP5-EGFP-specific signals shown in the white box in panel (c). Note the low intensity of the RNA and EGFP signals during early infection stages that increase by 5 hpi. Scale bar, 5 µm. (e) Pearson’s correlation coefficients (PCCs) of colocalising NSP5-EGFP-tagged viral factories and RV transcripts, as shown above in panel (d). Dashed and dotted lines represent median and quartile values of PCCs, respectively. Each data point represents the PCC value calculated for a single cell. N=10 (3 hpi), N=31 (4 hpi), N=38 (5 hpi).
-
Figure 1—source data 1
Pearson’s correlation coefficients (PCCs) of colocalising NSP5-EGFP-tagged viral factories and RV transcripts.
- https://cdn.elifesciences.org/articles/68670/elife-68670-fig1-data1-v2.xlsx
-
Figure 1—source data 2
Signal intensity distribution histograms for GAPDH transcripts and RV transcript foci.
- https://cdn.elifesciences.org/articles/68670/elife-68670-fig1-data2-v2.zip
Figure 1—figure supplement 1
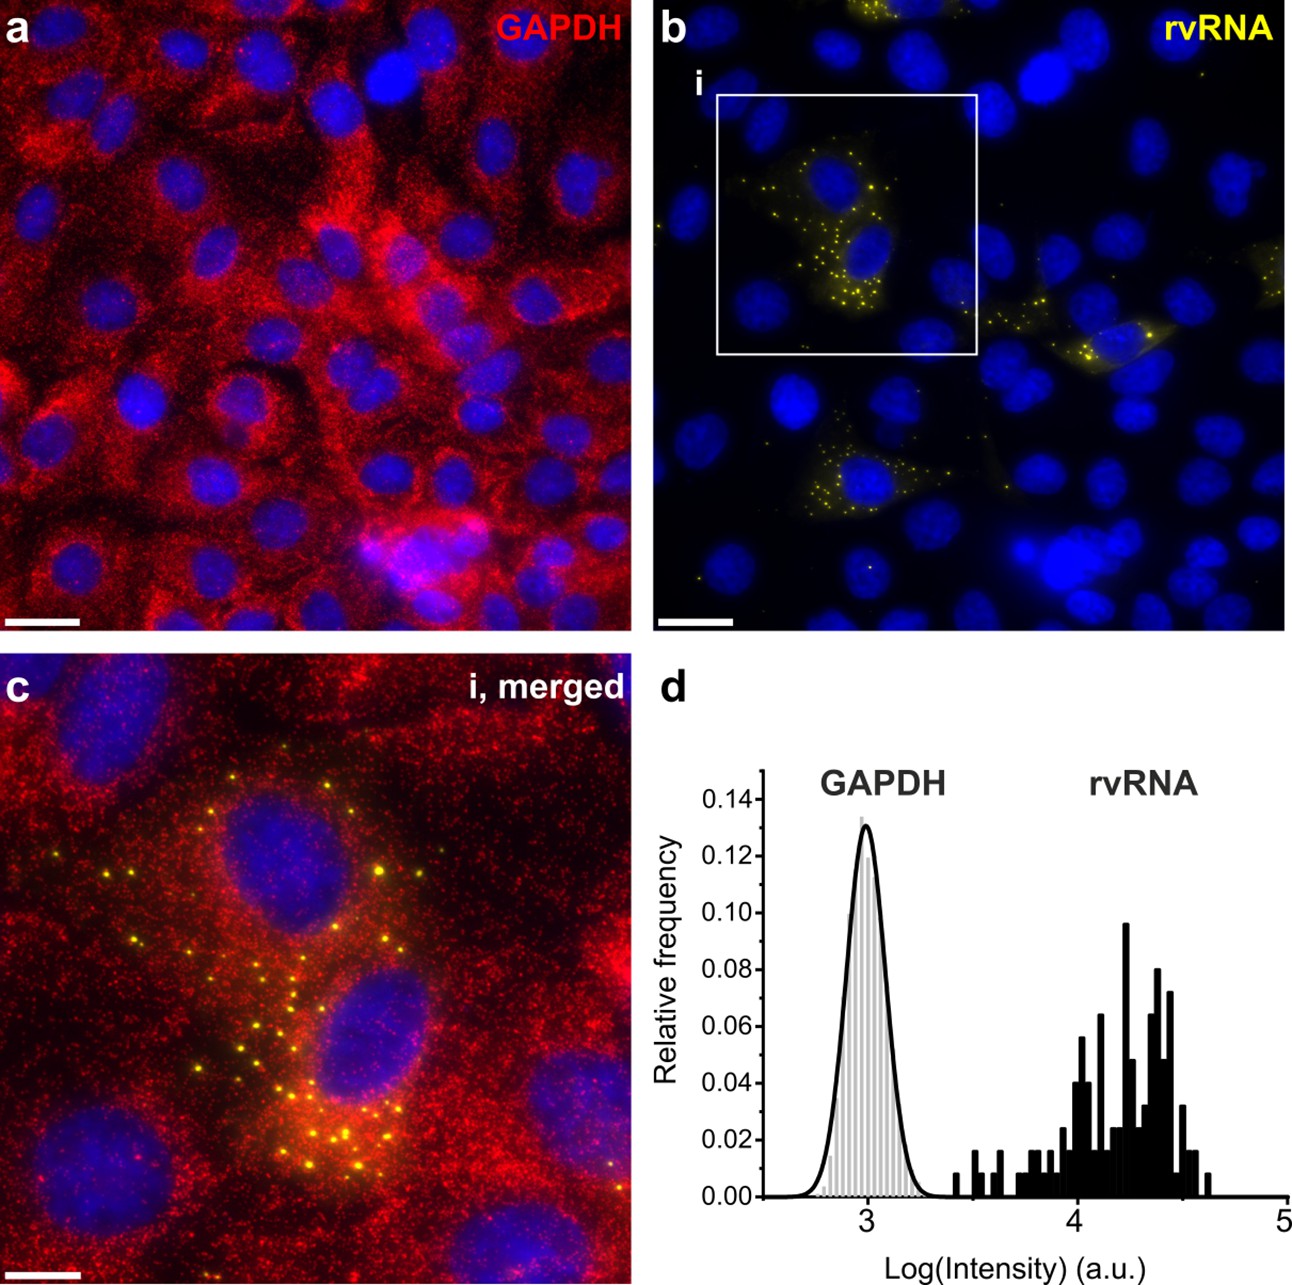
smFISH of GAPDH mRNA and RV transcripts.
GAPDH mRNA red, (a) and RV transcripts yellow, (b) imaged using two distinct sets of FISH probes targeting GAPDH mRNA (Quasar 670 dye-labelled probes) and RV transcripts (Quasar 570 dye-labelled probes), as shown in Figure 1a. At 4 hpi, RV transcripts form distinct, high intensity foci. Scale bars, 25 μm. (c) A close-up view of the highlighted area (i). Scale bar, 10 μm. (d) Signal intensity distribution histograms for GAPDH transcripts and RV transcript foci (rvRNA).
Figure 1—figure supplement 2
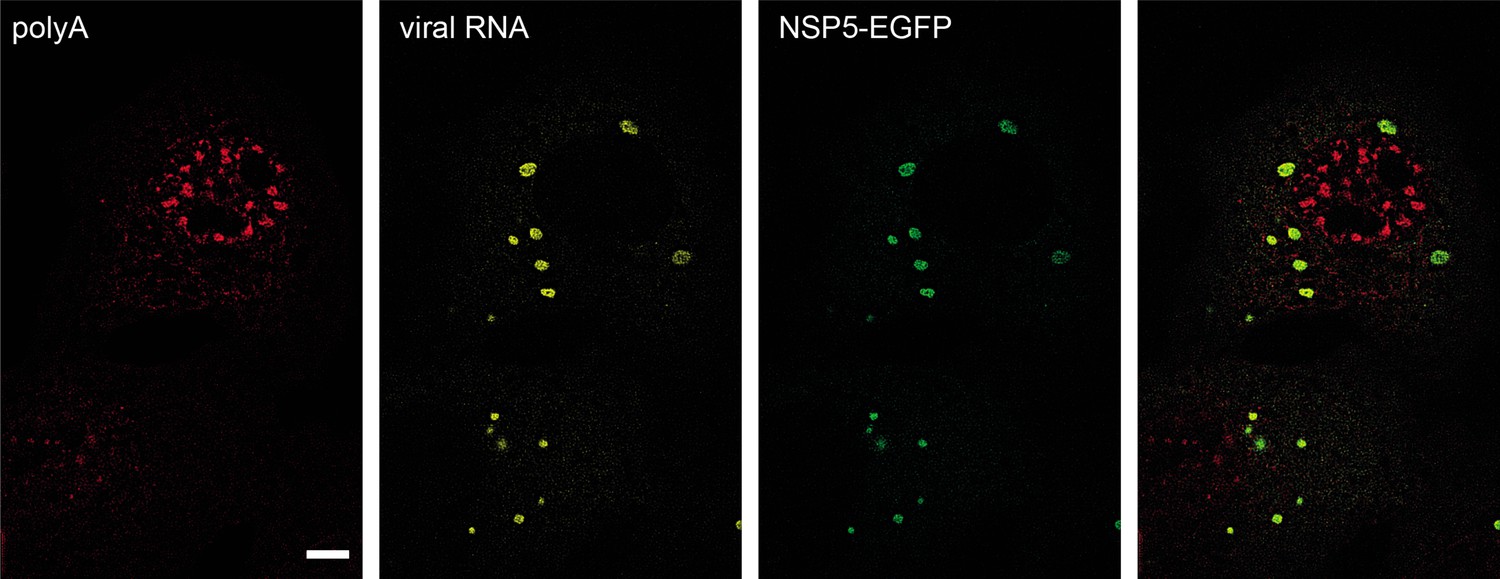
Viroplasms accumulate RV transcripts but not polyadenylated mRNAs.
FISH visualisation of polyadenylated transcripts (oligo (dT)30-ATTO647N probes, see Methods, red signal) and RV transcripts (Seg4, yellow) at 4 hpi. NSP5-EGFP-labelled viroplasms contain RV transcripts, while non-viral polyadenylated RNAs seemingly do not partition to viroplasms. Scale bar, 10 μm.
Figure 2 with 2 supplements
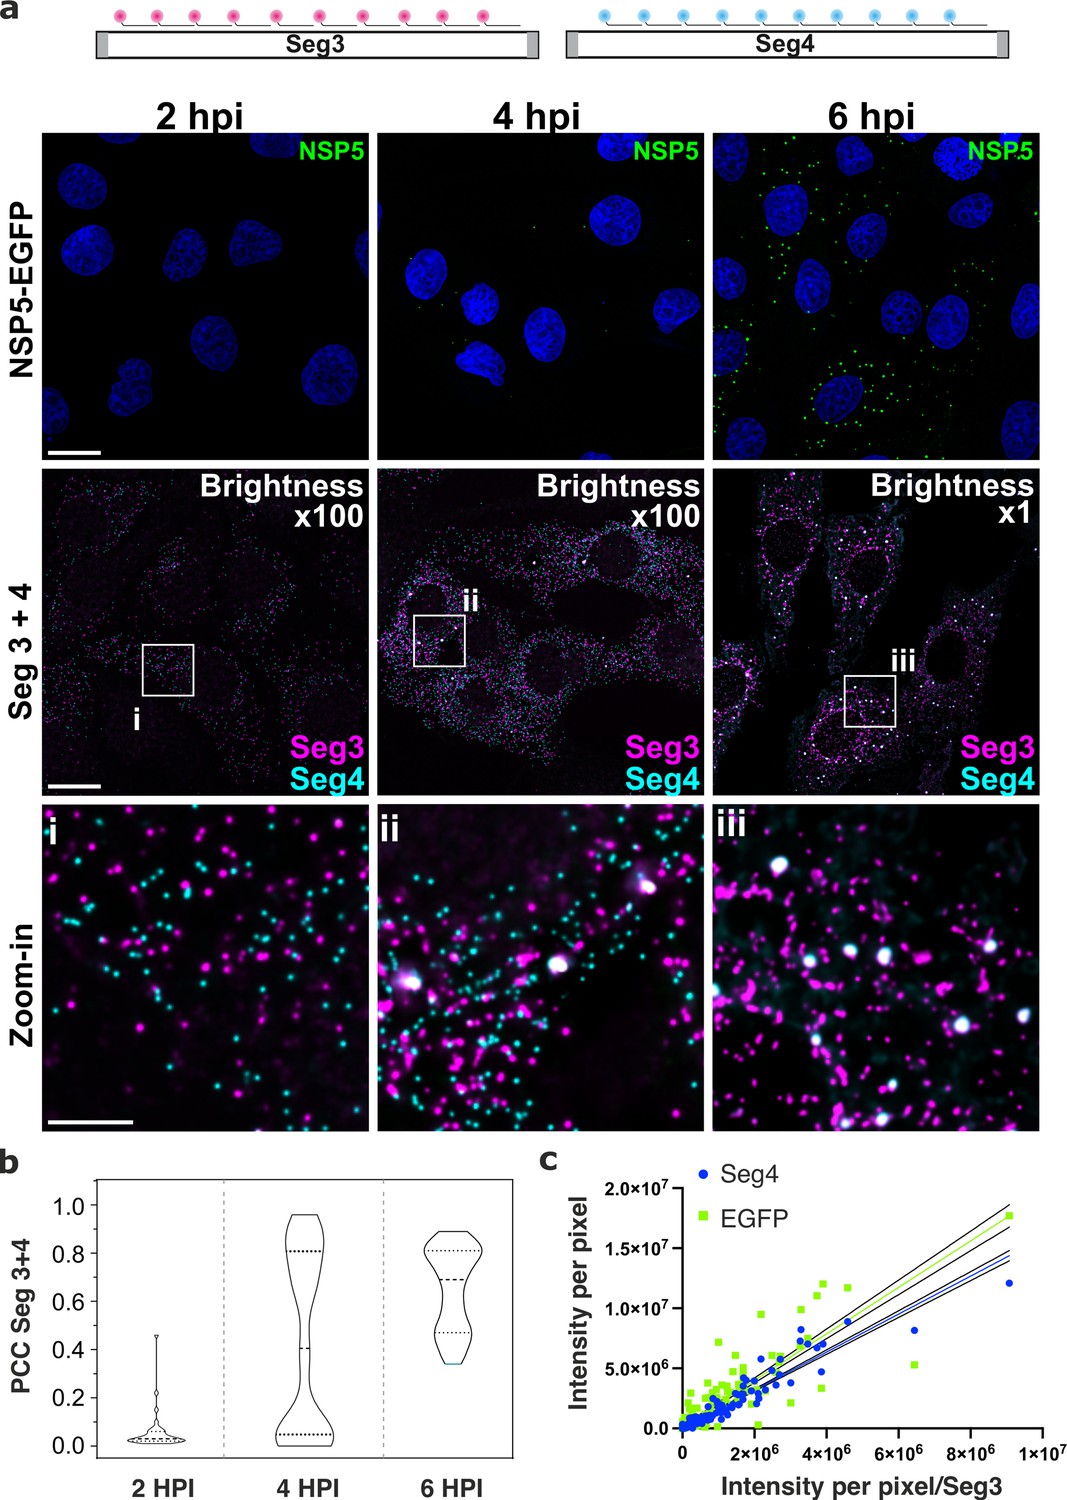
Segment-specific transcript accumulation during Rotavirus infection.
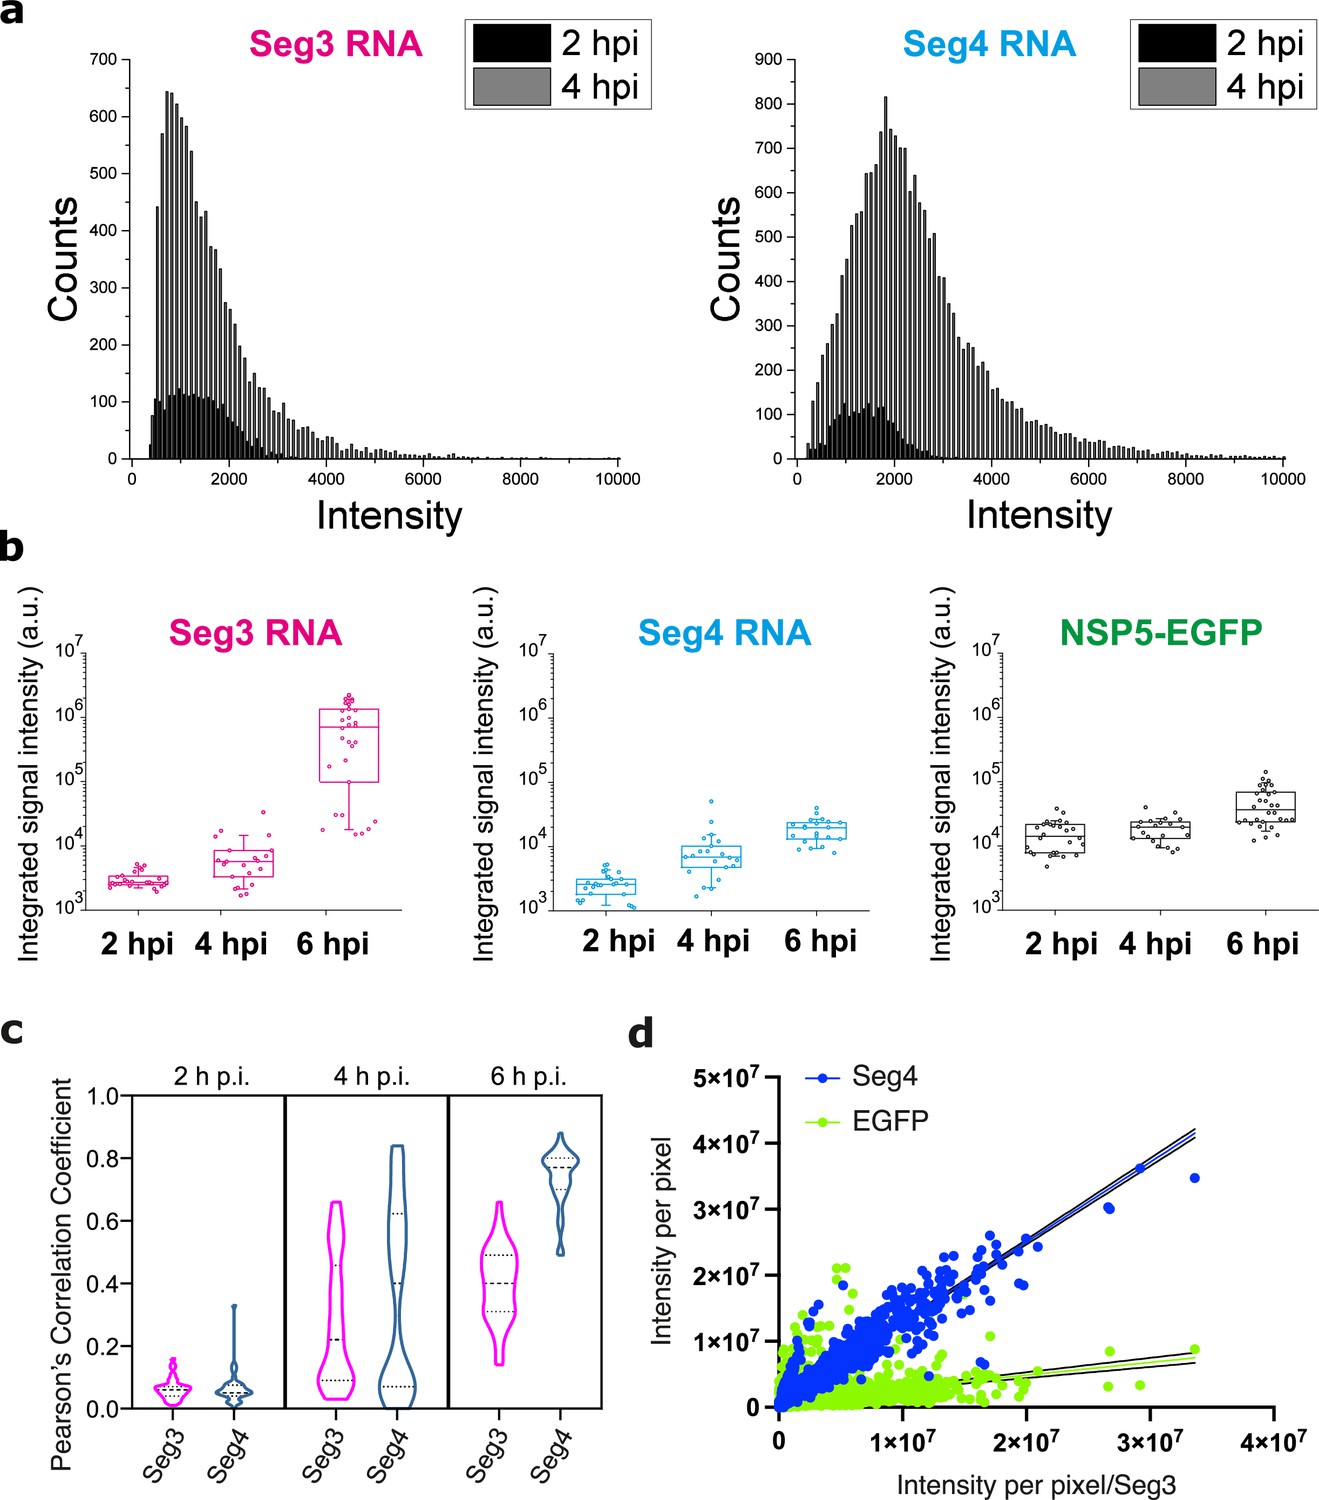
(a) smFISH of RV transcripts at early infection time points (2–6 hpi) using segment-specific probes. Two sets of 48 gene-specific probes were designed for each Seg3 (magenta, Quasar570) and Seg4 (cyan, Quasar670) transcripts. Top: NSP5-EGFP-tagged viral factories (green), nuclei (blue). Middle: Seg3 (magenta) and Seg4 (cyan) RNA signals in the ROIs shown above, with colocalising Seg3 and Seg4 RNAs (white). As the amount of each transcript increases during the course of infection, brightness settings were adjusted accordingly to reveal single transcripts (Brightness x100 for 2–4 hpi and 1 x for 6 hpi). Scale bars, 25 µm and 5 µm (zoom-in). (b) Colocalisation of Seg3 and Seg4 transcripts. Pearson’s correlation coefficients (PCCs) of colocalising Seg3 and Seg4 transcripts. Dashed and dotted lines represent median and quartile values of PCCs, respectively. Each data point represents the PCC value calculated for a single cell. N=37 (2 hpi), N=62 (4 hpi), N=51 (6 hpi). Statistical analysis of data was performed using Kolmogorov-Smirnov test. At the 0.01 level, the observed distributions are significantly different. (c) Correlation between Seg4/EGFP and Seg3 RNA signals in RV-infected cells at 4 hpi. Integrated intensities per detected spot for Seg4 RNA, NSP5-EGFP and Seg3 RNAs are plotted to reveal the linear correlation between the signal intensities for each RNA examined, as the intensity of NSP5-EGFP signal increases. Linear regression lines (solid) with 95% CI (dotted lines) are shown for Seg4 RNA (cyan, R2=0.93) and EGFP (green, R2=0.8) intensity signals.
-
Figure 2—source data 1
Colocalisation of Seg3 and Seg4 transcripts.
Pearson’s correlation coefficients (PCCs) of colocalising Seg3 and Seg4 transcripts.
- https://cdn.elifesciences.org/articles/68670/elife-68670-fig2-data1-v2.csv
-
Figure 2—source data 2
Seg4/EGFP and Seg3 RNA signal intensities in RV-infected cells at 4 HPI.
- https://cdn.elifesciences.org/articles/68670/elife-68670-fig2-data2-v2.zip
-
Figure 2—source data 3
Raw signal intensity distributions (counts) of diffraction-limited smFISH-detected spots were derived for Seg3 (Quasar 670 dye-labelled probes) and Seg4 (Quasar 570 dye-labelled probes) transcripts at 2 and 4 hpi.
Each spot was detected after applying a constrained deconvolution algorithm (see Methods).
- https://cdn.elifesciences.org/articles/68670/elife-68670-fig2-data3-v2.xlsx
-
Figure 2—source data 4
Integrated signal intensities of Seg3, Seg4 transcripts and NSP5-EGFP-tagged viral condensates at different infection time points.
Integrated signals were calculated for single cells separately, N=24 (2 hpi), N=21 (4 hpi), N=30 (6 hpi).
- https://cdn.elifesciences.org/articles/68670/elife-68670-fig2-data4-v2.zip
-
Figure 2—source data 5
Pearson’s correlation coefficients (PCCs) calculated for a single cell.
N=37 (2 hpi), N=62 (4 hpi), N=51 (6 hpi).
- https://cdn.elifesciences.org/articles/68670/elife-68670-fig2-data5-v2.xlsx
-
Figure 2—source data 6
Seg4/EGFP and Seg3 RNA signal intensities in RV-infected cells at 6 hpi.
- https://cdn.elifesciences.org/articles/68670/elife-68670-fig2-data6-v2.txt
-
Figure 2—source data 7
Integrated intensities for Seg4 RNA and Seg3 RNA for shNSP2 and WT MA104 cells.
- https://cdn.elifesciences.org/articles/68670/elife-68670-fig2-data7-v2.xlsx
-
Figure 2—source data 8
Western blot of NSP2 from RV-infected cells (WT MA104 and NSP2-specific shRNA-expressing MA104 cells).
MA104 cells stably expressing shRNA targetting NSP2 transcripts were infected at MOI = 1, and cell lysates were analysed for NSP2 expression by western blotting at 8 hpi.
- https://cdn.elifesciences.org/articles/68670/elife-68670-fig2-data8-v2.zip
Figure 2—figure supplement 1
Analysis of Seg3 and Seg4 transcript accumulation and localisation in RV-infected cells.
(a) Signal intensity distributions of Seg3 and Seg4 transcript foci at 2 hpi and 4 hpi. Raw signal intensity distributions (counts) of smFISH-detected spots were derived for Seg3 and Seg4 transcripts at 2 and 4 hpi. Each spot was detected after applying a constrained deconvolution algorithm (see Methods). (b) Changes in the integrated signal intensities for Seg3 (magenta), Seg4 (cyan) RNAs and EGFP-tagged viroplasms (green) over the course of RV infection. Counts were calculated for single cells separately, N=24 (2 hpi), N=21 (4 hpi), N=30 (6 hpi). (c) Colocalisation of EGFP-tagged viroplasms with Seg3 (magenta) and Seg4 (cyan) transcripts over the course of RV infection. Median and quartile values of the calculated Pearson’s correlation coefficients (PCCs) are shown as dashed and dotted lines, respectively. Each data point represents the PCC value calculated for a single cell. N=37 (2 hpi), N=62 (4 hpi), N=51 (6 hpi). (d) Correlation between Seg4 RNA and viroplasmic EGFP signals vs Seg3 RNA signals at 6 hpi. Integrated intensities per pixel for Seg4 RNA (blue) and NSP5-EGFP (green) are plotted as a function of intensities for Seg3 RNAs. There is a strong correlation between the signal intensities for Seg3 and Seg4 RNAs at 6 hpi, and much lower correlation between the intensities of NSP5-EGFP/RNA signals. Linear regression lines (solid) with 95% CI (dotted lines) are shown for Seg4 RNA (cyan, R2=0.9) and EGFP (green, R2=0.13) intensity signals.
Figure 2—figure supplement 2
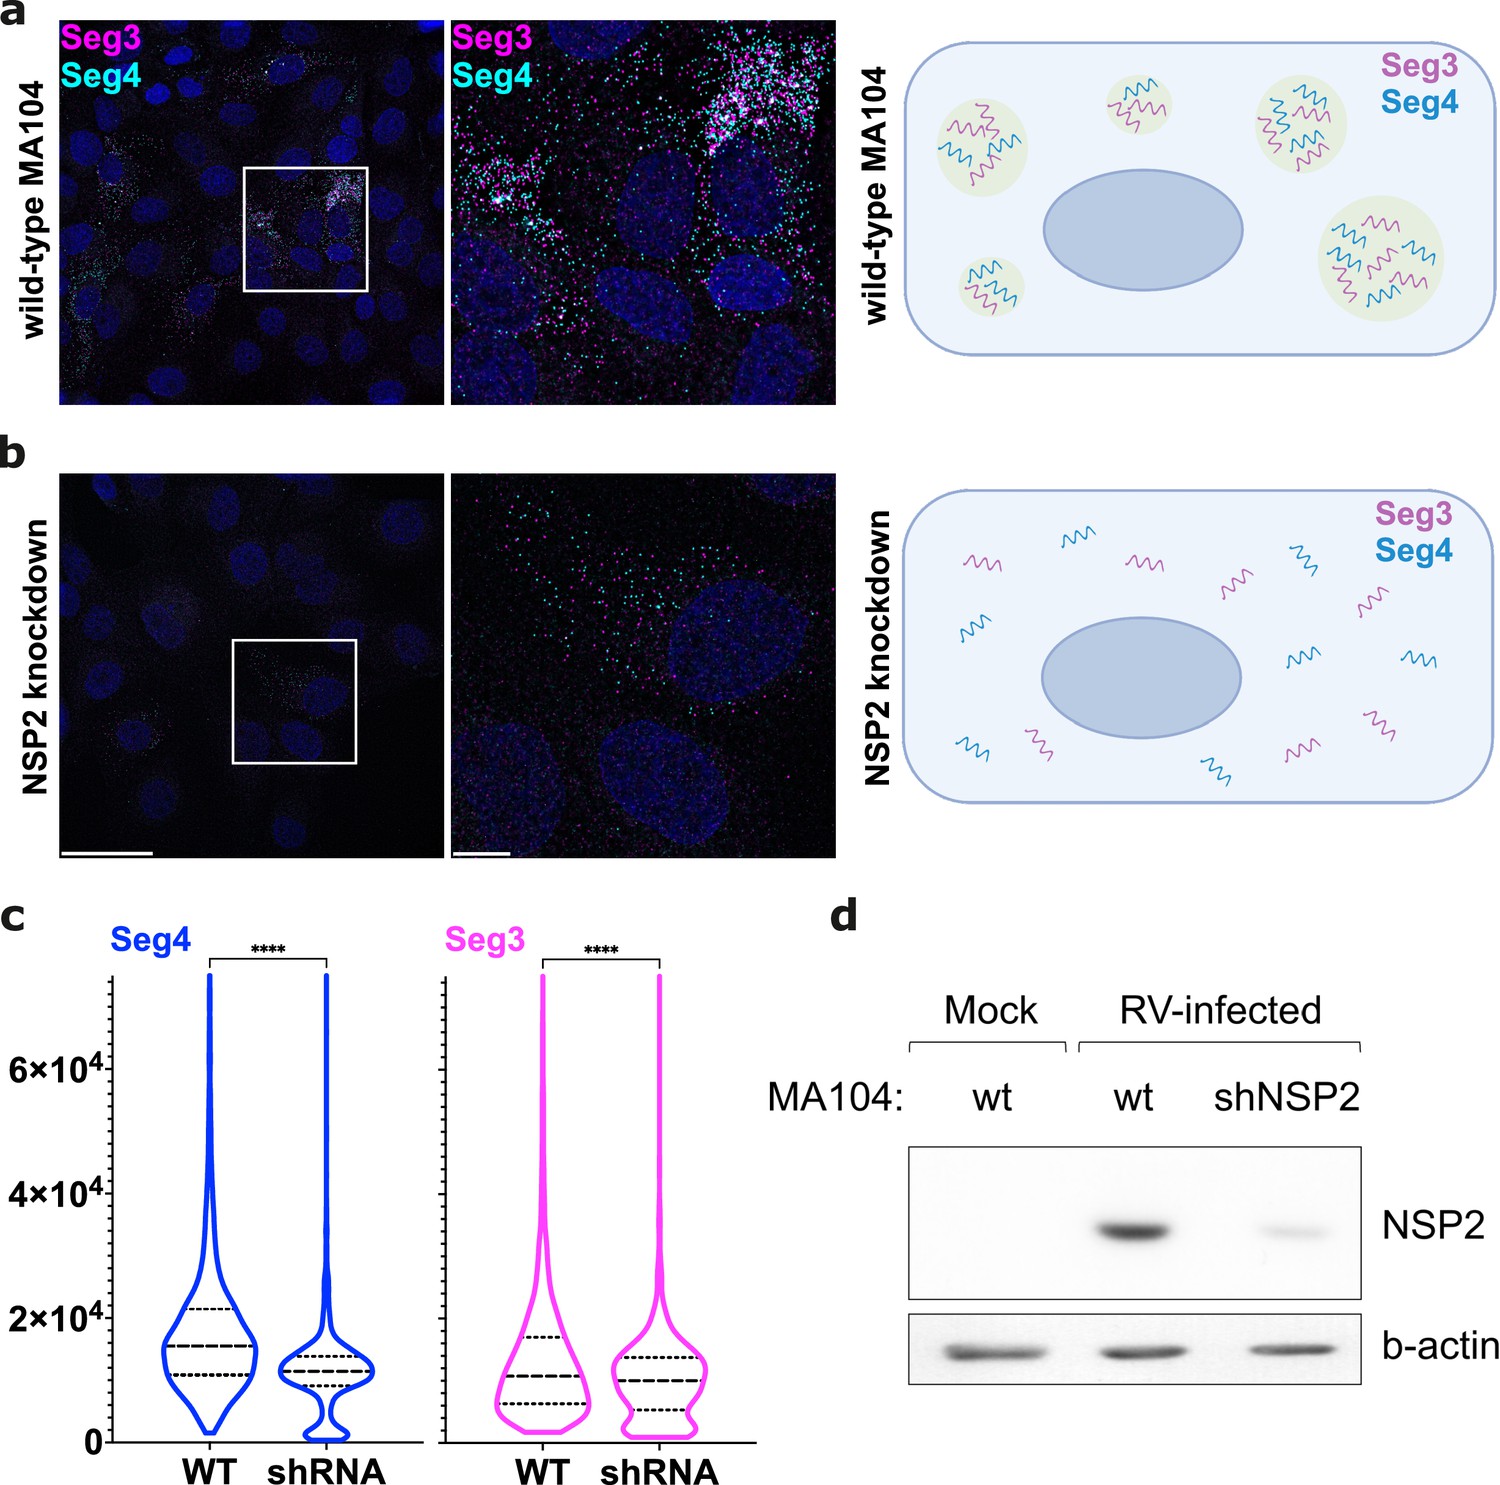
NSP2 knockdown in MA104 cells results in the apparent loss of RV RNA clustering.
(a) Wild-type MA104 cells infected with RV (MOI = 1) at 6 hpi, with a schematic showing Seg3 and Seg4 RNA clustering. (b) MA104 cells expressing shRNAs that target NSP2 (Methods) were infected with RVs as described in panel (a). Note that in both cases single Seg3 and Seg4 transcripts accumulate in the cytosol, while the signal intensity of RNAs in case of NSP2 knockdown is lower. Scale bars, 50 μm (left), 10 μm (middle and right panel). (c) Violin plots showing distributions of integrated intensities per pixel for Seg4 RNA (blue) and Seg3 RNA (magenta) from images shown in (a) and (b). Median and quartile values are shown as dashed and dotted lines, respectively. Depletion of NSP2 causes a significant decrease of the overall RNA signal intensity (P<0.0001 assessed by an unpaired t-test with Welch’s correction for both Seg 3 and Seg4 RNA signals). Note that the median value for Seg3 signal remains broadly unchanged upon NSP2 depletion. (d) Western blot of NSP2 from RV-infected cells (WT MA104 and NSP2-specific shRNA-expressing MA104 cells). MA104 cells stably expressing shRNA targetting NSP2 transcripts were infected at MOI = 1, and cell lysates were analysed for NSP2 expression by western blotting at 8 hpi.
Figure 3
DNA-PAINT analysis of the RV RNA oligomerisation.
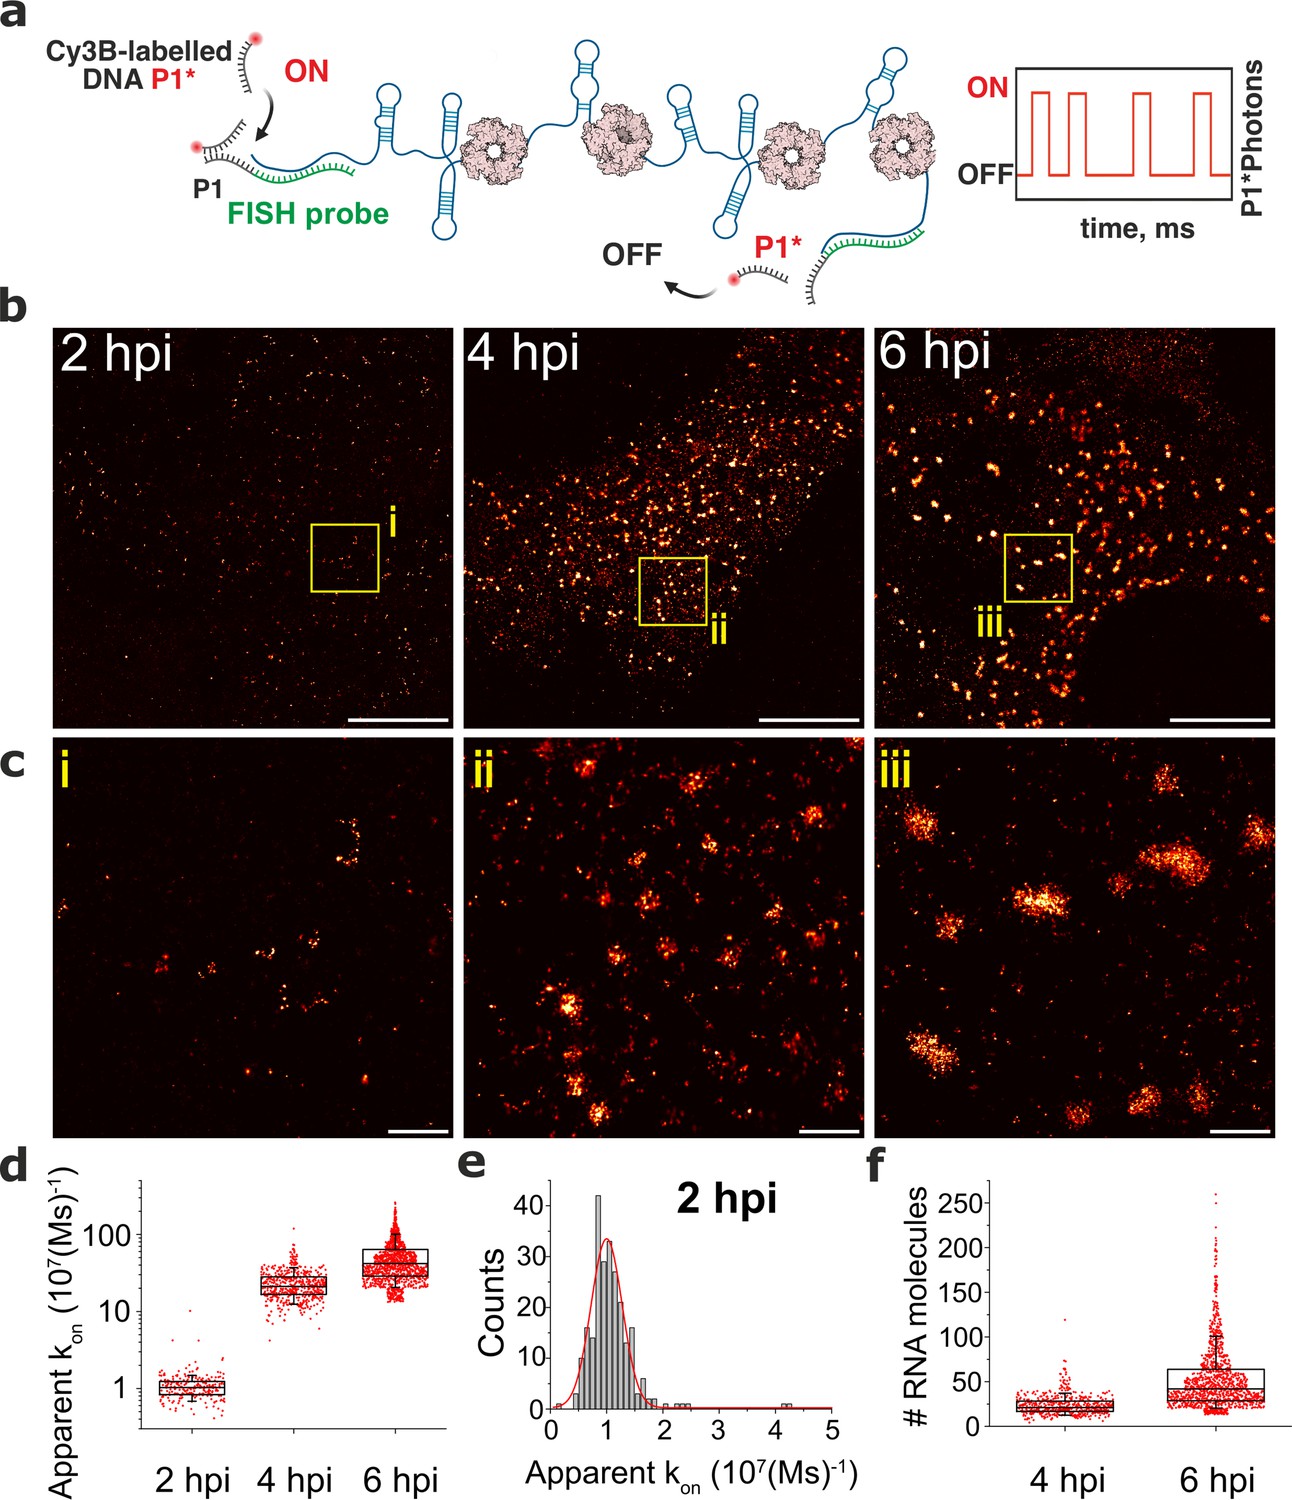
(a) Schematics of DNA-PAINT imaging of RV transcripts. RNA hybridisation is used to install unique DNA ‘docking’ P1 strands for Seg3 RNA targets. These P1 sequences bind to complementary Cy3B-labelled DNA ‘imager’ strands (denoted P1*). Transient binding of P1* to accessible P1 sites on Seg3 RNAs is used for stochastic super-resolution reconstruction of the RNA targets. Only specific binding events (i.e. fully complementary DNA imager-docking strand) give rise to characteristic ‘on/off’ times, allowing discrimination from non-specific binding events. (b) DNA-PAINT super-resolution reconstruction of Seg3 transcripts at 2, 4, and 6 hpi. (c) Zoomed-in regions of Seg3 RNA structures highlighted in (b). (d) Quantitative PAINT (qPAINT) analysis of the RNA structures shown above. values were calculated for each selected structure assuming , where is the imager strand concentration and the dark time between binding events (cimager = 1 nM at 2 hpi; 125 pM at 4 hpi and 100 pM at 6 hpi). Each point represents the apparent kon value for an RNA structure that is directly proportional to the relative number of the FISH probe binding sites, and thus reflects the number of transcripts within. (e) Unimodal distribution of kon values calculated for single Seg3 transcripts detected at 2 hpi. The resulting average kon value calculated from a Gaussian fit is 10–5 (Ms)–1, corresponding to a single Seg3 transcript. (f) Estimated numbers of Seg3 transcripts (mean ± SD) at 4 hpi and 6 hpi are 24±12 (x̃=21) and 53±36 (x̃=42), respectively. N=245 (2 hpi), N=515 (4 hpi), N=1181 (6 hpi). Scale bars, 5 µm (b), 500 nm (c).
-
Figure 3—source data 1
The apparent kon value for RNA structures detected at 2, 4, and 6 hpi.
(e) Unimodal distribution of kon values calculated for single Seg3 transcripts detected at 2 hpi. The resulting average kon value calculated from a Gaussian fit is 10–5 (Ms)–1, corresponding to a single Seg3 transcript. (f) Estimated numbers of Seg3 transcripts (mean ± SD) at 4 hpi and 6 hpi are 24±12 (x̃=21) and 53±36 (x̃=42), respectively. N=245 (2 hpi), N=515 (4 hpi), N=1181 (6 hpi). Scale bars, 5 µm (b), 500 nm (c).
- https://cdn.elifesciences.org/articles/68670/elife-68670-fig3-data1-v2.xlsx
Figure 4 with 1 supplement
Universal DNA exchange-smFISH approach for single-cell imaging of the RV transcriptome.
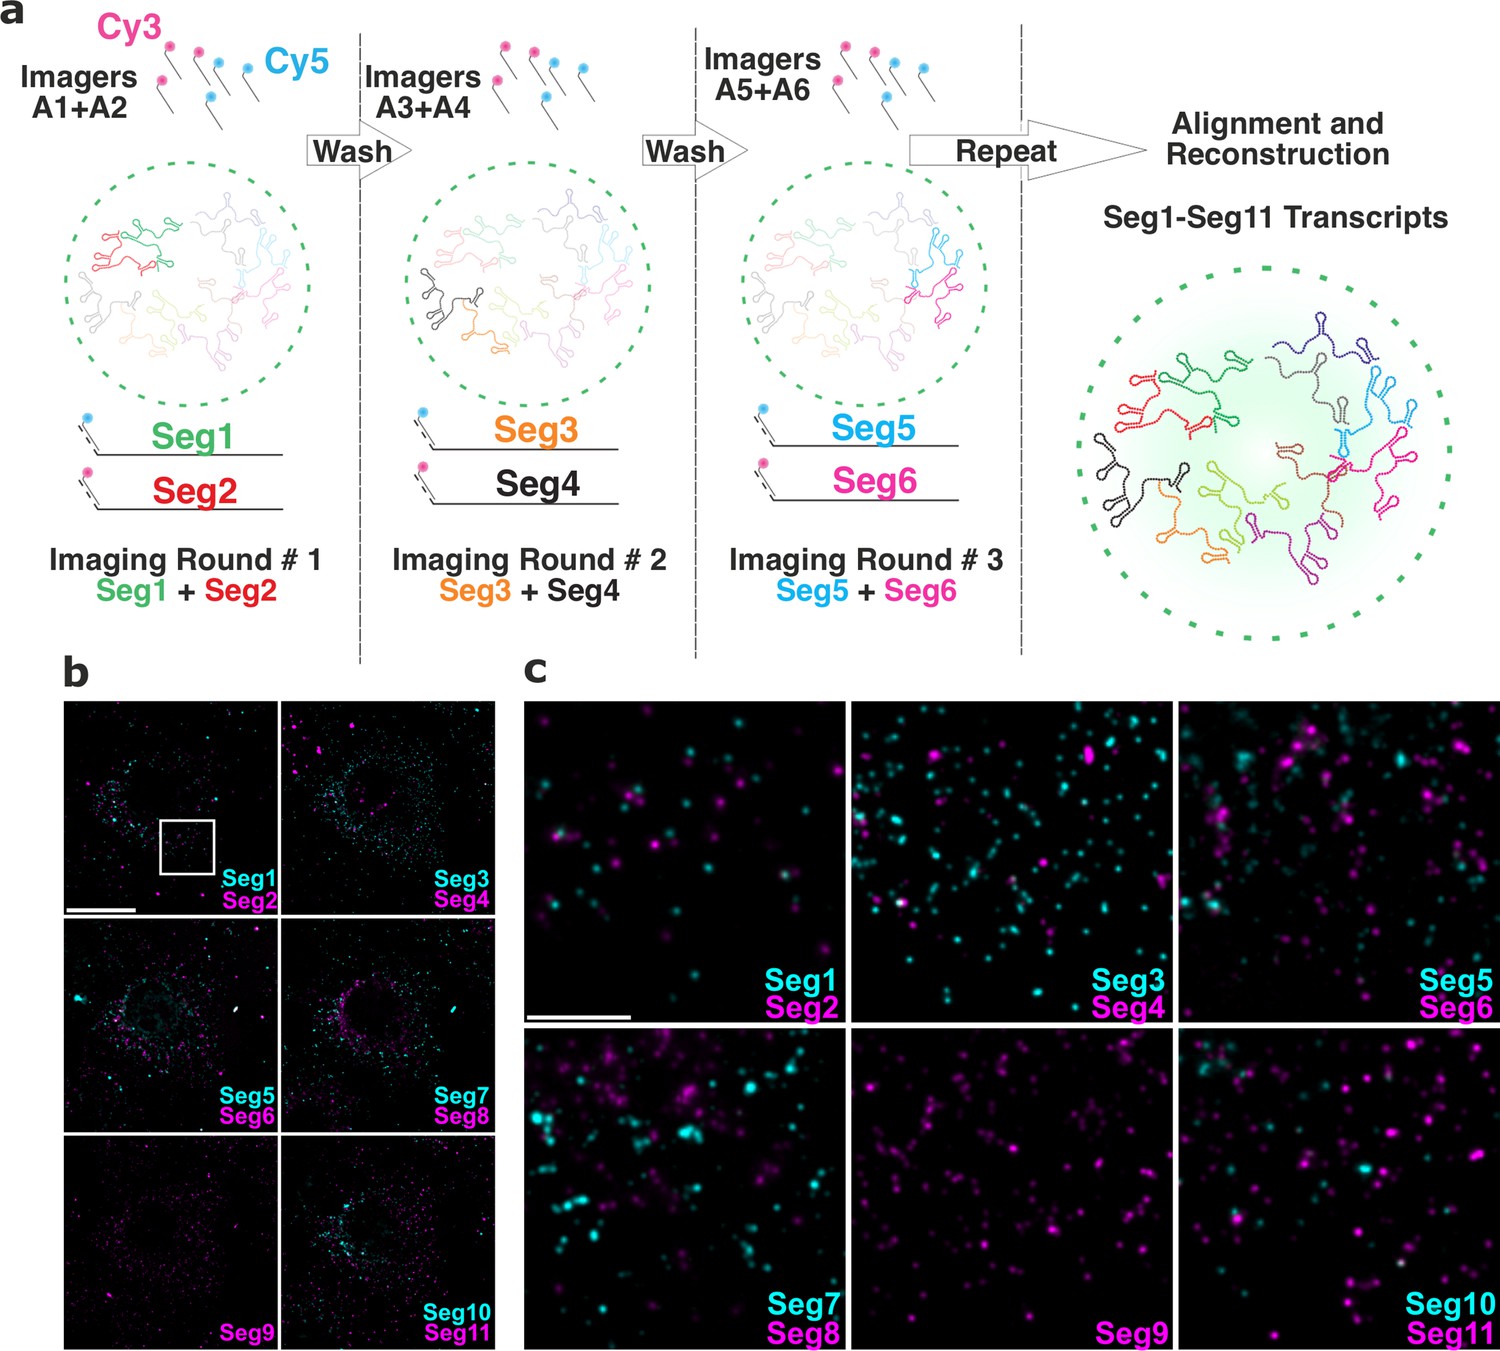
(a) Schematics of the Universal DNA Exchange-smFISH approach (UDEx-FISH). FISH probes targeting different RNA segments are extended with 12 nucleotide-long orthogonal DNA sequences A1-An (DNA ‘handles’). Cy3 and Cy5-dye-modified DNA sequences (A1–An, ‘Imagers’) complementary to their respective handles can rapidly (<1 min) and stably hybridise with their segment-specific FISH probes RNA. Non-hybridised imagers are washed away and the two RNA targets, as well as NSP5-EGFP tagged viroplasms and nuclei are imaged in each imaging round (see Methods), allowing the next imaging round to take place. The imaging procedure is repeated until all targets of interest are recorded without affecting the quality of the fixed sample or loss of the RNA signal intensity due to photobleaching. (b) RV Transcriptome during early infection stage (2 hpi). Images were taken with same acquisition parameters for each imaging round. Scale bar, 20 µm. (c) Zoomed-in images of the highlighted areas shown in (b). Scale bar, 5 µm.
-
Figure 4—source data 1
The integrated signal intensity after each successive round of imager dissociation and re-association.
Each image plane for each channel was recorded with the same image acquisition parameters.
- https://cdn.elifesciences.org/articles/68670/elife-68670-fig4-data1-v2.xlsx
Figure 4—figure supplement 1
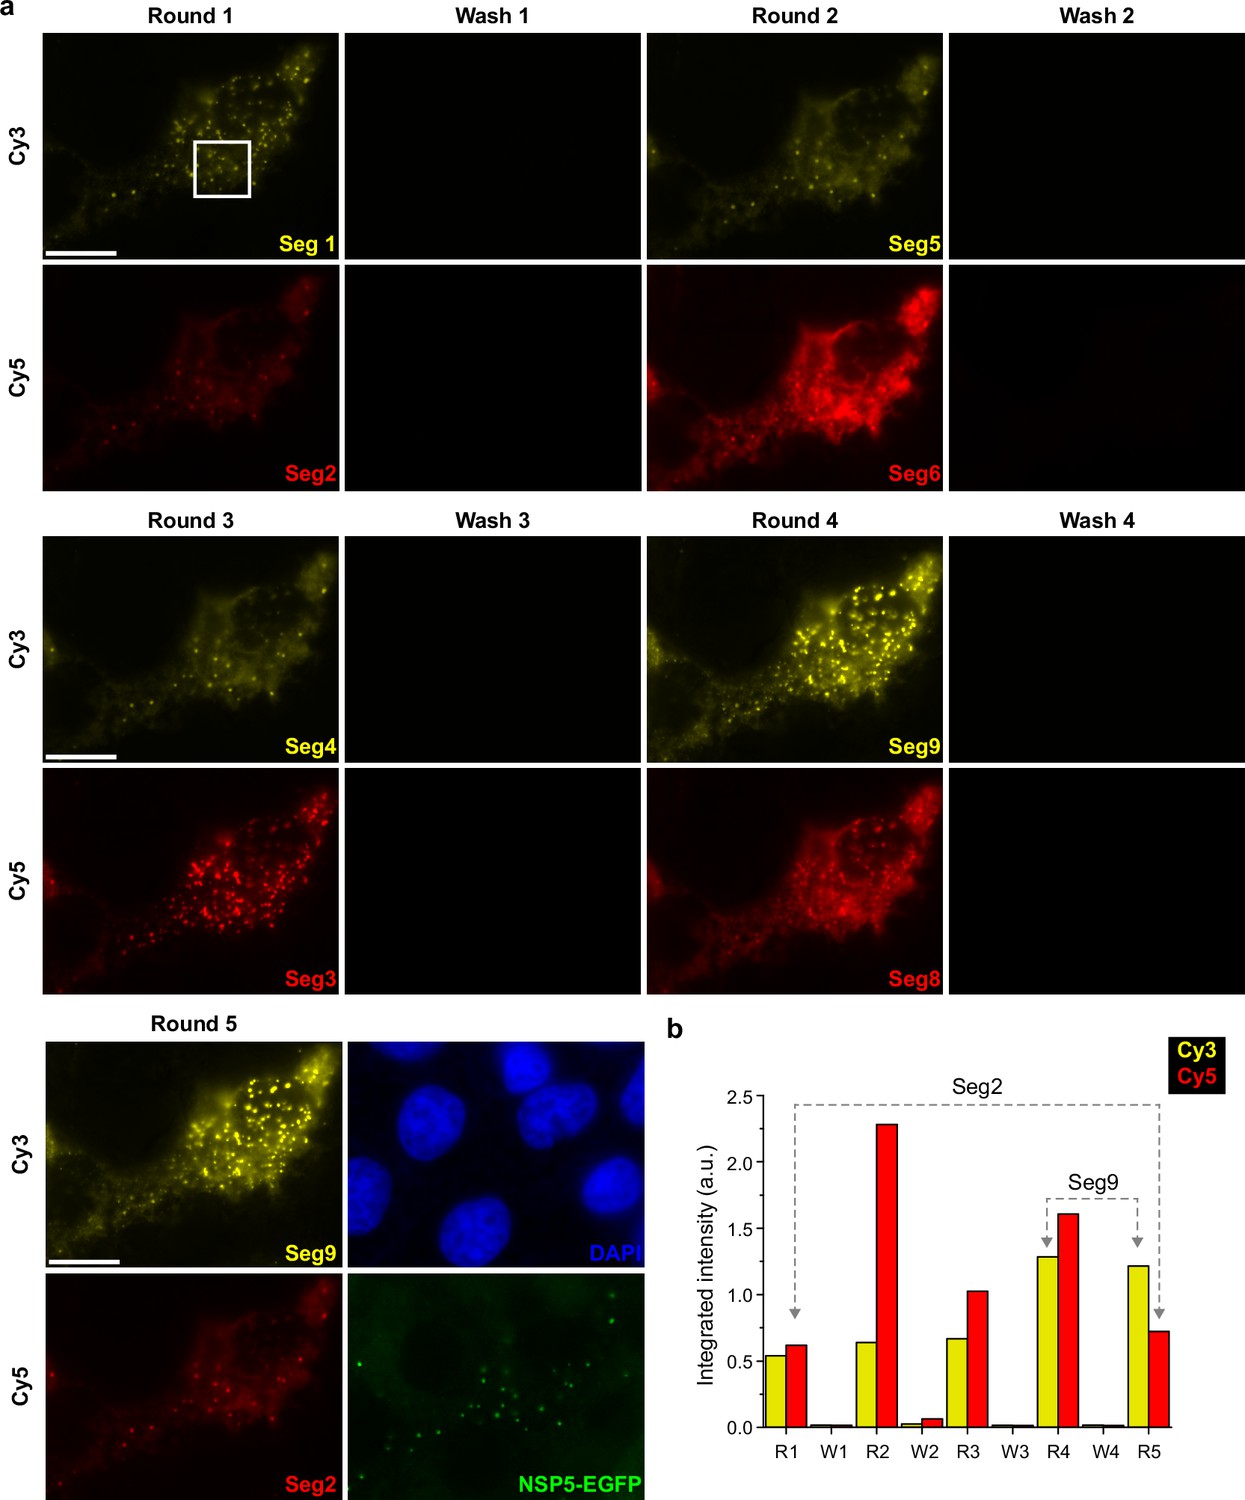
Validation of the UDEx-FISH approach in RV-infected MA104 cells.
(a) Washing and labelling efficiencies of smFISH probes with orthogonal DNA handles designed for Segments 1–9. After each wash step, no residual RNA signal was detected for each segment tested in this experiment. Seg2 target was re-imaged iteratively to ensure that multiple washing steps did not dissociate FISH probes pre-hybridized to a target RNA. (b) The integrated signal density after each successive round of imager dissociation and re-association. Each image plane for each channel was recorded with the same image acquisition parameters. Brightness levels were set identical for each colour channel for all the images shown. Scale bars, 15 µm.
Figure 5 with 1 supplement

Single-cell analysis of the RV transcriptome.
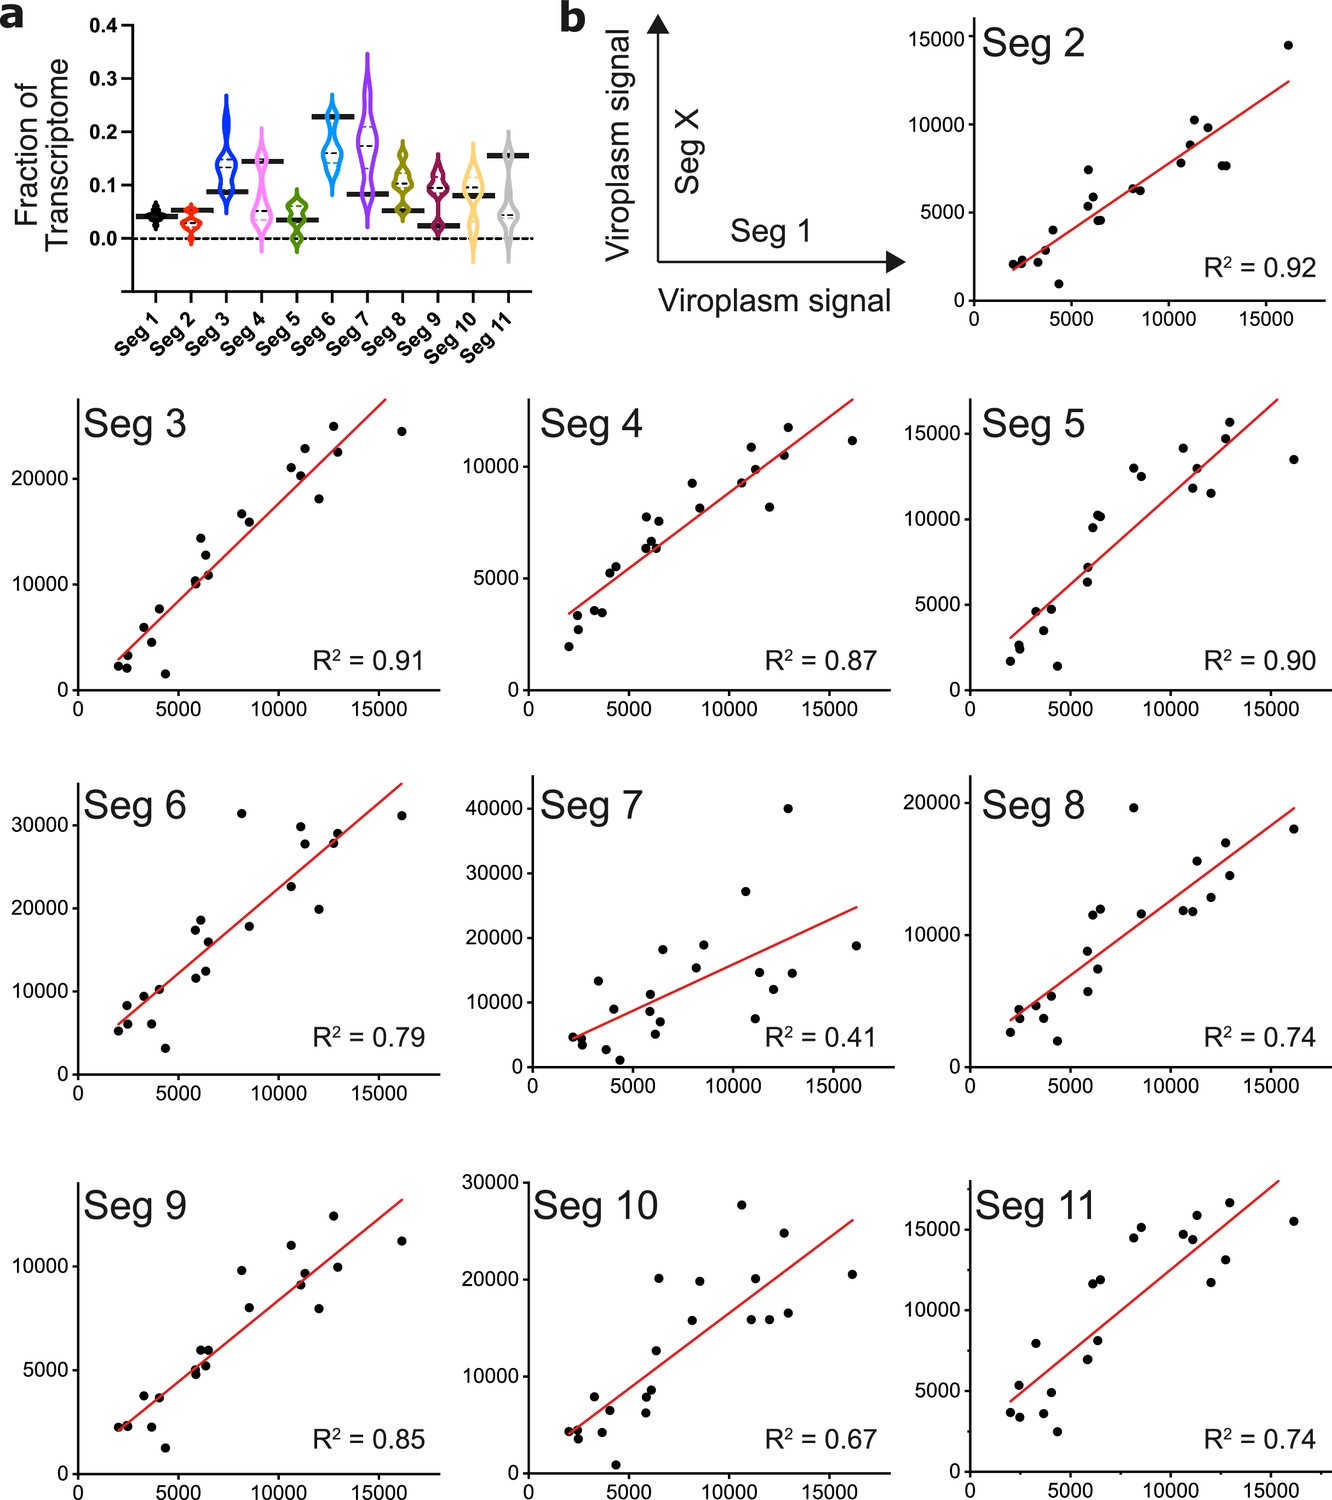
(a) In situ analysis of the RV transcriptome at 6 hpi. Scale bar, 20 µm. (b) Zoomed-in images of the highlighted regions containing viroplasms and 11 distinct RNA targets. Scale bar: 5 µm. (b) The proportion of RNA-seq reads assigned to the annotated protein-coding transcriptome of MA104 cells infected with RVA strain RF at 6 hpi. The RVA transcriptome represented ~17% of total reads (Methods), with the remaining 82.99% reads mapped onto MA104 protein-coding transcriptome. Bar plot shows the relative fractions of individual RV transcripts in the RV transcriptome at 6 hpi (Seg1-Seg11). (c) Single-cell analysis of the relative fractions of each segment-specific transcript (N=15 cells) estimated from the UDEx-FISH images data shown in panel (a). (d) Relative RV transcript abundance in viroplasms. Each data point represents the ratio of the viroplasmic signal density (per pixel) to the signal density of the corresponding cell. Higher values indicate stronger viroplasmic accumulation of viral transcripts. Lines, boxes, and whiskers represent the median, quartiles, and 5–95 percentile range of the data points, respectively. Relative fractions (mean ± SD) of individual viral transcripts detected in individual viroplasms (N=21).
-
Figure 5—source data 1
Relative fractions of individual RV transcripts in the RV transcriptome at 6 hpi (Seg1-Seg11).
- https://cdn.elifesciences.org/articles/68670/elife-68670-fig5-data1-v2.txt
-
Figure 5—source data 2
Single-cell analysis of the relative fractions of each segment-specific transcript (N=15 cells) estimated from the UDEx-FISH images data.
- https://cdn.elifesciences.org/articles/68670/elife-68670-fig5-data2-v2.zip
-
Figure 5—source data 3
Relative abundance of individual transcripts in viroplasms (N=21) estimated by UDEx-FISH.
- https://cdn.elifesciences.org/articles/68670/elife-68670-fig5-data3-v2.zip
-
Figure 5—source data 4
Quantitative comparison of the RV transcriptome estimated by UDEx-FISH and RNA-Seq at 6 hpi.
- https://cdn.elifesciences.org/articles/68670/elife-68670-fig5-data4-v2.zip
-
Figure 5—source data 5
Integrated signal intensities for individual viroplasm-localized RV transcripts used for correlation analysis of the RV RNA stoichiometry in viroplasms.
- https://cdn.elifesciences.org/articles/68670/elife-68670-fig5-data5-v2.xlsx
Figure 5—figure supplement 1
Quantification of transcripts by UDEx-FISH.
(a) UDEx-FISH and RNA-Seq quantitation of RV transcripts at 6 hpi (MA104 cells, as described in Methods). Relative fractions of RV transcripts quantified by RNA-Seq (e.g. mean values shown in Figure 5b) are plotted as black horizontal bars, and violin plots show distribution of transcripts of Seg1-Seg11 in individual cells quantified by UDEx-FISH. Median and quartile values are shown as dashed and dotted lines, respectively. (b) Pairwise correlation plots of viroplasm-localised transcripts of segment 1 vs segments 2–11. Integrated intensities of detected Seg1 RNAs for individual viroplasms (y-axis) are plotted against the detected intensities for Seg 2–11 transcripts (x-axis). Correlations (R2 values) between the detected transcript signals were calculated by linear fitting to reveal different relative stoichiometries of distinct RV transcripts in viroplasms (N=21).
Figure 6

3’ UTR is required for RV transcript localisation to viroplasms.
(a) Schematics of the EGFP transcript construct containing the EGFP-coding sequence flanked by the 5’UTR and 3’UTR sequences derived from Seg1 RNA (5’UTR-EGFP-3’UTR) or only 3’UTR sequence (denoted EGFP-Δ3’UTR) that lacks the 17-nt long 3’UTR. Both RNA constructs were electroporated into MA104-mCherry-NSP2 cells 6 hr prior to being infected with RVs, as described in Methods. (b) Widefield images of RV-infected MA104-mCherry-NSP2 cells electroporated with EGFP-Δ3’UTR (top) and the 5’UTR-EGFP-3’UTR transcript (bottom). Cells were fixed at 6 hpi prior to the hybridisation with FISH probes against EGFP coding region, as described in Methods. Green: NSP2-mCherry-tagged viroplasms, magenta: smFISH for EGFP RNA. Scale bars, 10 μm.
Figure 7

3’ UTRs and the viral polymerase are required for RV transcript localisation.
(a) Polyadenylated RV mRNAs coding EGFP do not partition to viroplasms. Top - experimental design of the smFISH probes to target RV mRNAs coding EGFP in cells infected with the wild-type rotavirus. Bottom – smFISH of NSP5-EGFP-coding transcripts in RV-infected cells at 8 hpi. (b) Top - experimental design of smFISH probes to target the EGFP-coding RNAs produced by the recombinant RV (rRV, denoted as NSP3-2A-EGFP containing Seg7-specific UTRs). Bottom - smFISH of NSP3-2A-EGFP transcripts in rRV-infected cells at 8 hpi. Note the colocalisation of NSP3-2A-EGFP transcripts (magenta) with EGFP-tagged viroplasms (green). (c) L138P mutation affects the ability of VP1 to accumulate in viroplasms at 39 °C but not at 31 °C. smFISH of RV transcripts in cells infected with L138P mutant at 8 hpi grown at 39 °C vs 31 °C. Note the formation of EGFP-tagged viroplasms at both temperatures albeit RV transcripts efficiently accumulate in viroplasms at 31 °C (PCC, R2=0.62 ± 0.17 vs 0.18±0.07 for 31 °C vs 39 °C, respectively). Errors represent standard deviations for N=4 analyzed ROIs. Images represent maximum intensity Z-projections. Scale bars, 10 µm.
Figure 8
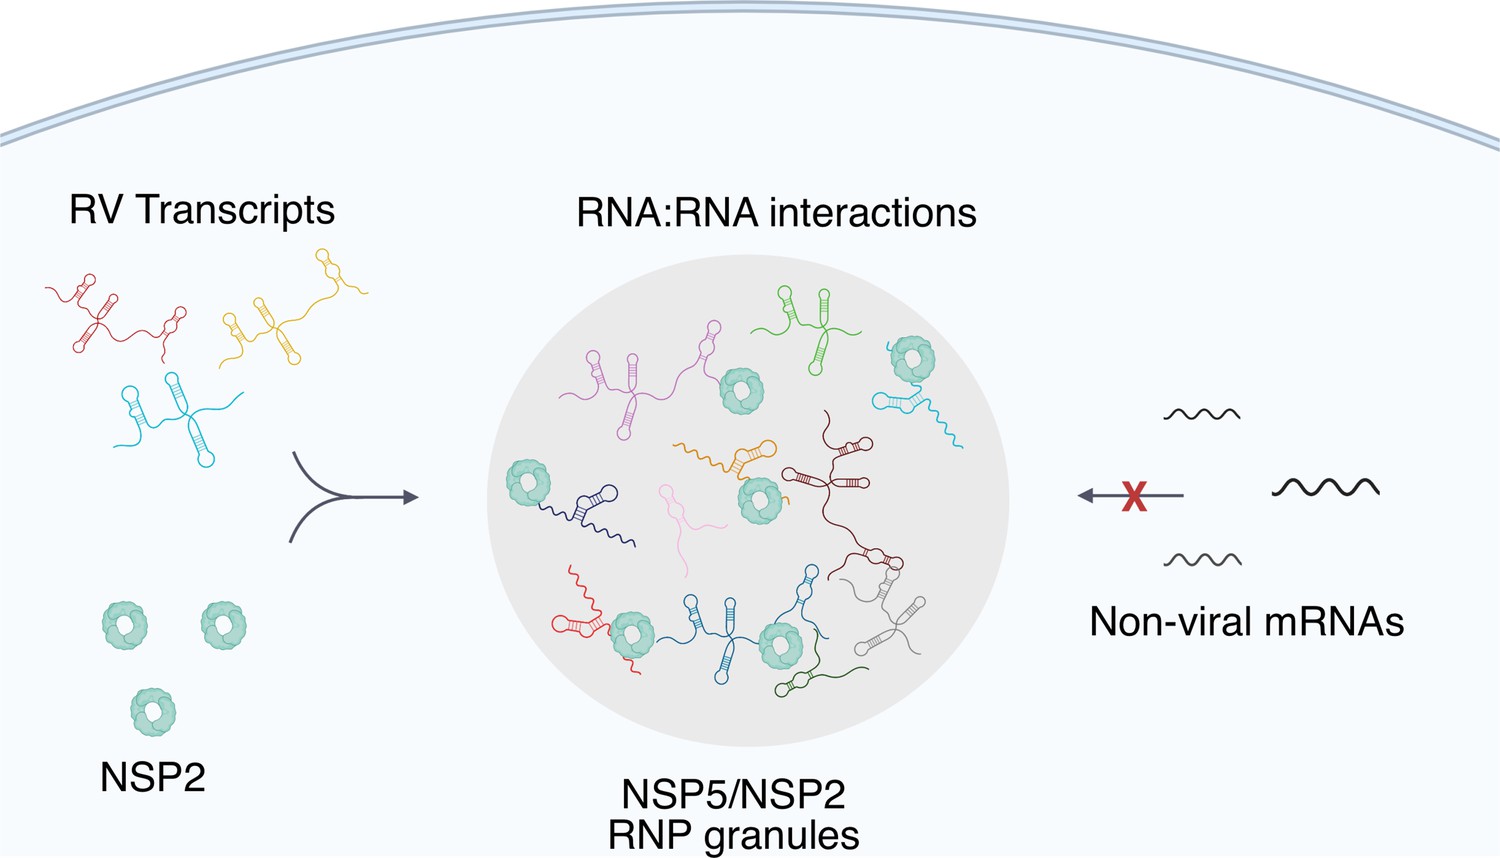
A proposed model of viral transcript partitioning into viroplasms.
RV transcripts (for clarity, only 3 out of 11 distinct transcripts are shown) associate with viral RNA-binding proteins NSP2 (cyan doughnut-like octamers), as well as the RV RNA-dependent RNA Polymerase VP1 Viskovska et al., 2014; Patton, 1996 (not shown). These transcripts can partition into NSP5/NSP5-rich droplets, forming viroplasms containing all 11 distinct types of RV transcripts. While the number of individual types of transcripts varies, their relative numbers in viroplasms is close to equimolar, suggesting an RNA partitioning mechanism distinct from the formation of stress granules or P-bodies. High effective concentration of cognate RNAs within viroplasms is conducive to the formation of inter-molecular RNA-RNA interactions between 11 distinct RV transcripts required for their stoichiometric assembly. Given the degenerative nature of RNA-RNA base-pairing Van Treeck and Parker, 2018, viroplasms must maintain their RNA composition to promote inter-molecular interactions between the RV transcripts, whilst minimising the partitioning of other non-cognate mRNAs that may interfere with segmented genome assembly.
Author response image 1
Author response image 2
Tables
Key resources table
| Reagent type (species) or resource | Designation | Source or reference | Identifiers | Additional information |
|---|---|---|---|---|
| Cell line (Chlorocebus aethiops) | MA104 Clone 1 | ATCC | ATCC CRL-2378.1; RRID:CVCL_3845 | Stable cell line |
| Cell line (Chlorocebus aethiops) | MA104-NSP5-EGFP | Cells obtained from Dr. O. Burrone and G. Papa, ICGEB, Trieste, Italy | https://doi.org/10.1128/JVI.01110-19 | Stable cell line |
| Cell line (Chlorocebus aethiops) | MA104-shRNA-NSP2 | This manuscript | MA104-shRNA-NSP2 | Made by transfection with pPB[shRNA]-EGFP:T2A:Puro-U6 plasmid |
| Cell line (Chlorocebus aethiops) | MA104-NSP2-mCherry | Geiger et al., 2021 | https://doi.org/10.15252/embj.2021107711 | Stable cell line |
| Strain, strain background (Group A rotavirus) | Bovine rotavirus group A, strain RF [G6P6(1)] | Dr Ulrich Desselberger, University of Cambridge, UK | https://doi.org/10.1371/journal.pone.007432 | |
| Strain, strain background (Group A rotavirus) | Simian rotavirus group A, strain SA11/tsC mutant | Dr Sarah McDonald Esstman, Wake Forest University, USA | https://doi.org/10.1016/j.virusres.2021.198488 | |
| Sequence-based reagents | FISH probes | Integrated DNA Technologies | RNA FISH DNA probes | Sequences listed in Supplementary file 1 |
| Antibody | Goat polyclonal, HRP-conjugated, anti-guinea pig | ThermoFisher | A18775, RRID:AB_2535552 | 1:10,000 dilution used for Western Blotting |
| Antibody | Anti-NSP2 (polyclonal, anti-guinea pig) | Dr. O. Burrone, ICGEB, Trieste, Italy; Papa et al., 2019 | https://doi.org/10.1128/JVI.01110-19 | 1:1,000 dilution used for Western Blotting |
| Sequence-based reagents | FISH Probes, fluorescently labelled Seg3RF-Q670 Seg4RF-Q570 GAPDH-Q670 Comb-Q570 For_UTR Rev_UTR Rev_dUTR | LGC Biosearch Technologies | Seg3RF-Q670 Seg4RF-Q570 GAPDH-Q670 Comb-Q570 | Sequences provided in the Supplementary file 1 |
| Other | Stellaris RNA FISH Hybridization Buffer | LGC Biosearch Technologies | SMF-HB1-10 | |
| Recombinant DNA reagent | pPB[shRNA]-EGFP:T2A:Puro-U6 | VectorBuilder https://en.vectorbuilder.com | pPB[shRNA]-EGFP:T2A:Puro-U6 | Sequence provided in Supplementary file 1 |
| Recombinant DNA reagent | pCMV-HyPBase | Dr. O.Burrone, ICGEB, Trieste, Italy; Papa et al., 2019 | https://doi.org/10.1128/JVI.01110-19 | |
| Recombinant DNA reagent | pT7-NSP3-EGFP | Dr. O.Burrone, ICGEB, Trieste, Italy; Papa et al., 2019 | https://doi.org/10.1128/JVI.01110-19 | |
| Commercial assay or kit | NEBNEXT rRNA Depletion kit | New England Biolabs | E6350S | Mouse/Rat/Human species |
| Commercial assay or kit | Faustovirus Capping Enzyme | New England Biolabs | M2081S | |
| Commercial assay or kit | mRNA Cap 2´-O-methyltransferase | New England Biolabs | M0366 | |
| Other | Lipofectamine 3000 | Invitrogen | L3000001 | |
| Commercial assay or kit | MycoSPY | Biontex Laboratories, Germany | M030-050 | PCR detection of Mycoplasma sp. |
| Commercial assay or kit | NEBNEXT Ultra II FS DNA Library Prep kit | New England Biolabs | E7805S | |
| Commercial assay or kit | RNA extraction kit, RNEasy | Qiagen | 74034 | |
| Other | SuperScript II reverse transcriptase | Invitrogen | 18064014 | |
| Commercial assay or kit | HighScribe T7 kit | New England Biolabs | E2040S | |
| Other | DAPI stain | Invitrogen | D1306 | |
| Other | Atto647N-Oligo(dT30) | Integrated DNA Technologies | https://doi.org/10.1016/j.molcel.2017.10.015 | |
| Software, algorithm | OriginPro | OriginLab | RRID:SCR_014212 | |
| Software, algorithm | Icy | (http://icy.bioimageanalysis.org/) | RRID:SCR_010587 | Colocalisation analysis |
| Software, algorithm | Picasso | Developed in- house (Kowalewski, 2023) https://github.com/jungmannlab/picasso | Schnitzbauer et al., Nat. Protoc. 12, 1198–1228 (2017). | |
| Software, algorithm | Stellaris Designer | LGC Biosearch Technologies | https://www.biosearchtech.com/stellaris-designer | RNA FISH probe designer |
| Software, algorithm | Salmon | https://github.com/COMBINE-lab/salmon (COMBINE lab, 2022) | Patro, R. et al., Nat. Methods 14, 417–419 (2017). |
Additional files
-
Supplementary file 1
GenBank IDs and sequences of the DNA oligonucleotides used in the study.
- https://cdn.elifesciences.org/articles/68670/elife-68670-supp1-v2.xlsx
-
Supplementary file 2
RNA-Seq transcriptome analysis of RV-infected MA104 cells at 6 hpi (RVA strain RF).
- https://cdn.elifesciences.org/articles/68670/elife-68670-supp2-v2.xlsx
-
Transparent reporting form
- https://cdn.elifesciences.org/articles/68670/elife-68670-transrepform1-v2.docx
Download links
A two-part list of links to download the article, or parts of the article, in various formats.
Downloads (link to download the article as PDF)
Open citations (links to open the citations from this article in various online reference manager services)
Cite this article (links to download the citations from this article in formats compatible with various reference manager tools)
Principles of RNA recruitment to viral ribonucleoprotein condensates in a segmented dsRNA virus
eLife 12:e68670.
https://doi.org/10.7554/eLife.68670


