Structural insights into hormone recognition by the human glucose-dependent insulinotropic polypeptide receptor
- School of Pharmacy, Fudan University, China
- The CAS Key Laboratory of Receptor Research, Shanghai Institute of Materia Medica, Chinese Academy of Sciences, China
- School of Life Science and Technology, ShanghaiTech University, China
- University of Chinese Academy of Sciences, China
- Department of Pharmacology, School of Basic Medical Sciences, Fudan University, China
- School of Artificial Intelligence and Automation, Huazhong University of Science and Technology, China
- The National Center for Drug Screening, Shanghai Institute of Materia Medica, Chinese Academy of Sciences, China
- Department of Biophysics and Department of Pathology of Sir Run Run Shaw Hospital, Zhejiang University School of Medicine, China
Figures
Figure 1 with 3 supplements

Cryo-EM structure of the GIP1-42–GIPR–Gs complex.
(A) Cut-through view of the cryo-EM density map that illustrates the GIP1-42–GIPR–Gs complex and the disc-shaped micelle. The unsharpened cryo-EM density map at the 0.07 threshold shown as light gray surface indicates a micelle diameter of 11 nm. The colored cryo-EM density map is shown at the 0.16 threshold. (B) Model of the complex as a cartoon, with GIP1-42 as helix in orange. The receptor is shown in light sky blue, Gαs in yellow, Gβ subunit in cyan, Gγ subunit in navy blue, and Nb35 in gray.
-
Figure 1—source data 1
Effects of GIP1-42-mediated cAMP accumulation and binding affinity.
- https://cdn.elifesciences.org/articles/68719/elife-68719-fig1-data1-v2.xlsx
Figure 1—figure supplement 1
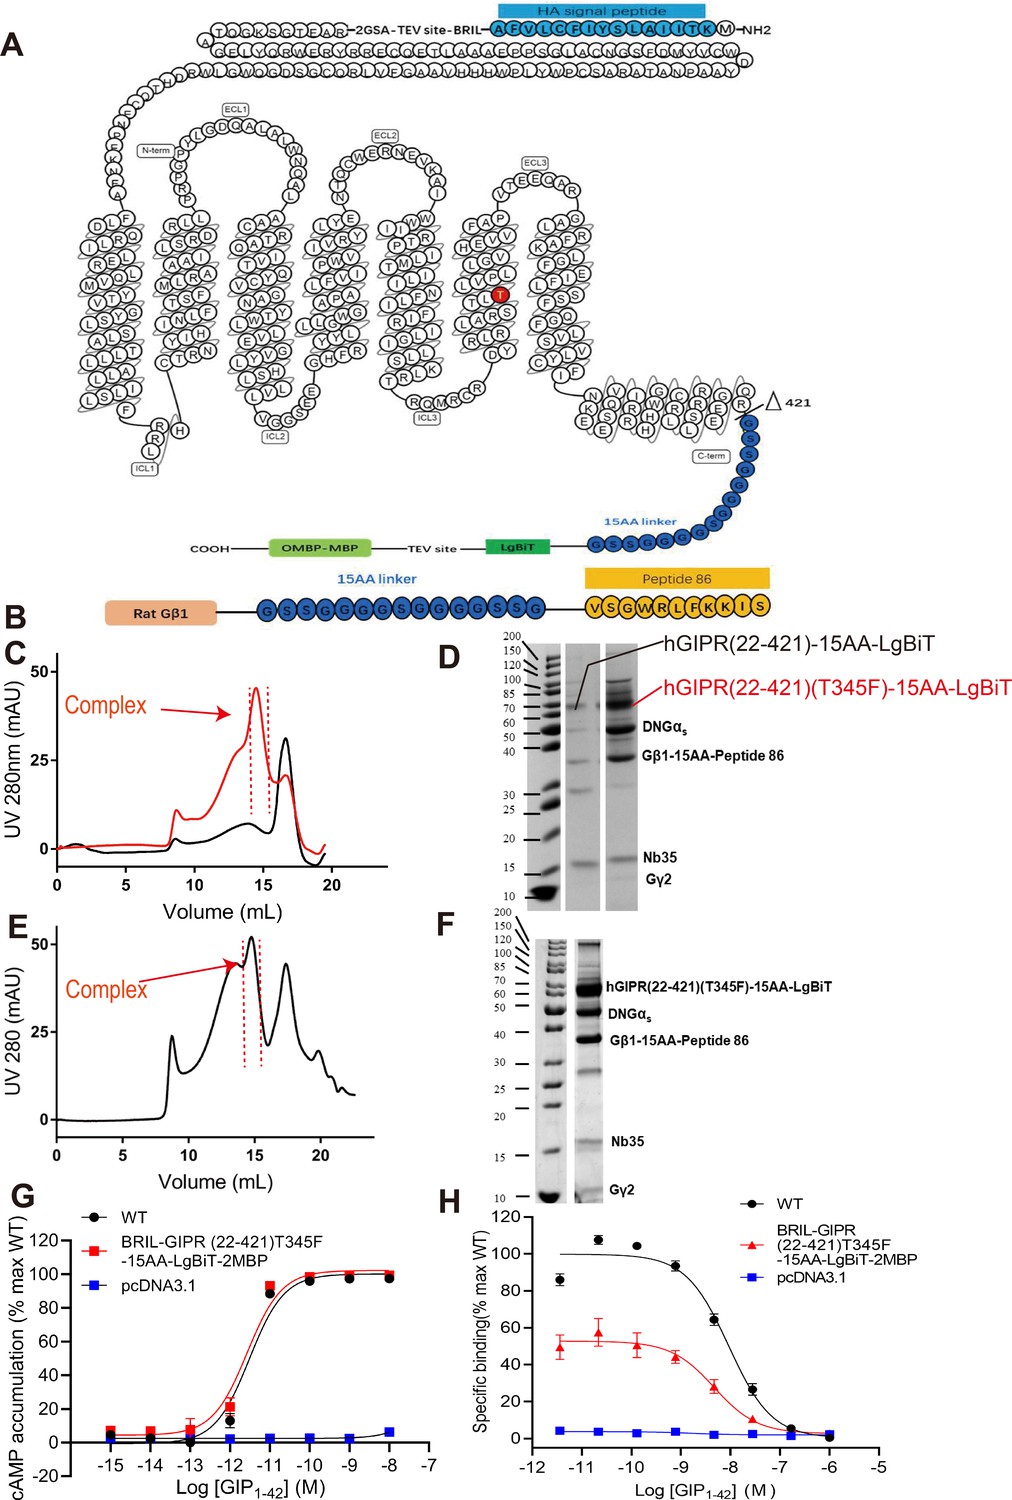
Purification and characterization of the GIP1-42–GIPR–Gs–Nb35 complex.
(A) Human GIPR constructs used for structure determination. The signal peptide of the GIPR was replaced by the HA signal peptide (blue). A BRIL fusion protein was added at the N terminus of the receptor, followed by a TEV protease site between them. GIPR was truncated at R421, followed by a 15 amino acid linker (15AA, dark blue) and LgBiT (green). The C terminus was modified with a TEV protease site and an OMBP-MBP (light green) tag. The mutation site at T345 was highlighted in red. (B) Gβ1 constructs used for structure determination. Rat Gβ1 (orange) was attached to peptide 86 (orange) with a 15AA linker (dark blue) between them. (C) Size-exclusion chromatography results of the GIP1-42–GIPR(22-421)–Gs–Nb35 (black line) and GIP1-42–GIPR(22-421)(T345F)–Gs–Nb35 (red line) complexes on Superose 6 Increase 10/300GL. (D) SDS-PAGE of the GIP1-42–GIPR(22-421)–Gs–Nb35 and GIP1-42–GIPR(22-421)(T345F)–Gs–Nb35 complexes. (E) Size-exclusion chromatography results on Superose 6 Increase 10/300GL. (F) SDS–PAGE of the GIP1-42–GIPR–Gs–Nb35 complex. (G) cAMP responses following GIP1-42 stimulation in HEK 293T cells transfected with wild-type (WT, HA-Flag-3GSA-GIPR(22-466)) or truncated GIPR constructs (HA-Flag-3GSA-BRIL-TEV-2GSA-GIPR(22-421)T345F-15AA-LgBiT-TEV-2MBP). Signals were normalized to the maximum response of WT and dose–response curves were analyzed using a three-parameter logistic equation. (H) Binding of GIP1-42 to the full length (residues 22-466) or truncated (residues 22-421) GIPR in CHO-K1 cells in competition with [125I]-GIP1-42.
Figure 1—figure supplement 2
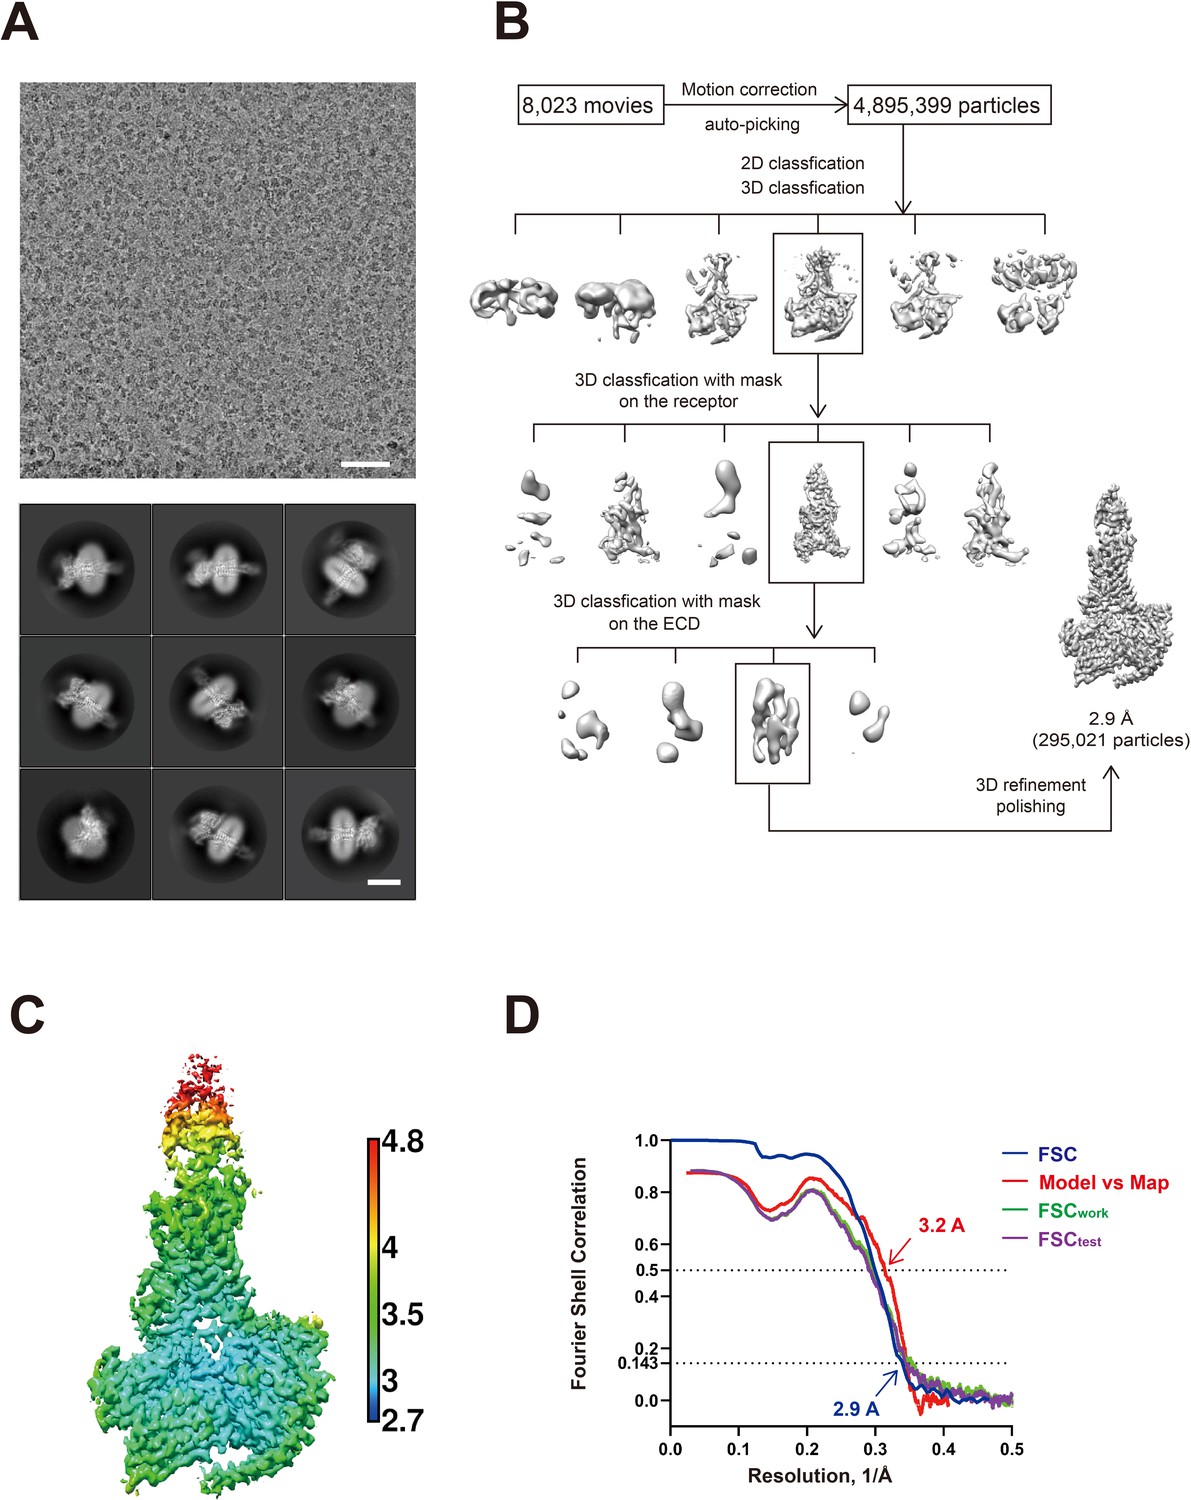
Cryo-EM analysis of the GIP1-42–GIPR–Gs complex.
(A) Representative cryo-EM micrograph (scale bar: 50 nm) and two-dimensional class averages (scale bar: 5 nm). (B) Flow chart of cryo-EM data processing. Details are described in Materials and methods. (C) Local resolution distribution map of the GIP1-42–GIPR–Gs complex. (D) Gold-standard Fourier shell correlation (FSC) curves of overall refined receptor.
Figure 1—figure supplement 3
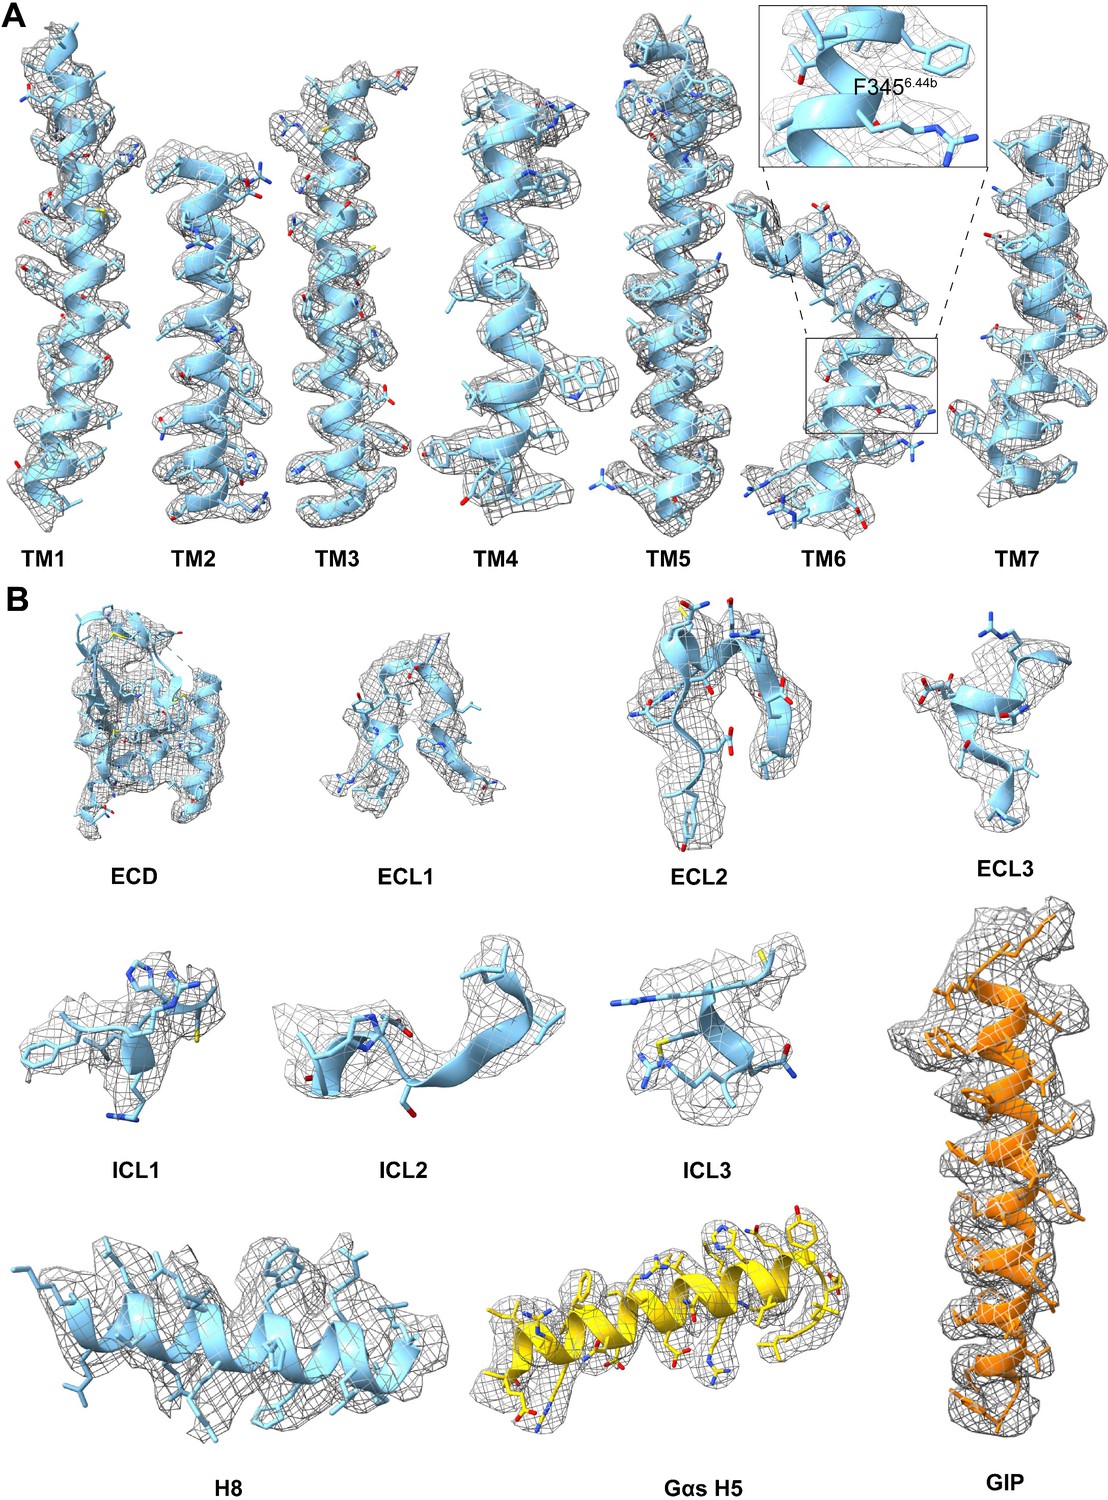
Atomic resolution model of the GIP1-42–GIPR–Gs complex in the cryo-EM density map.
EM density map and model are shown for all seven transmembrane α-helices (A), ECD, helix eight, and all extracellular loops of GIPR, the α5-helix of the Gαs Ras-like domain and GIP1-42 (B). Insert in (A) is the close-up of the density of F3456.44b.
Figure 2 with 2 supplements
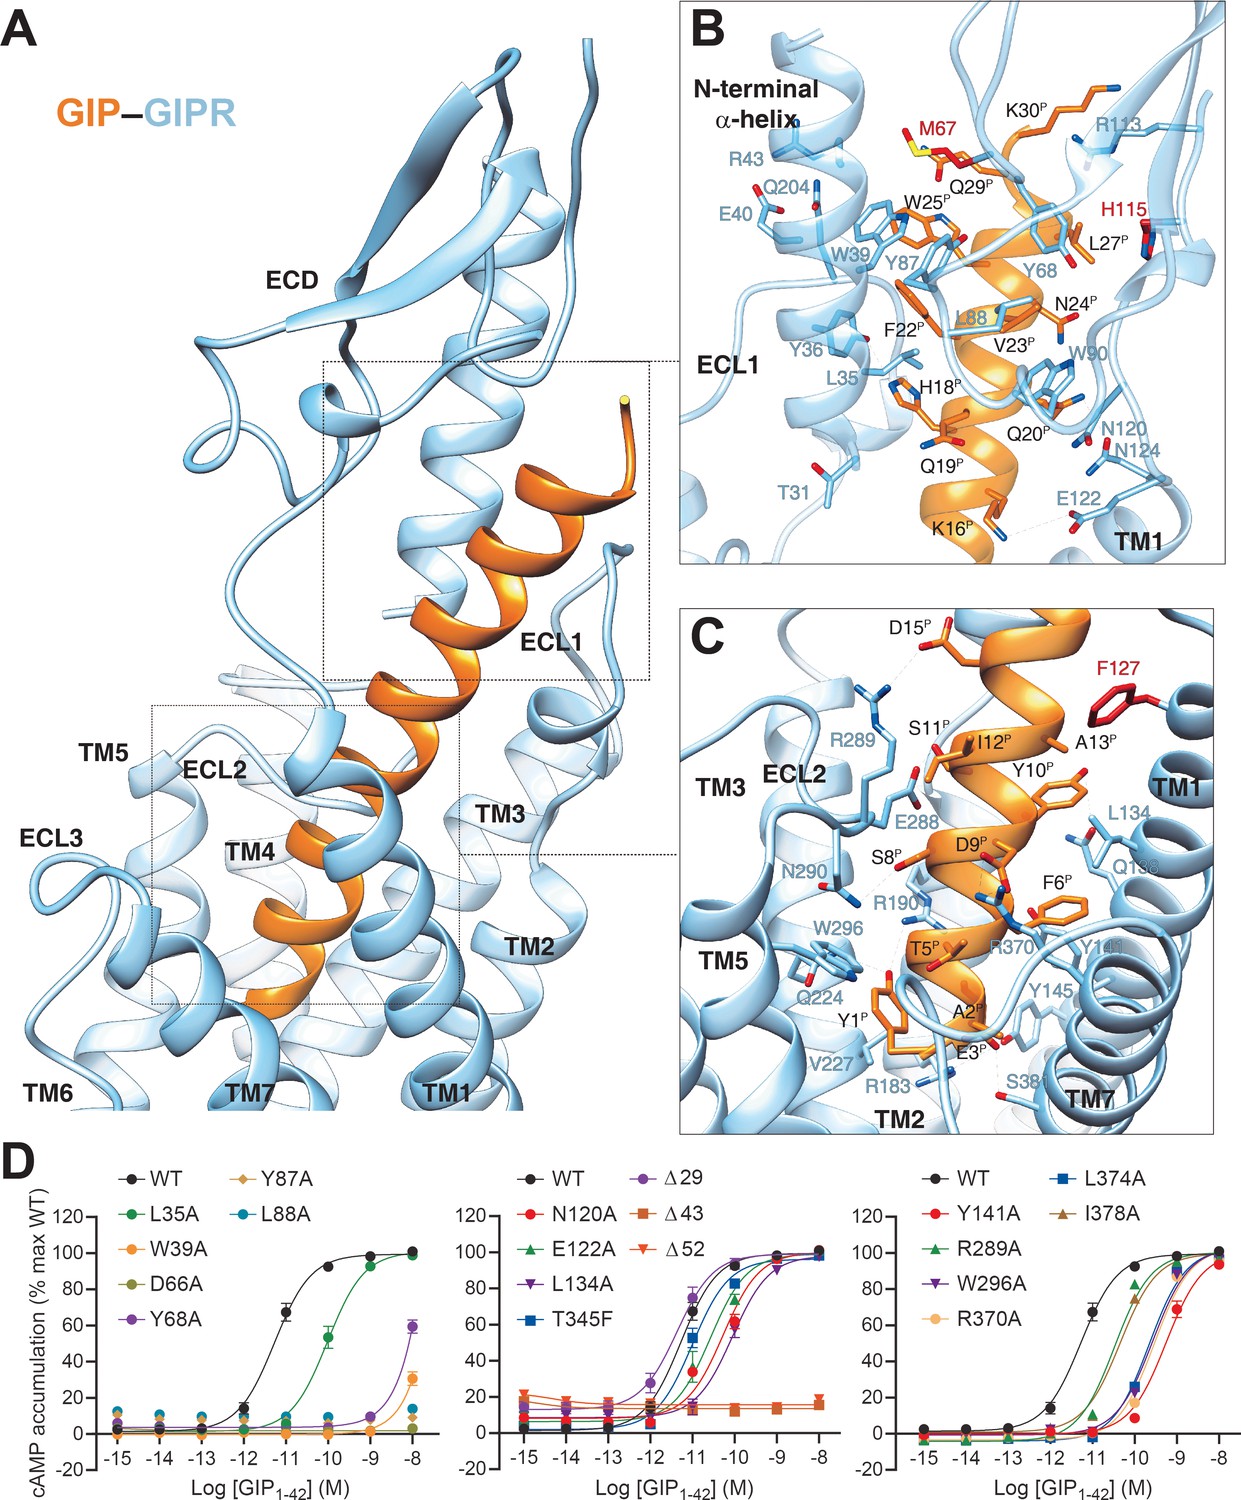
Molecular recognition of GIP by GIPR.
(A) The binding mode of GIP (orange) with GIPR (light sky blue), showing that the N-terminal half of GIP penetrates into a pocket formed by all TM helices except TM4, ECL2, and ECL3, whereas the C-terminal half is recognized by ECD, ECL1, and TM1. (B, C) Close-up views of the interactions between GIP and GIPR. The residues and side chains that could not be modelled in the ECD are colored in red. (D) Signaling profiles of GIPR mutants. cAMP accumulation in wild-type (WT) and single-point mutated GIPR expressing in HEK 293T cells. Signals were normalized to the maximum response of the WT and dose–response curves were analyzed using a three-parameter logistic equation. All data were generated and graphed as means ± S.E.M. of at least three independent experiments, conducted in quadruplicate. Δ, truncated residues.
-
Figure 2—source data 1
Effects of residue mutation in the ligand-binding pocket on GIP1-42-induced cAMP accumulation, cell surface expression, and binding affinity.
- https://cdn.elifesciences.org/articles/68719/elife-68719-fig2-data1-v2.xlsx
Figure 2—figure supplement 1
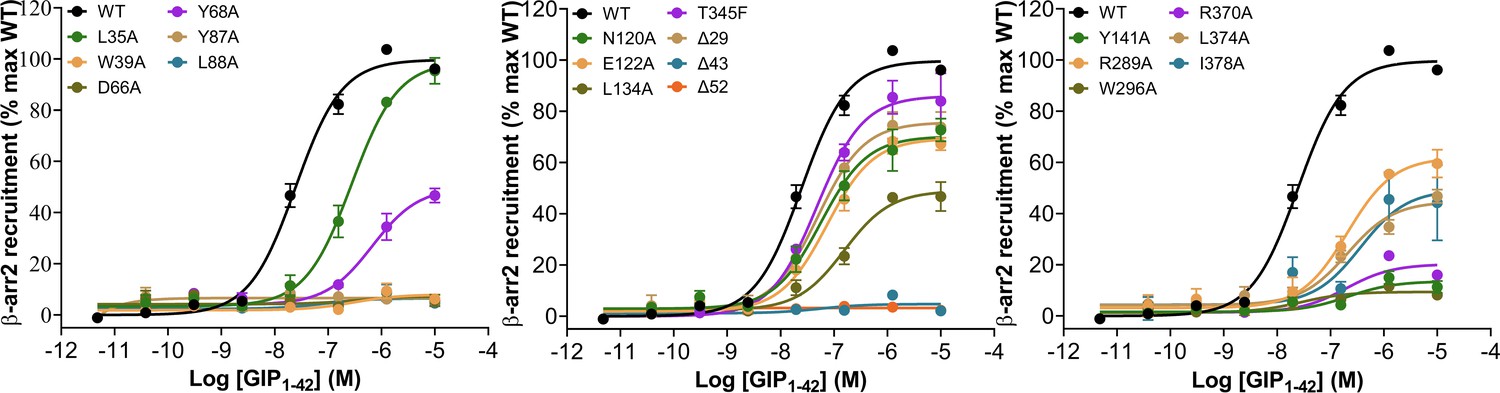
Effects of residue mutation in the ligand-binding pocket on GIP1-42-induced β-arrestin2 recruitment.
GIP1-42 induced β-arrestin2 recruitment. HEK 293 T cells were transiently co-transfected with GIPR-Rluc8 and Venus-β-arrestin2 (β-arr2). Data presented are AUC of BRET signals measured for 10 min post-stimulation. For quantification of concentration-responses, data were corrected for the vehicle control and then normalized to the maximal response of wild-type (WT) GIPR. Data were fitted to non-linear regression three-parameter logistic curves. Δ, truncated residues.
Figure 2—figure supplement 2
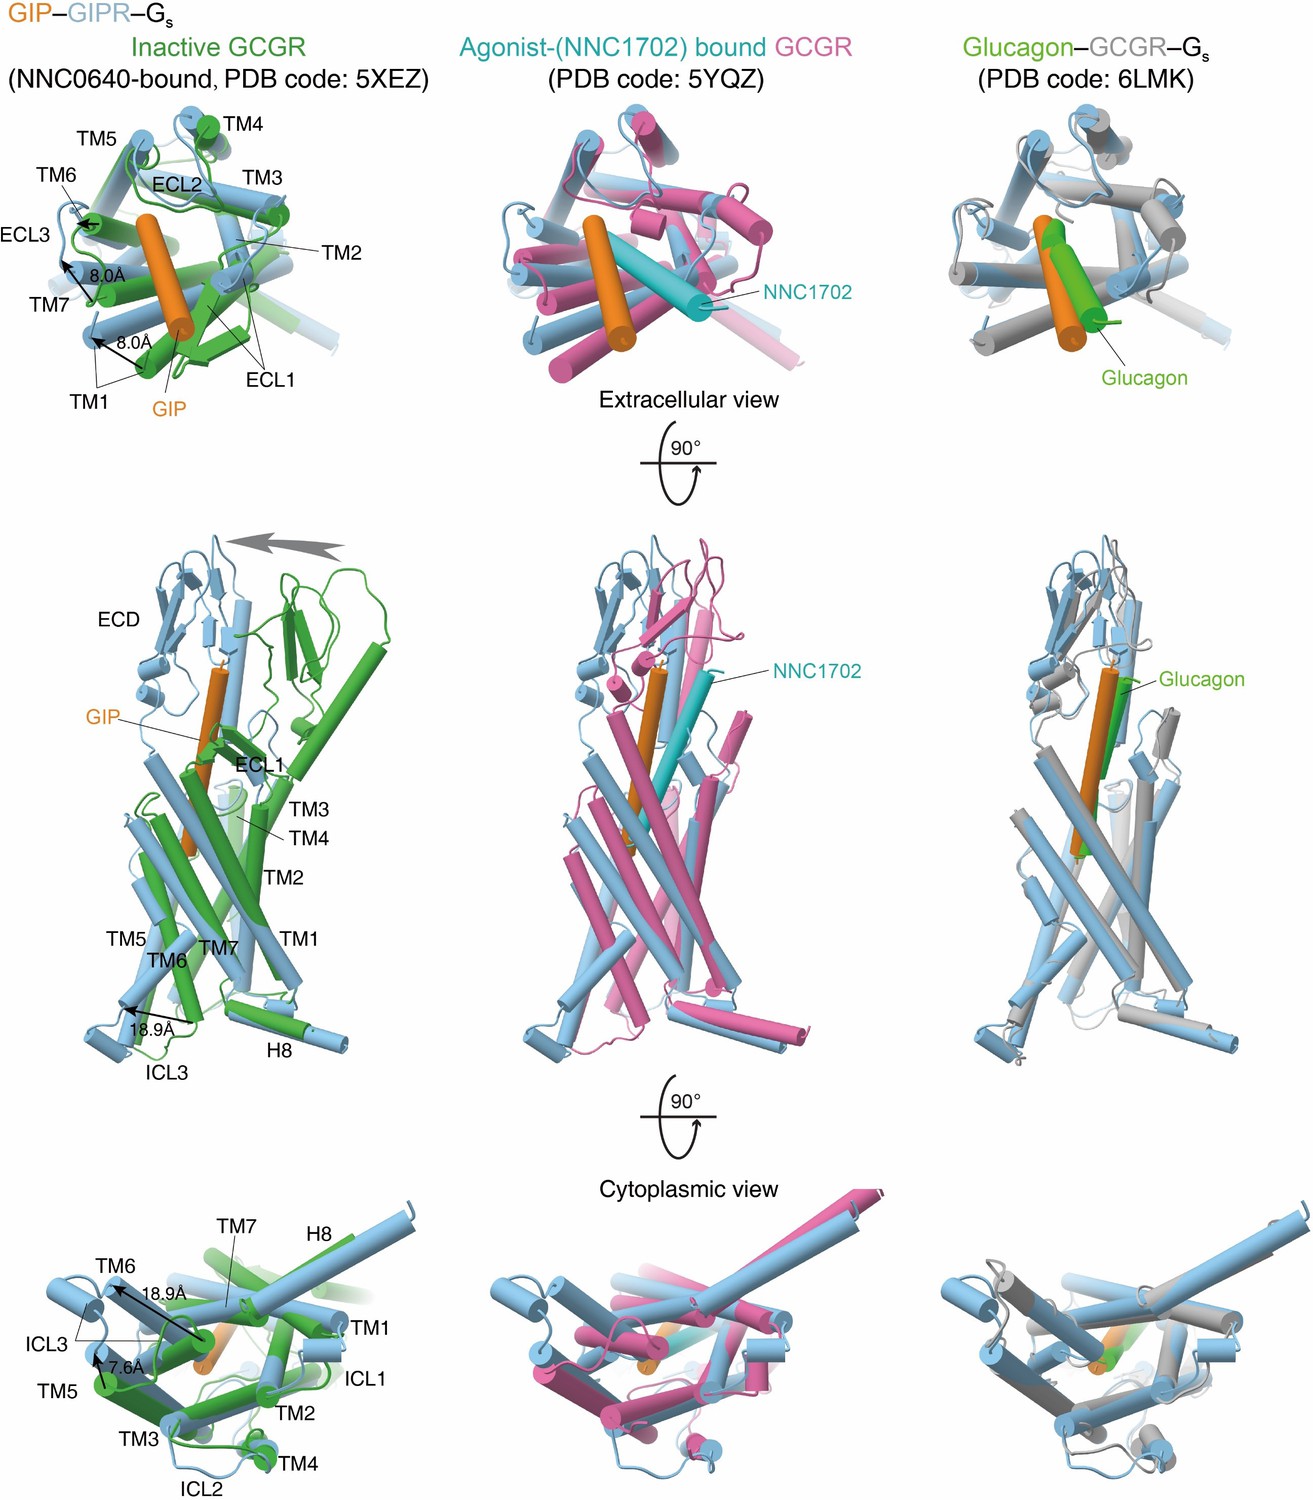
Conformational changes upon GIPR activation.
Comparison of active GIPR with inactive, agonist-bound, and both agonist-bound and G protein-coupled active GCGR (Zhang et al., 2020). G proteins are omitted for clarity.
Figure 3
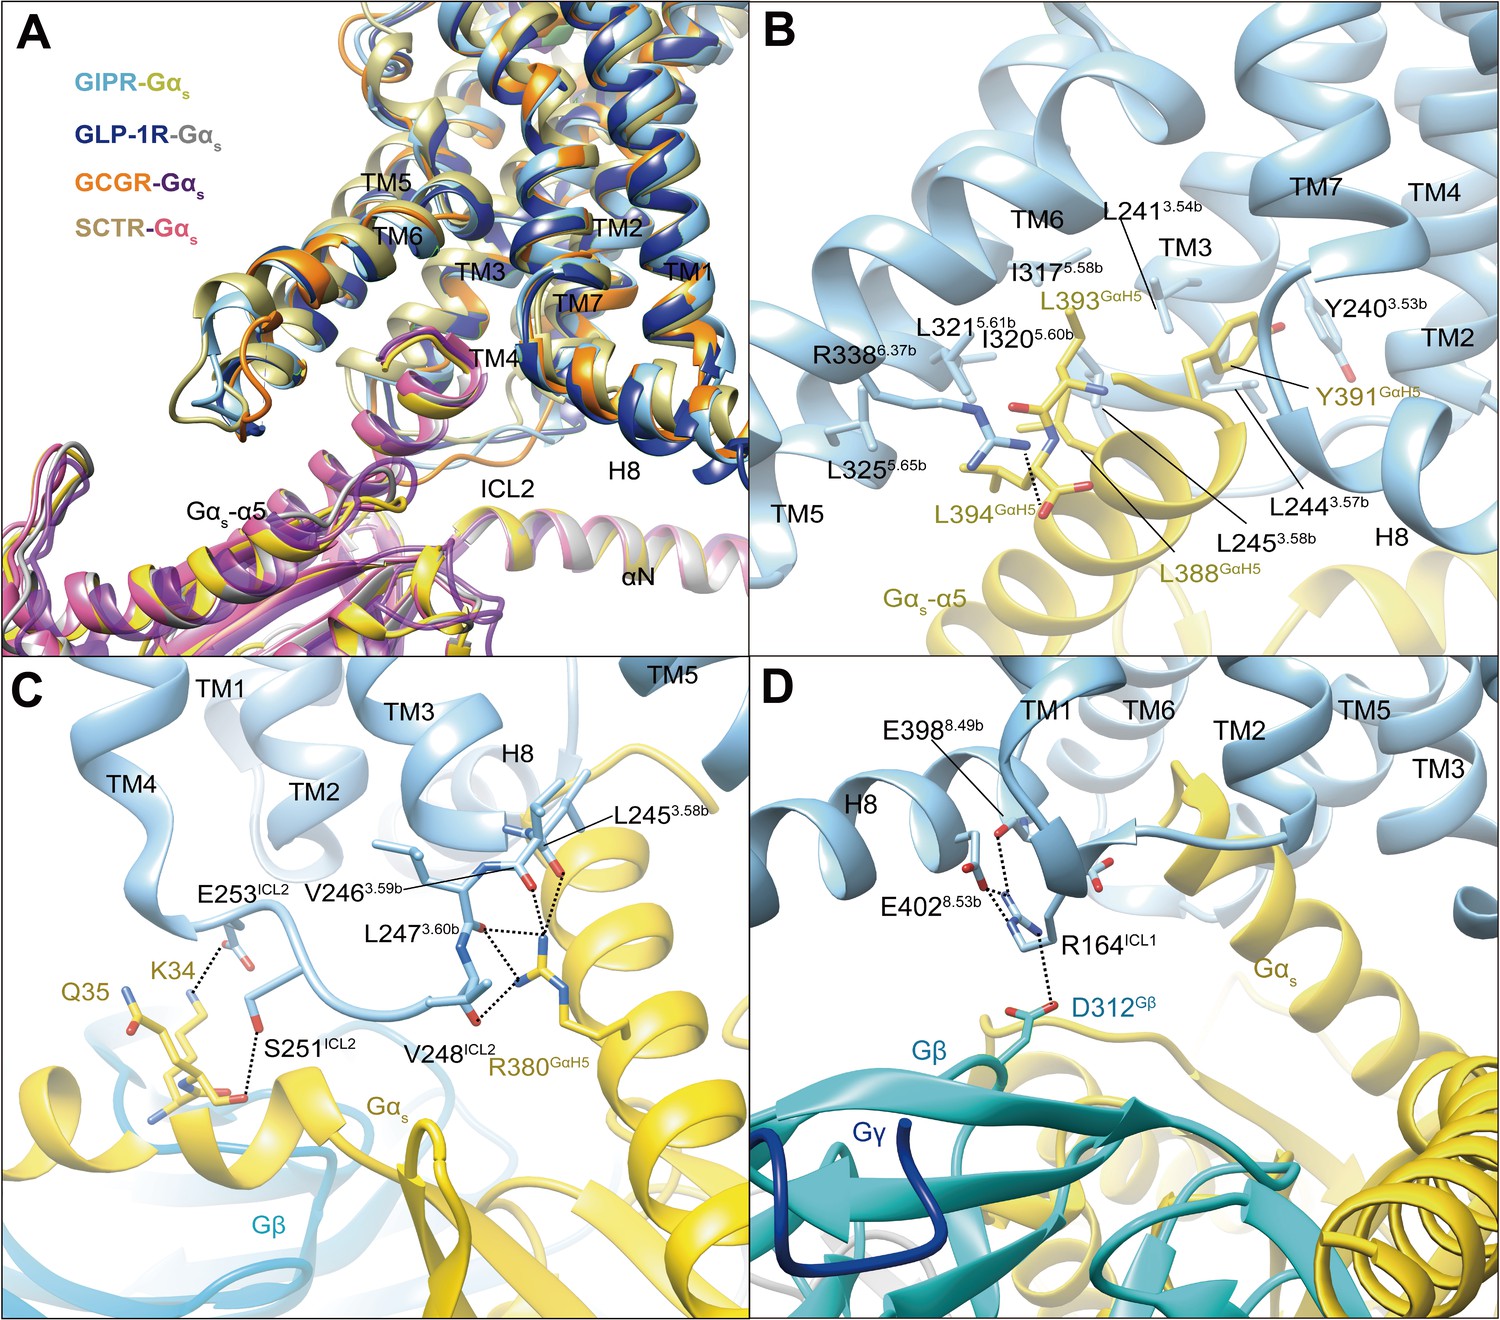
G protein coupling of GIPR.
(A) Comparison of G protein coupling among GIPR, GLP-1R (Zhang et al., 2020), GCGR (Qiao et al., 2020), and SCTR (Dong et al., 2020). The Gαs α5-helix of the Gαs Ras-like domain inserts into an intracellular crevice of GIPR TMD. (B) Interaction between GIPR and the C terminus of Gαs. (C) Polar interactions between ICL2 and Gαs. (D) Polar interactions between H8 and ICL1 of the GIPR and Gβ. The GIP1-42–GIPR–Gαs structure is colored light sky blue (GIPR), gold (Gαs), and cyan (Gβ). Residues involved in interactions are shown as sticks. Polar interactions are shown as black dashed lines.
Figure 4 with 4 supplements
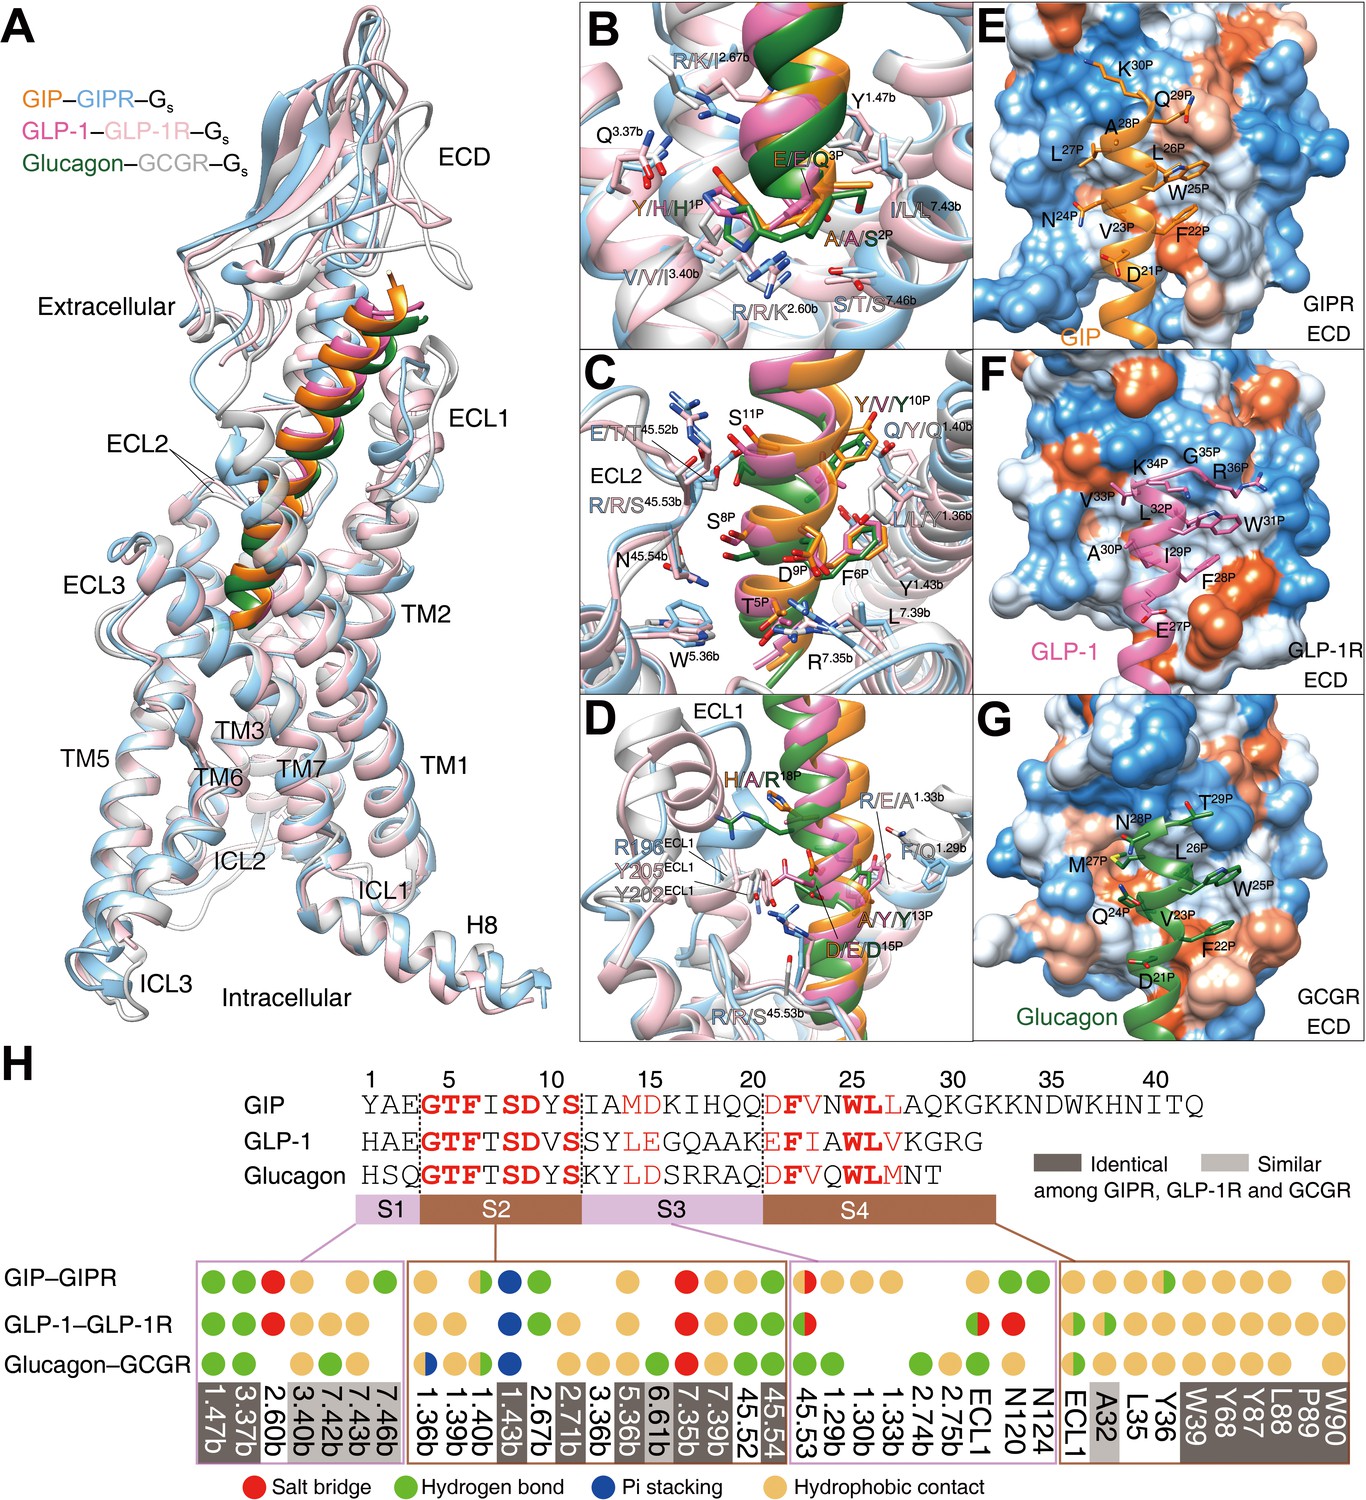
Ligand specificity among GIPR, GLP-1R, and GCGR.
(A) Comparison of the overall structures of GIP1-42–GIPR–Gs, GLP-1–GLP-1R–Gs (Zhang et al., 2020) and glucagon–GCGR–Gs complexes (Qiao et al., 2020). G proteins are omitted for clarity. (B–D) Close-up views of the interaction between TMD and peptide. Based on sequence similarity, the peptides are divided into four segments: N terminus (residues 1–3, B), segment 2 (residues 4–11, C), segment 3 (residues 12–20, D), and the C terminus (residues 21 to the end, E–G), where segments 2 and 4 are highly conserved among GIP, GLP-1, and glucagon. Residues are numbered based on GIP for peptides, and labeled with class B GPCR numbering in superscript for receptors (Wootten et al., 2013). (E–G) Close-up views of the interface between GIPR ECD and GIP C terminus (E), between GLP-1R and GLP-1 C terminus (F), and between GCGR and glucagon C terminus (G). The ECD is shown in surface representation and colored from dodger blue for the most hydrophilic region, to white, to orange red for the most hydrophobic region. (H) Comparison of peptide recognition modes for three receptors, described by fingerprint strings encoding different interaction types of the surrounding residues in each receptor. Peptide residue numbers on the top are shown based on GIP. The ligand-binding pocket residues that are identical or similar across three receptors are highlighted in dark gray and light gray, respectively. Color codes are listed on the bottom.
Figure 4—figure supplement 1
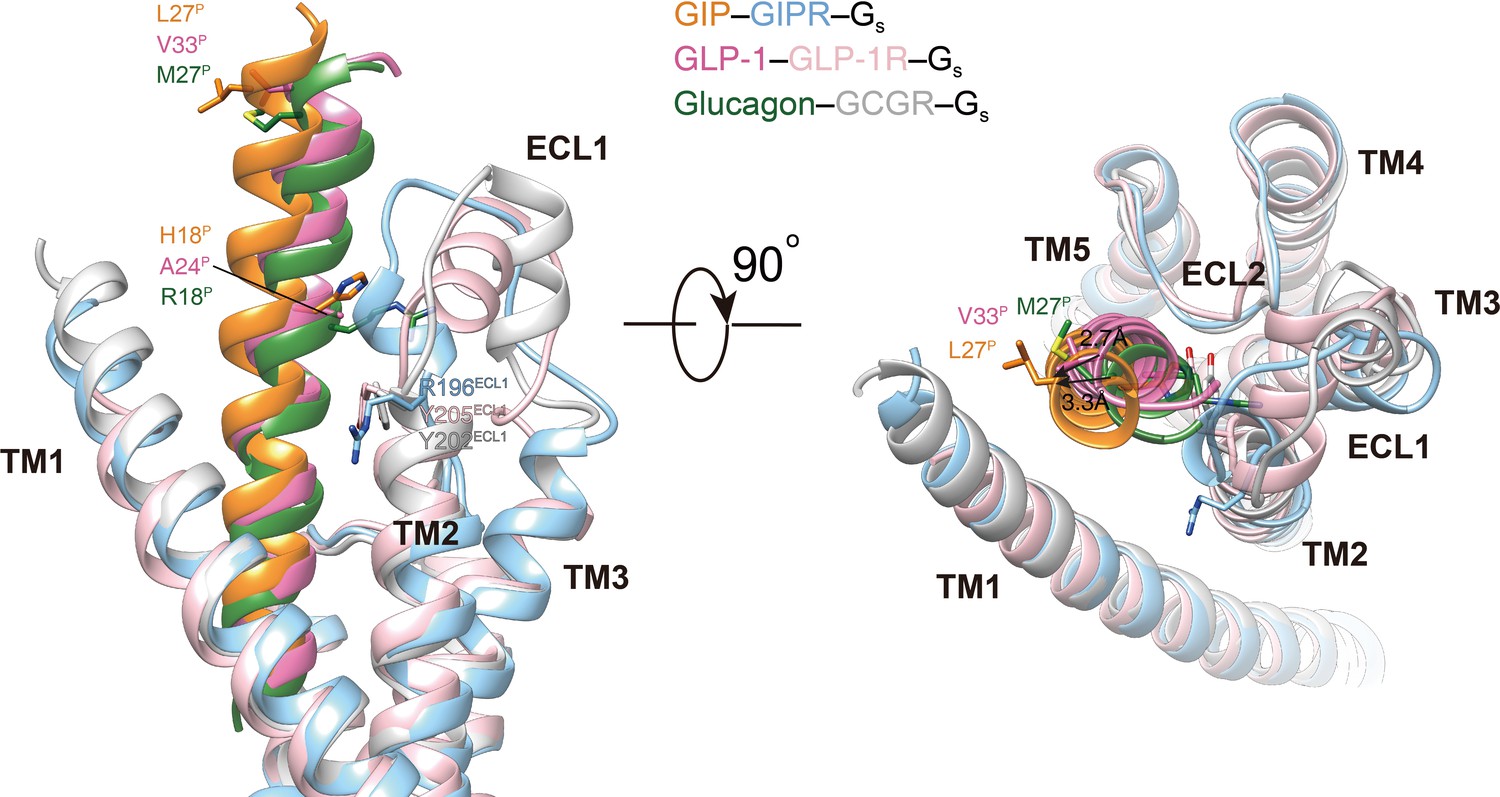
Structural comparison of ECL1 conformations among GIPR, GLP-1R and GCGR.
The ECL1 conformation of GIP-bound GIPR is compared with that of GLP-1-bound GLP-1R (PDB code: 6X18) (Zhang et al., 2020) and glucagon-bound GCGR (PDB code: 6LMK) (Zhang et al., 2020). All structures are superimposed on the GIP-bound GIPR using the Cα carbons of the residues in the TM2–3–4. Receptor ECD and G protein are omitted for clarity.
Figure 4—figure supplement 2
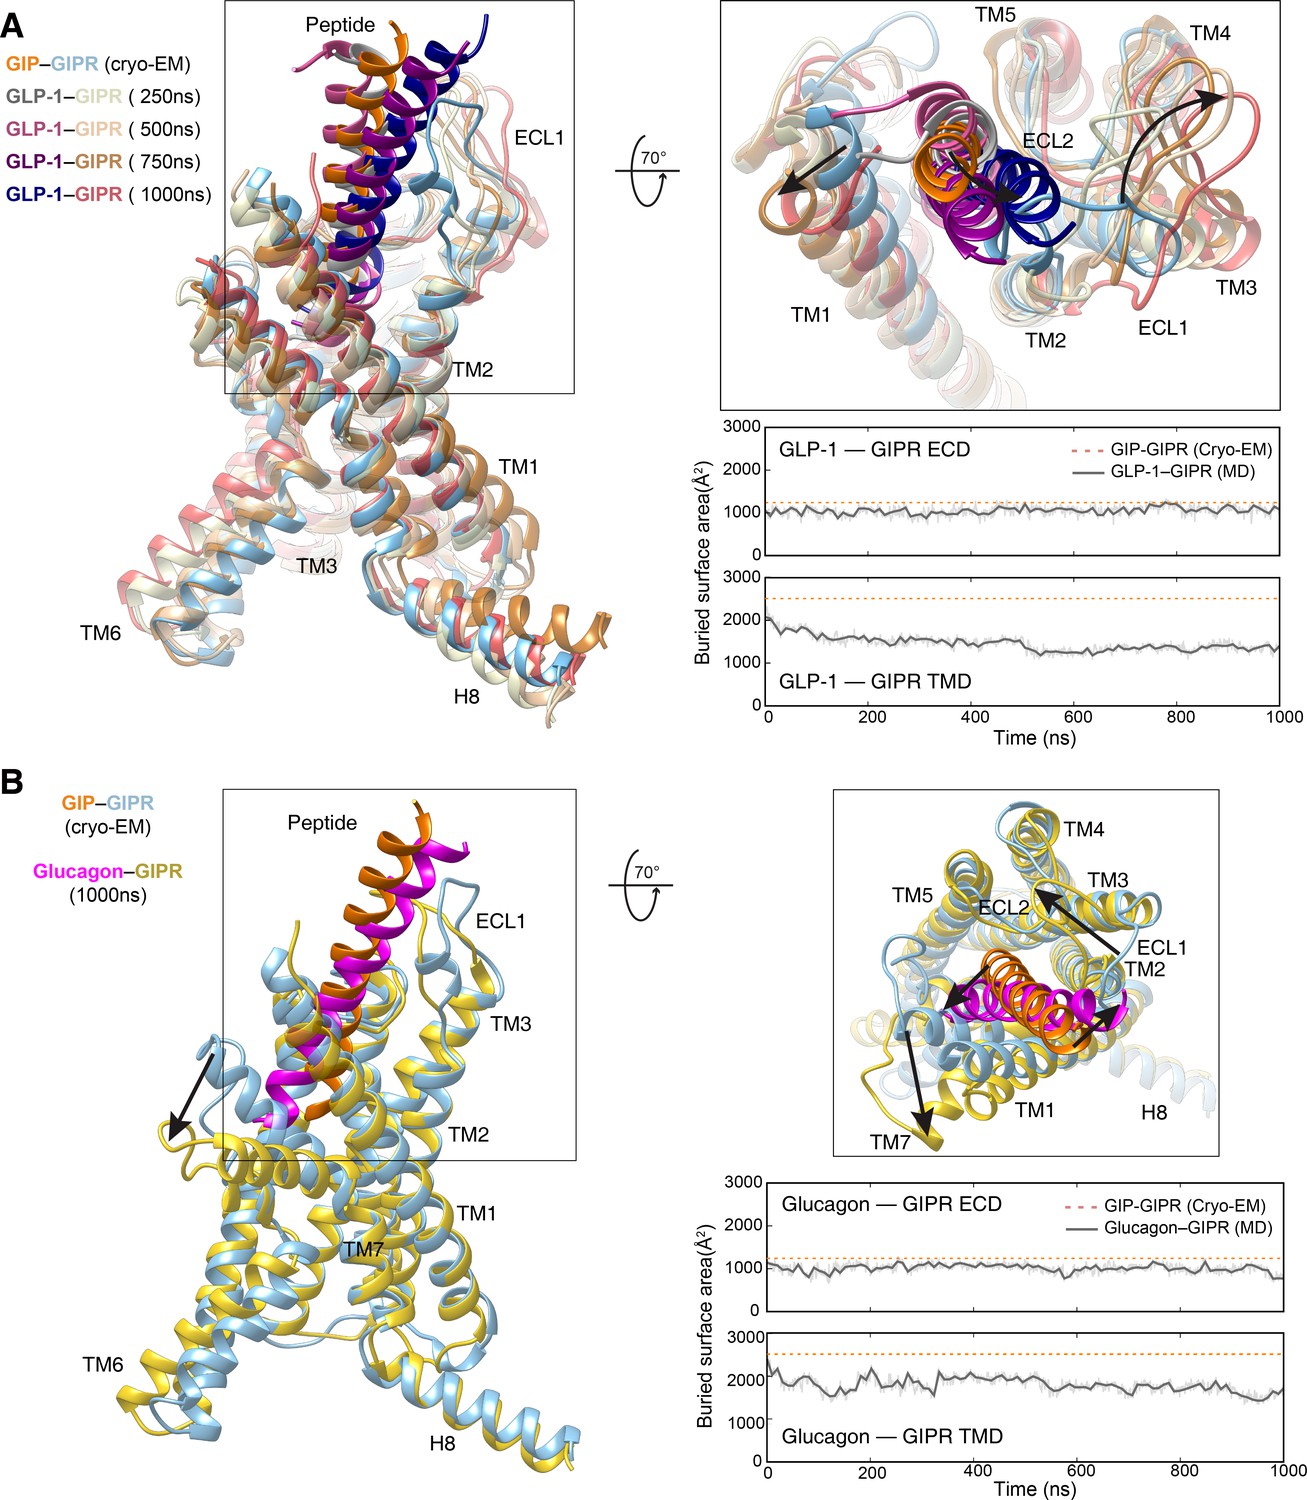
Molecular dynamics (MD) simulations of GIPR in complex with GLP-1 and glucagon.
(A) Left, comparison of peptide binding between simulation snapshots of GLP-1–GIPR and the cryo-EM structure of GIP–GIPR–Gs complex. ECD and G protein are omitted for clarity. Right top, extracellular view of the interaction between peptide and TMD. Right bottom, the buried surface area between GLP-1 and GIPR. (B) Left, comparison of peptide binding between simulation snapshots of glucagon–GIPR and the cryo-EM structure of GIP–GIPR–Gs complex. ECD and G protein are omitted for clarity. Right top, extracellular view of the interaction between peptide and TMD. Right bottom, the buried surface area between glucagon and GIPR. Interface areas were calculated using freeSASA (Zhang et al., 2020).
Figure 4—figure supplement 3
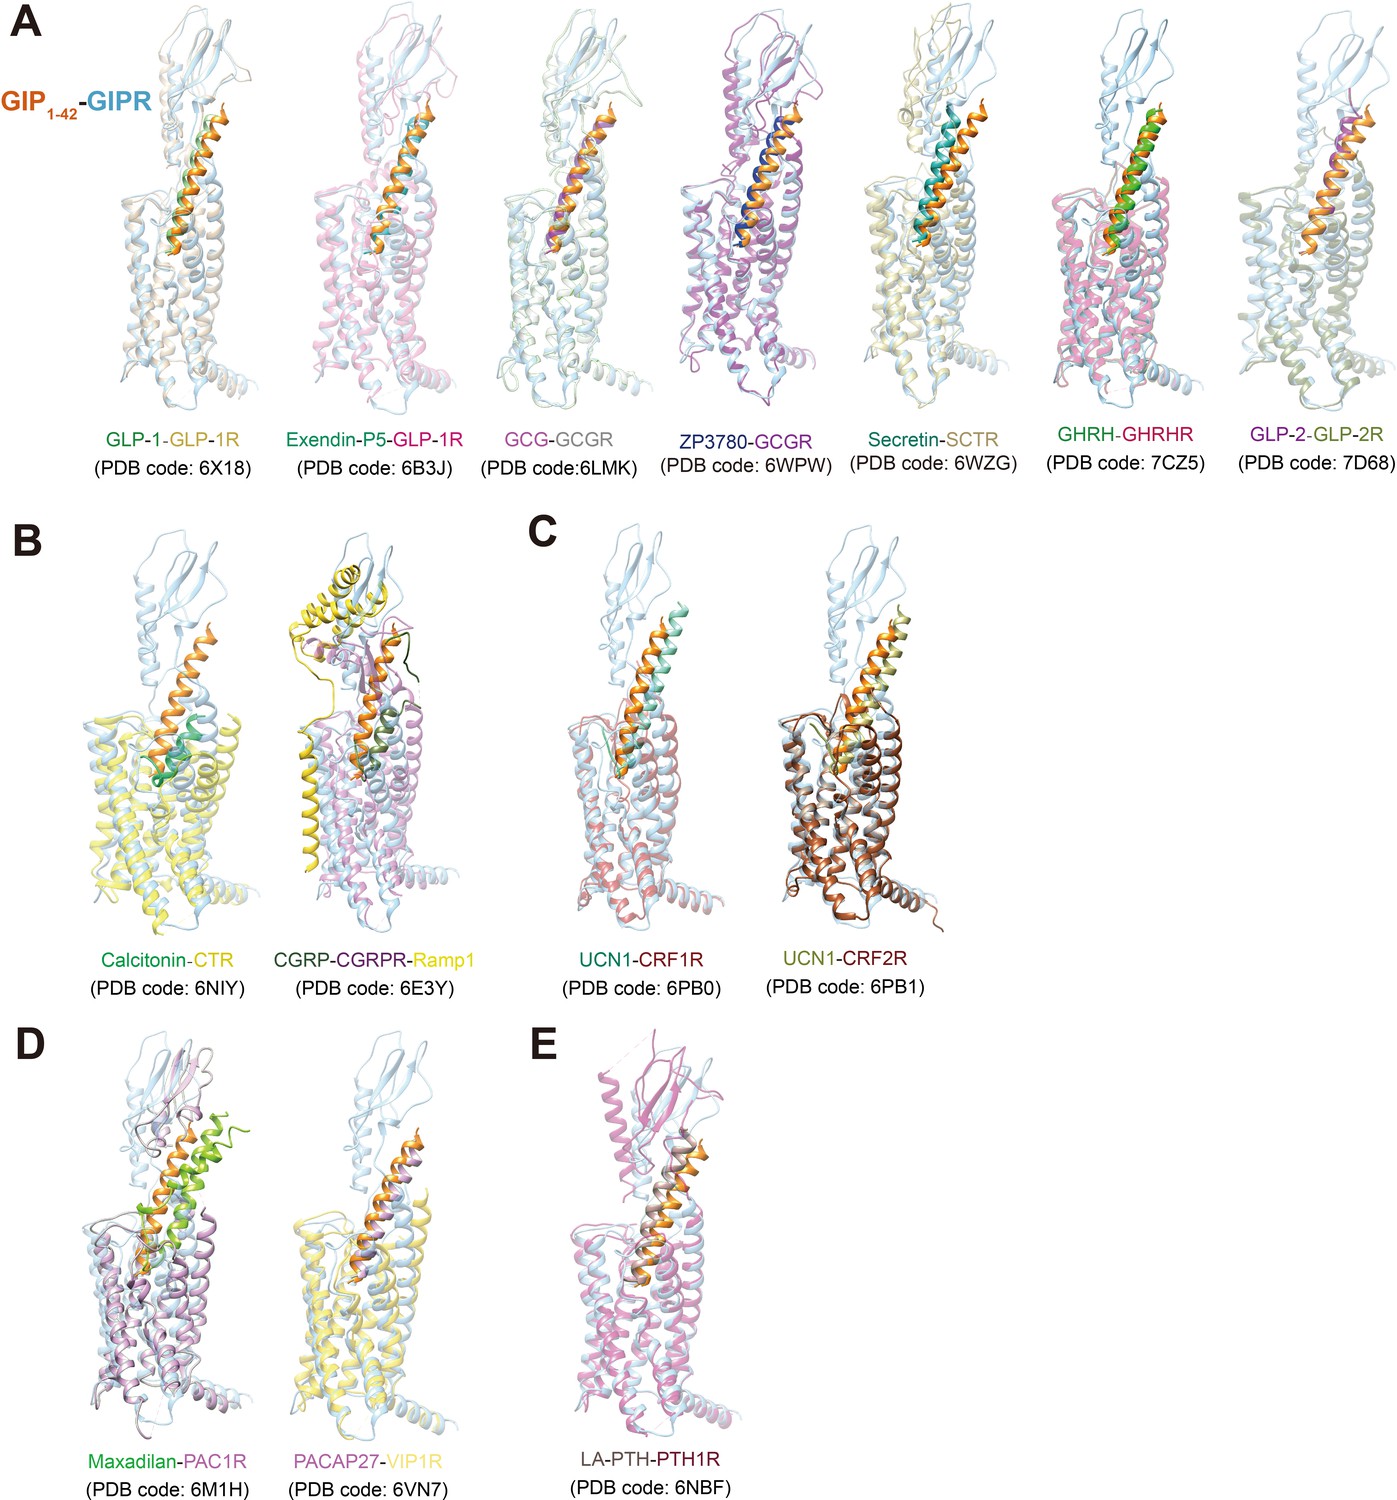
Comparison of the cryo-EM structure of GIPR with other class B1 receptors.
(A) The glucagon subfamily of GPCRs (Zhou et al., 2020; Sun et al., 2020; Qiao et al., 2020; Zhang et al., 2017a; Dong et al., 2020); (B) calcitonin subfamily (Liang et al., 2018a); (C) corticotropin-releasing factor (CRF) subfamily (Ma et al., 2020; Liang et al., 2020); (D) pituitary adenylate-cyclase-activating peptide (PACAP) and vasoactive intestinal polypeptide (VIP) receptor subfamily (Duan et al., 2020; Liang et al., 2020; Wang et al., 2020); (E) parathyroid hormone subfamily (Zhao et al., 2019).
Figure 4—figure supplement 4
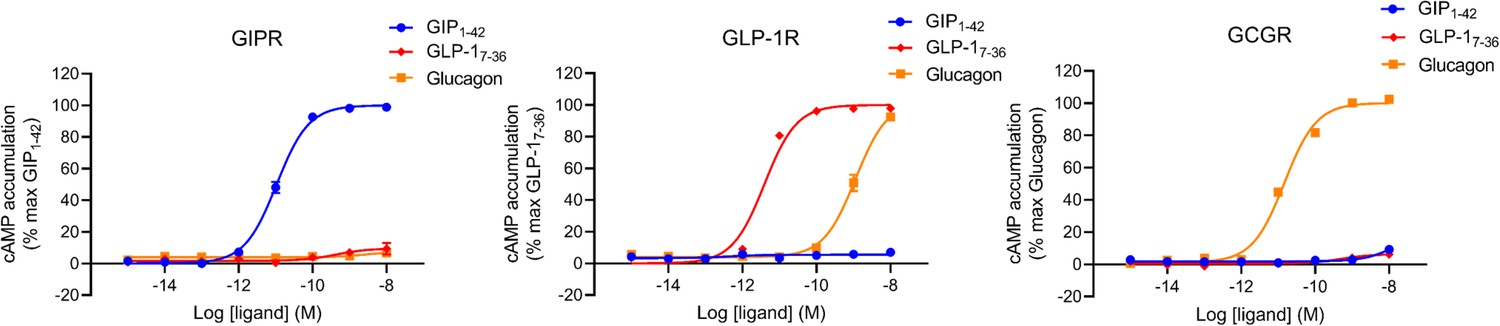
GIP1-42, GLP-17-36, or glucagon-elicited cAMP accumulation was measured in HEK 293T cells expressing GIPR, GLP-1R, or GCGR, respectively.
Author response image 1
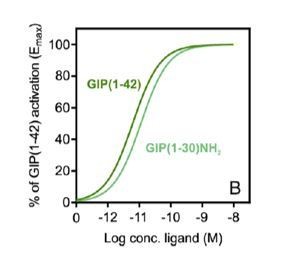
cAMP signaling profiles of GIP(1–42) and GIP(1–30)NH2.
(PMID: 31809770).
Author response image 2
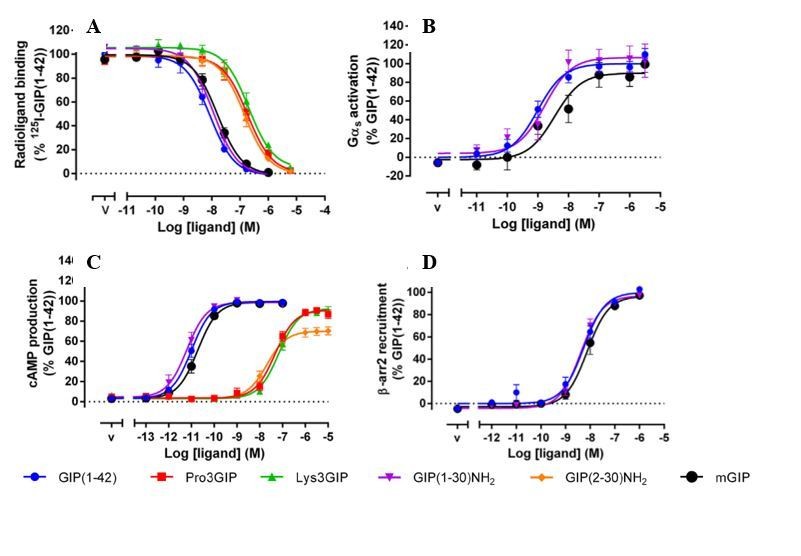
Pharmacological profiles of the naturally occurring GIPR agonists, GIP(1–42) and GIP(1–30)NH2.
(A) Competition of 125I-GIP(1-42) binding to GIPR by GIP analogues. Binding affinity data are expressed as a percentage of measured bound vs. bound in the absence of peptide, each corrected for non-specific binding (measured in the presence of 1 μM of GIP(1-42) or GLP-1(7-36)NH2). (B) Gαs activation in GIPR expressing cells by GIP analogues. Gαs activation assay was performed in HEK293A cells transiently transfected with either GIPR or GLP-1R. (C) cAMP accumulation at GIPR by GIP analogues. The assay was performed in HEK293 cells stably expressing GIPR or GLP-1R. Measurement was converted to absolute cAMP levels using a standard curve and then normalized to the maximal response of the cognate ligands for each receptor. (D) β-arrestin2 (β-arr2) recruitment to GIPR by GIP analogues. β-arrestin recruitment assay was performed in HEK293T cells transiently transfected with either Rluc8 tagged GIPR and Venus tagged β-arrestin 2. Data of at least four independent experiments are fitted to nonlinear regression three-parameter logistic curves. All values are means ± S.E.M. (PMID: 32360365).
Tables
Table 1
Cryo-EM data collection, refinement, and validation statistics.
| GIP–GIPR–Gs–Nb35 complex | |
|---|---|
| Data collection and processing | |
| Magnification | 46,685 |
| Voltage (kV) | 300 |
| Electron exposure (e–/Å2) | 80 |
| Defocus range (μm) | −1.2 to −2.2 |
| Pixel size (Å) | 1.071 |
| Symmetry imposed | C1 |
| Initial particle images (no.) | 4,895,399 |
| Final particle images (no.) | 295,021 |
| Map resolution (Å) FSC threshold | 2.9 0.143 |
| Map resolution range (Å) | 2.7–5.0 |
| Refinement | |
| Initial model used (PDB code) | PDB codes 6WPW and 2QKH |
| Model resolution (Å) FSC threshold | 2.9 0.5 |
| Model resolution range (Å) | 2.7–5.0 |
| Map sharpening B factor (Å2) | −86.3 |
| Model composition Non-hydrogen atoms Protein residues Lipids | 9409 1156 6 |
| B factors (Å2) Protein Ligand Lipids | 133 143 121 |
| R.m.s. deviations Bond lengths (Å) Bond angles (Å) | 0.005 1.036 |
| Validation MolProbity score Clash score Poor rotamers (%) | 1.21 4.23 0.00 |
| Ramachandran plot Favored (%) Allowed (%) Disallowed (%) | 98.15 1.85 0.00 |
Key resources table
| Reagent type (species) or resource | Designation | Source or reference | Identifiers | Additional information |
|---|---|---|---|---|
| Gene | GIPR_human | NCBI | NM_000164.4 | |
| Strain, strain background(Escherichia coli) | BL21 (DE3) | TIANGEN | Cat # CB105 | |
| Cell line (Homo sapiens) | HEK 293T | ATCC | Cat # CRL-3216 | |
| Cell line (hamster) | CHO-K1 | ATCC | Cat # CCL-61 | |
| Cell line (insect) | Sf9 | Invitrogen | N/A | |
| Cell line (insect) | High-Five insect cells | ThermoFisher Scientific | Cat # B85502 | |
| Recombinant DNA reagent | pFastBac-HA-BRIL-TEV-2GSA-GIPR(22-421)T345F-15AA-LgBiT-TEV-OMBP-MBP | This paper | N/A | |
| Recombinant DNA reagent | pFastBac-HA-BRIL-TEV-2GSA-GIPR(22-421)−15AA-LgBiT-TEV-OMBP-MBP | This paper | N/A | |
| Recombinant DNA reagent | pFastBac-DNGαs | This paper | N/A | |
| Recombinant DNA reagent | pFastBac-Gβ1-peptide 86 | https://doi.org/10.1038/s41422-020-00442-0 | N/A | |
| Recombinant DNA reagent | pFastBac-Gγ2 | https://doi.org/10.1038/s41422-020-00442-0 | N/A | |
| Recombinant DNA reagent | PMESy4-Nb35 | https://doi.org/10.1016/j.molcel.2020.01.013 | N/A | |
| Recombinant DNA reagent | pcDNA3.1-GIPR (WT and mutants)−3Flag | This paper | N/A | |
| Peptide, recombinant protein | GIP1-42 | GenScript | N/A | |
| Chemical compound, drug | Protease Inhibitor Cocktail, EDTA-Free | TragetMol | Cat # C0001 | |
| Chemical compound, drug | Apyrase | Sigma-Aldrich (Merck) | Cat # A6132 | |
| Chemical compound, drug | TCEP | Sigma-Aldrich (Merck) | Cat # C4706 | |
| Chemical compound, drug | Lauryl maltose neopentylglycol (LMNG) | Anatrace | Cat # NG310 | |
| Chemical compound, drug | Cholesterol hemisuccinate (CHS) | Anatrace | Cat # CH210 | |
| Chemical compound, drug | Glyco-diosgenin (GDN) | Anatrace | Cat # GDN101 | |
| Chemical compound, drug | Amylose resin | NEB | Cat # E8021L | |
| Chemical compound, drug | ESF 921 culture medium | Expression Systems | Cat # 96-00-01 | |
| Chemical compound, drug | Fetal bovine serum (FBS) | Gibco | Cat # 10099–141 | |
| Chemical compound, drug | DMEM | Gibco | Cat # 12430–054 | |
| Chemical compound, drug | X-tremeGHNE HP DNA Transfection Reagent | Sigma-Aldrich (Roche) | Cat # 6366236001 | |
| Chemical compound, drug | Digitonin | Biosynth | Cat # D-3203 | |
| Chemical compound, drug | Salt active nuclease | Sigma-Aldrich | Cat # SRE0015-5KU | |
| Chemical compound, drug | Sodium pyruvate | Gibco | Cat # 11360–0’70 | |
| Chemical compound, drug | Lipofectamine 2000 transfection reagent | Invitrogen | Cat # 11668–019 | |
| Chemical compound, drug | 125I-GIP | PerkinElmer | Cat # NEX402010UC | |
| Chemical compound, drug | BSA | ABCONE | Cat # A23088-100G | |
| Antibody | Anti-Flag primary antibody | Sigma-Aldrich | Cat # F3165 | |
| Antibody | Anti-mouse Alexa Fluor 488 conjugated secondary antibody | Invitrogen | Cat # A-21202 | |
| Commercial assay, kit | LANCE Ultra cAMP kit | PerkinElmer | Cat # 2675984 | |
| Software, algorithm | MotionCor2.1 | doi:10.1126/science.aav7942 | N/A | https://msg.ucsf.edu/em/software/motioncor2.html |
| Software, algorithm | Gctf v1.06 | https://doi.org/10.1016/j.jsb.2015.11.003 | N/A | https://www2.mrc-lmb.cam.ac.uk/research/locally-developed-software/zhang-software/ |
| Software, algorithm | RELION-3.0-beta2 | https://doi.org/10.1016/j.jsb.2012.09.006 | N/A | https://www3.mrc-lmb.cam.ac.uk/relion/index.php/Download_%26_install |
| Software, algorithm | COOT | https://doi.org/10.1107/S0907444904019158 | N/A | https://www2.mrc-lmb.cam.ac.uk/personal/pemsley/coot/ |
| Software, algorithm | Phenix | https://doi.org/10.1107/S0907444909052925 | N/A | http://www.phenix-online.org/ |
| Software, algorithm | Chimera | https://doi.org/10.1002/jcc.20084 | N/A | https://www.cgl.ucsf.edu/chimera/ |
| Software, algorithm | PyMOL | Schrödinger | N/A | https://pymol.org/2/ |
| Software, algorithm | GraphPad Prism v7.0 | GraphPad Software | N/A | https://www.graphpad.com/ |
| Software, algorithm | FreeSASA | doi:10.12688/f1000research.7931.1 | N/A | http://freesasa.github.io/ |
| Software, algorithm | Gromacs 2018.5 | doi:10.1016/j.softx.2015.06.001 | N/A | https://manual.gromacs.org/2018.5/download.html |
| Software, algorithm | Protein Preparation Wizard | Schrödinger | N/A | https://www.schrodinger.com/products/protein-preparation-wizard |
| Software, algorithm | CHARMM-GUI Membrane Builder | https://doi.org/10.1002/jcc.23702 | N/A | https://charmm-gui.org/ |
| Software, algorithm | CHARMM36-CAMP | https://doi.org/10.1021/ct200328p | N/A | |
| Software, algorithm | LINCS algorithm | https://doi.org/10.1021/ct700200b | N/A | |
| Software, algorithm | Semi-isotropic Parrinello-Rahman barostat | https://doi.org/10.1016/0022-3093(93)90111-A | N/A |
Additional files
-
Source data 1
All the source data files.
- https://cdn.elifesciences.org/articles/68719/elife-68719-data1-v2.zip
-
Transparent reporting form
- https://cdn.elifesciences.org/articles/68719/elife-68719-transrepform-v2.docx
Download links
A two-part list of links to download the article, or parts of the article, in various formats.
Downloads (link to download the article as PDF)
Open citations (links to open the citations from this article in various online reference manager services)
Cite this article (links to download the citations from this article in formats compatible with various reference manager tools)
Structural insights into hormone recognition by the human glucose-dependent insulinotropic polypeptide receptor
eLife 10:e68719.
https://doi.org/10.7554/eLife.68719


