Visualizing formation of the active site in the mitochondrial ribosome
- MRC Laboratory of Molecular Biology, United Kingdom
- Centre for Trophoblast Research, Department of Physiology, Development and Neuroscience, University of Cambridge, United Kingdom
- Gurdon Institute, University of Cambridge, United Kingdom
- Department of Genetics, University of Cambridge, United Kingdom
- Wellcome Sanger Institute, Wellcome Genome Campus, United Kingdom
Figures
Figure 1 with 2 supplements
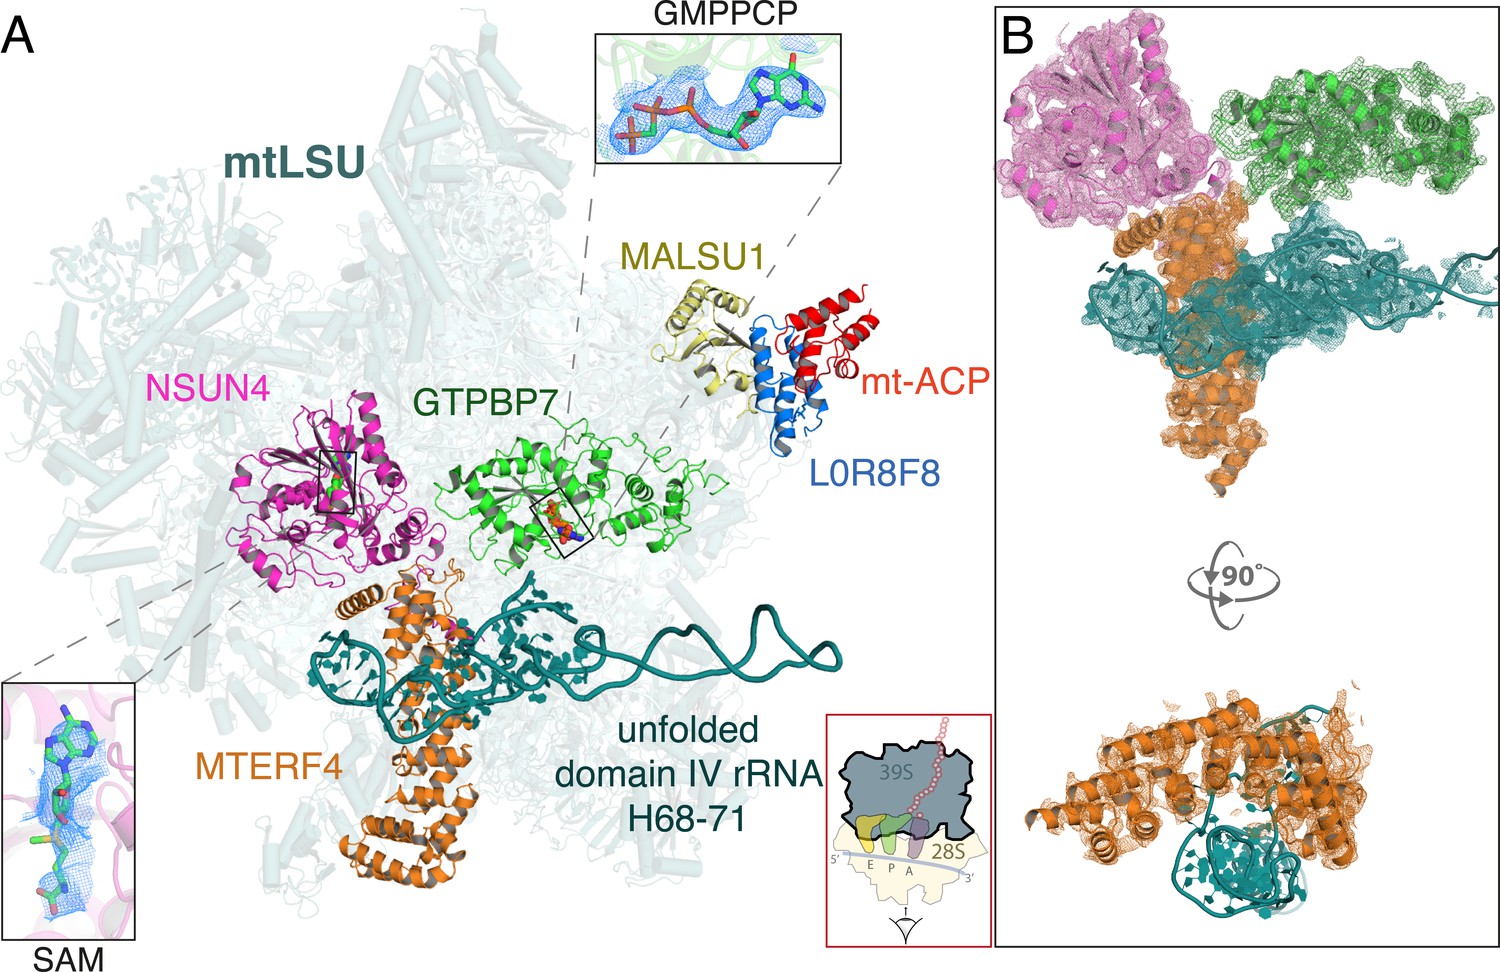
Architecture of the mitoribosomal LSU complexed with NSUN4·MTERF4·GTPBP7·GMPPCP and MALSU1-L0R8F8-mt-ACP.
(A) The inter-subunit interface faces the reader and a cartoon of an elongating mitoribosome is shown in the red box (bottom) to aid orientation. NSUN4 (pink) bound to S-adenosyl methionine (SAM, left inset), GTPBP7 (green) bound to the non-hydrolyzable GTP analog, GMPPCP (top inset) and MTERF4 (orange) interact with the subunit interface of the mtLSU assembly intermediate. The domain IV rRNA helices H68-71 (teal) are unfolded, rendering the aminoacyl, peptidyl, and exit sites incomplete. Also pictured are the anti-association factors MALSU1 (yellow), L0R8F8 (blue), and mt-ACP (red). (B) Map-to-model fits for NSUN4, MTERF4, GTPBP7, and the unfolded rRNA.
Figure 1—figure supplement 1

Cryo-EM analysis of human mitoribosomes Data processing scheme.
* indicates that the particles were re-extracted to 1.04 Å/pixel. cryo-EM, cryo-electron microscopy.
Figure 1—figure supplement 2

Gold-standard FSC curve (A) and local resolution (B) of the mtLSU assembly intermediate map. FSC, Fourier shell correlation; mtLSU, mitoribosomal large subunit.
Figure 2 with 2 supplements
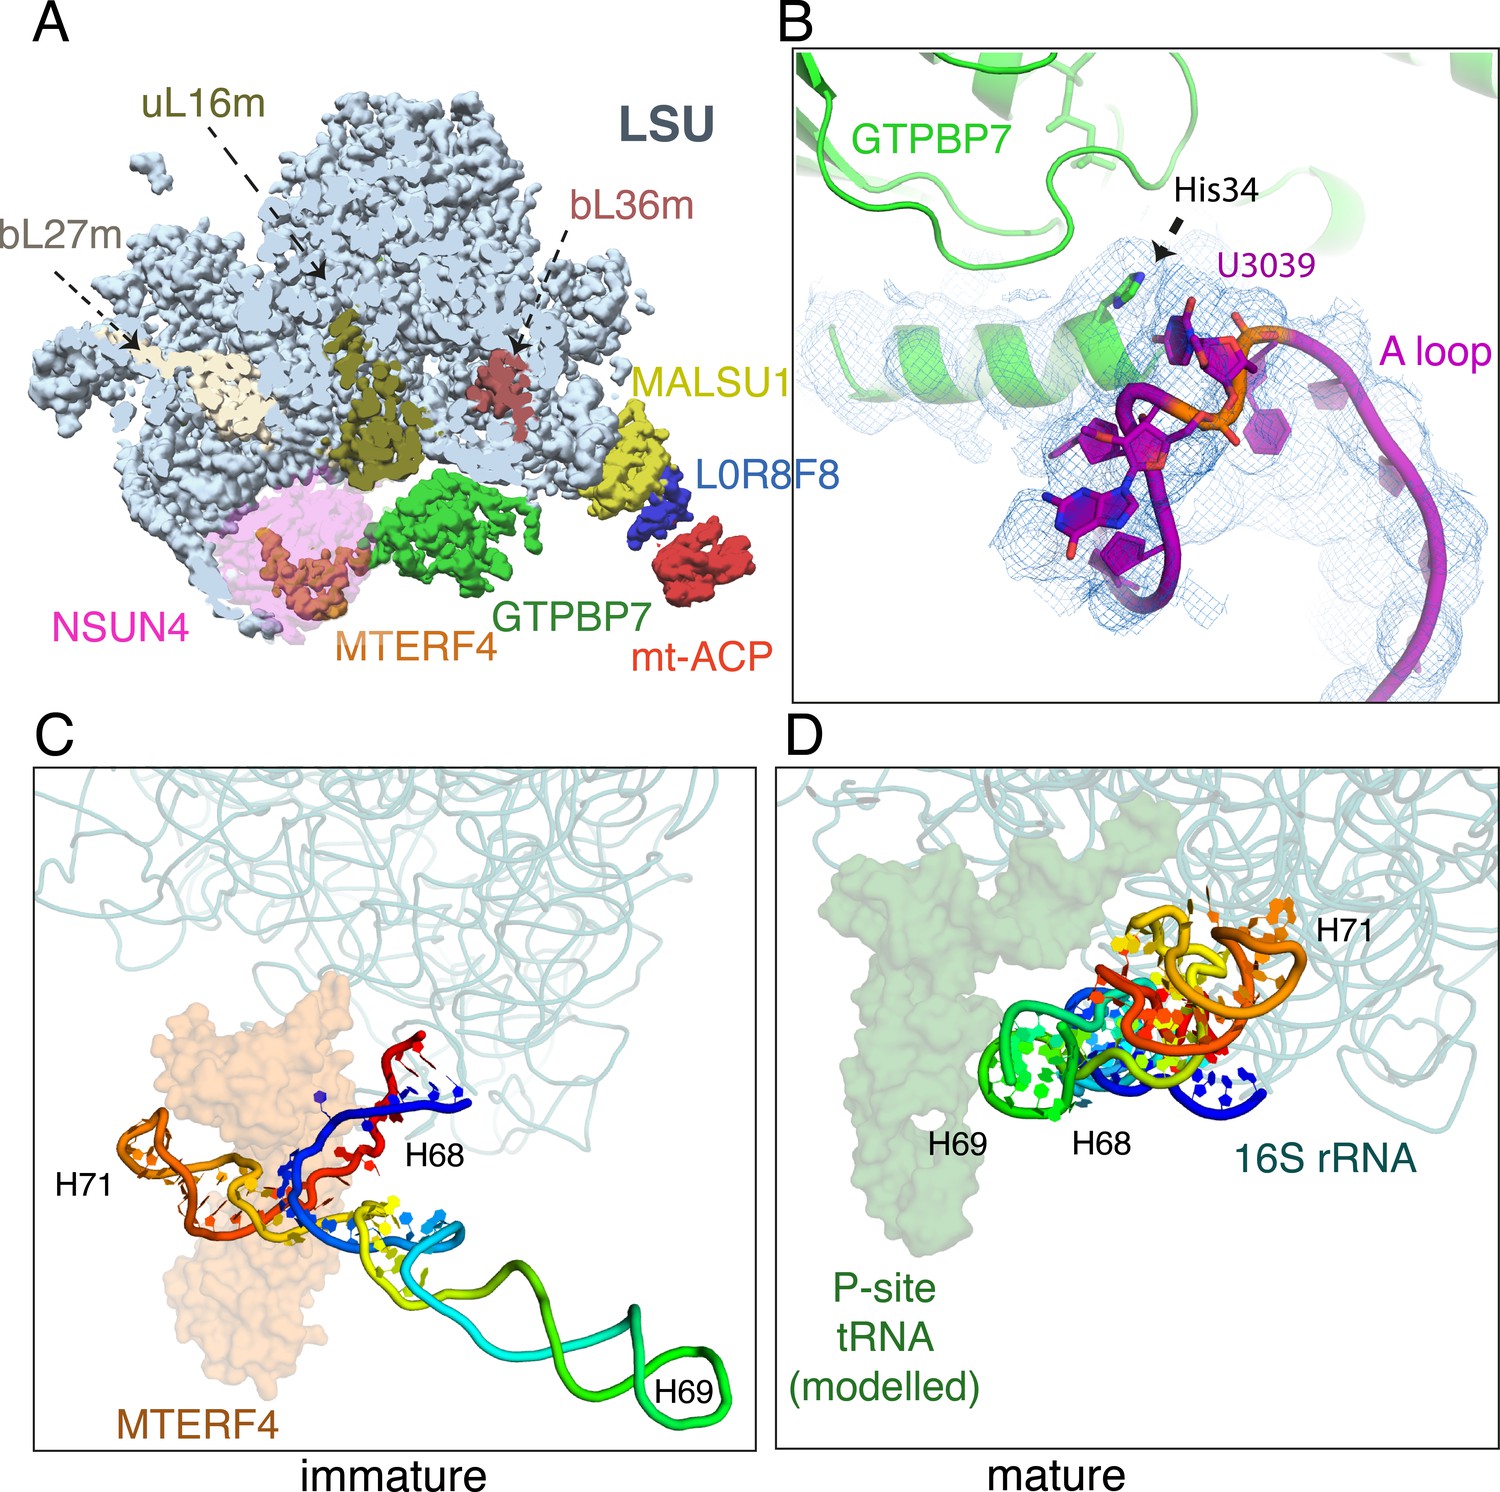
Maturation of the mtLSU by NSUN4·MTERF4·GTPBP7.
(A) Incorporation of uL16m (olive), bL27m (wheat) precedes NSUN4 (magenta) binding and before bL36m (brown). NSUN4 is shown translucent for clarity. (B) His34 of helix 1 of GTPBP7 verifies that 2′-O-methylation of A-loop base U3039 by MRM2 has occurred. Immature (C) and mature (D) conformations of domain IV rRNA helices H68–71 (rainbow). H69 would pack against a canonical P-site tRNA when present, and together this region forms the back wall of the A, P, and E sites of the mature 39S. MTERF4 (translucent orange) holds H68–71 in an unfolded conformation to permit assembly factors to access the core of the mtLSU. mtLSU, mitoribosomal large subunit; rRNA, ribosomal RNA.
Figure 2—figure supplement 1

Comparison of MTG1-bound human mtLSU and RbgA-bound Bacillus subtilis 45S.
The inter-subunit interface is oriented toward the reader. GTPBP7 (top) or RbgA (bottom) bound to the non-hydrolyzable GTP analogs, GMPPCP (top) or GMPPNP (bottom) interact at equivalent locations on the human mtLSU and bacterial 45S, respectively. mtLSU, mitoribosomal large subunit.
Figure 2—figure supplement 2
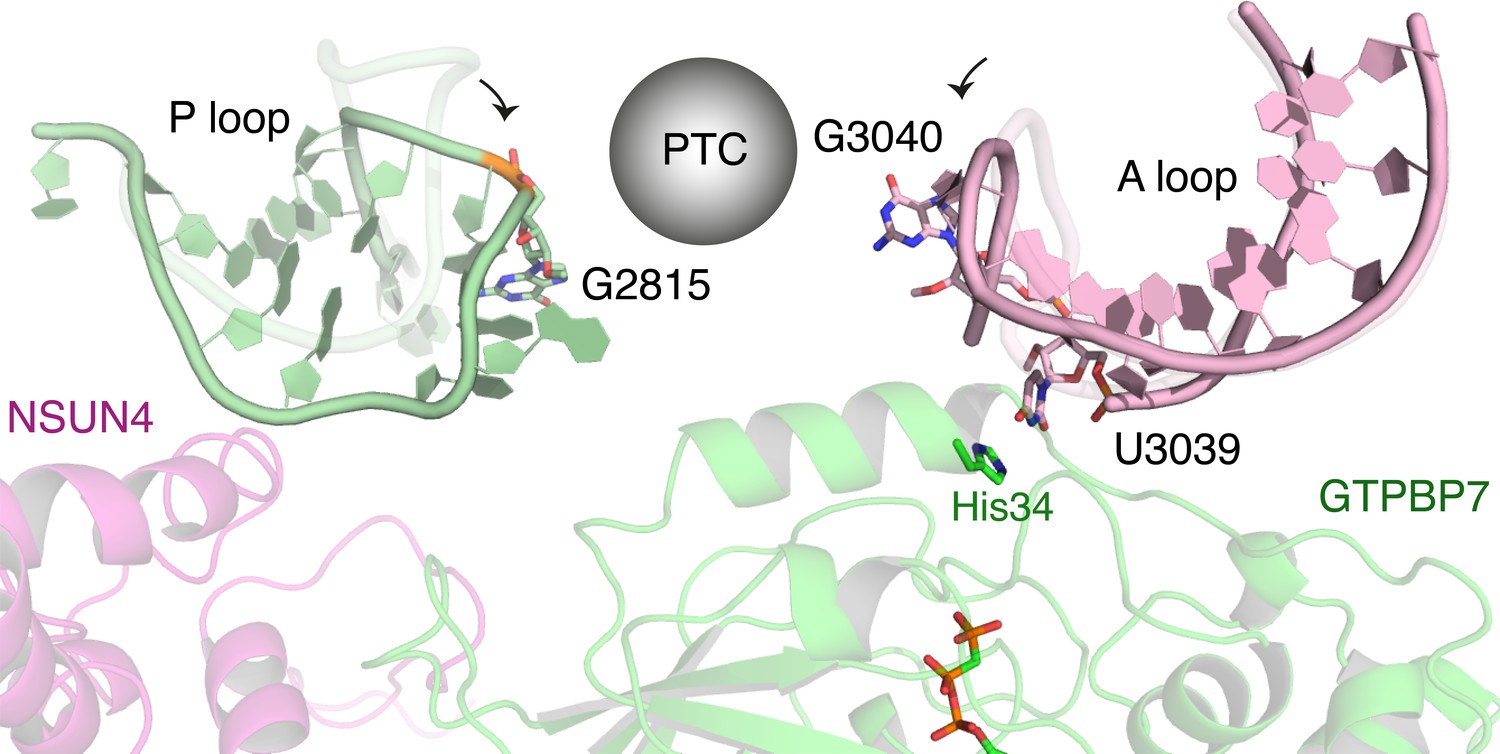
GTPBP7 binds directly to the A loop of the 16S rRNA.
The tips of the A and P loops move toward GTPBP7 and NSUN4 relative to their positions in the mature mitoribosomes (overlaid in translucent colors). rRNA, ribosomal RNA.
Figure 3 with 3 supplements
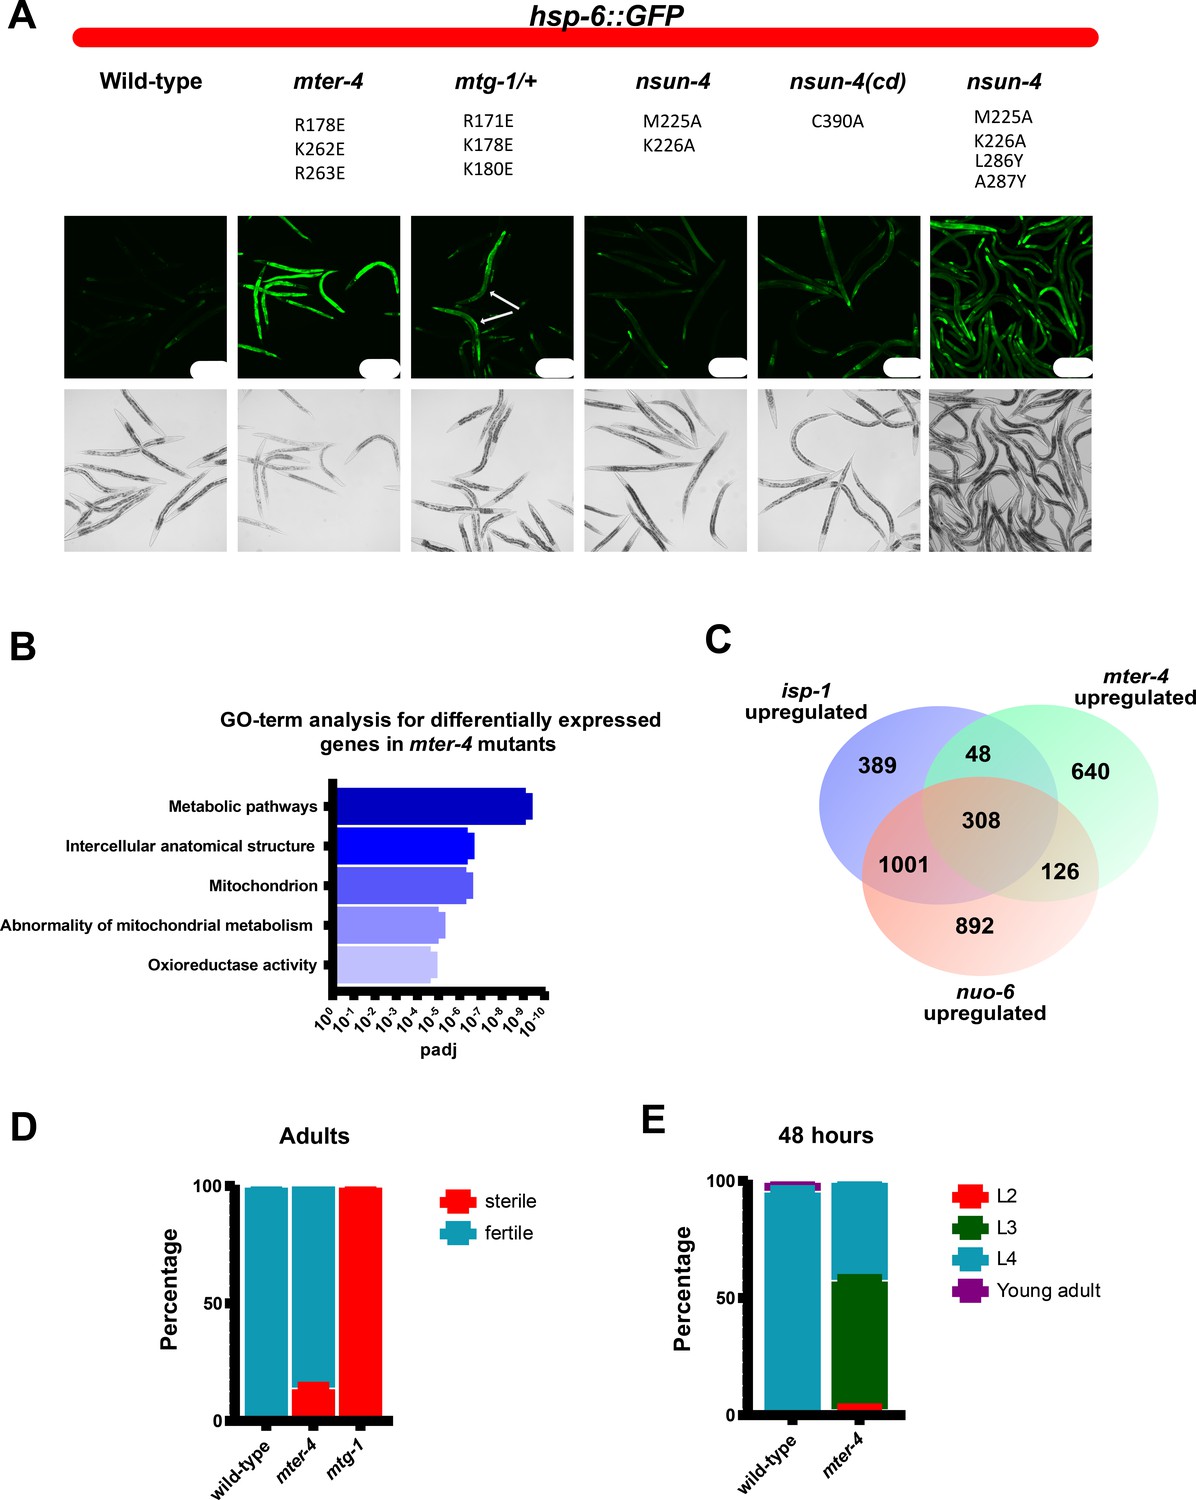
Mutations that disrupt mitoribosomal LSU binding result in activation of the mitochondrial unfolded protein response, delayed development, and decreased fertility.
(A) Representative images of hsp-6::GFP expression in wild-type, mter-4R178E,K262E,K263E, mtg-1R171E,K178E,K180E, nsun-4M225A,K226A, catalytic dead nsun-4C90A, and nsun-4M225A,K226A,L286Y,A287Y mutant animals. The matched wild-type control for nsun-4M225A,K226A,L286Y,A287Y resembles the shown wild-type, and is omitted for simplicity. White arrows in mtg-1 mutants represent homozygous mutant animals based on the absence of umnIs21 reporter expression from balancer chromosome. All animals express the zcIs13 [hsp-6::GFP] reporter which is specifically expressed in response to mitochondrial stress. Animals were grown for 72 hr at 22.5°C. Scale bars=200 µm. (B) Top five GO-terms based on p-value from g:Profiler analysis of genes upregulated greater than 0.5 (log2) in mter-4R178E,K262E,K263E mutants when compared to wild-type animals. (C) Venn diagram comparison of genes upregulated in mter-4R178E,K262E,K263E, isp-1(qmv150), and nuo-6(qm200) mutants. isp-1 and nuo-6 gene expression data from Yee et al., 2014. (D) Fraction of wild-type and mter-4R178E,K262E,K263E mutants sterile at 22.5°C. n=100 animals. (E) Fraction of wild-type and mter-4R178E,K262E,K263E mutants at different developmental stages after 48 hr at 22.5°C. n=200 animals. GO, gene ontology.
Figure 3—figure supplement 1

Sequence alignments of Caenorhabditis elegans (Ce) and human (Hs) MTERF4 (top), NSUN4 (middle), and GTPBP7 (MTG1, bottom).
Residues that are important for mitoribosome binding and that were mutated in this study are highlighted in red.
Figure 3—figure supplement 2
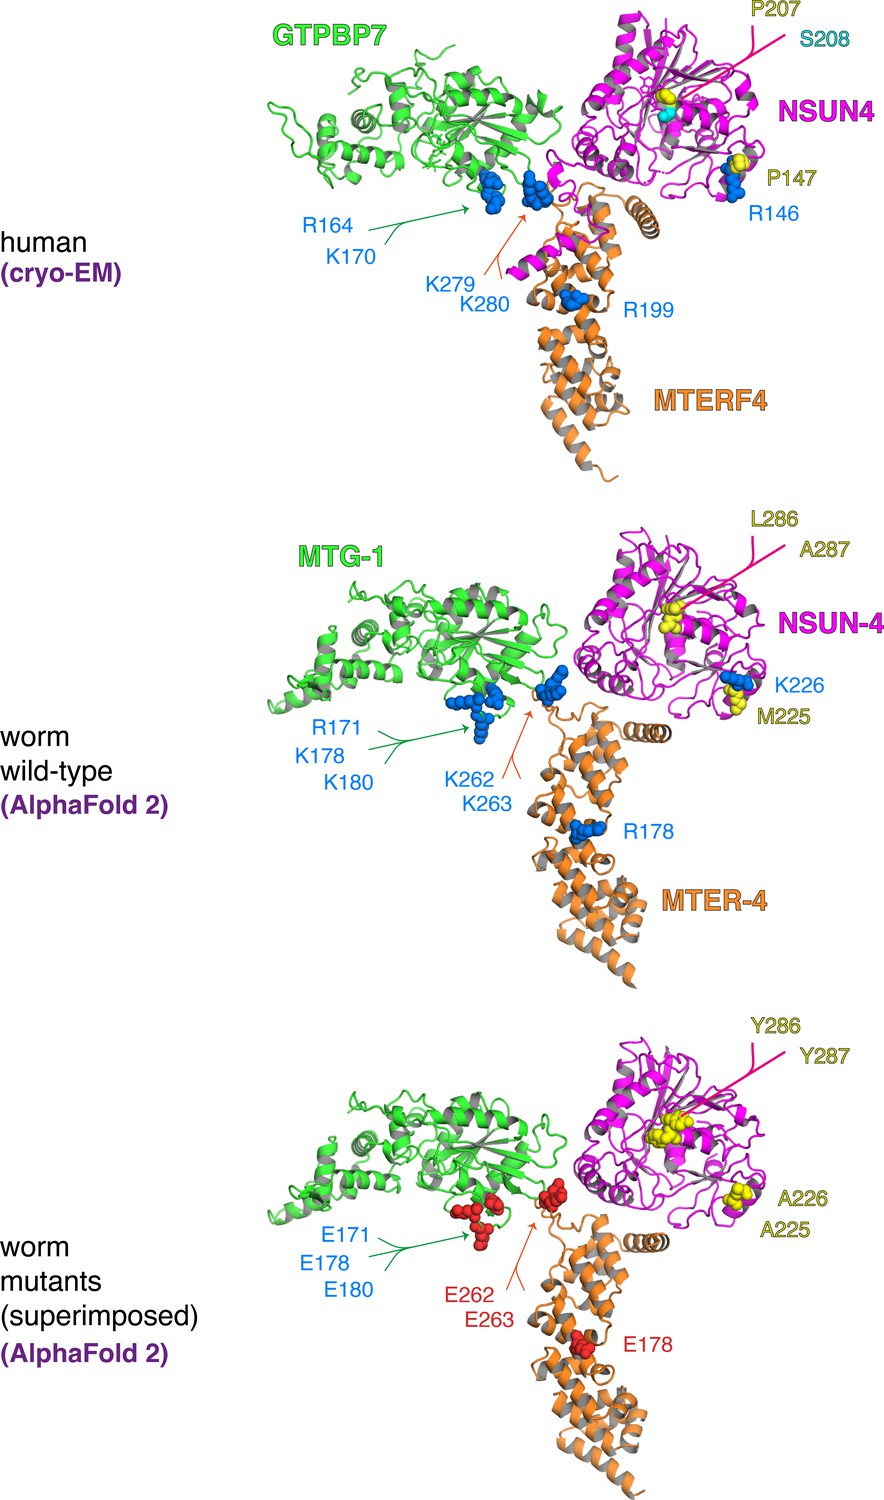
Structural conservation of human and Caenorhabditis elegans MTERF4, NSUN4, and GTPBP7.
Cryo-EM structure of the human complex (top) and C. elegans AlphaFold 2 models of wild-type (middle) and mutant (bottom) MTERF4 (orange), NSUN4 (magenta) and GTPBP7 (green) illustrate the high degree of structural conservation from human to worm. The introduced mutations in the mitoribosome binding interfaces of the C. elegans proteins do not affect the overall fold of the proteins as predicted by AlphaFold 2. Mutated sidechains are depicted as spheres and coloured by type (positive - blue, negative - red, hydrophobic – yellow, polar - cyan). Note that worm strains generated in this study did not carry mutations on all three proteins simultaneously as depicted here.
Figure 3—figure supplement 3
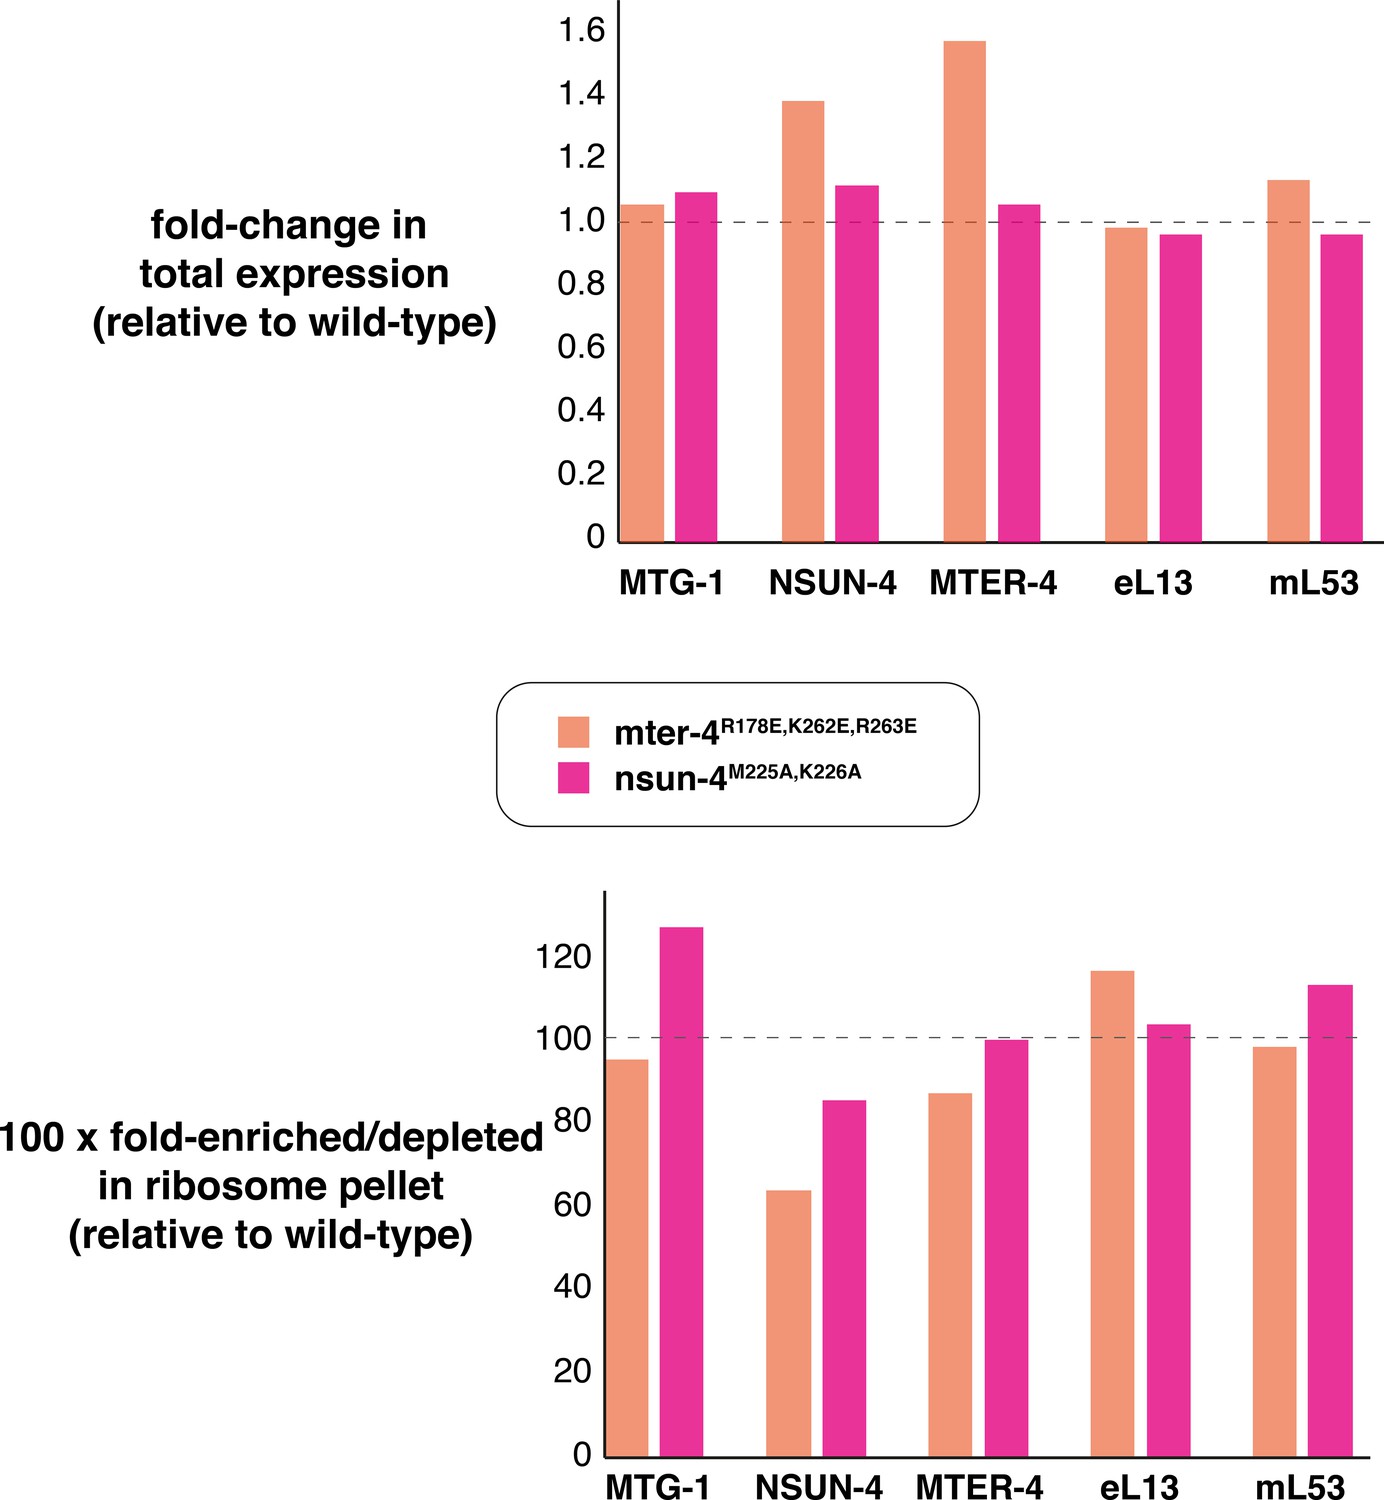
TMT-MS quantification of protein levels (top).
Total protein levels of MTG-1, NSUN-4, and MTER-4 as well as the cytosolic ribosomal protein eL13 and the mitoribosomal protein mL53 are comparable to those in wild-type worms. Each value is an average of two biological replicates. (bottom) NSUN-4 and MTER-4 are significantly depleted in the ribosomal fraction (which includes cytosolic and mitochondrial ribosomes) in the mter-4R178E,K262E,R263E strain and to a lesser extent in the nsun-4M225A,K226A strain. TMT-MS, Tandem mass tag-mass spectrometry.
Figure 4
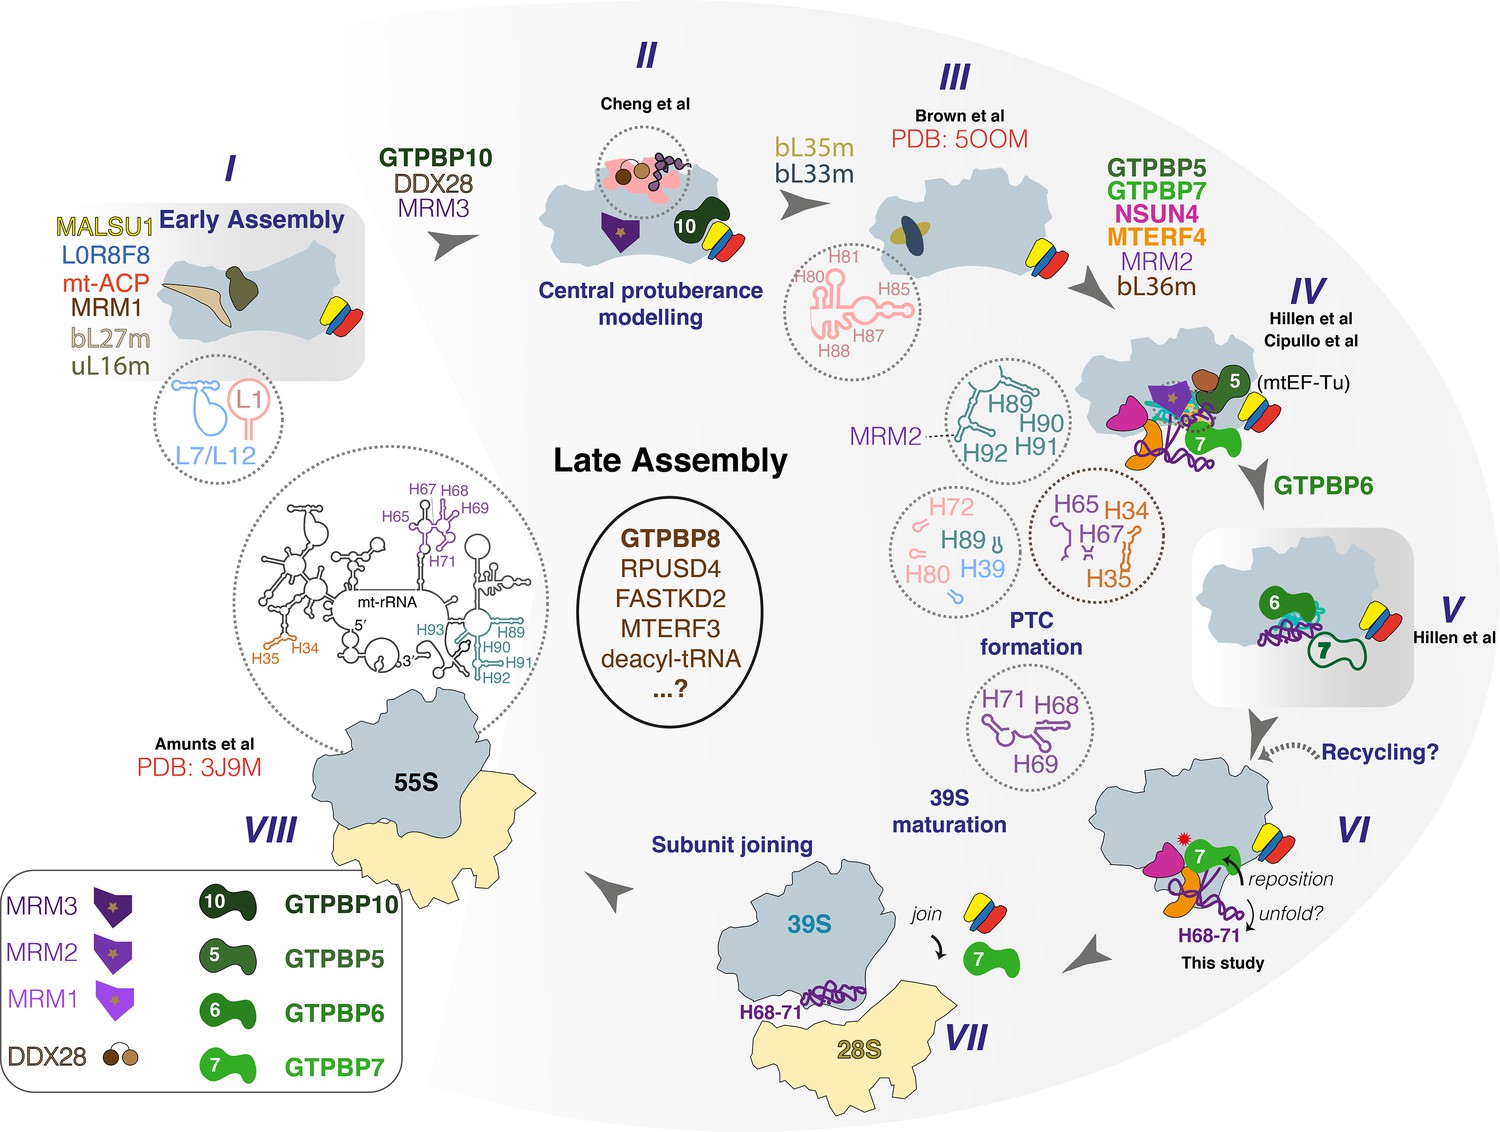
Proposed sequence of events in late-stage mtLSU assembly.
States I–VIII along the human mtLSU late-stage maturation pathway, including recently reported states II (Cheng et al., 2021), III (Brown et al., 2017), IV (Cipullo et al., 2021; Hillen et al., 2021), V (Hillen et al., 2021), VI (this study), and VIII (Amunts et al., 2015). Note that state V was seen only to contain GTPBP6 and GTPBP7 is therefore depicted hollow. mtLSU, mitoribosomal large subunit.
Videos
Video 1
Proposed events during formation of the mitoribosomal peptidyl transferase centre.
Tables
Table 1
Data collection, processing, refinement, and model statistics.
| Data collection | |
|---|---|
| Voltage (kV) | 300 |
| Pixel size (Å) | 1.04 |
| Detector | Falcon III |
| Defocus range (μm) | −1.1 to −3.2 |
| Defocus mean (μm) | −2.1 |
| Electron dose (e− frame−1 Å−2) | 1.5 |
| Data processing | |
| Independent data collections | 7 |
| Useable micrographs | 43,950 |
| Particles picked | 3,374,367 |
| Final particles | 66,340 |
| Map sharpening B-factor (Å2) | −10 |
| Resolution (Å) | 3.4 |
| EMPIAR accession code | EMPIAR-10809 |
| EMDB accession code | EMD-13329 |
| PDB accession code | 7PD3 |
| Model composition | |
| Chains | 70 |
| Non-hydrogen atoms | 108,053 |
| Protein residues | 9276 |
| RNA bases | 1522 |
| Metals (Mg2+/Zn2+) | 91/2 |
| Ligands | GCP (1), SAM (1) |
| Refinement | |
| Resolution (Å) | 3.4 |
| CC (mask) | 0.70 |
| R.M.S deviations | |
| Bond lengths (Å) | 0.009 |
| Bond angles (°) | 1.068 |
| Validation | |
| Molprobity score | 1.66 |
| Clashscore, all atoms | 4.97 |
| Rotamers outliers (%) | 0.01 |
| Cβ outliers (%) | 0.01 |
| Ramachandran plot | |
| Favored (%) | 94.17 |
| Allowed (%) | 5.69 |
| Outliers (%) | 0.14 |
Additional files
-
Supplementary file 1
Next-generation RNA sequencing data.
- https://cdn.elifesciences.org/articles/68806/elife-68806-supp1-v1.xlsx
-
Supplementary file 2
Statistics source data.
- https://cdn.elifesciences.org/articles/68806/elife-68806-supp2-v1.xlsx
-
Supplementary file 3
TMT-MS source data.
- https://cdn.elifesciences.org/articles/68806/elife-68806-supp3-v1.xlsx
-
Transparent reporting form
- https://cdn.elifesciences.org/articles/68806/elife-68806-transrepform-v1.docx
Download links
A two-part list of links to download the article, or parts of the article, in various formats.
Downloads (link to download the article as PDF)
Open citations (links to open the citations from this article in various online reference manager services)
Cite this article (links to download the citations from this article in formats compatible with various reference manager tools)
Visualizing formation of the active site in the mitochondrial ribosome
eLife 10:e68806.
https://doi.org/10.7554/eLife.68806


