Homotopic contralesional excitation suppresses spontaneous circuit repair and global network reconnections following ischemic stroke
- Department of Radiology, Washington University in St. Louis, United States
- Department of Neurology, Washington University in St. Louis, United States
- Department of Biology, Washington University in St. Louis, United States
- Department of Neurology, Washington University School of Medicine, United States
- Department of Clinical Sciences, Lund University, Sweden
Figures
Figure 1
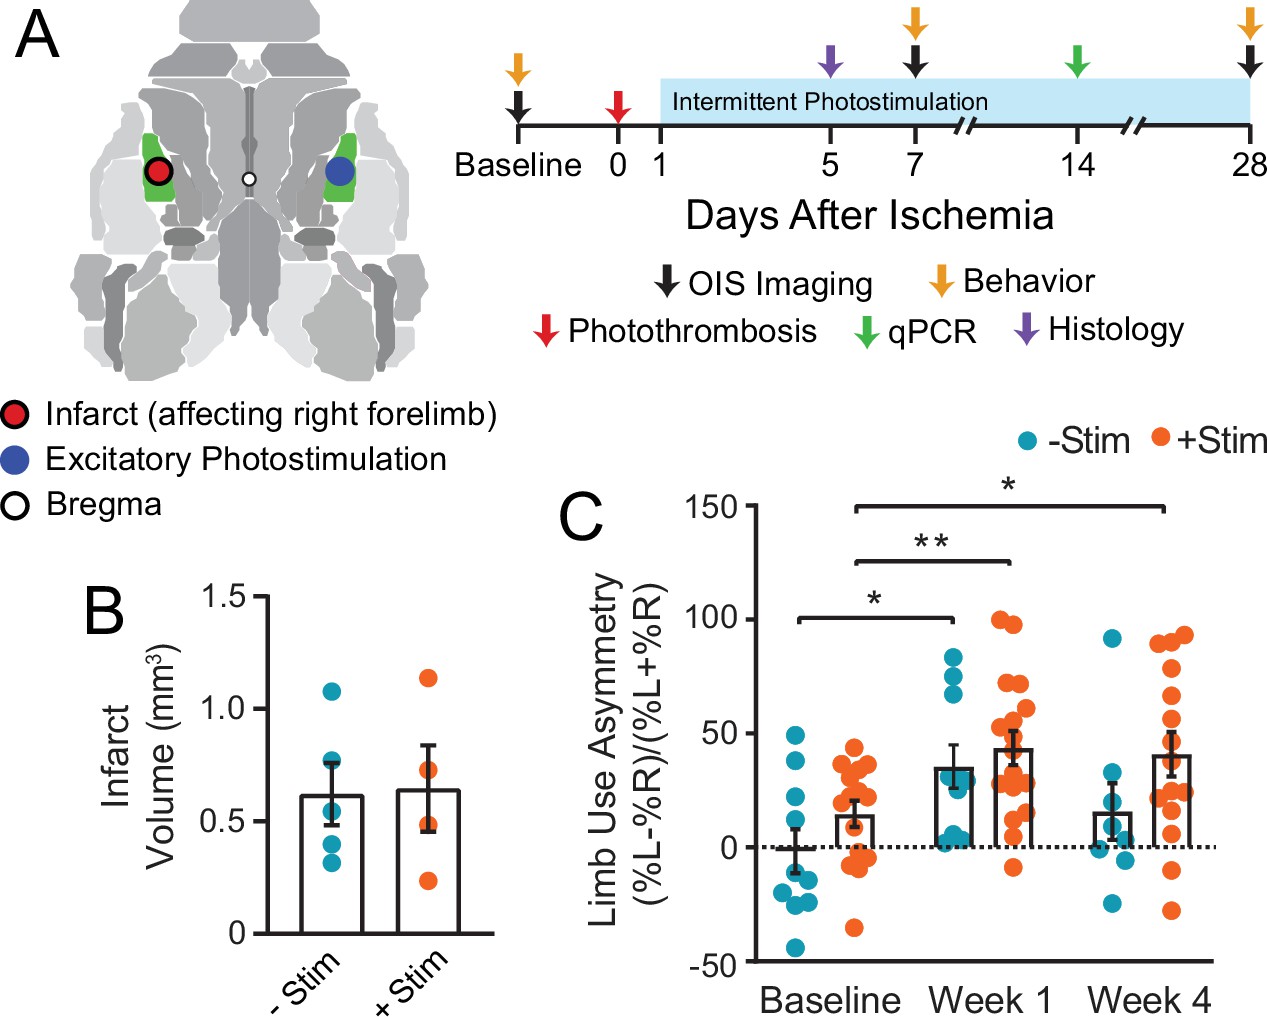
Graphical illustration of experiment and timeline.
(A) Photothrombosis was delivered to primary somatosensory forepaw cortex (S1FP, shown in green) in the left hemisphere. Beginning on day 1 after focal ischemia, a subset of mice received interventional optogenetic photostimulation of homotopic S1FP in the right hemisphere for 3 min/day. Treatment was given for 5 consecutive days/week for 4 weeks. Optical intrinsic signal imaging of stimulus evoked activity (following electrical stimulation of the forepaws or optogenetic photostimulation of S1FP) and resting-state activity occurred before, and 1 and 4 weeks after stroke. Infarct volume and mRNA expression were characterized in a subset of mice from both groups at 5 and 14 days after photothrombosis. (B) Infarct volume characterized 5 days post photothrombosis for −Stim (n=5) and +Stim (n=4) groups were statistically equivalent. (C) Limb use as measured by cylinder rearing test in –Stim (n=15) and +Stim (n=20) groups. Symmetrical limb use was observed at baseline time points in all mice. Photothrombosis resulted in use asymmetry due to decreased use of right forelimb within the first week of both groups. The –Stim mice demonstrated significant improvement by week 4 while +Stim mice exhibited sustained use asymmetry at 4 weeks. Linear mixed-effects model (LMM) revealed a main effect of time (F1.77,39=8.7, p=0.0011). Post hoc tests were performed as t-tests assuming unequal group variance and corrected for multiple comparisons using false discovery rate correction. *=p<0.05; **=p<0.01; ***=p<0.001 compared to baseline time point. Statistical analyses were performed in Graph Pad Prism 8. All data reported as mean ± S.E.
Figure 2
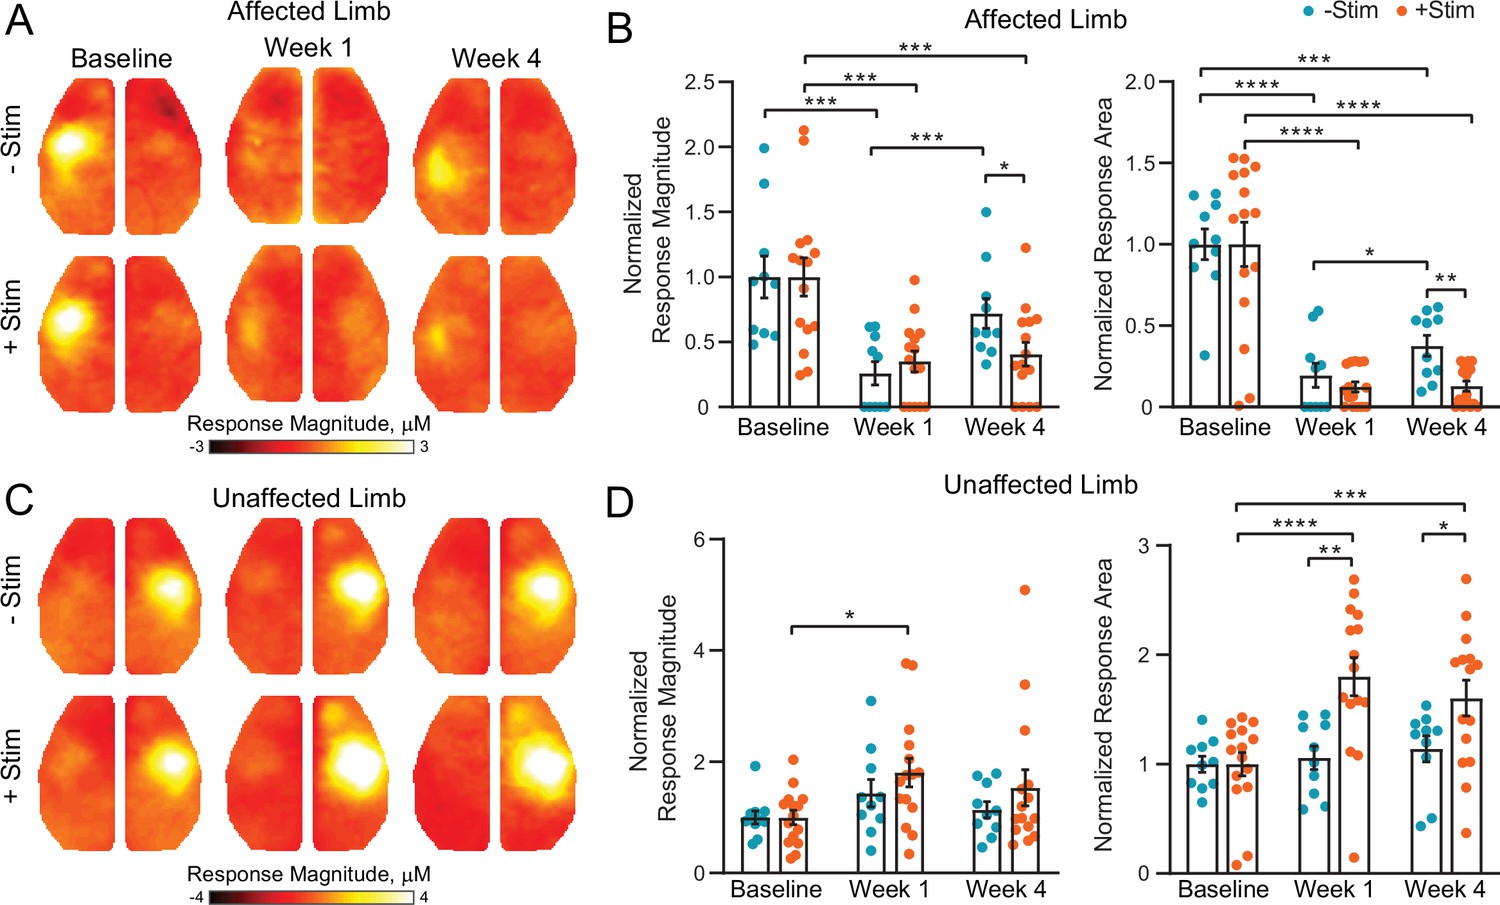
Contralesional activity inhibits cortical remapping after stroke.
(A) In the affected (right) limb, stimulus evoked responses following electrical forepaw stimulation were significantly reduced 1 week after stroke in both groups. Mice recovering spontaneously (–Stim, n=10, top row) exhibited robust activations at 4 weeks, while responses in stimulated mice (+Stim, n=15) were comparable to week 1 responses. (B) Quantification of evoked response magnitude and area in the ipsilesional hemisphere. The 2-way repeated measures ANOVA (rmANOVA) during recovery revealed a significant group × time interaction (F1,23=5.12; p=0.033) for evoked response magnitude and a trending group × time interaction (F1,23=4.0; p=0.057) in response area. Main effects of group (F1,23=9.5; p=0.005) and time (F1,23=4.5; p=0.045) were observed for response area while magnitude also exhibited a main effect of time (F1,23=8.32; p=0.008). (C) In the unaffected (left) limb, –Stim mice exhibited a trend toward increased activity at week 1 that subsided by week 4. In +Stim mice, evoked responses were significantly elevated at weeks 1 and 4 compared to baseline. (D) Quantification of evoked response magnitude and area in the contralesional hemisphere. Over the duration of the experiment, 2-way rmANOVA revealed a significant group x time interaction (F2,46=6.02; p=0.0048), as well as a main effect of time (F1.7,39=9.34; p=0.0009) and group (F1,23=6.2; p=0.02) for evoked response area. A main effect of time (F1.8,41=6.43; p=0.0051) was observed for response magnitude. Post hoc tests were performed as t-tests assuming unequal group variance and corrected for multiple comparisons using false discovery rate correction. All analysis performed using total hemoglobin as contrast. Statistical analyses were performed in Graph Pad Prism 8. *=p<0.05; **=p<0.01; ***=p<0.001; ****=p< 0.0001.
Figure 3 with 1 supplement
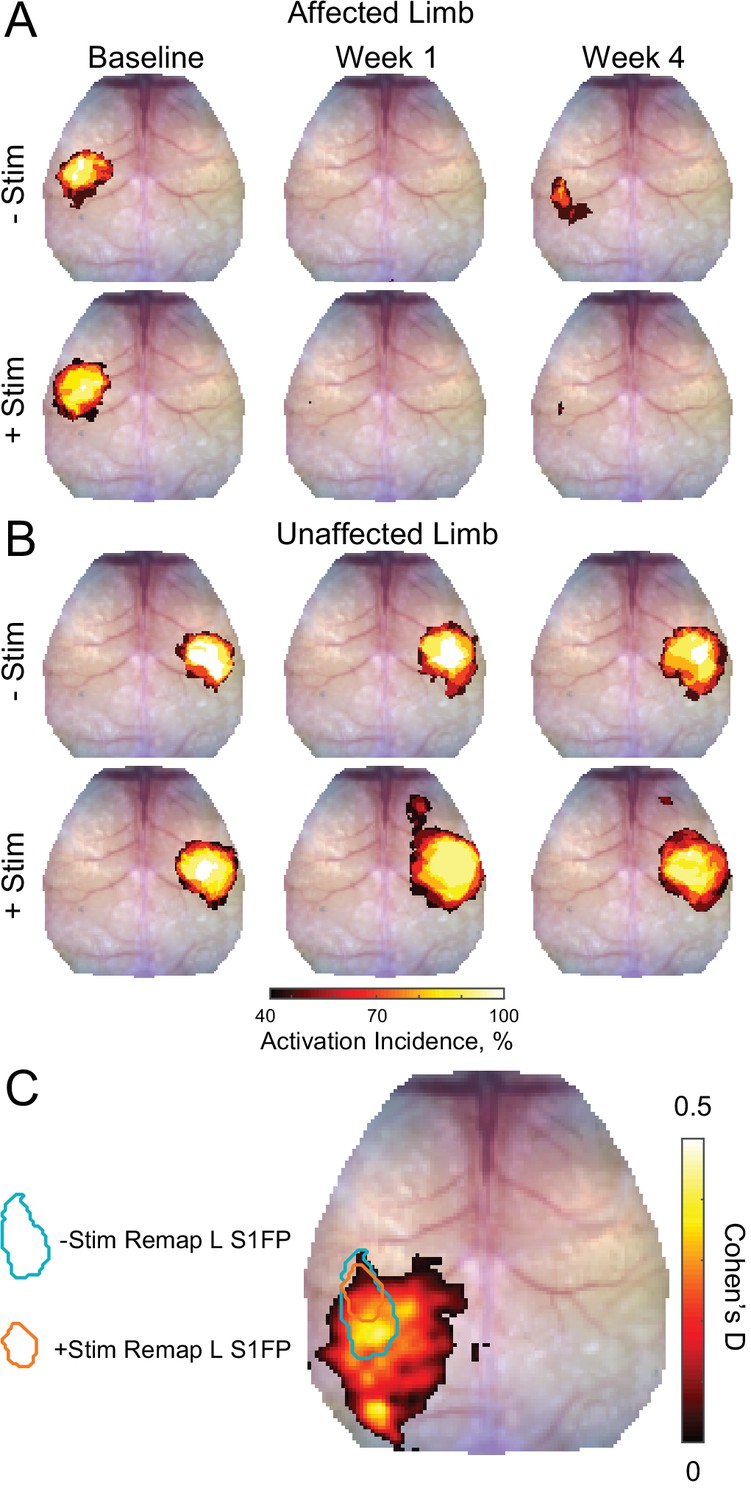
Activation incidence and effect size of forepaw remapping maps of activation incidence for evoked responses reported in Figure 2 in the (A) affected and (B) unaffected limb of each group (–Stim [n=10] and +Stim [n=15]).
100% of mice produced robust responses at baseline in both limbs. (A) About 1 week after stroke, both groups exhibited significantly reduced activations in the affected limb, with at most 50% of mice having detectible responses in limited regions of cortex. By 4 weeks after stroke, 80% of –Stim mice exhibited reproducible responses in large regions of somatosensory cortex, posterior to the original forepaw region. Conversely, only 67% of +Stim mice had detectible responses that were smaller in total area. (B) In the unaffected limb, responses in the –Stim mice were largely similar across time points. However, responses in +Stim mice were generally larger (in line with Figure 2) and exhibited increased activity in forepaw motor cortex compared to the baseline time point. (C) Map of effect size showing main topographical differences in remapping between groups at 4 weeks following electrical stimulation of the affected forepaw. Cohen’s D was calculated using mouse-level T-maps (see main text) as –Stim minus +Stim so that an effect would manifest as a positive value. Contours of original and remapped forepaw response shown for reference. Statistical analyses were performed in MATLAB (2018a).
Figure 3—figure supplement 1
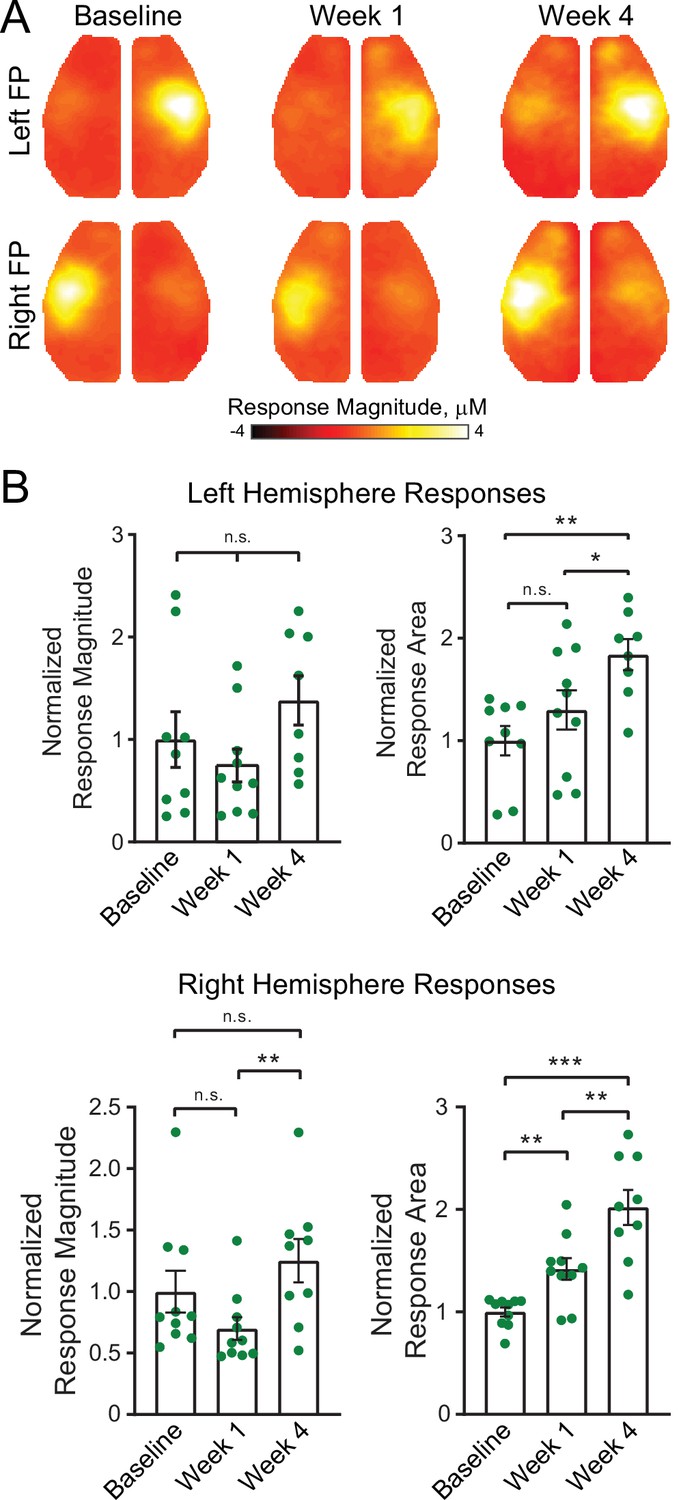
Focal excitatory stimulation influences stimulus evoked responses in healthy mice.
(A) Cortical responses in mice subjected to the same photostimulation paradigm but without photothrombosis (n=9). Robust responses are observed following stimulation of either limb, and appear to increase in area and magnitude by week 4 compared to baseline responses. At 4 weeks, note the presence of evoked activity in motor forepaw cortex. (B) Quantification of evoked response magnitude and area. Top row, left hemisphere: linear mixed-effects model (LMM) revealed a significant effect of time (F(1.5,11.5)=7.2, p=0.013) for evoked response area. Bottom row, right hemisphere: LMM revealed a significant effect of time for evoked response area (F(1.5,13)=27, p<0.0001) and a trend (F(1.6,13.6)=3.6, p=0.063) in evoke response magnitude. Post hoc tests were performed as t-tests assuming unequal group variance and corrected for multiple comparisons using false discovery rate correction. All analysis performed using total hemoglobin as contrast. Statistical analyses were performed in Graph Pad Prism 8. *=p<0.05; **=p<0.01; ***=p<0.001; ****=p<0.0001.
Figure 4 with 2 supplements
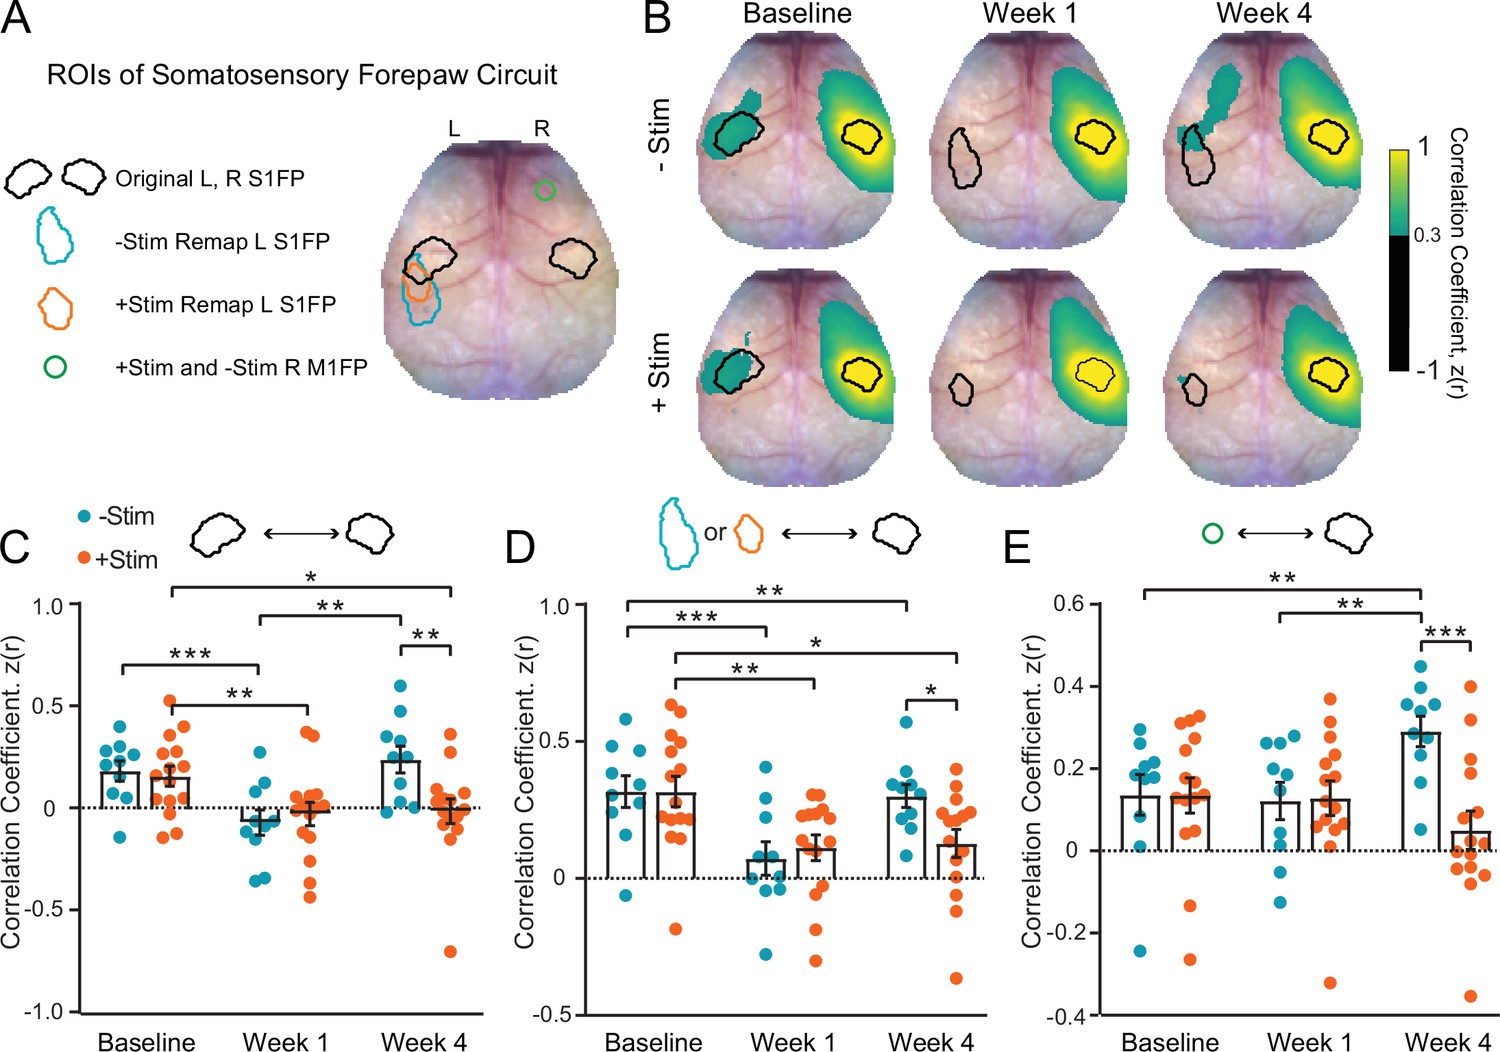
Contralesional stimulation inhibits recovery of somatomotor forepaw circuitry (A) regions of interest (ROIs) overlaid on a representative white light image of the dorsal mouse skull.
ROIs were determined from evoked responses at baseline (original primary somatosensory forepaw [S1FP] in the left or right hemispheres) or at 4 weeks after stroke (remapped left S1FP). Responses at 4 weeks contained increased activity in right M1FP and included as an ROI for S1FP resting-state functional connectivity (RSFC) analysis. (B) Group-averaged maps of RSFC for the original right S1FP ROI in both –Stim (n=10) and +Stim (n=15) groups reveal strong ipsilateral connectivity with sensory and motor regions, as well as bilateral RSFC with left forepaw cortex. Similar deficits are observed in both groups 1 week after stroke. Bilateral RSFC in both groups is nearly ablated while ipsilateral connectivity remains relatively preserved. By 4 Weeks, RSFC in right S1FP in the –Stim group exhibits new functional connections in perilesional somatosensory regions, including remapped left S1FP as well as more anterior motor cortices. Interhemispheric RSFC of right S1FP in the +Stim group remains largely absent by 4 weeks. (C–E) Quantification of RSFC over time in ROIs depicted in (A). (C) Homotopic RSFC in original S1FP is significantly reduced in both groups after stoke, and only recovers in –Stim mice: 2-way repeated measures ANOVA (rmANOVA) revealed a significant group × time interaction (F2,46=5.3, p=0.009) and a main effect of time (F1.7,40=11.2, p=0.0003). (D) ‘Homotopic’ RSFC with remapped forepaw regions is reinstated by 4 weeks after stroke in –Stim mice only: during recovery, 2-way rmANOVA revealed a significant group × time interaction (F1,23=5.9, p=0.023) and a main effect of time (F1,23=7.8, p=0.01). (E) Ipsilateral RSFC between right S1FP and right M1FP. Despite exhibiting increased activity in R right M1FP during left forepaw stimulation, +Stim mice do not exhibit increased ipsilateral RSFC between right M1FP and right S1FP. 2-way rmANOVA revealed a significant group × time interaction (F2,46=10.52, p=0.0002). All post hoc tests were performed as t-tests assuming unequal group variance and corrected for multiple comparisons using false discovery rate correction. Statistical analyses were performed in Graph Pad Prism 8. *=p<0.05; **=p<0.01; ***=p<0.001; ****=p<0.0001.
Figure 4—figure supplement 1
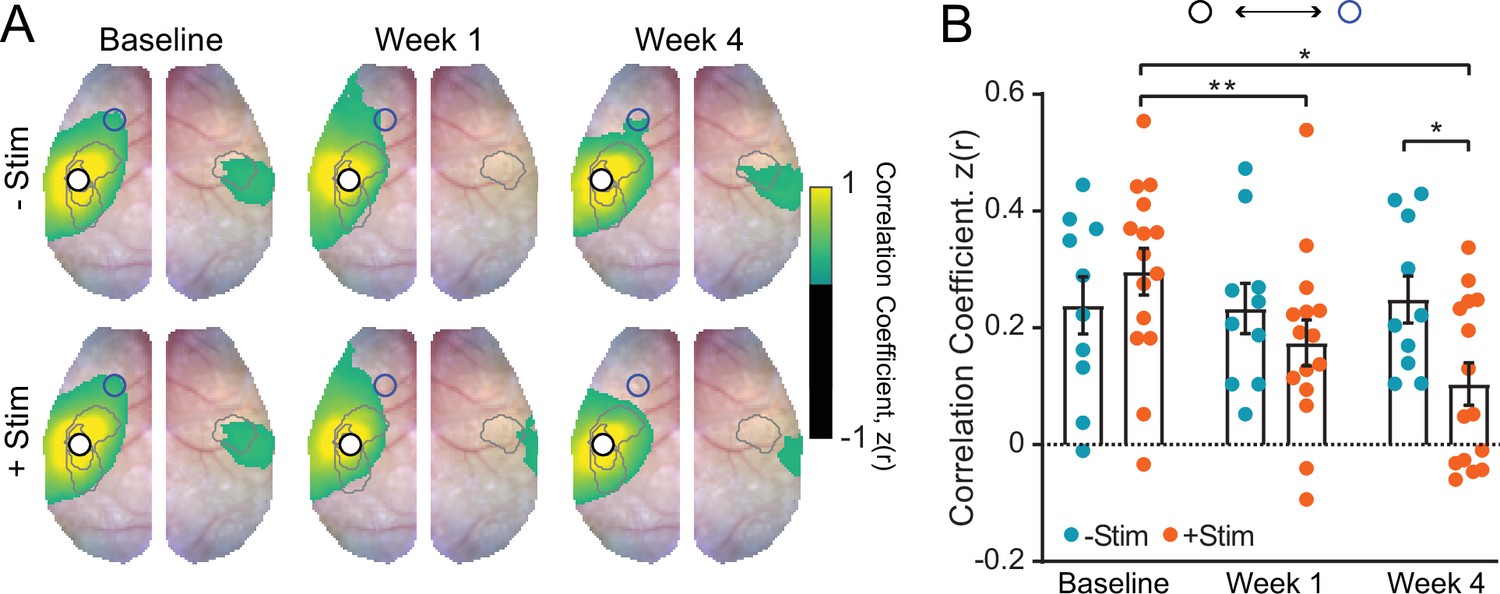
Resting-state functional connectivity (RSFC) in remapped primary somatosensory forepaw (S1FP).
(A) RSFC maps for remapped S1FP of both groups (–Stim [n=10] and +Stim [n=15]). Cortical region of remapping exhibits strong ipsilateral RSFC and homotopic RSFC with contralateral cortex prior to stroke. At week 1, RSFC between this region and contralateral right S1FP cortex is significantly disrupted in both groups (see Figure 4D for quantification). By week 4, robust RSFC with right S1FP is observed in the –Stim group only. (B) Quantification of intrahemispheric, ipsilesional RSFC between remapped S1FP and left motor cortex (similar to panel Figure 4E). The 2-way repeated measures ANOVA (rmANOVA) revealed a significant group × time interaction (F(2,46)=4.7, p=0.014), as well as a significant effect of time (F(1.9,43)=4.0, p=0.028). All post hoc tests were performed as t-tests assuming unequal group variance and corrected for multiple comparisons using false discovery rate correction. Statistical analyses were performed in Graph Pad Prism 8. *=p<0.05; **=p<0.01; ***=p<0.001; ****=p<0.0001.
Figure 4—figure supplement 2
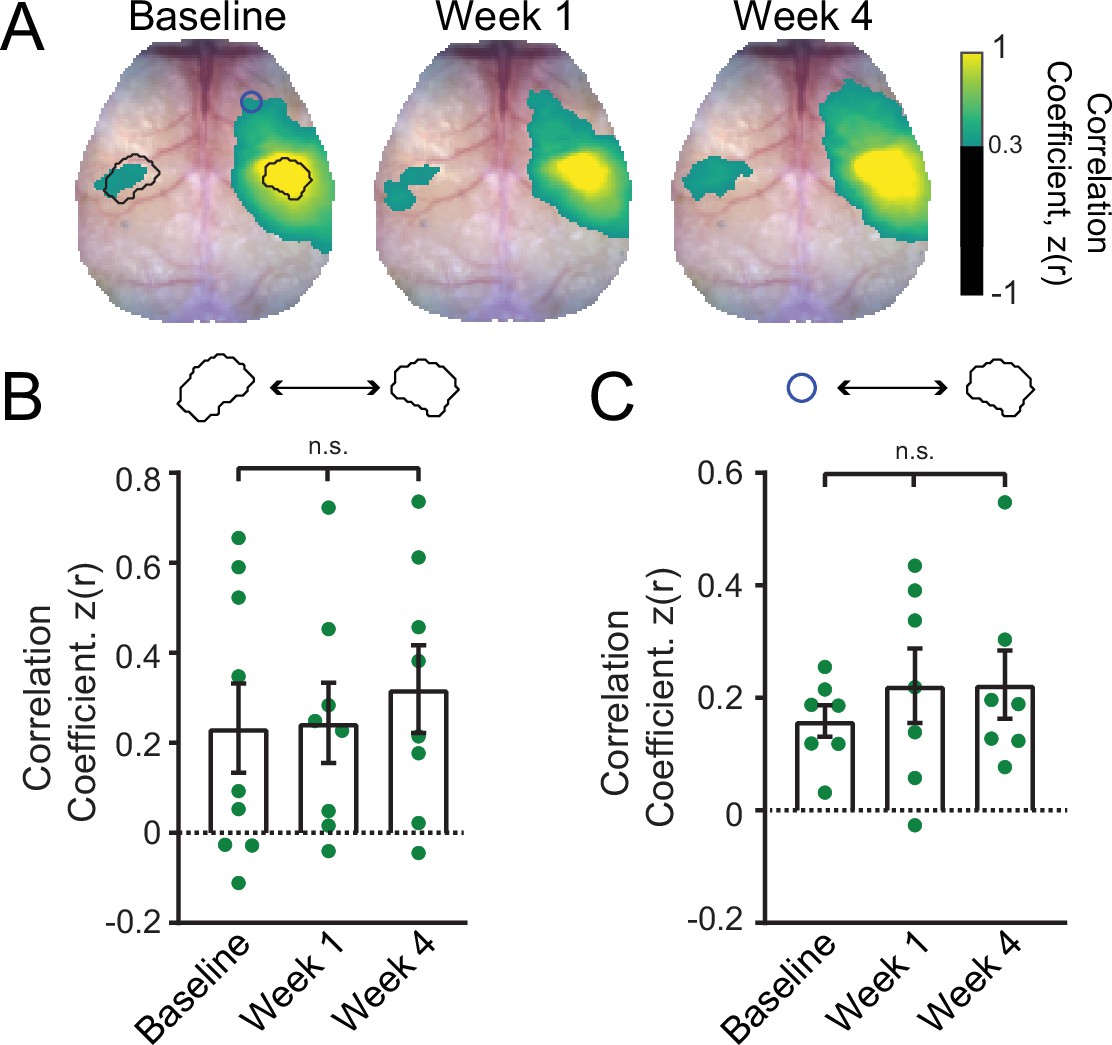
Focal excitatory stimulation in control mice does not affect resting-state functional connectivity (RSFC) in the somatomotor circuit.
(A) Group-averaged patterns of RSFC in control mice (n=9) subjected to the same 4 week long photostimulation paradigm but in the absence of stroke. Regions of interest (ROIs) overlaid on the baseline map are same as those depicted in Figure 4. (B) Quantitative analysis of homotopic primary somatosensory forepaw (S1FP) RSFC. The 1-way repeated measures ANOVA (rmANOVA) did not reveal a significant effect of time, nor were there any differences between different time points. (C) Ipsilateral RSFC between right S1FP and right motor cortex. The 1-way rmANOVA did not reveal a significant effect of time, nor were there any differences between different time points. n.s. = not significant. Post hoc tests were performed as t-tests assuming unequal group variance and corrected for multiple comparisons using false discovery rate correction. Statistical analyses were performed in Graph Pad Prism 8.
Figure 5 with 2 supplements
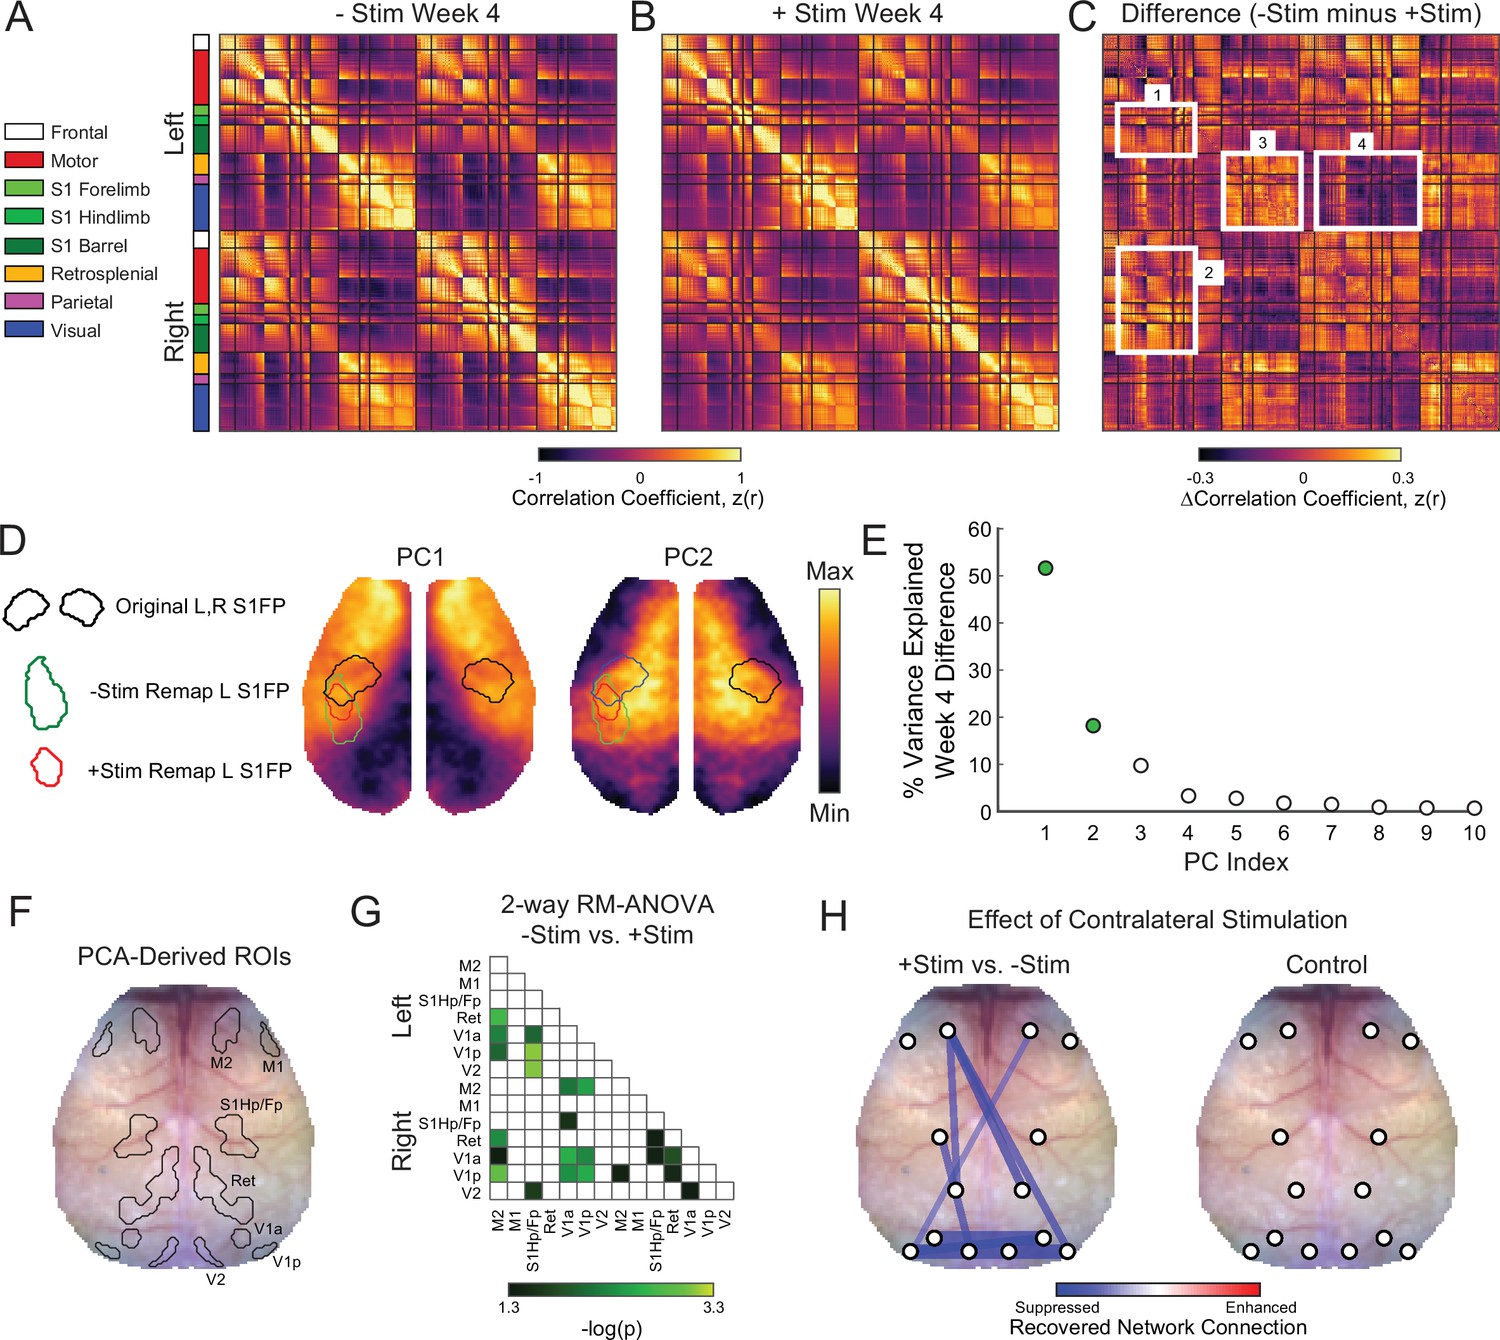
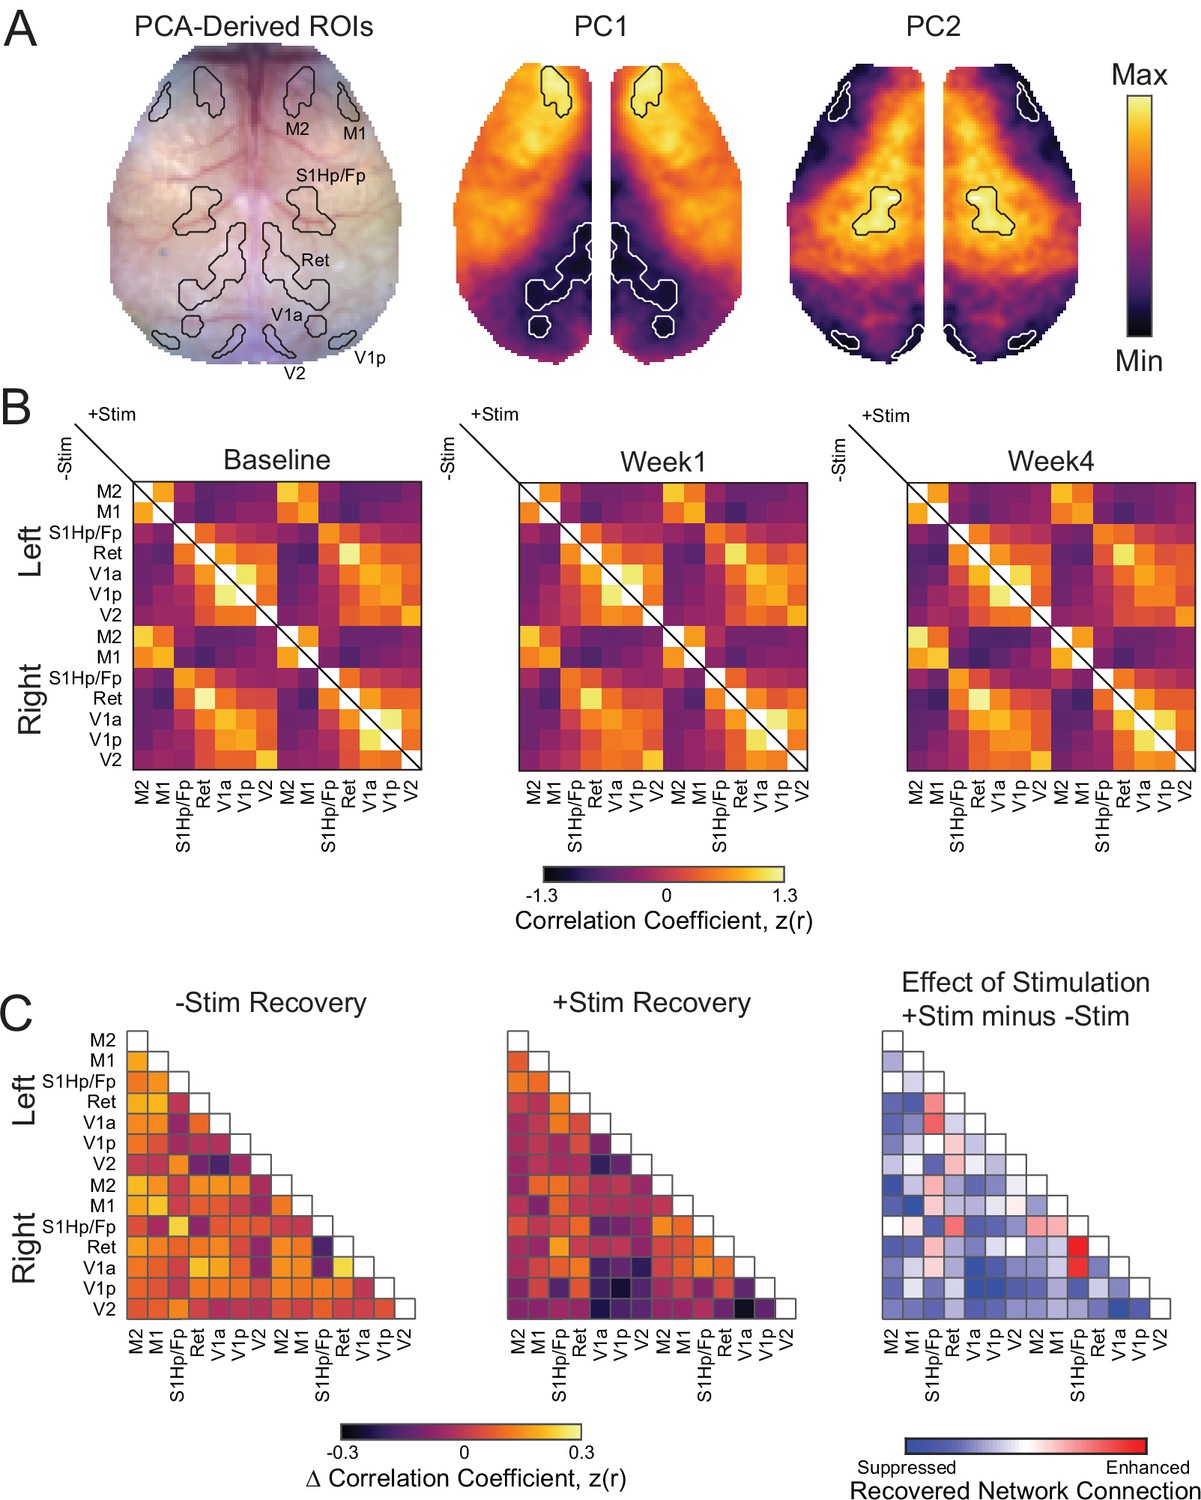
Global network interactions after stroke are suppressed by increased contralesional forepaw activity whole cortex correlation matrices for (A) –Stim (n=10) and (B) +Stim (n=15) groups 4 weeks after photothrombosis.
Matrices are grouped by functional assignment then organized by hemisphere (left, ipsilesional; right, contralesional). (C) Resting-state functional connectivity (RSFC) difference matrix (–Stim minus +Stim) shows the group-averaged correlation differences between experimental groups. Notice increased intra- (box 1) and inter-hemispheric (C) RSFC within the forepaw somatosensory and motor networks, as well as in distant visual and parietal regions in the –Stim group (C). Additionally, mice recovering spontaneously exhibit increased anticorrelations between visual, somatosensory and motor regions (C). (D) Group-wise RSFC differences examined using unbiased spatial principle component analysis (PCA) of the group-level correlation difference matrix in panel C. First 2 PCs explain 70% of the variance between group differences at 4 weeks. Topography of PC1 reveals increased RSFC of –Stim mice within motor and sensory regions within both hemispheres with a notable island of increased connectivity within the remapped forepaw region. Pronounced anticorrelations can also be observed between posterior visual/retrosplenial regions and anterior sensorimotor regions. PC2 shows that surrounding sensory, medial motor, cingulate and more distant parietal regions also exhibit increased RSFC in –Stim mice compared to +Stim mice. Contours of original and remapped forepaw regions shown for reference. (E) The resulting eigenspectrum after PCA of the Week 4 correlation difference matrix in (C). PC1 at 4 weeks (green dot) explains 52% of the variance between groups at 4 weeks. (F) PCA-derived regions of interest (ROIs) for unbiased RSFC analysis. See Figure 5—figure supplement 1 for ROI locations in each PC map. (G) 2-way repeated measures ANOVA (rmANOVA) shows brain wide differences in regional RSFC over time between groups. Regions having a significant group × time interaction (p<0.05 uncorrected for multiple comparisons) are shown. Notably, regions outside of the focal injury demonstrate significant differences in RSFC across groups. For example, RSFC between left secondary motor (M2) and distant retrosplenial and visual regions. Similarly, ipsilateral and bilateral RSFC in visual and retrosplenial cortices is also significantly altered between groups. (H) Left: stick and ball network diagram showing the effect of stimulation on recovery. Recovery for both groups was defined as the change in magnitude of ROI-based RSFC from 1 to 4 weeks (see Figure 5—figure supplement 1). The difference between these matrices (+Stim minus –Stim) determined the effect of contralesional excitation on spontaneous recovery. Significantly suppressed recovery was observed between nodes connected to the lesion and other regions (left primary sensory hindpaw/forepaw [S1hp/fp] and left visual; left M2 and left retrosplenial), between nodes distant to the site of direct injury (left and right visual cortex), and across hemispheres (right motor and left visual). Thicker lines indicate larger changes. Significant differences were those in panel having a significant group × time interaction as determined in panel G but corrected for multiple comparisons. Right: RSFC changes in control mice (n=9) over the experiment. No significant changes were observed. Statistical analyses were performed in MATLAB (2018a).
Figure 5—figure supplement 1
Regional resting-state functional connectivity (RSFC) between principle component analysis (PCA)-derived regions of interest (ROIs) and RSFC recovery.
(A) White light image showing ROI contours and contours overlaid on the respective PCs from which ROIs were determined. (B) RSFC matrices for PCA-derived ROIs over time in –Stim (n=10) and +Stim (n=15) groups. Matrices are organized by functional assignment, then by hemisphere. RSFC of –Stim mice are reported in the lower triangle while that of +Stim mice in the upper triangle. RSFC is reported as Fisher z scores. (C) Recovery of ROI-based RSFC. Recovery for each group was calculated as the magnitude of RSFC at week 4 minus that at week 1. Yellows indicate restoration of RSFC while purples indicate worsening of RSFC. The effect of stimulation was calculated from the recovery matrices of C as recovery of +Stim group minus recovery of –Stim group. Blues indicate poorer recovery of regional RSFC in +Stim mice while reds indicate enhanced RSFC recovery compared to –Stim mice. Statistical analyses were performed in MATLAB (2018a).
Figure 5—figure supplement 2
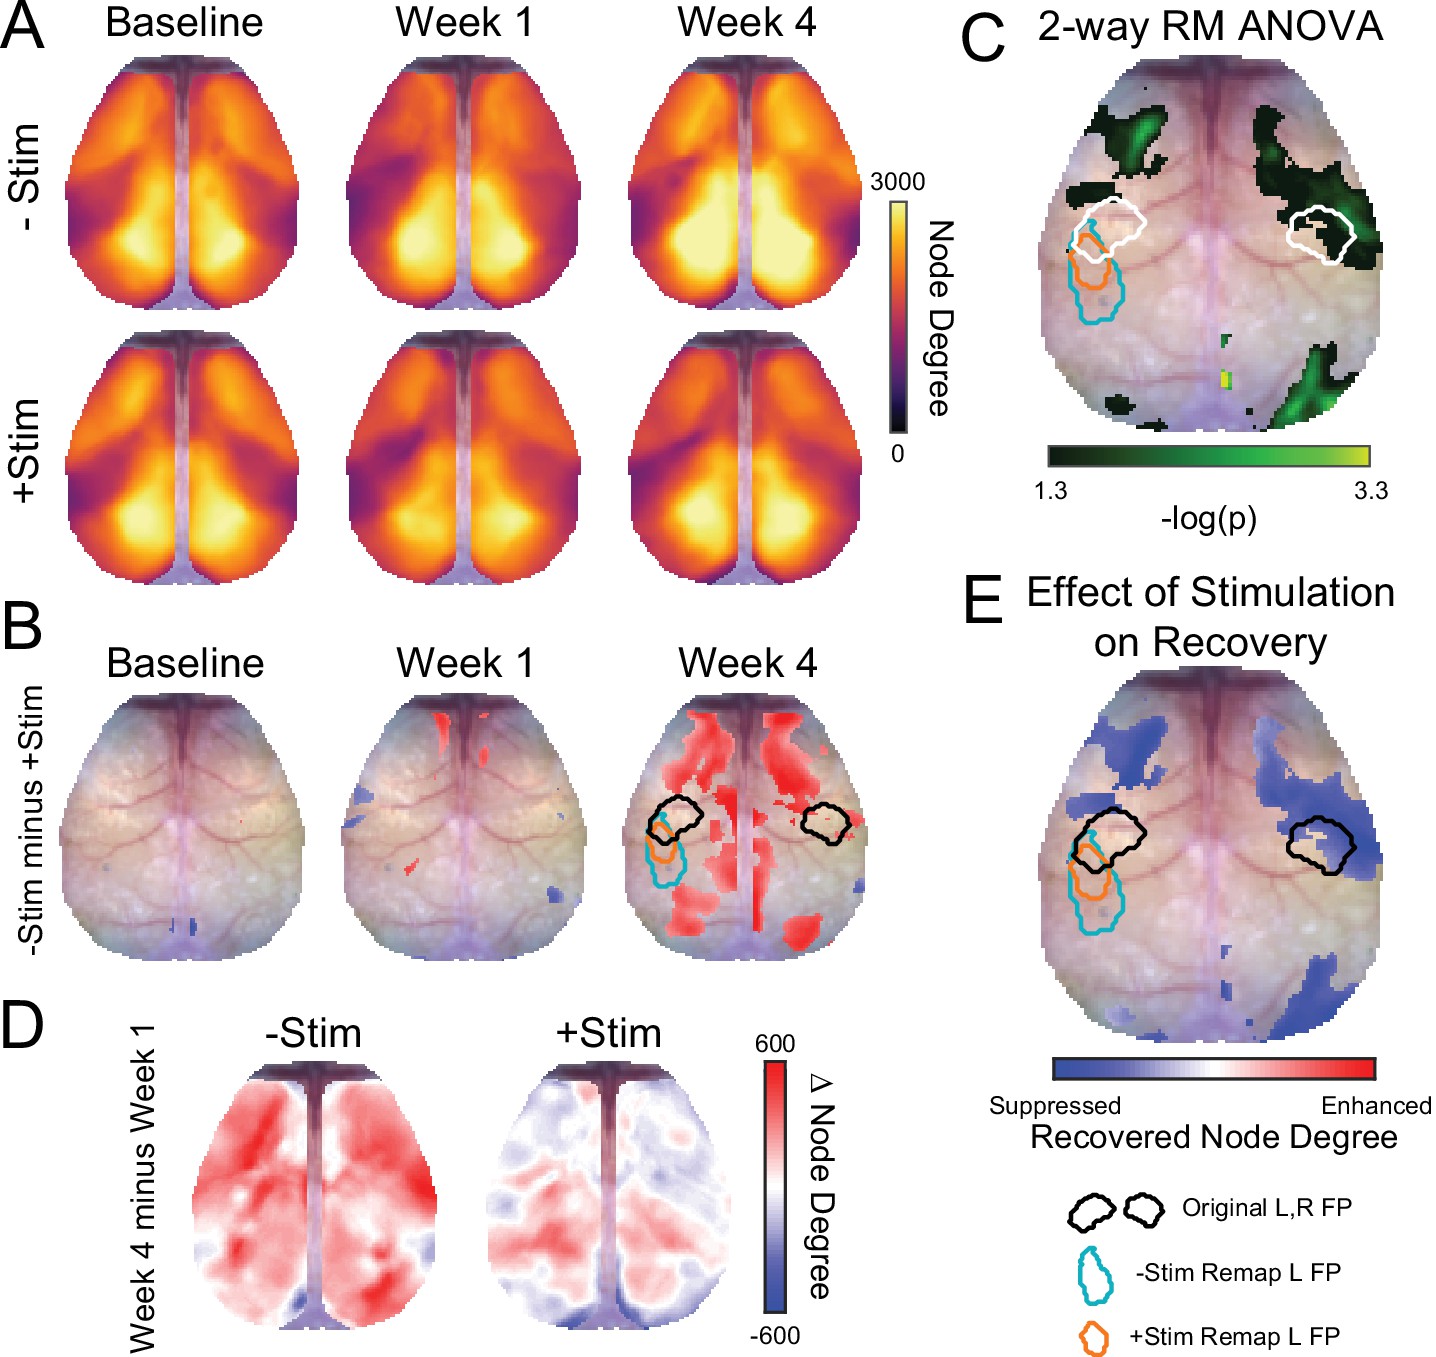
Recovery of functional connection density after stroke is suppressed by focal contralesional activity.
(A) Maps of global node degree for each group (–Stim [n=10] and +Stim [n=15]) and time point. Both groups exhibit high node degree (yellows) in motor, anterior somatosensory, medial parietal, retrosplenial and visual regions, with fewer connections (purples) exhibited by lateral sensory areas. Focal ischemia in left forepaw cortex reduced node degree in local forepaw circuits, as well as lateral sensory and motor areas. By week 4, substantial increases in node degree are evident in –Stim mice in several brain regions while +Stim mice exhibit topographically similar maps of node degree to those at week 1. (B) Pixel-wise comparison of node degree across groups as each time point. Reds indicate higher node degree in –Stim mice vs +Stim mice at a given time point. Node degree differences between groups at baseline and 1 week post stroke show relatively minor differences in sparse cortical regions. However, by week 4 pronounced differences in global connection number between –Stim and +Stim mice were observed within and outside of the site of direct injury, including right forepaw cortex, large portions of motor cortex as well as posterior cingulate, medal parietal, retrosplenial and visual areas. (C) Effect of stimulation on node degree recovery. Recovery of this measure was determined for each group by subtracting maps of node degree at week 4 from those at week 1. (D) 2-way repeated measures ANOVA (rmANOVA) computed at each pixel revealed a significant group × time interaction in parts of primary motor, large portions of secondary motor, right primary somatosensory forepaw and surrounding cortex, perilesional somatosensory cortex, and right posterior visual cortices. Cluster-corrected p-values shown on a –log scale. (E) Differences in group-wise recovery were determined from the maps in panel C and calculated as +Stim recovery minus –Stim recovery. Blues indicate suppressed node degree recovery in +Stim mice compared to –Stim mice and reds indicate enhanced node degree recovery +Stim mice. Difference map is thresholded by the statistical map of panel D. −Stim (n=10) and +Stim (n=15). Statistical analyses were performed in MATLAB (2018a).
Figure 6

Contralesional photostimulation during awake optical intrinsic signal imaging (OISI) reveals global decreases in activity after stroke.
Mice (+Stim: n=8, −Stim: n=8) were imaged before and after photothrombosis using awake OISI during photostimulation (473 nm, 0.5 mW, 10 Hz, 5 ms) delivered in a block design (10 s of photstimulation followed by 50 s of rest). (A) Group-averaged image sequences from 0 to 20 s. At baseline, all mice exhibited focal increases in right primary sensory forepaw (S1FP) activity (reds) during photostimulation that spread to contralateral (left) S1FP and other motor regions approximately 8–10 s after stimulus onset. Prior to activity increases within the targeted circuit, subtle reductions in cortical activity can be observed in contralateral cortex, including somatosensory, motor and more medial cortex at 4–8 s. (B) Quantification of activity reductions were performed by correlating photostimulus evoked time courses in each mouse with every other pixel, and summing all pixels having a correlation coefficient less than 0. Decreases in activity are markedly pronounced in +Stim mice at 1 and 4 weeks compared to baseline and were significantly larger in +Stim mice compared to –Stim mice. Linear mixed-effects model (LMM) revealed a main group effect (F1,38=11.66, p=0.0015). All post hoc tests were performed as t-tests assuming unequal group variance and corrected for multiple comparisons using false discovery rate correction. Statistical analyses were performed in Graph Pad Prism 8. *=p<0.05; **=p<0.01; ***=p<0.001; ****=p<0.0001.
Figure 7
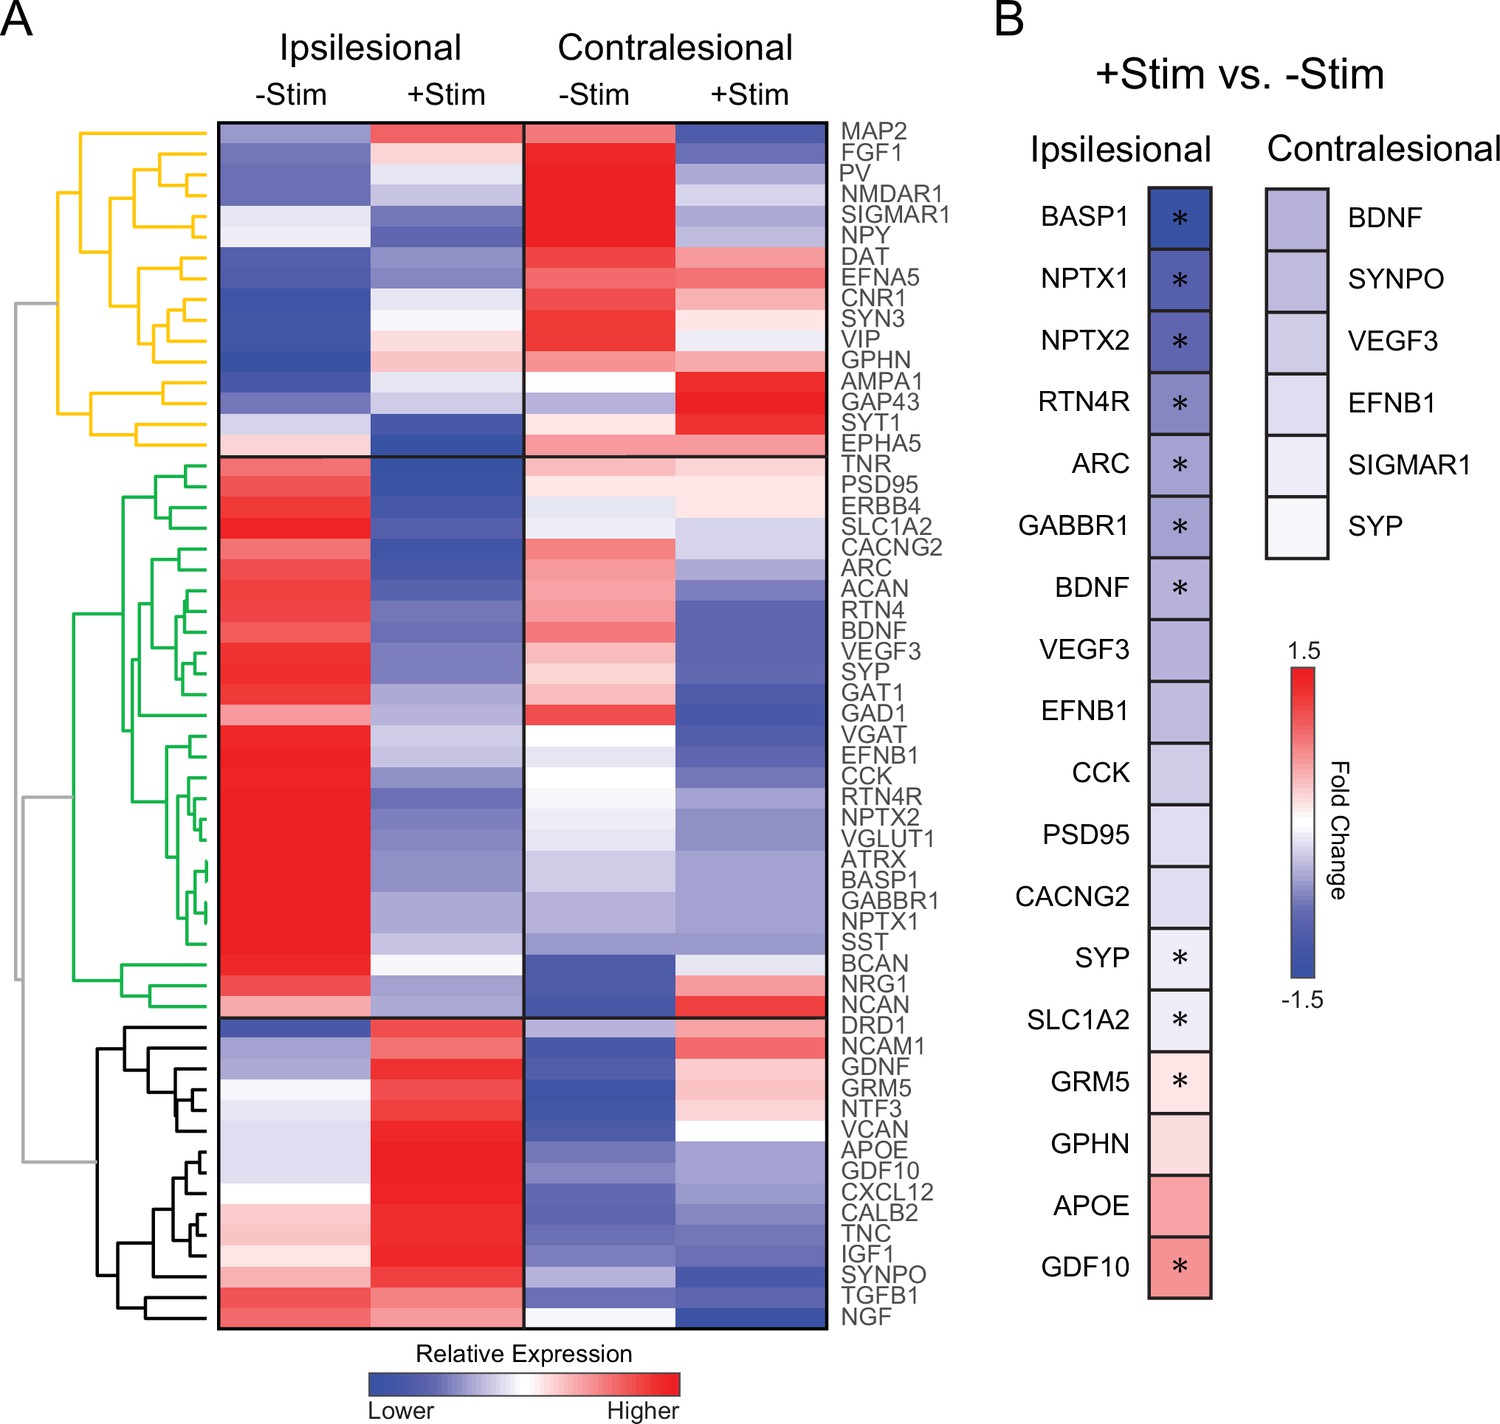
Contralesional activity alters expression of genes important for recovery quantitative real time polymerase chain reaction (RT-PCR) analysis was performed in perilesional and contralesional tissue of –Stim (n=5) and +Stim (n=5) mice.
(A) Broad differences in genetic expression profiles were qualitatively examined with hierarchical clustering. Three larger dendrograms (color coded orange, green, and black) segregate groups of genes based on patterns of expression, independent of group or tissue assignment. Levels of expression in –Stim mice in either hemisphere provide a ‘spontaneous recovery phenotype’. Within ipsilesional tissue, 27 genes upregulated (reds) in –Stim mice were all downregulated (blues) in +Stim mice (green tree). Mouse GAPDH was used as a normalization reference. (B) Fold change of expression in +Stim mice compared to –Stim mice in either perilesional or contralesional tissue. In panel B, colored boxes report fold change of any gene upregulated (reds) or downregulated (blues) with respect to –Stim mice with p≤0.05 (uncorrected). Starred boxes indicate significance following correction for multiple comparisons (p<0.1 following false discovery rate [FDR] correction). Contralesional stimulation significantly altered canonical pathways associated with plasticity after stroke. Statistical analyses were performed in Graph Pad Prism 8.
Additional files
-
Supplementary file 1
Genes surveyed for RT-PCR Analysis.
- https://cdn.elifesciences.org/articles/68852/elife-68852-supp1-v2.xlsx
-
Transparent reporting form
- https://cdn.elifesciences.org/articles/68852/elife-68852-transrepform1-v2.pdf
Download links
A two-part list of links to download the article, or parts of the article, in various formats.
Downloads (link to download the article as PDF)
Open citations (links to open the citations from this article in various online reference manager services)
Cite this article (links to download the citations from this article in formats compatible with various reference manager tools)
Homotopic contralesional excitation suppresses spontaneous circuit repair and global network reconnections following ischemic stroke
eLife 11:e68852.
https://doi.org/10.7554/eLife.68852


