Dynamically linking influenza virus infection kinetics, lung injury, inflammation, and disease severity
- Department of Pediatrics, University of Tennessee Health Science Center, United States
- Department of Anesthesiology, Washington University School of Medicine, United States
- Flow Cytometry Core, St. Jude Children's Research Hospital, United States
- Department of Immunology, St. Jude Children’s Research Hospital, United States
- Department of Pathology, St. Jude Children's Research Hospital, United States
Figures
Figure 1 with 2 supplements
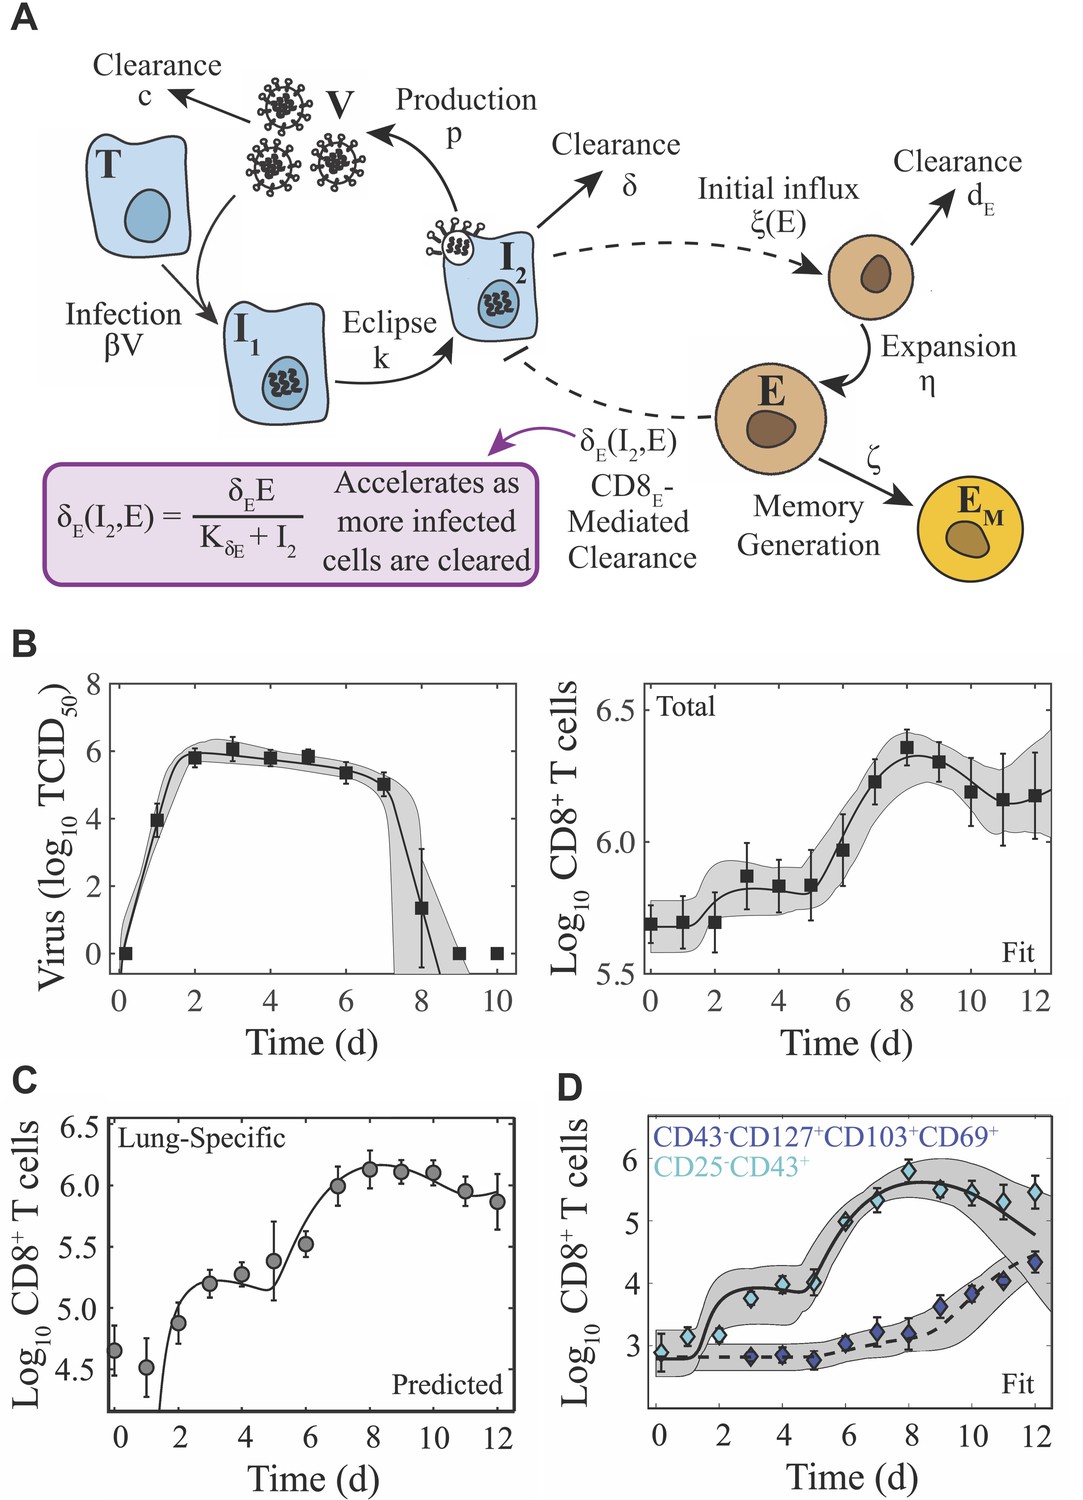
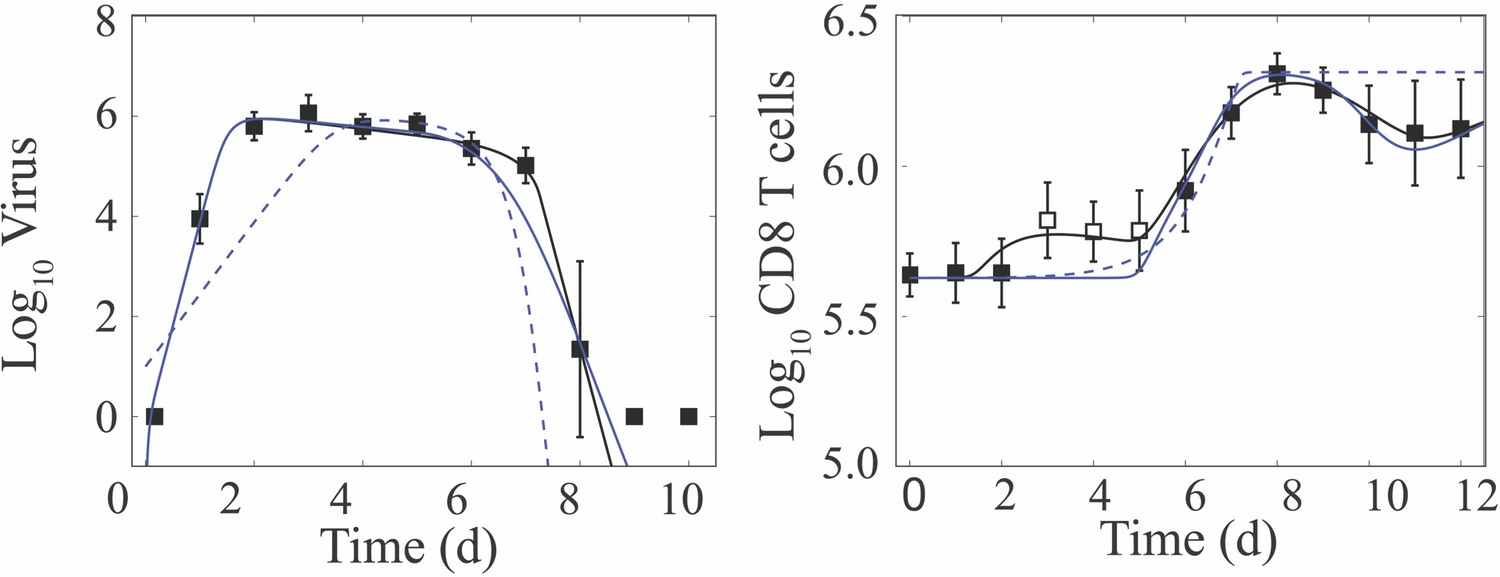
Schematic and fit of the CD8+ T cell viral kinetic model.
(A) Schematic of the CD8+ T cell model in Equation (1)-(6). In the model, target cells () are infected at rate . Infected cells () undergo an eclipse phase and transition to become productively-infected cells () at rate . Virus () is produced by infected cells at rate and is cleared at rate . Infected cells are cleared at rate by non-specific mechanisms and at rate by effector CD8+ T cells (; denoted CD8E). The dashed lines represent interactions between infected cells and CD8E. Initial CD8E influx () is proportional to infected cells and is limited by CD8E with half-saturation constant . CD8E expansion () occurs proportional to infected cells days ago. Memory CD8+ T cell (; denoted CD8M) generation occurs at rate and proportional to CD8E days ago. (B) Fit of the CD8+ T cell model (Equation (1)-(6)) to virus and total CD8+ T cells from the lungs of mice infected with 75 TCID50 PR8 (10 mice per time point). The total number of CD8+ T cells is . (C) Total CD8+ T cells in the lung parenchyma (gray circles) and overlay of the model predicted values (). (D) Fit of the model to virus, CD25–CD43+ CD8+ T cells (cyan diamonds; ), and CD43–CD127+CD103+CD69+ CD8+ T cells (blue diamonds; ) (five mice per time point). The solid and dashed black lines are the optimal solutions and the gray shading is are the model solutions using parameter sets within the 95% CIs. Parameters are given in Table 1. Data are shown as mean ± standard deviation.
Figure 1—figure supplement 1

Dynamics of CD8+ T cells in the lung parenchyma and vasculature.
Comparison of total CD8+ T cells in a non-perfused lung (black) and in a perfused lung (white). Of those from a perfused lung, comparison of CD8+ T cells located in the lung parenchyma (CD45–; gray) and vasculature (CD45+; yellow). These data show that perfusion does not alter the number of cells recovered, and that the total number of cells primarily reflects changes in the lung parenchyma with little fluctuation in the lung vasculature. The cells in the lung vasculature may be slightly overestimated late in the infection due to incomplete perfusions during the height CD8-mediated clearance (7–9 d pi) when the lung integrity is low.
Figure 1—figure supplement 2
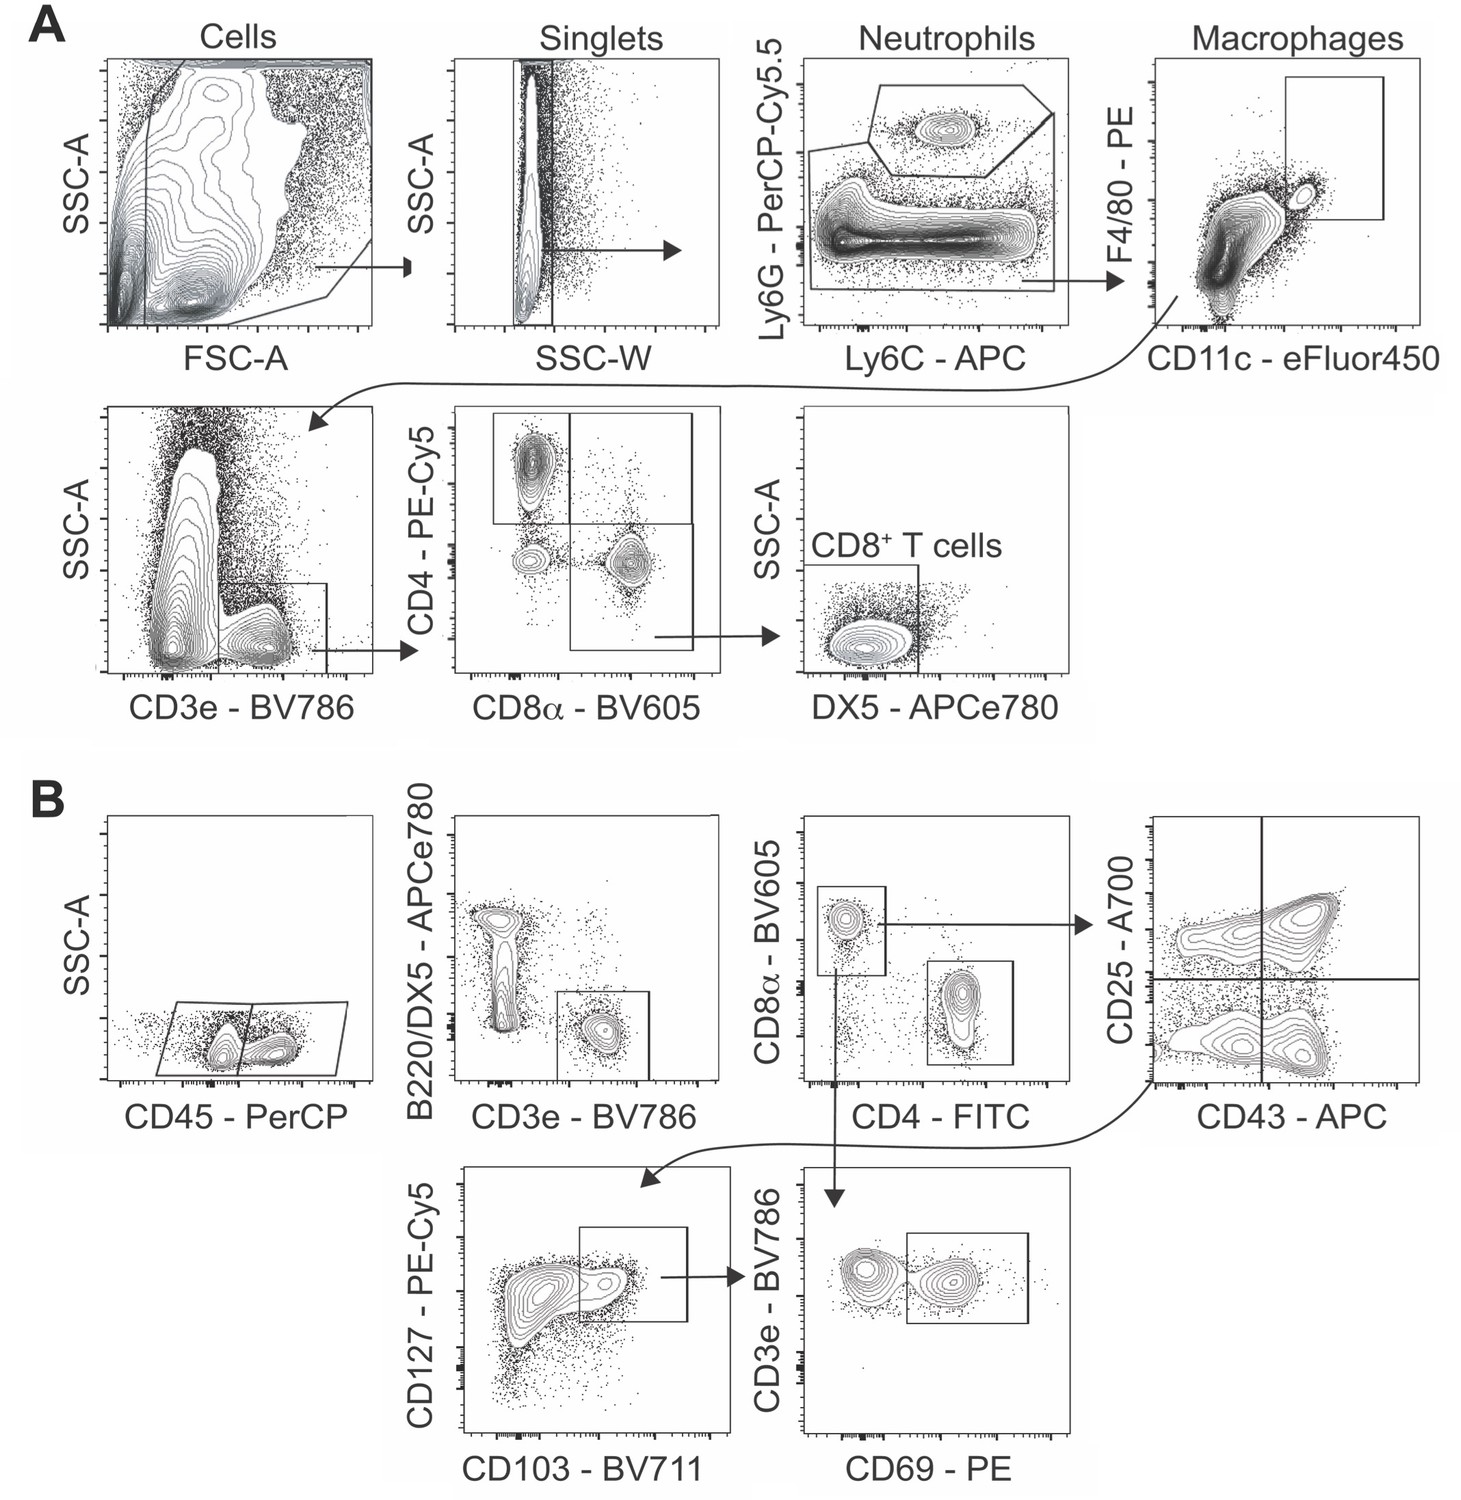
Flow cytometry gating strategy for CD8+ T cell analysis.
Live cells were first gated on forward scatter (FSC-A) and side scatter (SSC-A) then as singlets. (A) Following neutrophil (Ly6Ghi) and macrophage (F4/80hi CD11chi) exclusion, T cells were gated as CD3e+ with total CD8+ T cells sub-gated as DX5–CD4–CD8+. (B) Blood borne CD8+ T cells were gated as CD45+ cells and those in the lung parenchyma as CD45– with the total in each sub-population gated as CD3e+B220–DX5–CD4–CD8+. IAV-specific CD8+ T cells were sub-gated as CD25+CD43+ (recently activated), CD25–CD43+ (effector), and CD25–CD43–CD127+CD103+CD69+ (long-lived memory). Expression of CD44, CD69, CD62L, and NKG2D were also assessed to ensure appropriate classification.
Figure 2 with 2 supplements
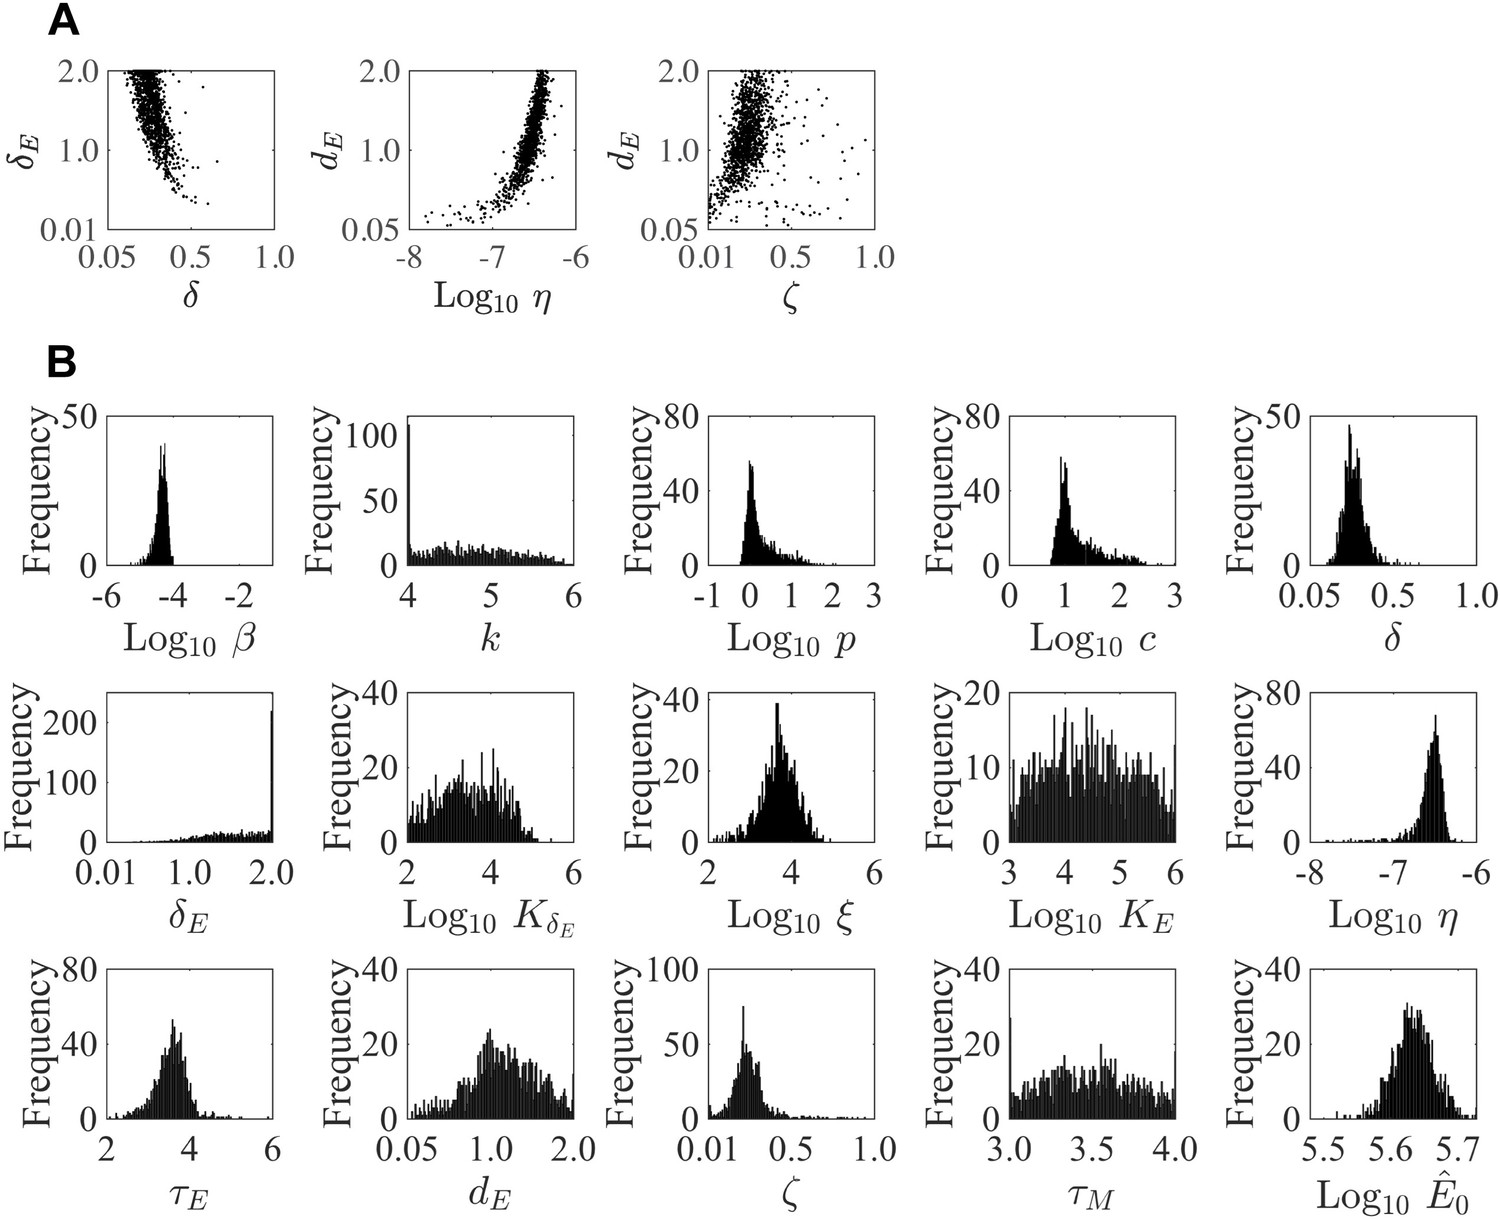
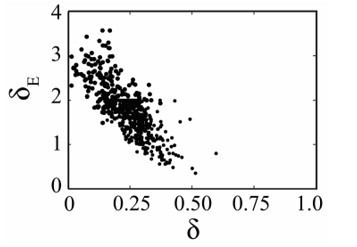
Parameter ensembles and histograms.
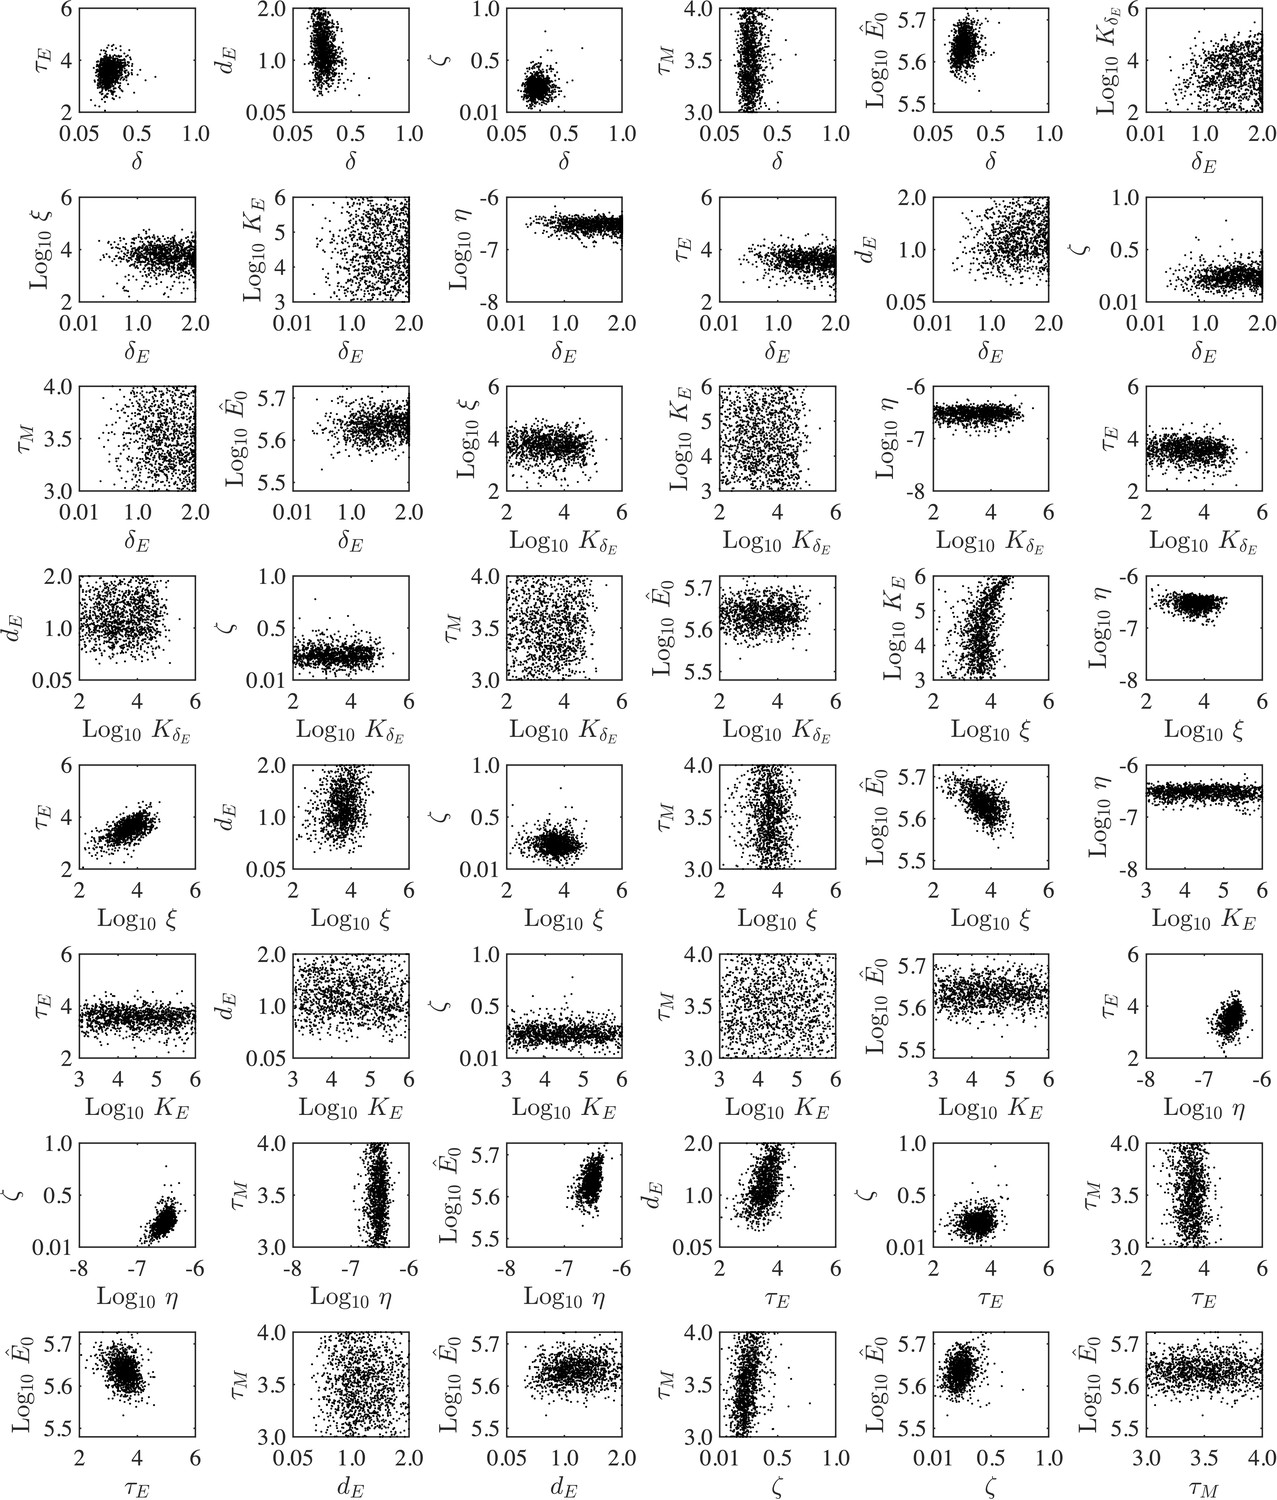
Parameter ensembles (A) and histograms (B) resulting from fitting the CD8+ T cell viral kinetic model (Equation (1)-(6)) to viral titers and total CD8+ T cells from mice infected with 75 TCID50 PR8. (A) The rates of infected cell clearance by non-specific mechanisms (δ) and by CD8E () are slightly negatively correlated. Correlations were also present between the rates of CD8E clearance (), CD8E expansion (η), and CD8M generation (ζ). The axes limits reflect imposed bounds. Additional ensemble plots are in Figure 2—figure supplements 1–2. (B) The histograms show that the majority of parameters are well-defined with the exception of the eclipse phase transition rate (), one of the half-saturation constants (), and the CD8M generation delay ().
Figure 2—figure supplement 1
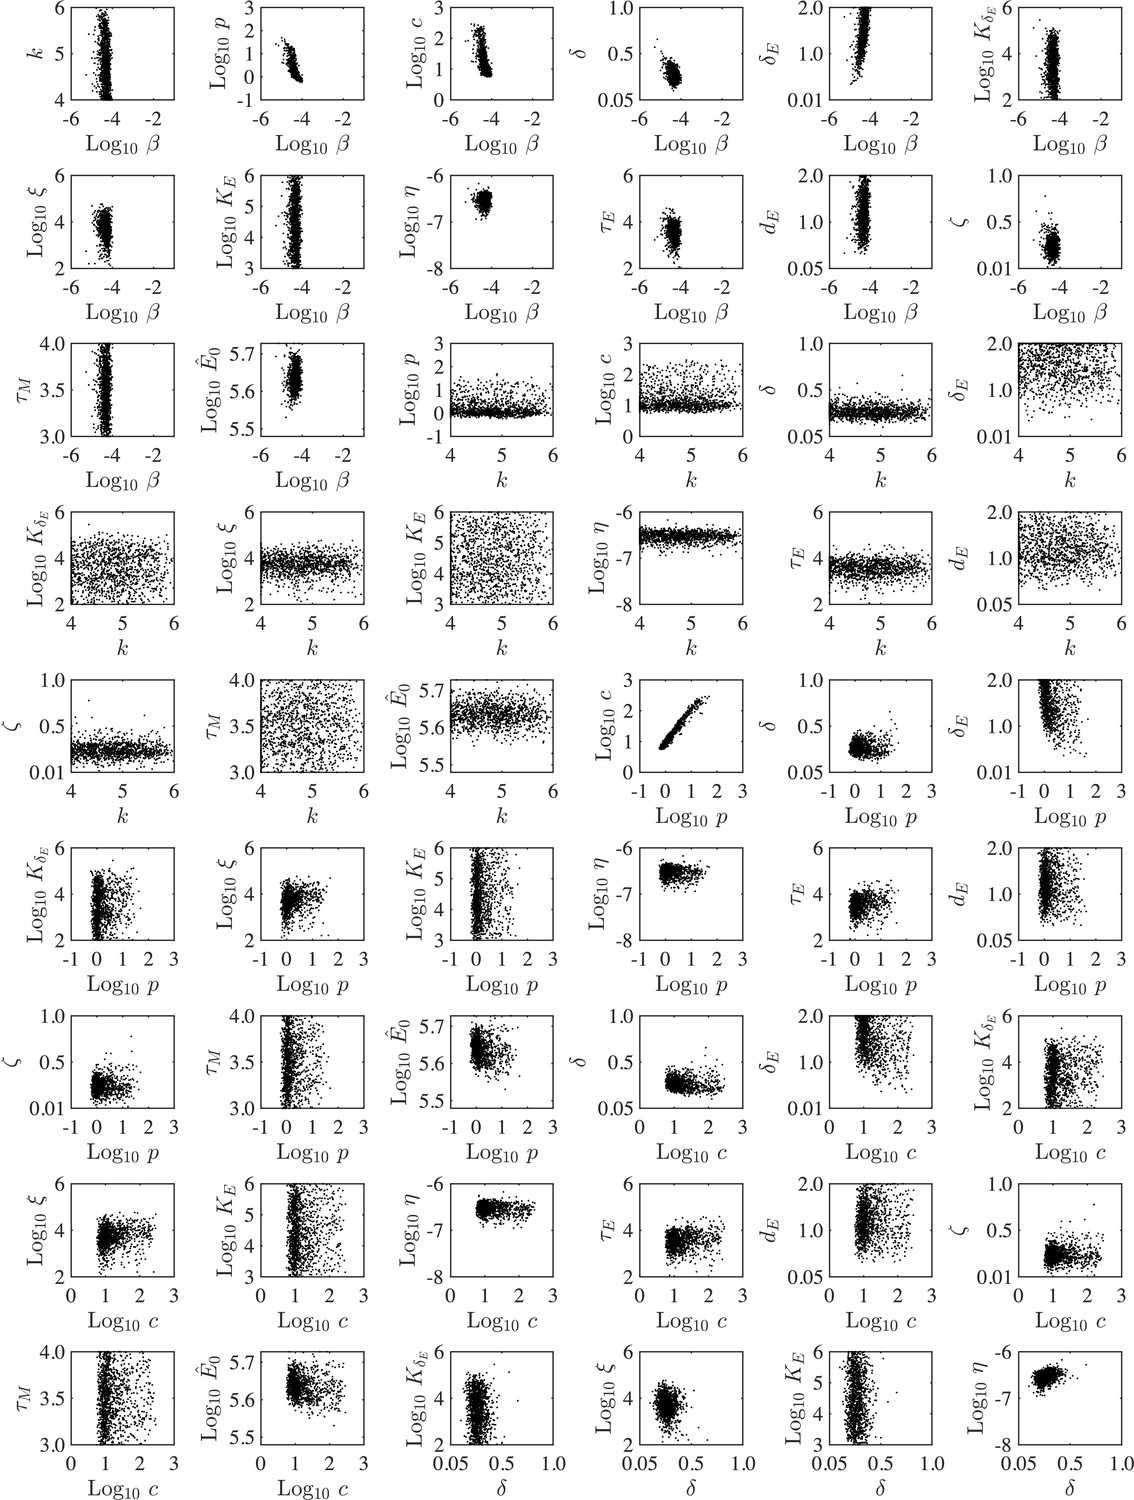
Parameter ensembles.
Parameter ensembles resulting from fitting the CD8+ T cell model (Equation (1)-(6), Main Text) to viral loads and CD8+ T cells from mice infected with 75 TCID50 PR8. The axes limits reflect the imposed bounds. Additional ensemble plots are in Figure 2 (Main Text) and Figure 2—figure supplement 2.
Figure 2—figure supplement 2
Parameter ensembles.
Parameter ensembles resulting from fitting the CD8+ T cell model (Equation (1)-(6), Main Text) to viral loads and CD8+ T cells from mice infected with 75 TCID50 PR8. The axes limits reflect the imposed bounds. Additional ensemble plots are in Figure 2 (Main Text).
Figure 3

Density-dependent infected cell clearance by CD8+ T cells and their impact on recovery time.
(A) The rate of CD8E-mediated infected cell clearance () plotted as a function of infected cells () and effector CD8+ T cells (; CD8E). The colored markers (denoted a–g) indicate the infected cell clearance rate that corresponds to different time points during the infection for the best-fit solution. (B) Values of for the indicated time points associated with the markers a–g. (C) Corresponding locations of the various values (markers a–g) on the best-fit solution of the CD8+ T cell model for virus (), infected cells (), and CD8E (). (D) Solutions of the CD8+ T cell model (Equation (1)-(6)) for virus () and total CD8+ T cells () using the best-fit parameters (black line) and when varying the CD8E expansion rate (; magenta lines) to illustrate how different total CD8+ T cell magnitudes alter infection duration. The magenta lines are solutions from when the percent relative to from the best-fit solution was 42% (solid line), 39.2% (dash-dotted line), 39.1% (dashed line), or 37% (dotted line). (E) The time at which infected cells reach the half-saturation constant (; gray circles) and the infection duration (time where ; black diamonds) are shown for the various CD8+ T cell magnitudes. The gray line between these points is the time required to eliminate infected cells and achieve complete resolution of the infection (). (F) Fit of the CD8+ T cell model (Equation (1)-(6)) to viral loads and CD8+ T cells (magenta diamonds) following depletion at −2, 0, 3, and 7 d pi (magenta arrows). The best model (Supplementary file 2) resulted in fewer target cells (), a lower CD8E influx (), and a higher CD8E expansion rate (). All other parameters were fixed to the best-fit value in Table 1. The solid lines are and the dashed lines are for the cases where CD8+ T cells were depleted (magenta) and where they were not depleted (black). (G) Comparison of the log10 ratio of virus to CD69+CD8+ T cells with and without CD8+ T cell depletion (magenta and black, respectively). All data are shown as mean ± standard deviation.
Figure 4 with 2 supplements
Histomorphometry and inflammation of the IAV-infected lung.
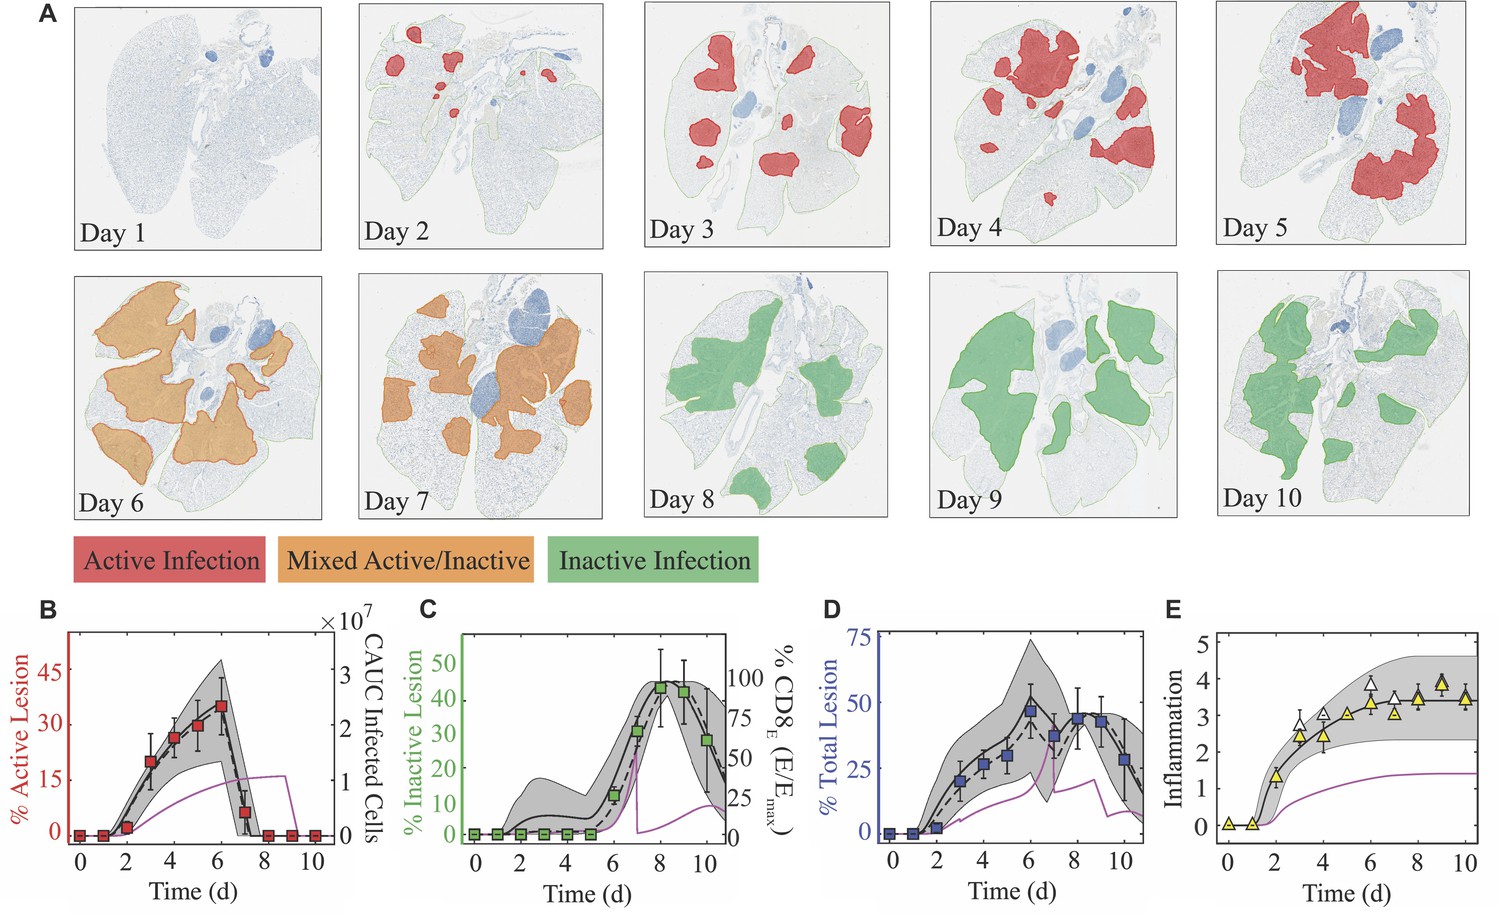
(A) Whole lung sections with histomorphometry showing the areas of influenza NP-positive ‘active’ lesions (red), previously infected ‘inactive’ lesions with minimal antigen-positive debris (green), or mixed active and inactive regions (orange) throughout the infection. Representative images from each group are shown. (B) Percent active lesion (red squares) plotted together with the cumulative area under the curve (CAUC) of the predicted infected cell dynamics () obtained from fitting the CD8+ T cell model. The linear decline in the active lesion (−28.7%/d; see Figure 4—figure supplement 1) was used to estimate the decline after 6 d pi. (C) Percent inactive lesion (green squares) plotted together with the percent maximum CD8E () obtained from fitting the CD8+ T cell model. (D) The total lesion (blue squares) is the addition of the active and inactive lesions. To include all measurements on the same scale, the CAUC of was multiplied by a scaling factor of 14.2% per 1 × 10⁷ cells, and the percent maximum CD8E was multiplied by a scaling factor of 0.46%. (E) Fit of Equation (7) to the alveolar (white triangles) and interstitial (yellow triangles) inflammation scores. The solid black, dashed black, and solid magenta lines are the curves generated using the best-fit parameters obtained from fitting the model to the total CD8+ T cells, the CD25–CD43+ and CD43–CD127+CD103+CD69+ CD8+ T cells, and the total CD8+ T cells during CD8 depletion, respectively. The gray shading are the curves generated using the 95% CI parameters from fitting the model to the total CD8+ T cells. All data are shown as mean ± standard deviation.
Figure 4—figure supplement 1
Regression analysis of lung injury dynamics and CD8+ T cells.
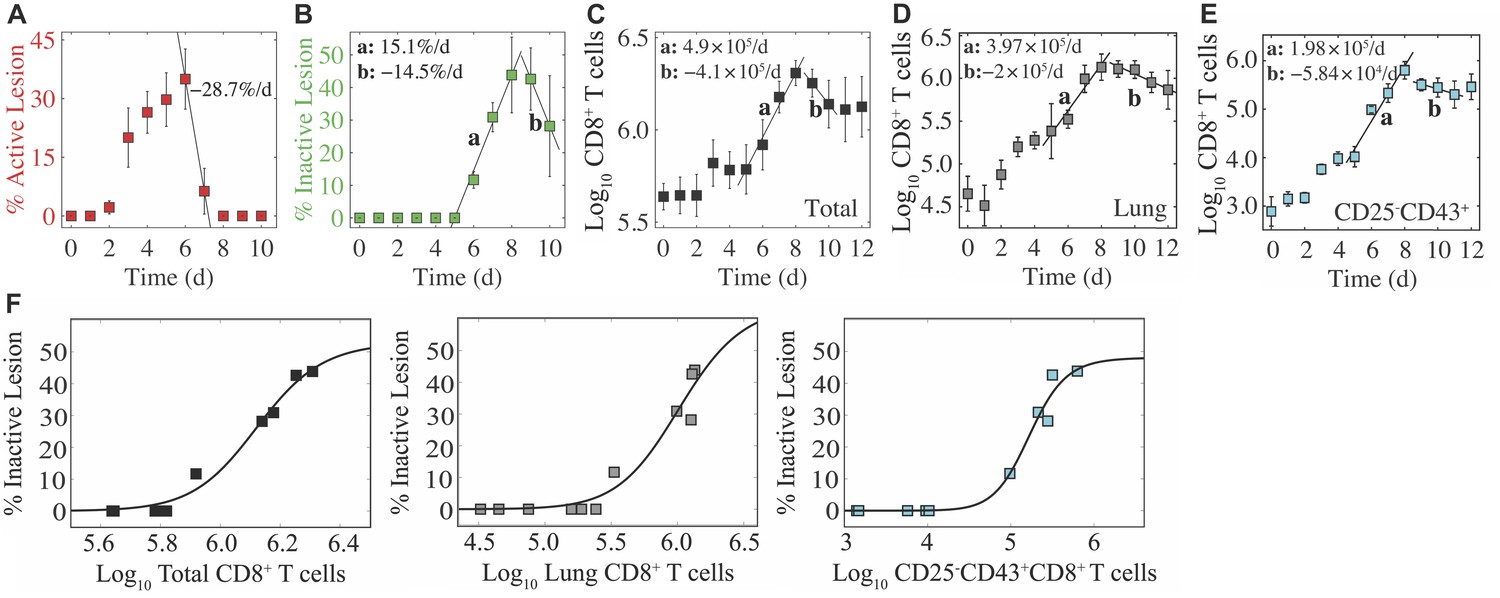
(A) Percent active lesion area decreases by 28.7%/d from 6 -7 d pi. (B) Percent inactive lesion area increases by 15.1%/d from 5 -8 d pi, and decreases by 14.5%/d from 9-10 d pi. (C) Total CD8+ T cells increase at a rate of 4.9 × 10⁵ cells/d from 5-8 d pi, and decrease at a rate of 4.1 × 10⁵ cells/d from 9-10 d pi. (D) Lung CD8+ T cells increase at a rate of 3.97 × 10⁵ cells/d from 5-8 d pi, and decrease at a rate of 2 × 10⁵ cells/d from 9-12 d pi. (E) CD25+CD43+CD8+ T cells increase at a rate of 1.98 × 10⁵ cells/d from 5-8 d pi, and decrease at a rate of 5.84 × 10⁴ cells/d from 9-11 d pi. (F) Fit of a Hill function () to the total CD8+ T cells (black; , , ), lung CD8+ T cells (gray; , , ), and CD25+CD43+CD8+ T cells (cyan; , , ).
Figure 4—figure supplement 2
Correlation of inflammation with macrophages and neutrophils.
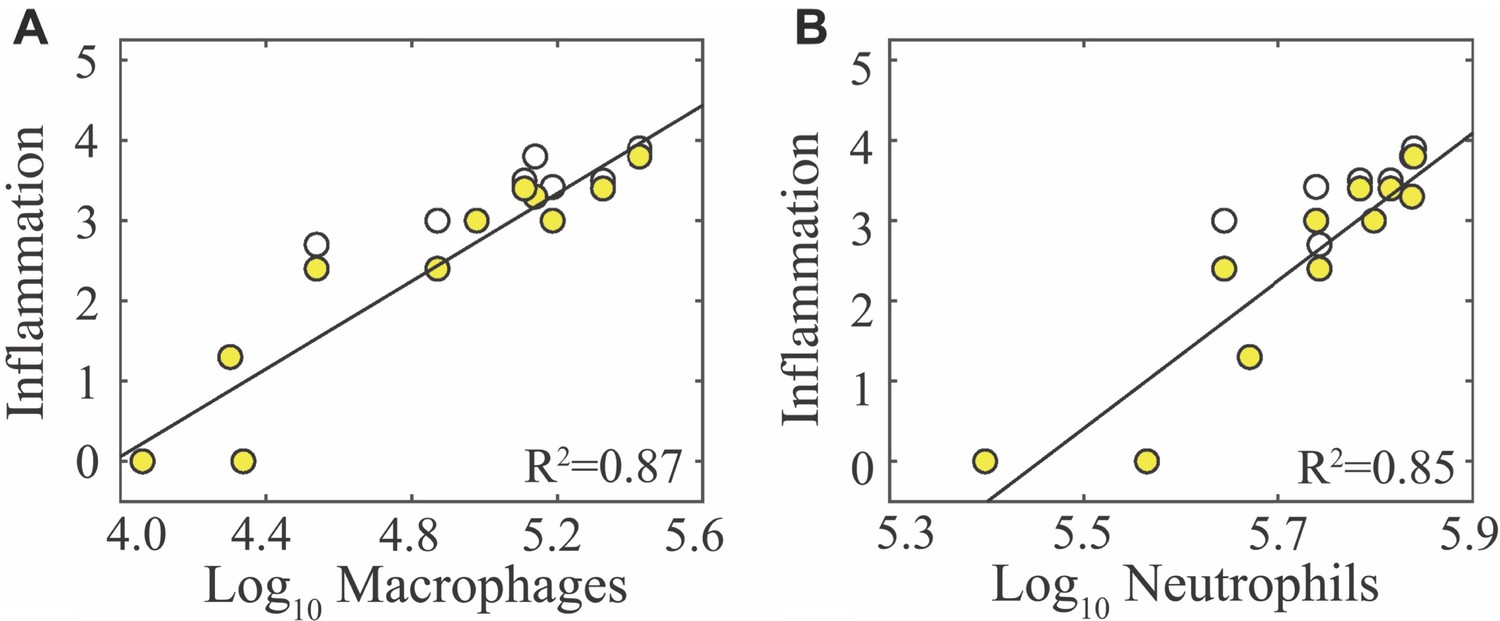
Regression analysis of alveolar inflammation (white) and interstitial inflammation (yellow) with (A) log10 inflammatory macrophages (F480hiCD11chiCD11b+) and (B) log10 neutrophils (Ly6Ghi).
Figure 5
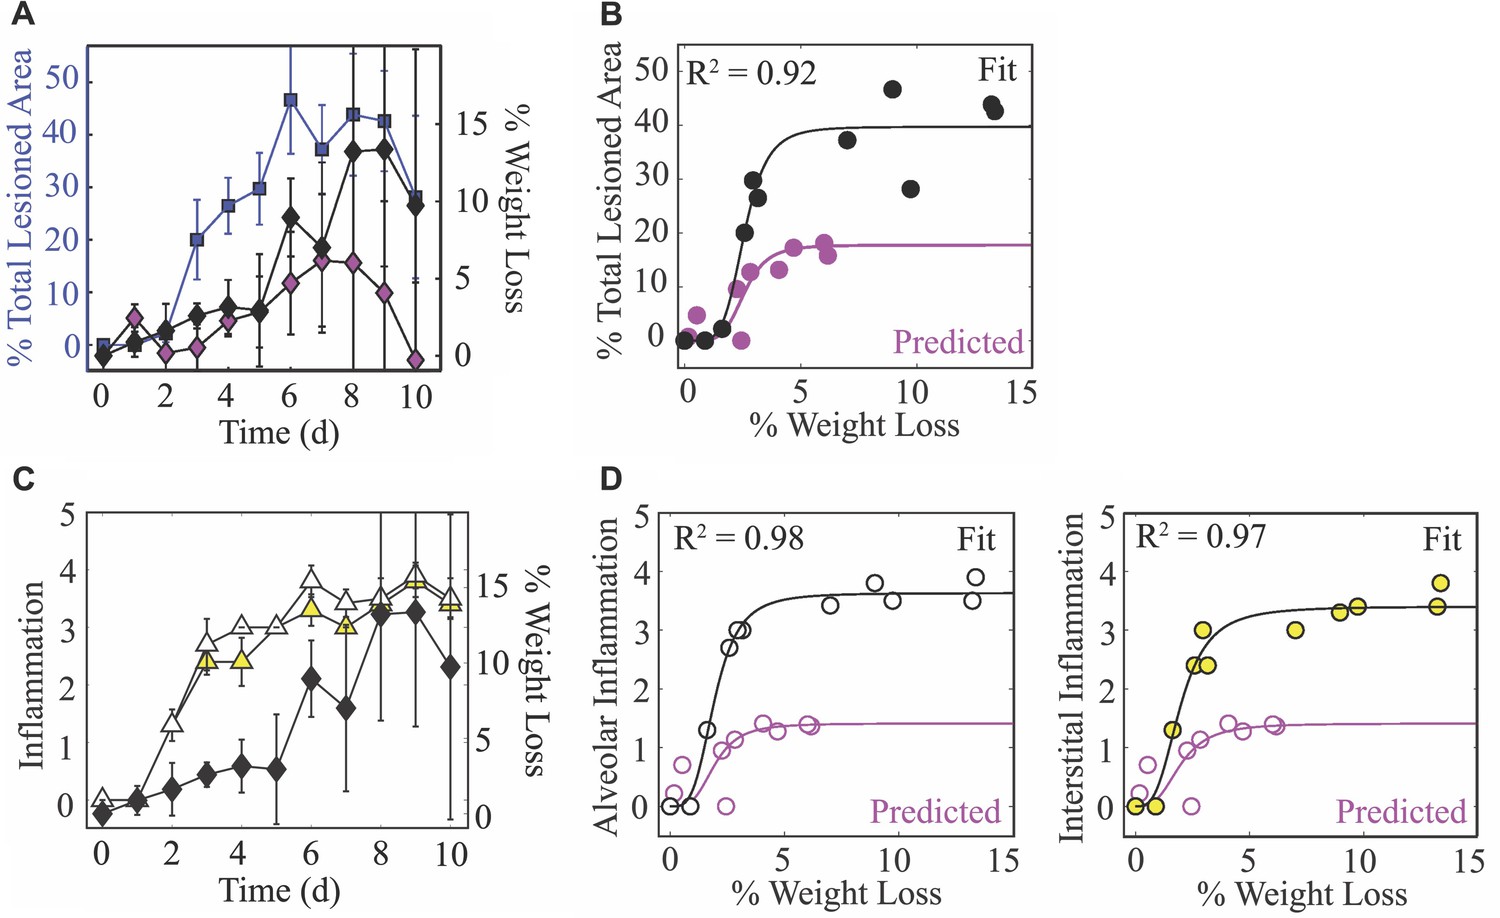
Weight loss dynamics and its relation to lung injury and inflammation.
(A) The percent total (active and inactive) lesion (blue squares) plotted together with the percent weight loss (black diamonds) to illustrate their similar dynamics. (B) Fit of a saturating function (; black line) to the mean percent total lesioned area () and mean weight loss () for all time points (black circles). The best-fit parameters were total lesioned area, weight loss, and . The magenta circles are the predicted percent total lesioned area (Figure 4D) with the corresponding weight loss during CD8 depletion, and the magenta line is the prediction using the best-fit parameters ( weight loss and ) together with the maximum predicted percent total lesion ( total lesioned area). (C) The alveolar (white triangles) and interstitial (yellow triangles) inflammation plotted together with the percent weight loss (black diamonds). (D) Fit of a saturating function (black line) to the mean alveolar (white circles) and interstitial (yellow circles) inflammation scores and mean weight loss for all time points. The best-fit parameters for alveolar inflammation (white circles; black line) were score, weight loss, and , and for interstitial inflammation were score, weight loss, and . The magenta circles are the predicted percent inflammation score (Figure 4E) with the corresponding weight loss during CD8 depletion, and the magenta line is the prediction using the best-fit parameters (% weight loss, ; weight loss, ) together with the maximum predicted inflammation ( score).
Figure 6

Summary of the connections between the kinetics of virus, infected cells, CD8+ T cells, lung injury, lung inflammation, and disease severity.
Summary of the relations between the dynamics of virus, infected cells, CD8+ T cells, lung lesions, lung inflammation, and weight loss established by our analysis. Given that viral loads and weight loss are the most easily measured variables, our mathematical model (Equation (1)-(6)) could be used to estimate the kinetics of infected cells, CD8+ T cells, and inflammation. The cumulative area under the curve (CAUC) of the productively infected cell dynamics () yields an estimate of the percent lung infected (active lesion) while the predicted relative CD8E dynamics () yields an estimate of the percent lung resolved (inactive lesion). The total amount of lung involved (% lung infected and % lung resolved) or the inflammation scores can then be used to estimate weight loss through the functions and . These connections could be reversed and weight loss used to estimate viral load kinetics.
Appendix 1—figure 1
Fit of alternate CD8+ T cell models.
Fit of the CD8+ T cell model (Equation (1)-(6); solid black line) compared to the fit of two alternate CD8+ T cell models (Equation (A1)-(A6) (solid blue line) and Equation (A7)-(A8) (dashed blue line)) to virus and CD8+ T cells (excluding 3–5 d pi; white squares) from the lungs of mice infected with 75 TCID50 PR8 (10 mice per time point). Resulting parameter values were , , and , and , , , , , , and . All other parameters are in Table 1, and the AICs are in Supplementary file 1. Data are shown as mean ± standard deviation.
Appendix 2—figure 1

Parameter behavior of the density-dependent model and the CD8+ T cell model.
(A) Comparison of parameters that were common between the density-dependent model (gray, Equation (A9)-(A12)) and the CD8+ T cell model (purple, Equation (1)-(6)). Correlations were evident between parameters relating to the rates of virus infectivity (), virus production (), and virus clearance (). However, the strength of the correlation was significantly reduced in the CD8+ T cell model. The eclipse phase parameter () was not well-defined in either model. (B) In the density-dependent model (gray), the viral kinetics and the infection duration were sensitive to small changes in the infected cell clearance parameter (). This parameter was well-defined with a narrow 95% CI. In the CD8+ T cell model (purple), changing the CD8E-mediated infected cell clearance parameter () had little impact on viral kinetics or CD8+ T cell kinetics. However, these kinetics were most sensitive to changes in the rate of CD8E expansion (), which was well-defined with a narrow 95% CI.
Appendix 3—figure 1

Sensitivity of the CD8+ T cell model.
Solutions of the CD8+ T cell model (Equation (1)-(6)) with the indicated parameter (, , , , , , , , , or ) increased (red) or decreased (blue) 50% from the best-fit value (Table 1). CD8E denotes effector CD8+ T cells.
Appendix 3—figure 2
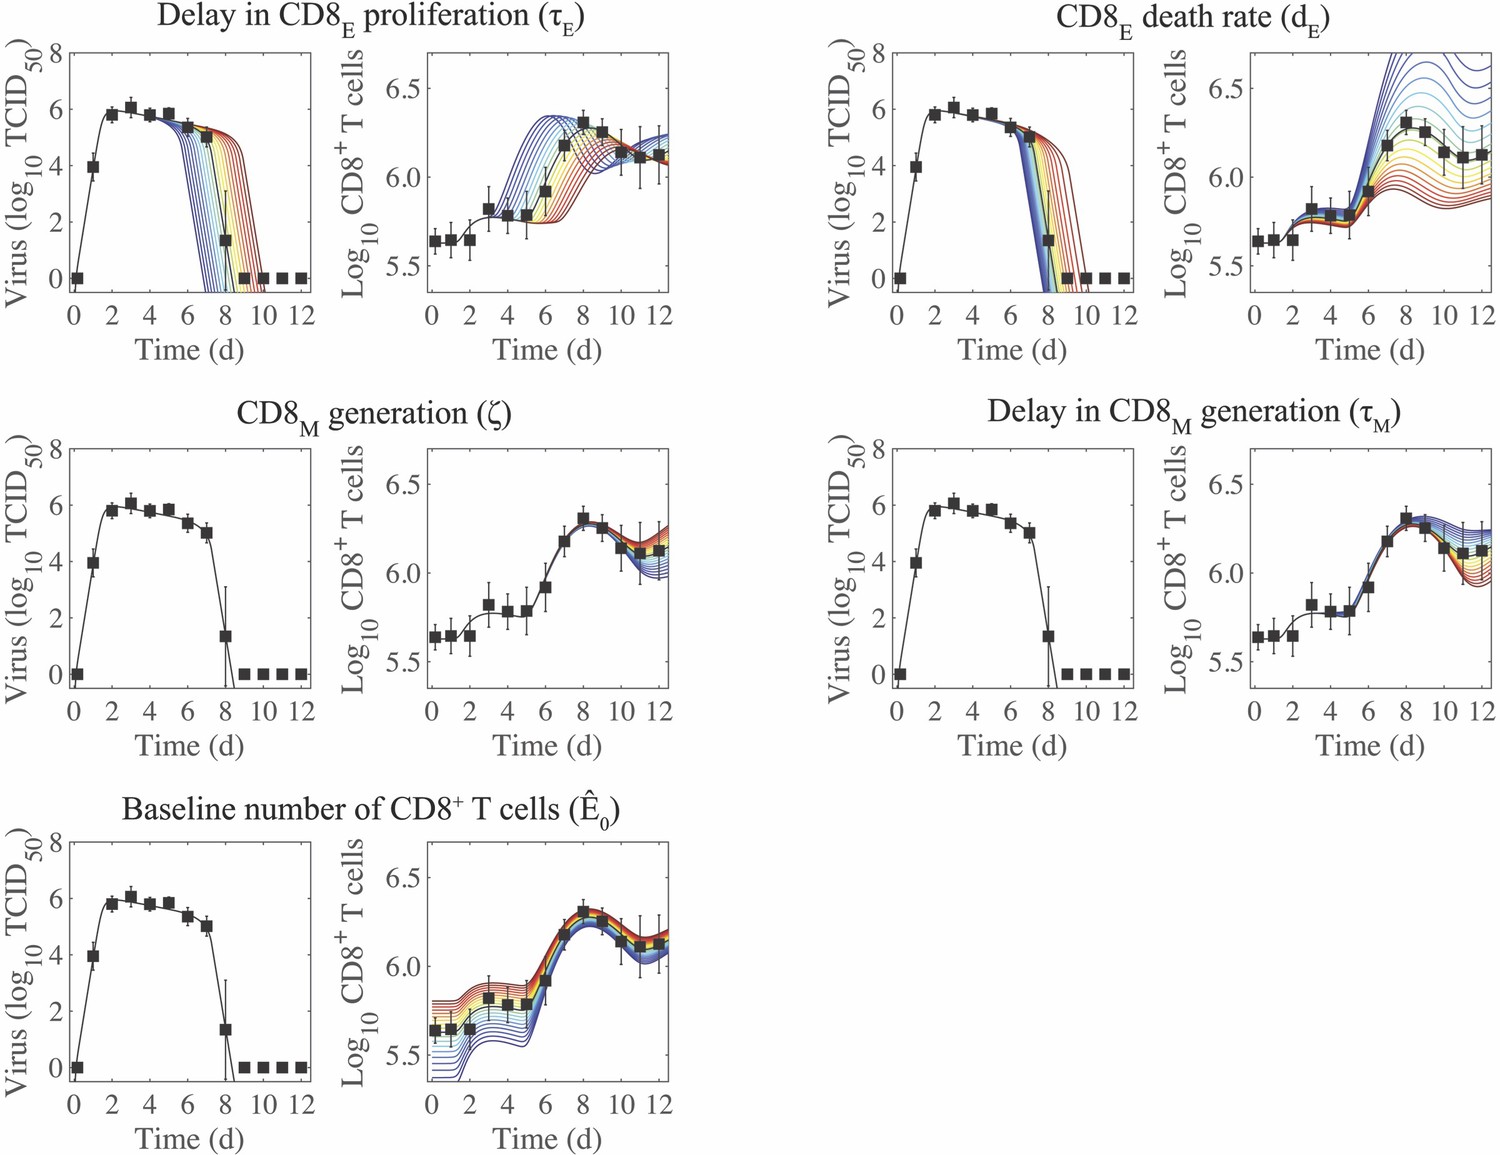
Sensitivity of the CD8+ T cell model.
Solutions of the CD8+ T cell model (Equation (1)-(6)) with the indicated parameter (, , , , or ) increased (red) or decreased (blue) 50% from the best-fit value (Table 1). CD8E and CD8M denote effector and memory CD8+ T cells, respectively.
Author response image 1
Tables
Table 1
CD8+ T cell model parameters.
Parameters and 95% confidence intervals obtained from fitting the CD8+ T cell model (Equation (1)-(6)) to viral titers and total CD8+ T cells (‘Total CD8’) or viral titers, CD25–CD43+CD8+ T cells, and CD43–CD127+CD103+CD69+CD8+ T cells (‘Specific CD8E,M Phenotypes’) from mice infected with 75 TCID50 PR8. CD8E and CD8M denote effector () and memory () CD8+ T cells, respectively. The total number of CD8+ T cells is and is denoted by CD8.
| Parameter | Description | Units | Total CD8 | Specific CD8E,M phenotypes | ||
|---|---|---|---|---|---|---|
| Value | 95% CI | Value | 95% CI | |||
| Virus infectivity | 6.2 × 10⁻⁵ | [5.3 × 10⁻⁶, 1.0 × 10⁻⁴] | 3.7 × 10⁻⁵ | [1.1 × 10⁻⁵, 9.4 × 10⁻⁵] | ||
| Eclipse phase transition | 4.0 | [4.0, 6.0] | 5.1 | [4.0, 6.0] | ||
| Virus production | 1.0 | [5.8 × 10–1 × 1.1 × 102] | 1.5 | [0.73, 13.6] | ||
| Virus clearance | 9.4 | [5.6, 9.5 × 10²] | 12.1 | [5.8, 17.5] | ||
| Infected cell clearance | 2.4 × 10⁻¹ | [1.0 × 10⁻¹, 6.6 × 10⁻¹] | 3.0 × 10⁻¹ | [1.9 × 10⁻¹, 5.9 × 10⁻¹] | ||
| Infected cell clearance by CD8E | 1.9 | [3.3. × 10–1, 2.0] | 5.7 | [1.7, 8.5] | ||
| Half-saturation constant | 4.3 × 10² | [1.0 × 10², 2.9 × 10⁵] | 1.3 × 10² | [1.0 × 101, 8.6 × 10²] | ||
| CD8E infiltration | 2.6 × 10⁴ | [1.3 × 10², 8.7 × 10⁴] | 2.9 × 10³ | [8.0 × 10², 1.7 × 10⁴] | ||
| Half-saturation constant | 8.1 × 10⁵ | [1.0 × 10³, 1.0 × 10⁶] | 2.2 × 10⁶ | [1.1 × 10⁶, 8.3 × 10⁶] | ||
| CD8E expansion | 2.5 × 10⁻⁷ | [1.6 × 10⁻⁸, 6.7 × 10⁻⁷] | 3.5 × 10⁻⁷ | [2.3 × 10⁻⁷, 5.2 × 10⁻⁷] | ||
| Delay in CD8E expansion | 3.6 | [2.1, 5.9] | 3.3 | [2.6, 3.8] | ||
| CD8E clearance | 1.0 | [5.1 × 10⁻², 2.0] | 1.1 | [3.3 × 10⁻¹, 2.5] | ||
| CD8M generation | 2.2 × 10⁻¹ | [1.0 × 10⁻², 9.4 × 10⁻¹] | 3.2 × 10⁻² | [1.0 × 10⁻², 2.2 × 10⁻¹] | ||
| Delay in CD8M generation | 3.5 | [3.0, 4.0] | 3.3 | [2.1, 5.3] | ||
| Baseline CD8 or CD8E | or | 4.2 × 10⁵ | [3.3. × 105, 5.3 × 10⁵] | 6.0 × 10² | [3.1 × 10², 1.8 × 10²] | |
| Baseline CD8M | - | - | 6.5 × 10² | [3.2 × 10², 1.5 × 10³] | ||
| Initial uninfected cells | 1 × 10⁷ | - | 1 × 10⁷ | - | ||
| Initial infected cells | 75 | - | 75 | - | ||
| Initial infected cells | 0 | - | 0 | - | ||
| Initial virus | 0 | - | 0 | - | ||
| Initial CD8E | 0 | - | 0 | - | ||
| Initial CD8M | 0 | - | 0 | - | ||
Additional files
-
Source data 1
Source data including viral titers, CD8+ T cells, inflammation, lesion, and weight loss.
- https://cdn.elifesciences.org/articles/68864/elife-68864-data1-v2.xlsx
-
Source code 1
Source code files for reproduction of all figures.
- https://cdn.elifesciences.org/articles/68864/elife-68864-code1-v2.zip
-
Supplementary file 1
Statistical comparison of alternate models.
Comparison of the Akaike Information Criteria (AIC) of the CD8+ T cell model in Equation (1)-(6), the alternate model in Equation (A1)-(A6), and the Baral model in Equation (A7)-(A8). The fit of these models is shown in Appendix 1—figure 1.
- https://cdn.elifesciences.org/articles/68864/elife-68864-supp1-v2.pdf
-
Supplementary file 2
CD8 T cell depletion model parameters.
Parameters, SSR, and AICC obtained from fitting the CD8+ T cell model (Equation (1)-(6)) to viral titers and CD8+ T cells from mice infected with 75 TCID50 PR8 and with CD8+ T cells depleted at −2 d, 0 d, 3 d, and 7 d pi. The total number of CD8+ T cells is , where , and all other parameters are those in Table 1. The best model is bolded.
- https://cdn.elifesciences.org/articles/68864/elife-68864-supp2-v2.pdf
-
Transparent reporting form
- https://cdn.elifesciences.org/articles/68864/elife-68864-transrepform-v2.docx
Download links
A two-part list of links to download the article, or parts of the article, in various formats.
Downloads (link to download the article as PDF)
Open citations (links to open the citations from this article in various online reference manager services)
Cite this article (links to download the citations from this article in formats compatible with various reference manager tools)
Dynamically linking influenza virus infection kinetics, lung injury, inflammation, and disease severity
eLife 10:e68864.
https://doi.org/10.7554/eLife.68864


