Paraxial mesoderm organoids model development of human somites
- Department of Systems Biology, Harvard Medical School, United States
- Department of Data Science, Dana-Farber Cancer Institute, United States
- Laboratory of Bioengineering and Morphogenesis, Biomechanics Section, Department of Mechanical Engineering, Belgium
- Department of Genetics, Harvard Medical School, United States
- Department of Pathology, Brigham and Women's Hospital, United States
- Broad Institute of MIT and Harvard, United States
Figures
Figure 1 with 2 supplements
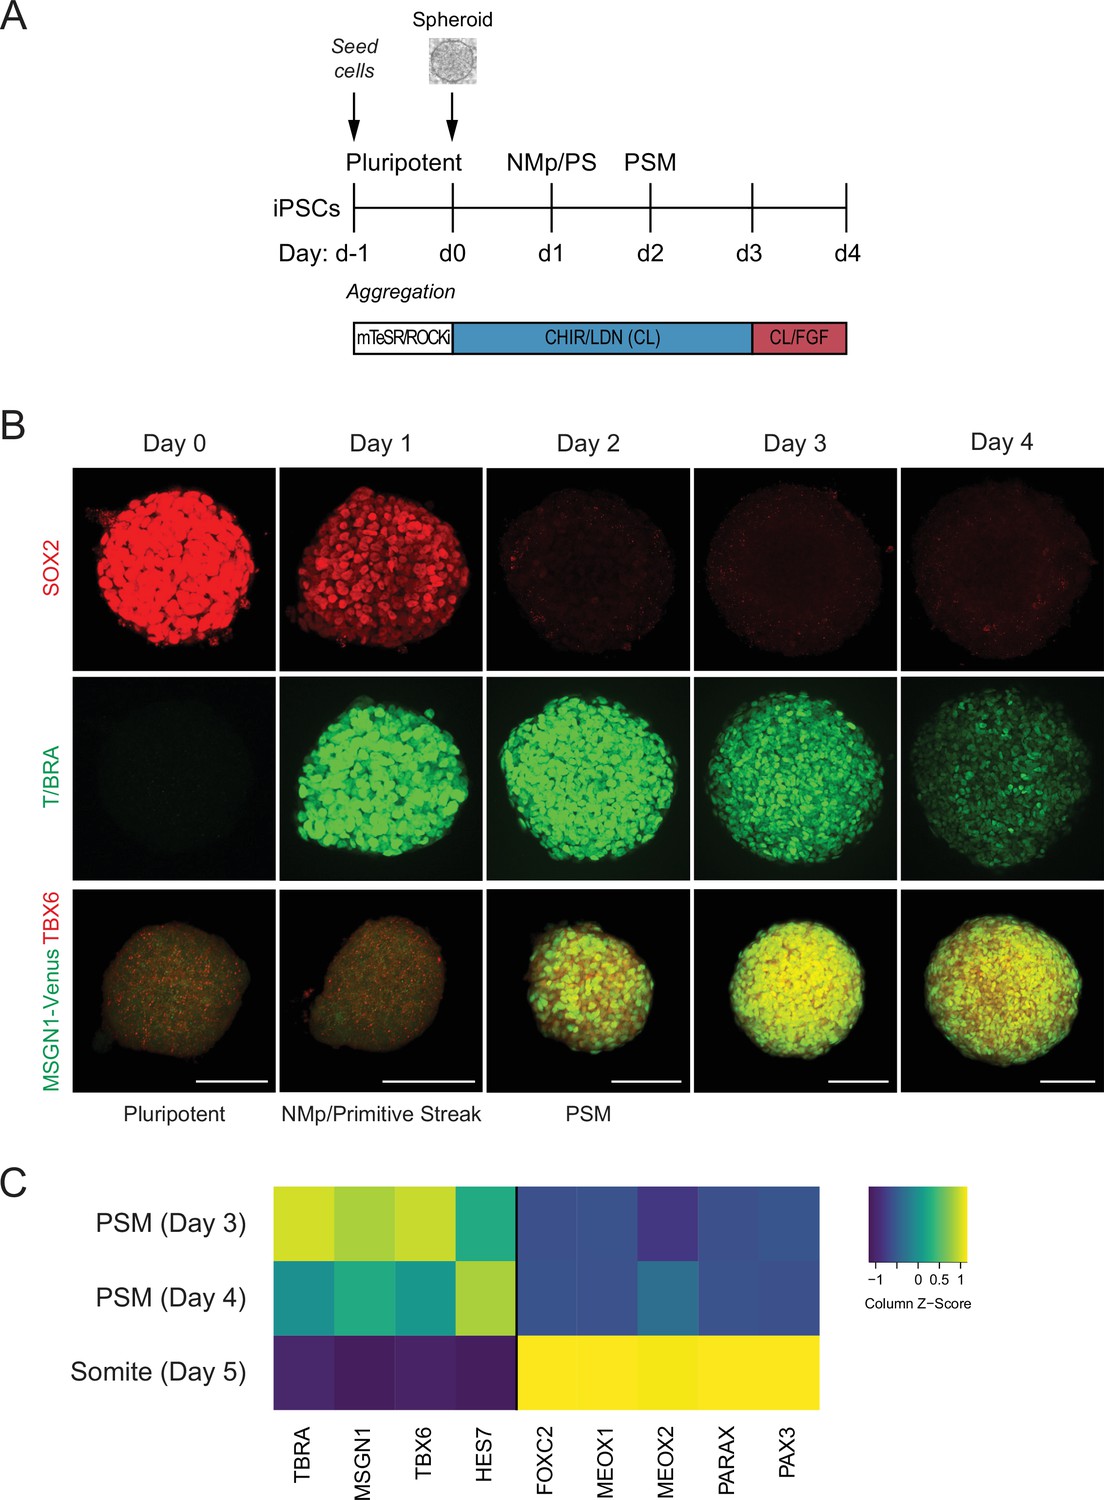
Human pluripotent stem cell (hPSC)-derived paraxial mesoderm (PM) organoids turn on marker genes associated with PM differentiation.
(A) Schematic overview of PM organoid differentiation protocol from hPSCs. hPSCs aggregated and formed spheroids for 24 hr prior to differentiation. For differentiation, spheroids were exposed to Wnt agonist (CHIR) and BMP inhibitor (LDN) for 72 hr. On day 3, FGF2 was added to the media in addition to CHIR and LDN. (B) Immunofluorescence analysis of cell fate-specific marker genes shows progressive differentiation towards presomitic mesoderm (PSM) fate (top and middle rows). Organoids derived from human induced pluripotent stem cells (hiPSCs) harboring an MSGN1-Venus reporter express TBX6 at the same time as the reporter is activated (bottom row). Scale bar represents 100 µm. Representative images shown from n = 3 independent experiments. Cell lines used: NCRM1 hiPSCs and MSGN1-Venus hiPS reporter cells. (C) qRT-PCR analysis of PSM and somite markers reveals PSM-to-somite transition from day 4 to day 5. Relative gene expression levels are shown as Z-scores, expressed as fold-change relative to undifferentiated iPSCs (see Materials and methods). Source data is available in Figure 1—source data 1.
-
Figure 1—source data 1
qPCR raw data of paraxial mesoderm (PM) organoid differentiation.
- https://cdn.elifesciences.org/articles/68925/elife-68925-fig1-data1-v2.txt
Figure 1—figure supplement 1
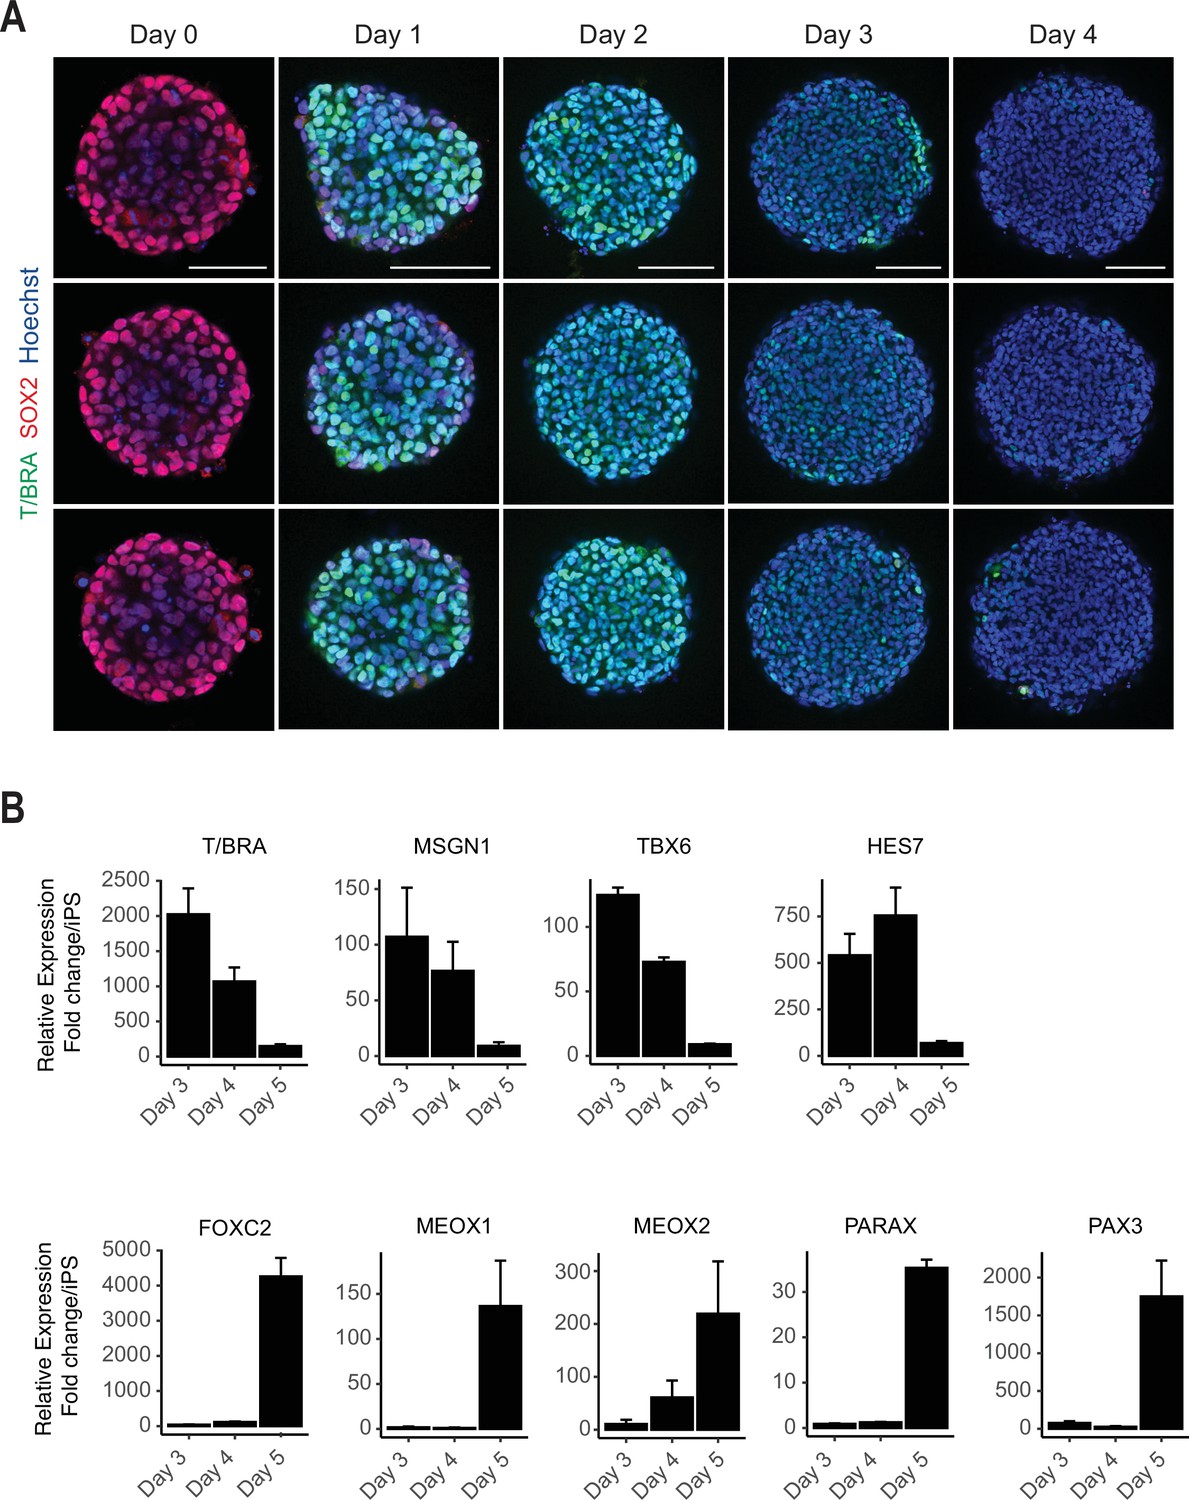
Additional immunofluorescent and qPCR data.
(A) Immunofluorescent images of paraxial mesoderm (PM) organoid differentiation from cavity-forming spheroids. Single optical z-sections are shown for each organoid to illustrate the central cavity formed 24 hr after aggregation (day 0). For each day of differentiation, three representative replicates are shown. Representative images are shown from three organoid replicates. NCRM1 human induced pluripotent stem cells (hiPSCs) were used to generate organoids. (B) qRT-PCR analysis of presomitic mesoderm (PSM) and somite markers reveals PSM-to-somite transition from day 4 to day 5. Relative gene expression levels are shown as fold-change relative to undifferentiated iPSCs (see Materials and methods).
Figure 1—figure supplement 2
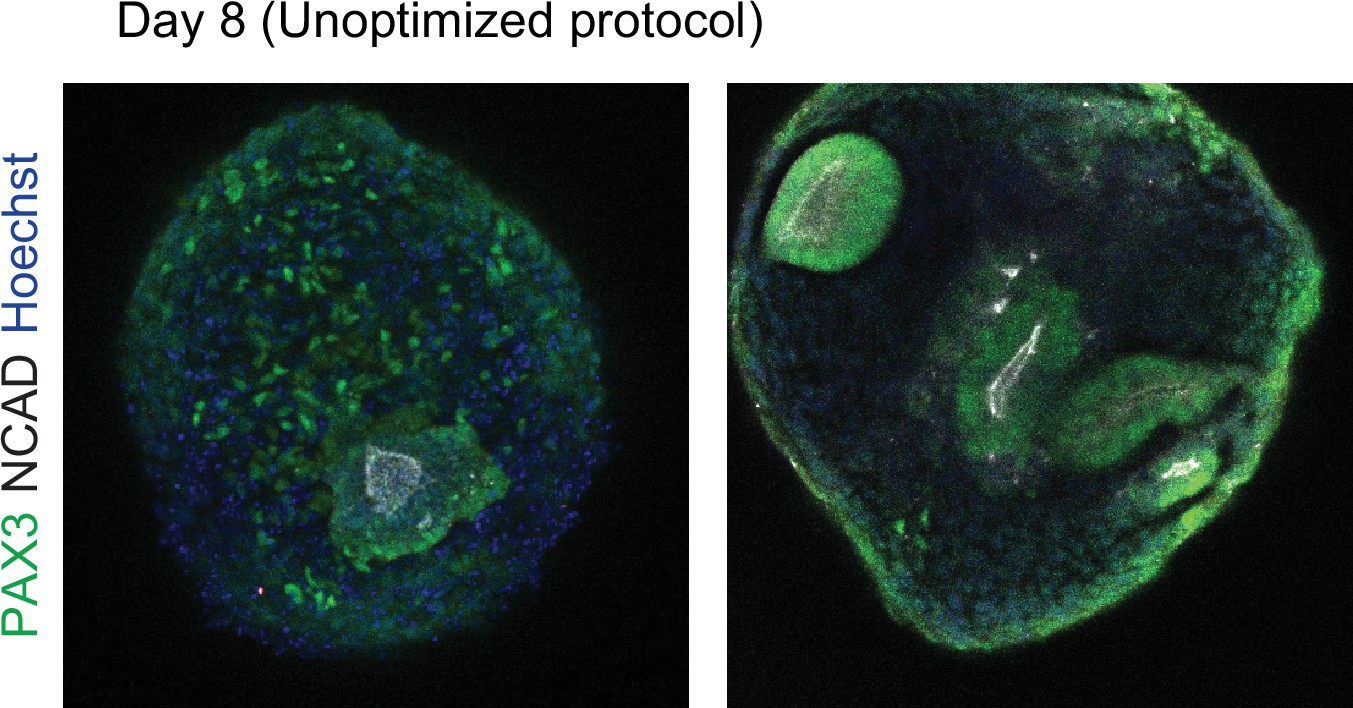
Organoids generated using an unoptimized protocol exhibit heterogeneous activation of somite marker genes (PAX3 and NCAD) and a low number of rosette structures.
The rosette structures do not match the expected size of in vivo human somites. In addition, organoids generated using the unoptimized protocol showed a delayed onset of PAX3 expression and the rosette structures did not form until day 8.
Figure 2 with 3 supplements
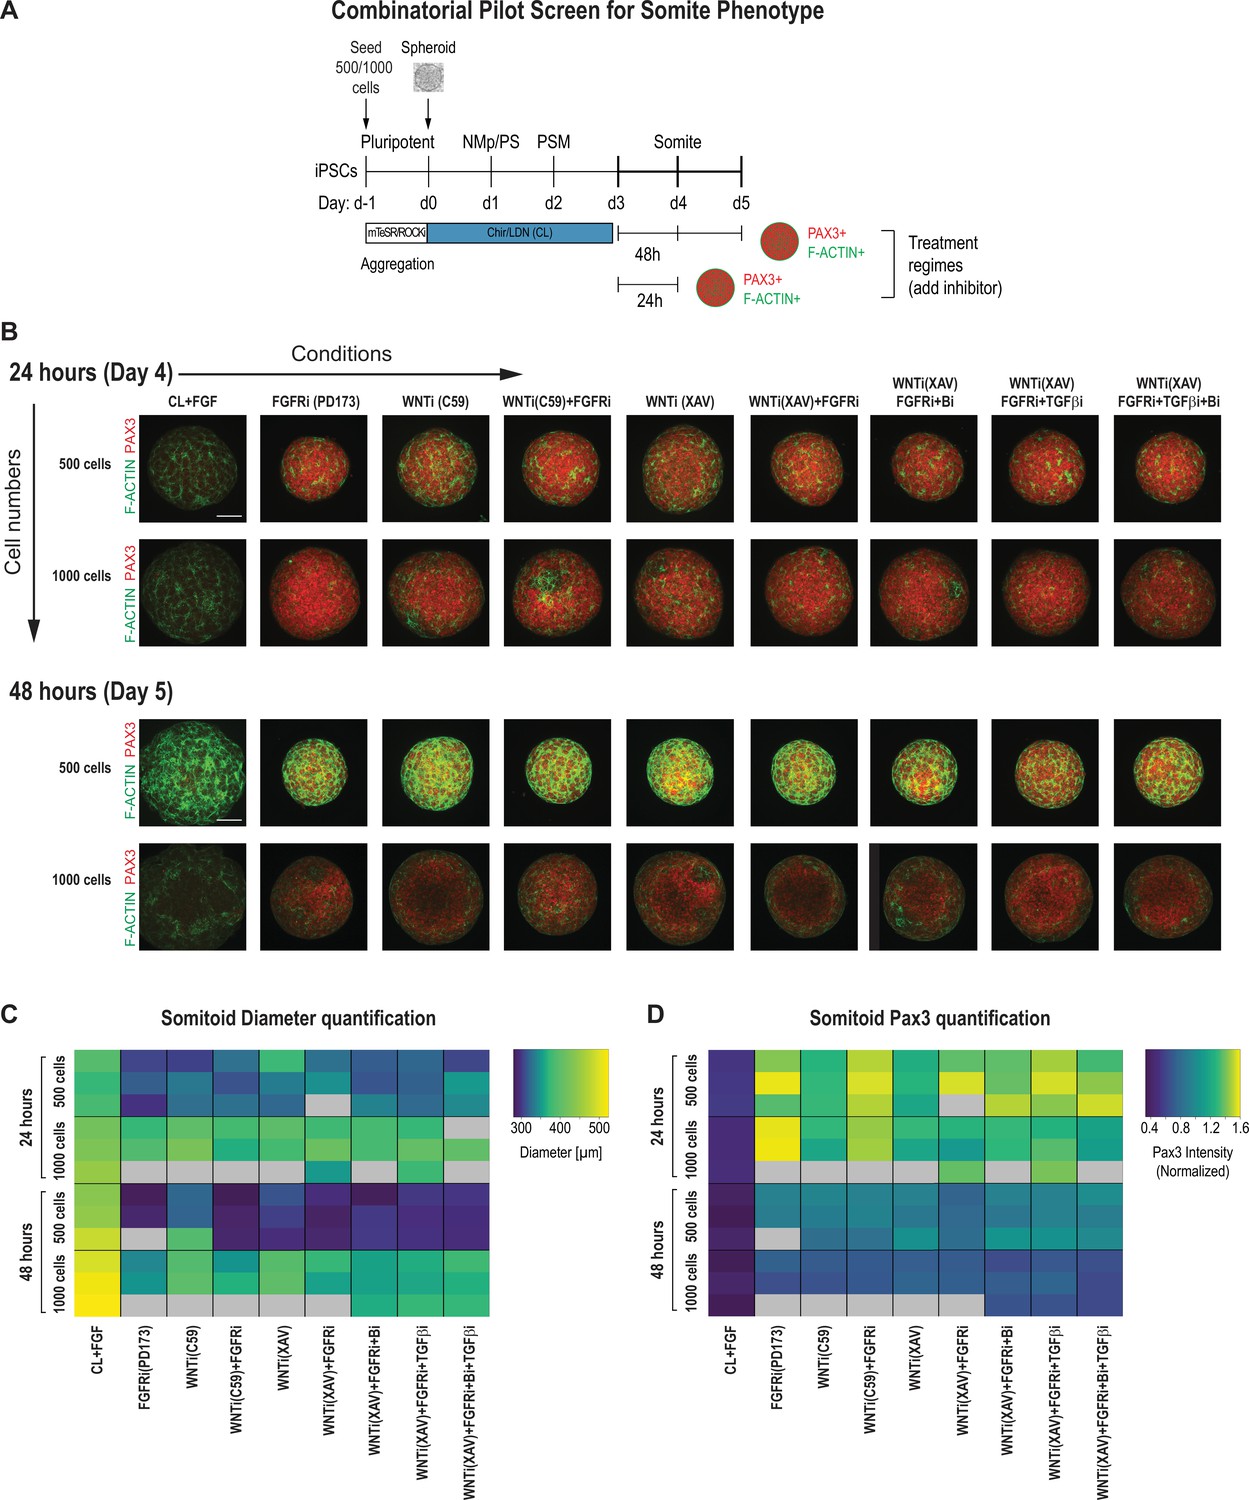
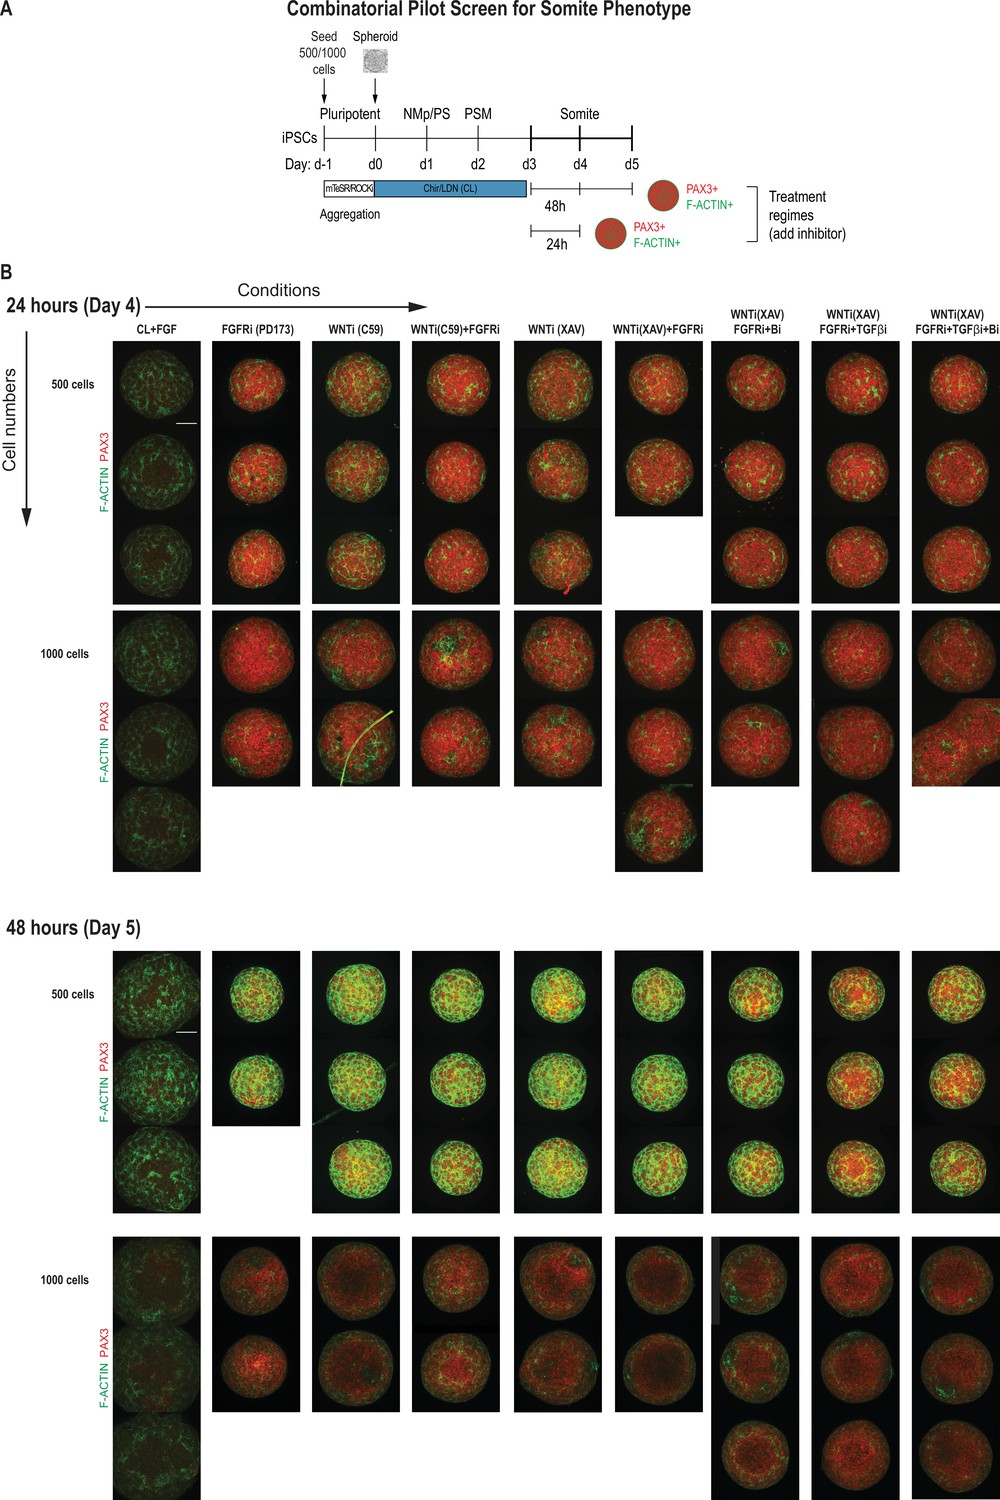
Pilot screen to optimize differentiation conditions for somite phenotype in paraxial mesoderm (PM) organoids reveals optimal initial number of cells and duration of treatment.
(A) Schematic overview of systematic screen in PM organoids (Somitoids). Presomitic mesoderm (PSM)-stage organoids were treated on day 3 for 24 hr or 48 hr with signaling agonists/antagonists. Treated organoids were cultured in basal media with inhibitors as indicated. Control organoids were maintained in CL media with FGF added. NCRM1-derived organoids were used for the screen. (B) Representative immunofluorescent images of day 4 and day 5 organoids after treatment for 24 hr or 48 hr, respectively, stained for somite marker PAX3 and F-ACTIN to visualize rosette-like somite structures. Organoids generated from 1000 cells generally show a more diffuse F-ACTIN pattern compared to organoids made from 500 cells, which exhibit bright foci, consistent with somite formation. Confocal images are shown as maximum intensity z-projections. Scale bar represents 100 µm. Small-molecule inhibitors used are indicated in brackets. FGFRi, FGF receptor inhibitor (PD173074); WNTi; Wnt inhibitor (C59 or XAV939); Bi, BMP inhibitor (LDN); TGF-βi, TGF-β inhibitor (A-83-01). Representative image shown for each condition from three organoid replicates. (C) Automated quantification of organoid diameter for each organoid/replicate treated as indicated (see Materials and methods for details). Three organoids per condition were characterized except where indicated with gray boxes. Organoids initiated from 500 cells show a decreased diameter when treated for 48 hr compared with 24 hr. Source data is available in Figure 2—source data 1. (D) Automated quantification of normalized average PAX3 intensity for each organoid/replicate treated as indicated. Three organoids are shown per condition except where indicated with gray boxes. Organoids initiated from both 500 and 1000 cells show higher average normalized PAX3 levels when treated for 24 hr compared with 48 hr. Source data is available in Figure 2—source data 2.
-
Figure 2—source data 1
Quantification of organoid diameter from primary screen.
- https://cdn.elifesciences.org/articles/68925/elife-68925-fig2-data1-v2.csv
-
Figure 2—source data 2
Quantification of average PAX3 levels per organoid from primary screen.
- https://cdn.elifesciences.org/articles/68925/elife-68925-fig2-data2-v2.csv
Figure 2—figure supplement 1
Replicate data of pilot screen for somite phenotype in human paraxial mesoderm (PM) organoids.
(A) Schematic overview of systematic screen in PM organoids. PM-stage organoids were treated on day 3 for 24 hr and 48 hr, respectively, with signaling agonists/antagonists as indicated. Control organoids were maintained in CL media with FGF added. (B) Complete immunofluorescent dataset showing all replicates of day 4 and day 5 organoids after treatment immunostained for somite marker PAX3 and F-ACTIN to visualize rosette-like somite structures. Confocal images are shown as maximum intensity z-projections. Scale bar represents 100 µm. Small-molecule inhibitors used are indicated in brackets. FGFRi, FGF receptor inhibitor (PD173074); WNTi, Wnt inhibitor (C59 or XAV939); Bi, BMP inhibitor (LDN); TGF-βi, TGF-β inhibitor (A-83-01).
Figure 2—figure supplement 2
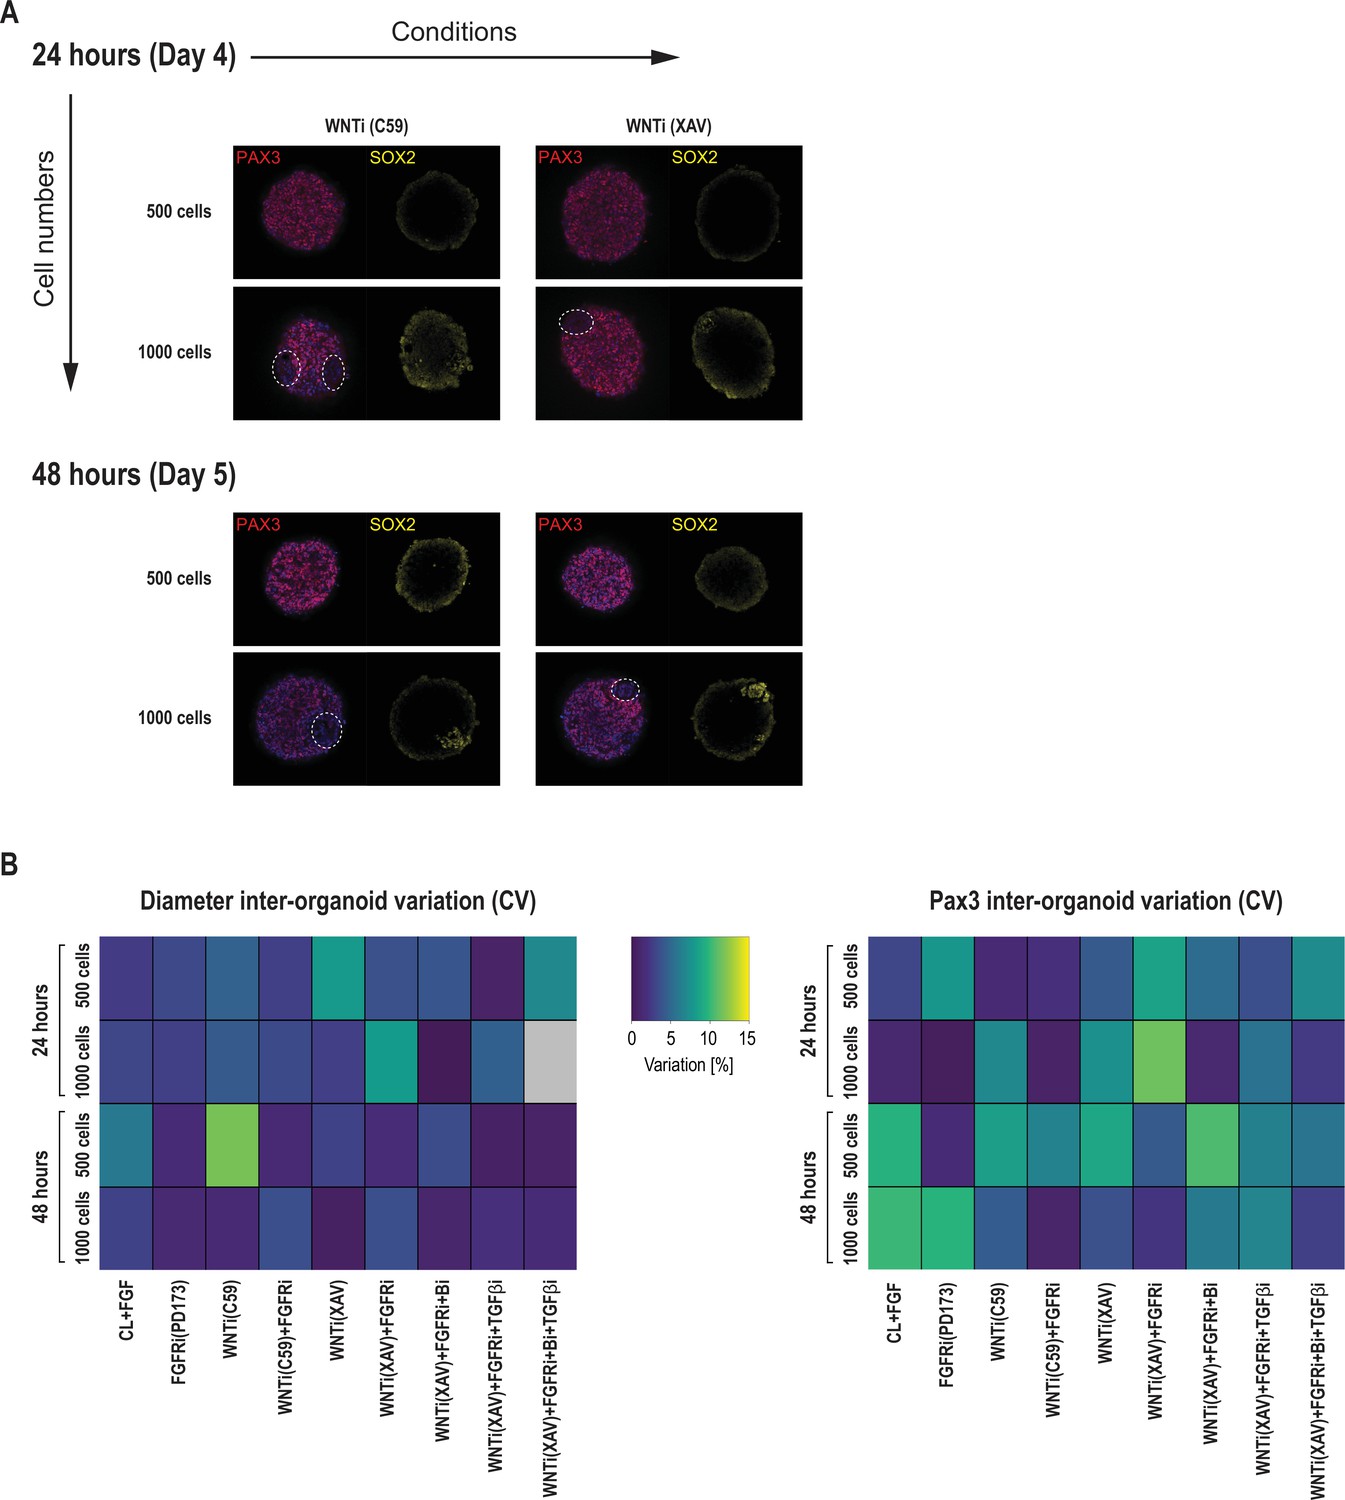
Additional immunofluorescent data and inter-organoid phenotypic variance of primary somite phenotype screen in Somitoids.
(A) Comparison of organoids made from 500 and 1000 cells, respectively, immunostained for PAX3 (somite fate) and SOX2 (neural fate). Organoids made from 1000 cells contain patches of PAX3-negative/SOX2-positive cells (marked by dashed contours), indicating a higher degree of heterogeneity of somite fate induction. Representative images are shown from three organoid replicates. (B) Heatmaps of diameter and PAX3 inter-organoid variation for each treatment, expressed as coefficient of variation (CV, in percentage). CV is calculated across the two or three organoid replicates of each condition as (standard deviation/mean) * 100.
Figure 2—figure supplement 3
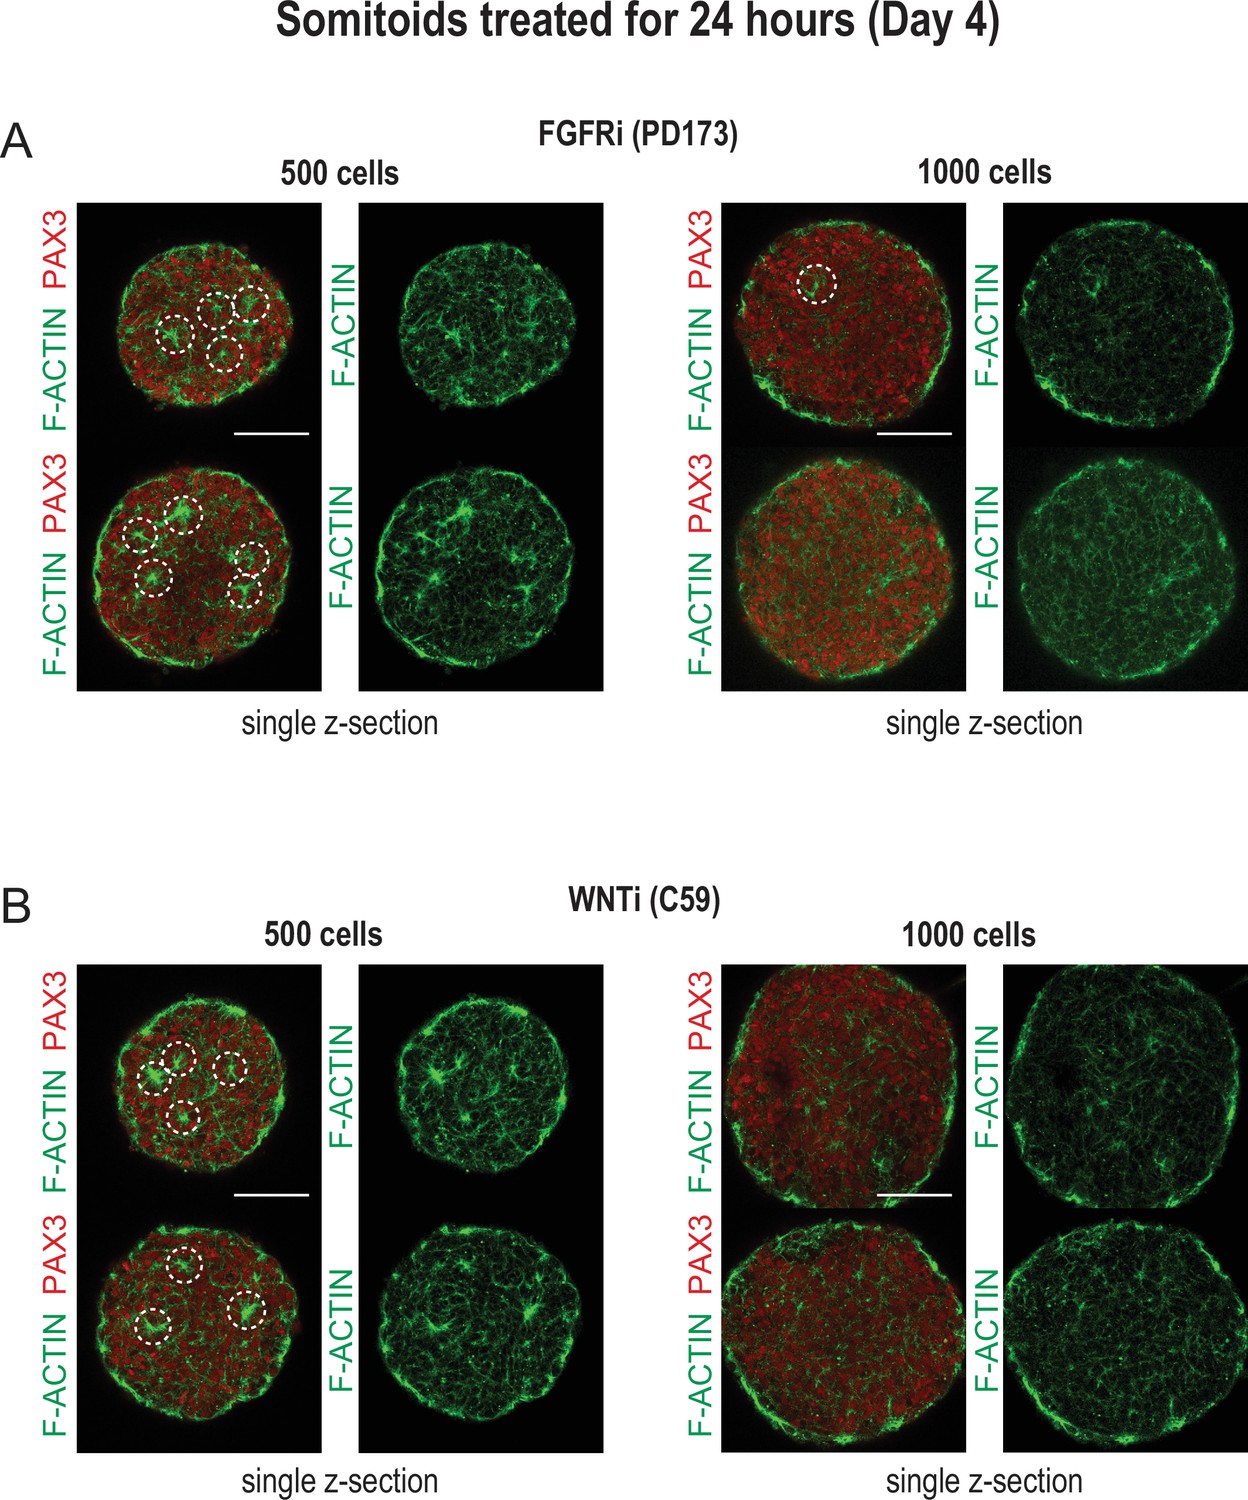
Organoids made from 500 cells more reproducibly generate somite-like structures compared to organoids made from 1000 cells.
Representative single z-sections of organoids treated for 24 hr with inhibitors as indicated. Organoids were stained for PAX3 and F-ACTIN to visualize somite-like structures. Scale bar represents 100 µm. (A) Organoids made from 500 and 1000 cells, respectively, were treated with FGFR inhibitor PD173 for 24 hr on day 3 of the differentiation protocol. Two representative organoids are shown for each cell number. Organoids made from 500 cells consistently show more somite-like structures compared to organoids made from 1000 cells. (B) Organoids made from 500 and 1000 cells, respectively, were treated with WNT inhibitor C59 for 24 hr on day 3 of the differentiation protocol. Two representative organoids are shown for each cell number. Organoids made from 500 cells show more uniform expression of PAX3 and a higher number of somite-like structures compared to organoids made from 1000 cells.
Figure 3 with 4 supplements
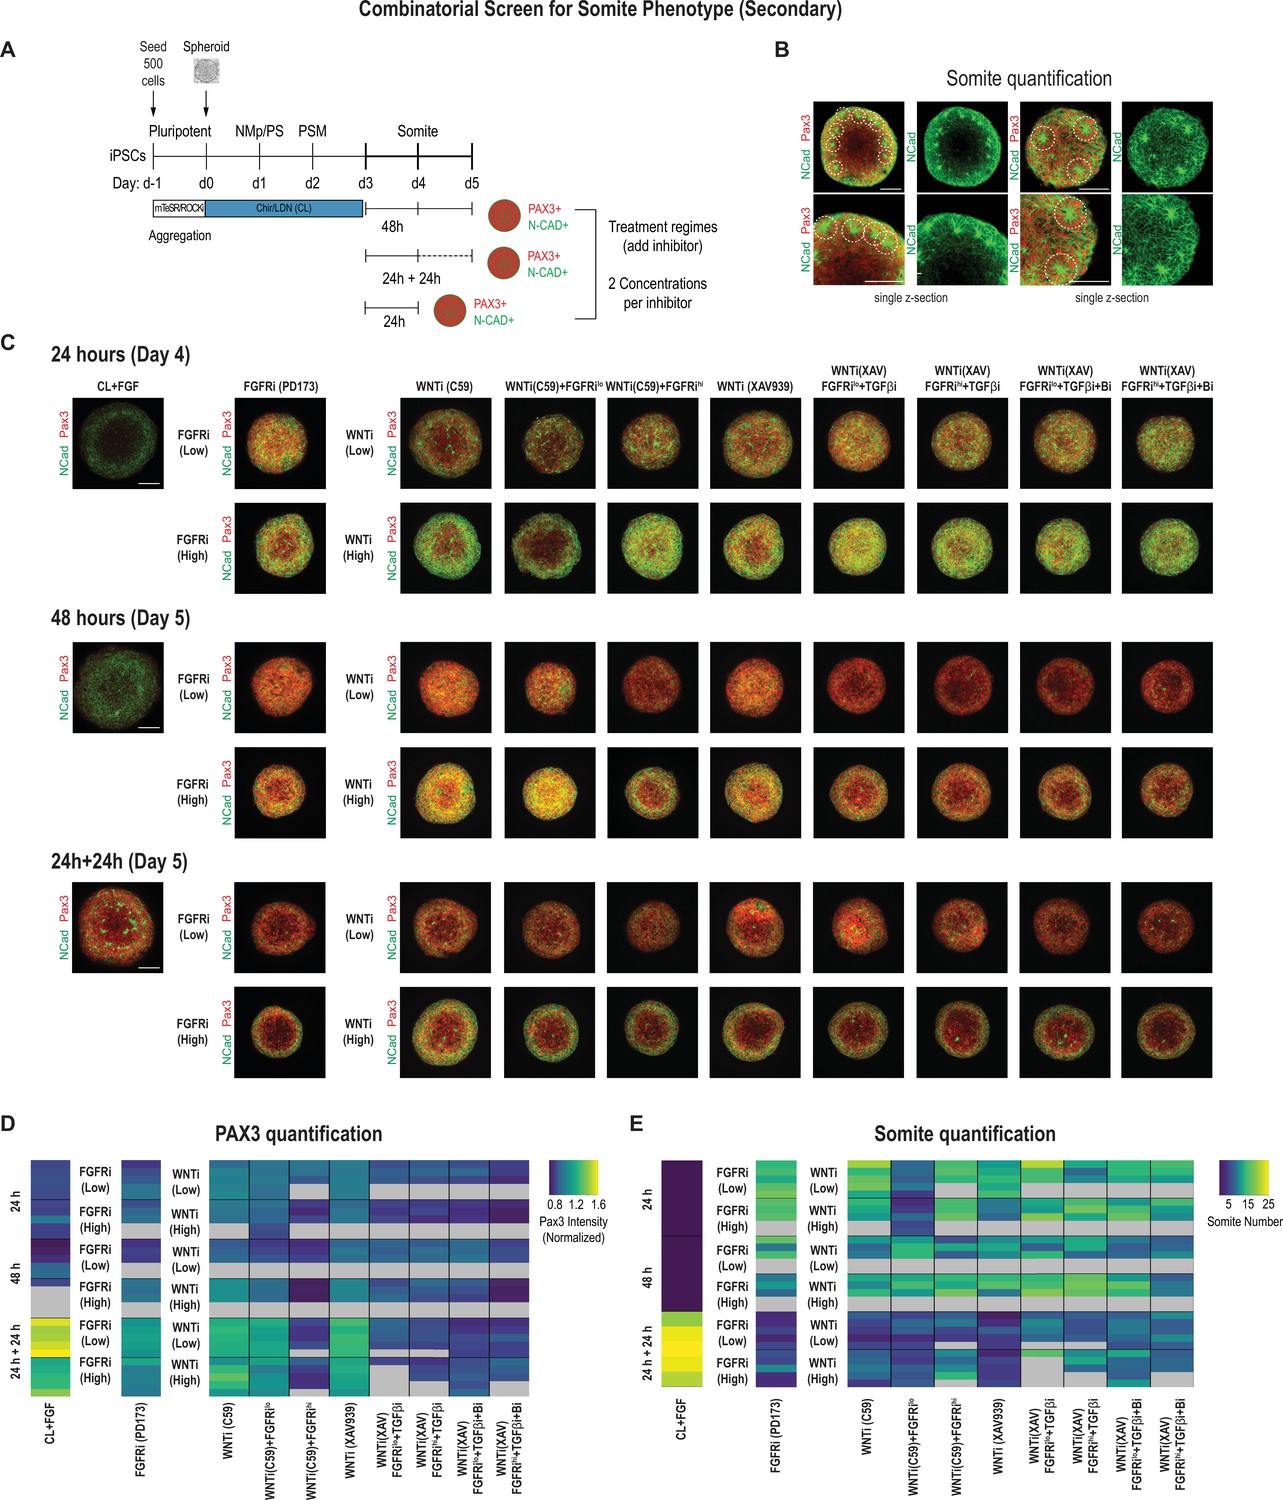
Secondary screen of paraxial mesoderm (PM) organoids identifies optimal differentiation protocol for somite formation.
(A) Schematic overview of secondary screen in PM organoids. Presomitic mesoderm (PSM)-stage organoids were treated on day 3 for 24 hr followed by measurement, 24 hr of treatment followed by 24 hr culture in basal media (no added factors) and then measured (24 hr + 24 hr), and 48 hr of treatment followed by measurement. Treated organoids were cultured in basal media with inhibitors as indicated. WNT and FGF inhibitors were tested at two different concentrations. Control organoids were maintained in CL media with FGF added. NCRM1-derived organoids were used for the screen. (B) Representative immunofluorescent images of day 5 organoids stained for somite markers PAX3 and NCAD showing the rosette-like structures that were scored as somite-like structures based on expression of somite fate markers and structural features (scoring criteria detailed in Materials and methods). Images are shown as individual z-sections. (C) Representative immunofluorescent images of day 4 and day 5 organoids stained for somite markers PAX3 and NCAD to visualize rosette-like somite structures. Confocal images are shown as maximum intensity z-projections. Scale bar represents 100 µm. Small-molecule inhibitors used are indicated in brackets. FGFRi, FGF receptor inhibitor (PD173074); WNTi, Wnt inhibitor (C59 or XAV939); Bi, BMP inhibitor (LDN); TGF-βi, TGF-β inhibitor (A-83-01). Representative image shown for each condition from five organoid replicates. (D) Automated quantification of normalized average PAX3 intensity for each organoid/replicate treated as indicated (see Materials and methods for details). Five organoids are shown per condition except as indicated with gray boxes. Several inhibitor combinations with a treatment regime of 24 hr treatment followed by 24 hr cultured in basal media show highest average PAX3 levels. Source data is available in Figure 3—source data 1. (E) Quantification of the number of somite-like structures for each condition. Each row represents one organoid replicate. Five organoids are shown per condition except where indicated with gray boxes. Organoids that were maintained in CL media with added FGF for 24 hr followed by culture in basal media for 24 hr reproducibly exhibit the highest number of somite-like structures per organoid. Source data is available in Figure 3—source data 2.
-
Figure 3—source data 1
Quantification of average PAX3 levels per organoid from secondary screen.
- https://cdn.elifesciences.org/articles/68925/elife-68925-fig3-data1-v2.csv
-
Figure 3—source data 2
Quantification of somite-like structures of secondary screen.
- https://cdn.elifesciences.org/articles/68925/elife-68925-fig3-data2-v2.csv
Figure 3—figure supplement 1
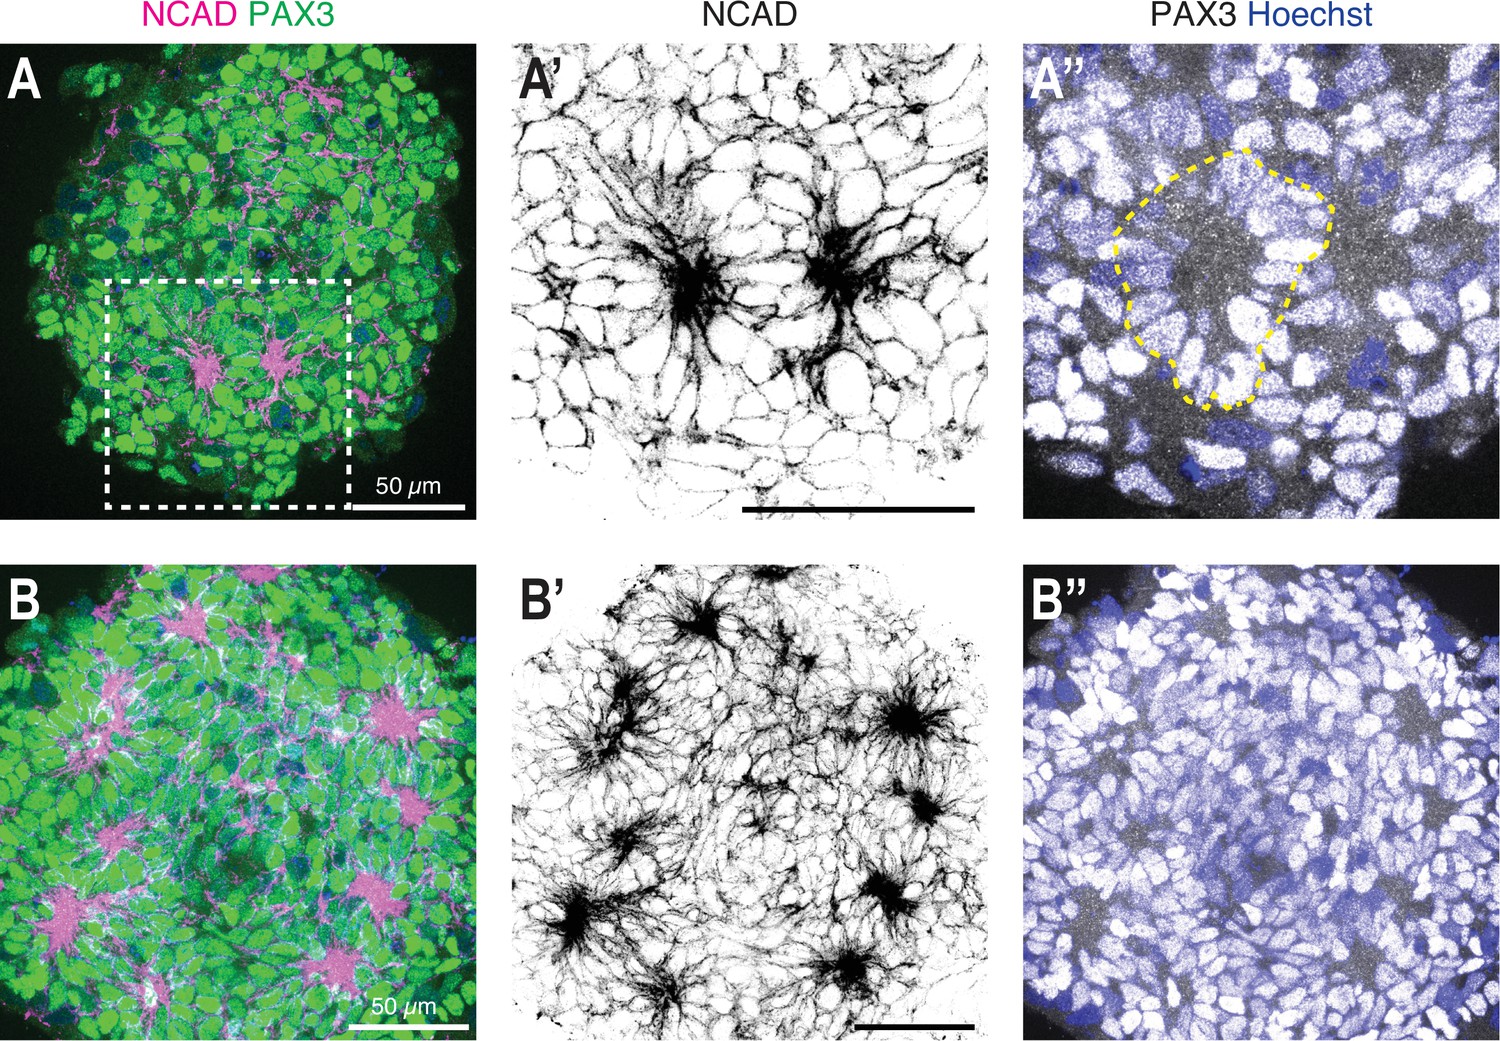
High-resolution imaging of somite-like structures in day 5 organoids.
(A) Single z-section of a day 5 organoid treated with CL + FGF2 on day 3 to day 4, followed by culture in basal media for 24 hr (optimized protocol). Somite-like structures were visualized by immunostaining using somite markers PAX3 and NCAD. (A’) shows an enlargement of the dashed square indicated in (A) with two somite-like structures visible based on NCAD expression. (A’’) Merged image of the PAX3 and Hoechst (nuclear stain) channels with a dashed outline marking one of the somite-like structures. (B) Z-projection of a day 5 organoid treated with CL + FGF2 on day 3 to day 4, followed by culture in basal media for 24 hr (optimized protocol). Five consecutive z-sections (1 µm step size) were used to generate the projection. Somite-like structures were visualized by immunostaining using somite markers PAX3 and NCAD. Scale bars indicate 50 µm.
Figure 3—figure supplement 2
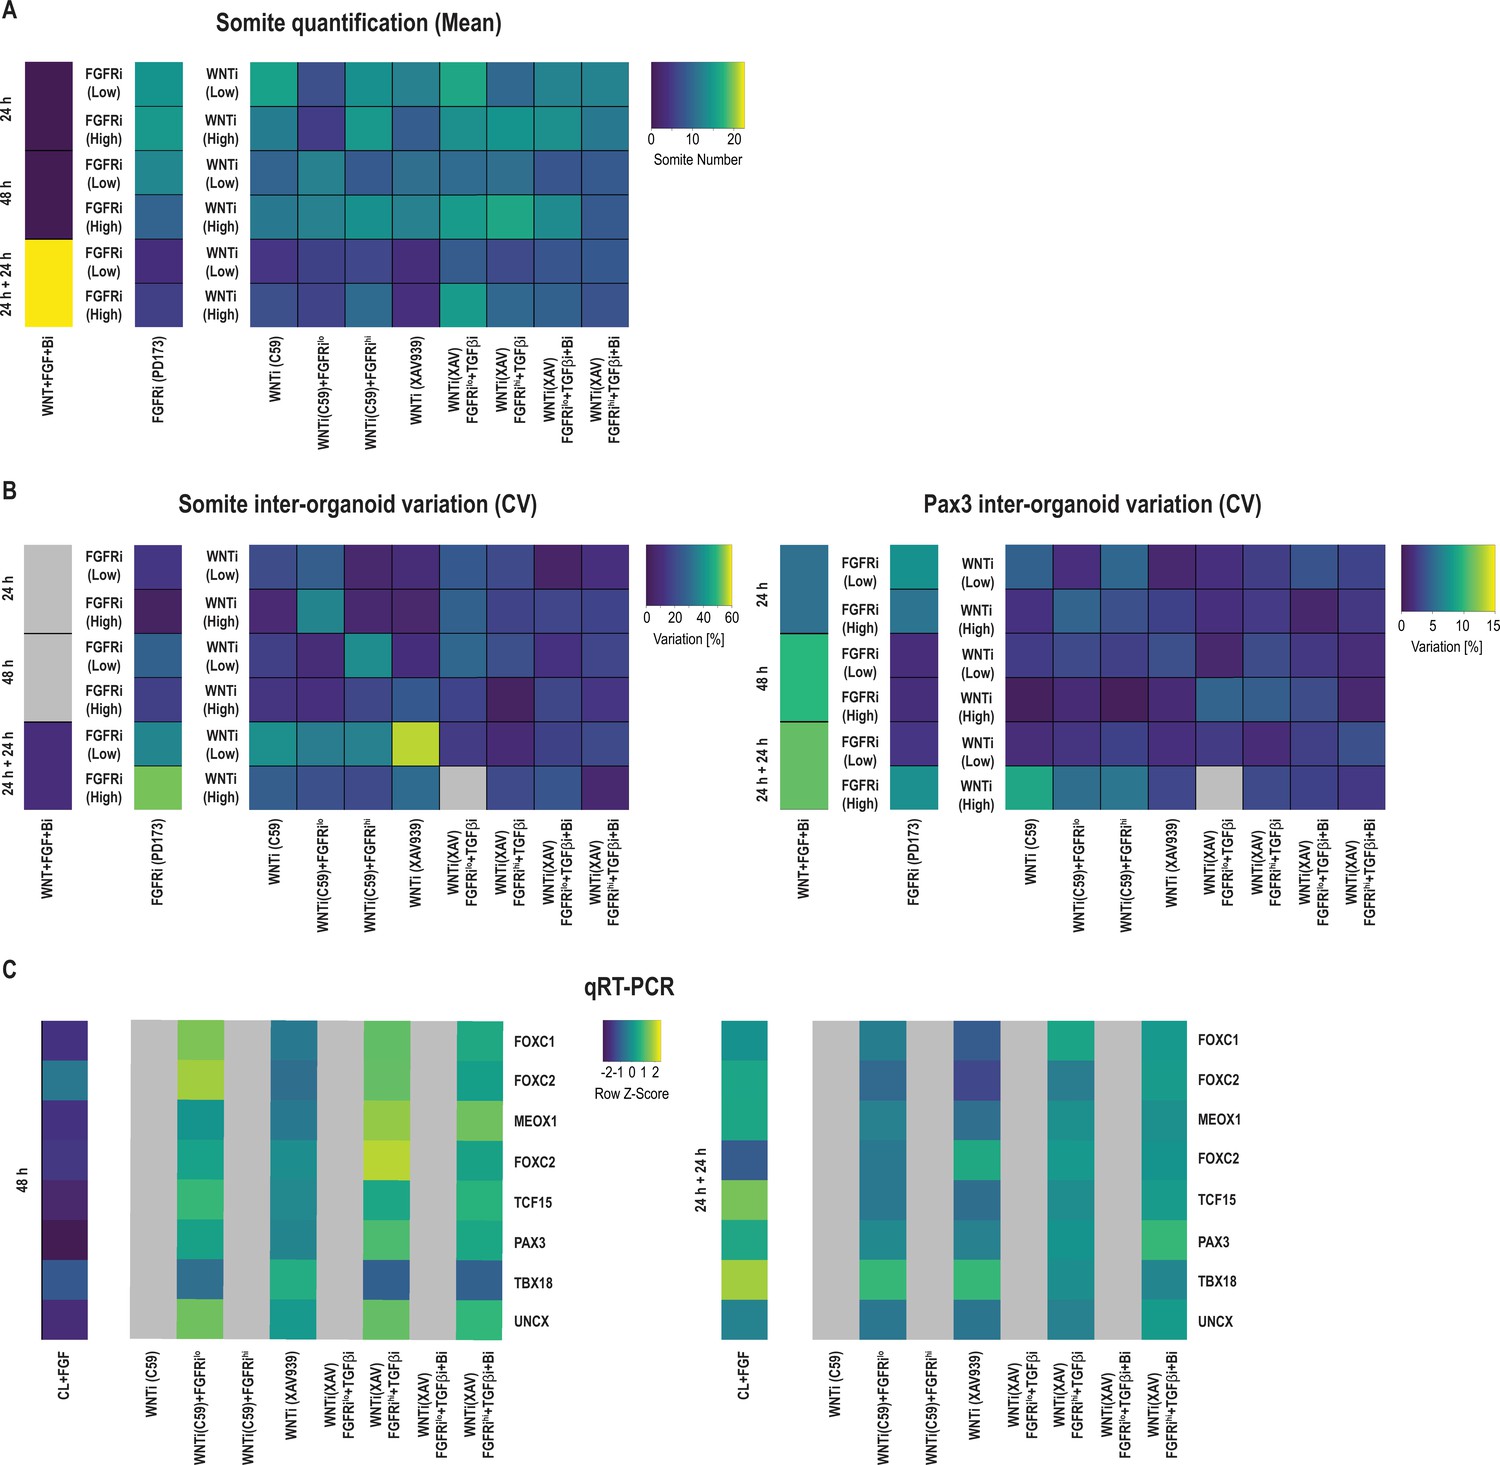
Additional qPCR data and inter-organoid phenotypic variance of secondary somite phenotype screen in Somitoids.
(A) Quantification of the number of somite-like structures for each condition. The number of somite-like structures is shown as calculated means based on quantifying somite-like structures for 2–5 organoids per condition. (B) Heatmaps of somite-like structure counts and PAX3 inter-organoid variation for each treatment, expressed as coefficient of variation (CV, in percentage). CV is calculated across the 3–5 replicates of each condition as (standard deviation/mean) * 100. (C) qRT-PCR analysis of somite marker genes for select treatment conditions from the secondary somite phenotype screen. Expression of somite marker genes correlates well with Pax3 immunostainings from the secondary screen (see Figure 3B). Relative gene expression levels are shown as Z-scores, expressed as fold-change relative to undifferentiated induced pluripotent stem cells (iPSCs) (see Materials and methods). Source data is available in Figure 3—figure supplement 2—source data 1.
-
Figure 3—figure supplement 2—source data 1
qPCR data of calculated expression levels of selected treatment regimes from secondary screen.
- https://cdn.elifesciences.org/articles/68925/elife-68925-fig3-figsupp2-data1-v2.csv
Figure 3—figure supplement 3
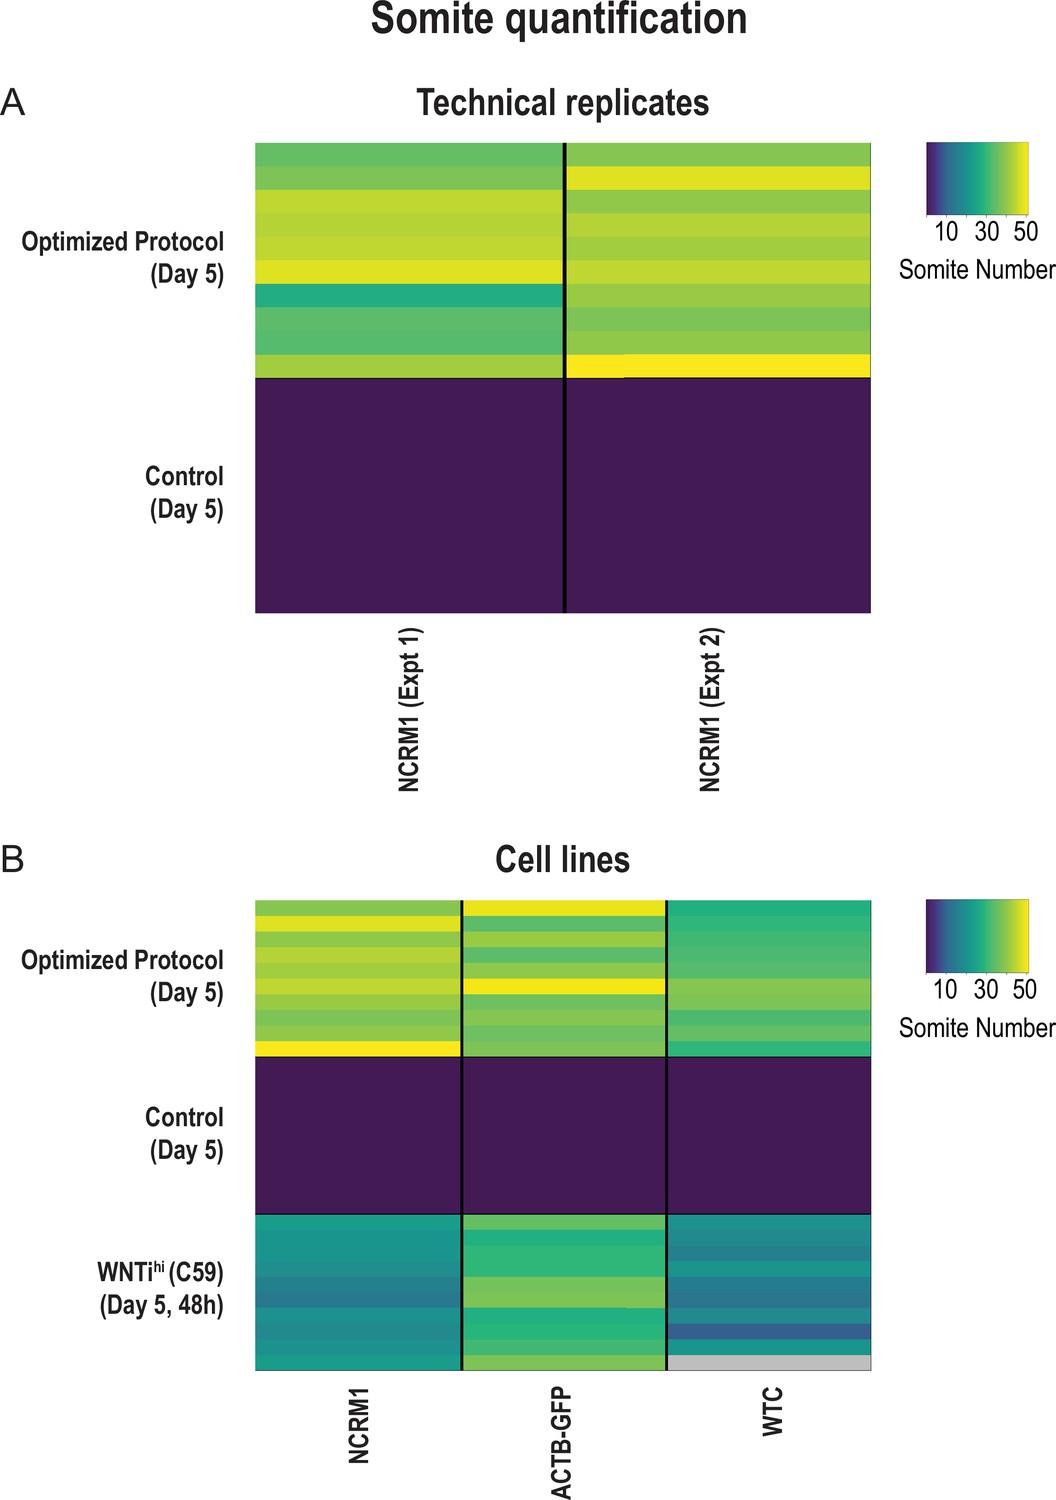
The optimized Somitoid protocol is reproducible across experiments and different cell lines.
Quantification of the number of somite-like structures for each condition. Each row represents one organoid replicate. 10 organoids are shown per condition. Optimized protocol corresponds to treatment with CL + FGF2 for 24 hr followed by culture in basal media for 24 hr. Control organoids were treated with CL + FGF2 for 48 hr. (A) Organoids treated with the optimized protocol exhibit a robust and reproducible somite phenotype across two independent experiments (Experiment 1, average number of somite-like structures = 39 ± 8 (mean ± std); Experiment 2, average number of somite-like structures = 42 ± 4; p-val = 0.16). Source data is available in Figure 3—figure supplement 3—source data 1. (B) Applying the optimized protocol to multiple cell lines confirms that the observed somite phenotype is reproducible across different cell lines. Two cell lines (ACTB-GFP and WTC) were characterized in addition to our screening cell line (NCRM1). NCRM1, average number of somite-like structures = 43 ± 4 (mean ± std); ACTB-GFP, average number of somite-like structures = 40 ± 6; WTC, average number of somite-like structures = 33 ± 4. One additional experimental condition (C59hi, 48 hr), which scored amongst the best conditions in our secondary screen, was also tested and compared across cell lines. Although the C59 treatment (a WNT inhibitor) resulted in a higher number of somite-like structures in the ACTB-GFP cell line (average number of somite-like structures = 32 ± 4 (mean ± std)) compared with the other cell lines (NCRM1, average number of somite-like structures = 20 ± 3; WTC, average number of somite-like structures = 17 ± 4), the optimized protocol resulted in the highest number of somite-like structures in all cell lines. Source data is available in Figure 3—figure supplement 3—source data 2.
-
Figure 3—figure supplement 3—source data 1
Quantification of somite-like structures of technical replicates using the NCRM1 cell line.
- https://cdn.elifesciences.org/articles/68925/elife-68925-fig3-figsupp3-data1-v2.csv
-
Figure 3—figure supplement 3—source data 2
Quantification of somite-like structures of biological replicates using the NCRM1, ACTB-GFP, and WTC cell lines.
- https://cdn.elifesciences.org/articles/68925/elife-68925-fig3-figsupp3-data2-v2.csv
Figure 3—video 1
Confocal z-stacks of Somitoids and control organoids immunostained for PAX3 and NCAD showing in vitro somite-like structures.
Figure 4 with 5 supplements
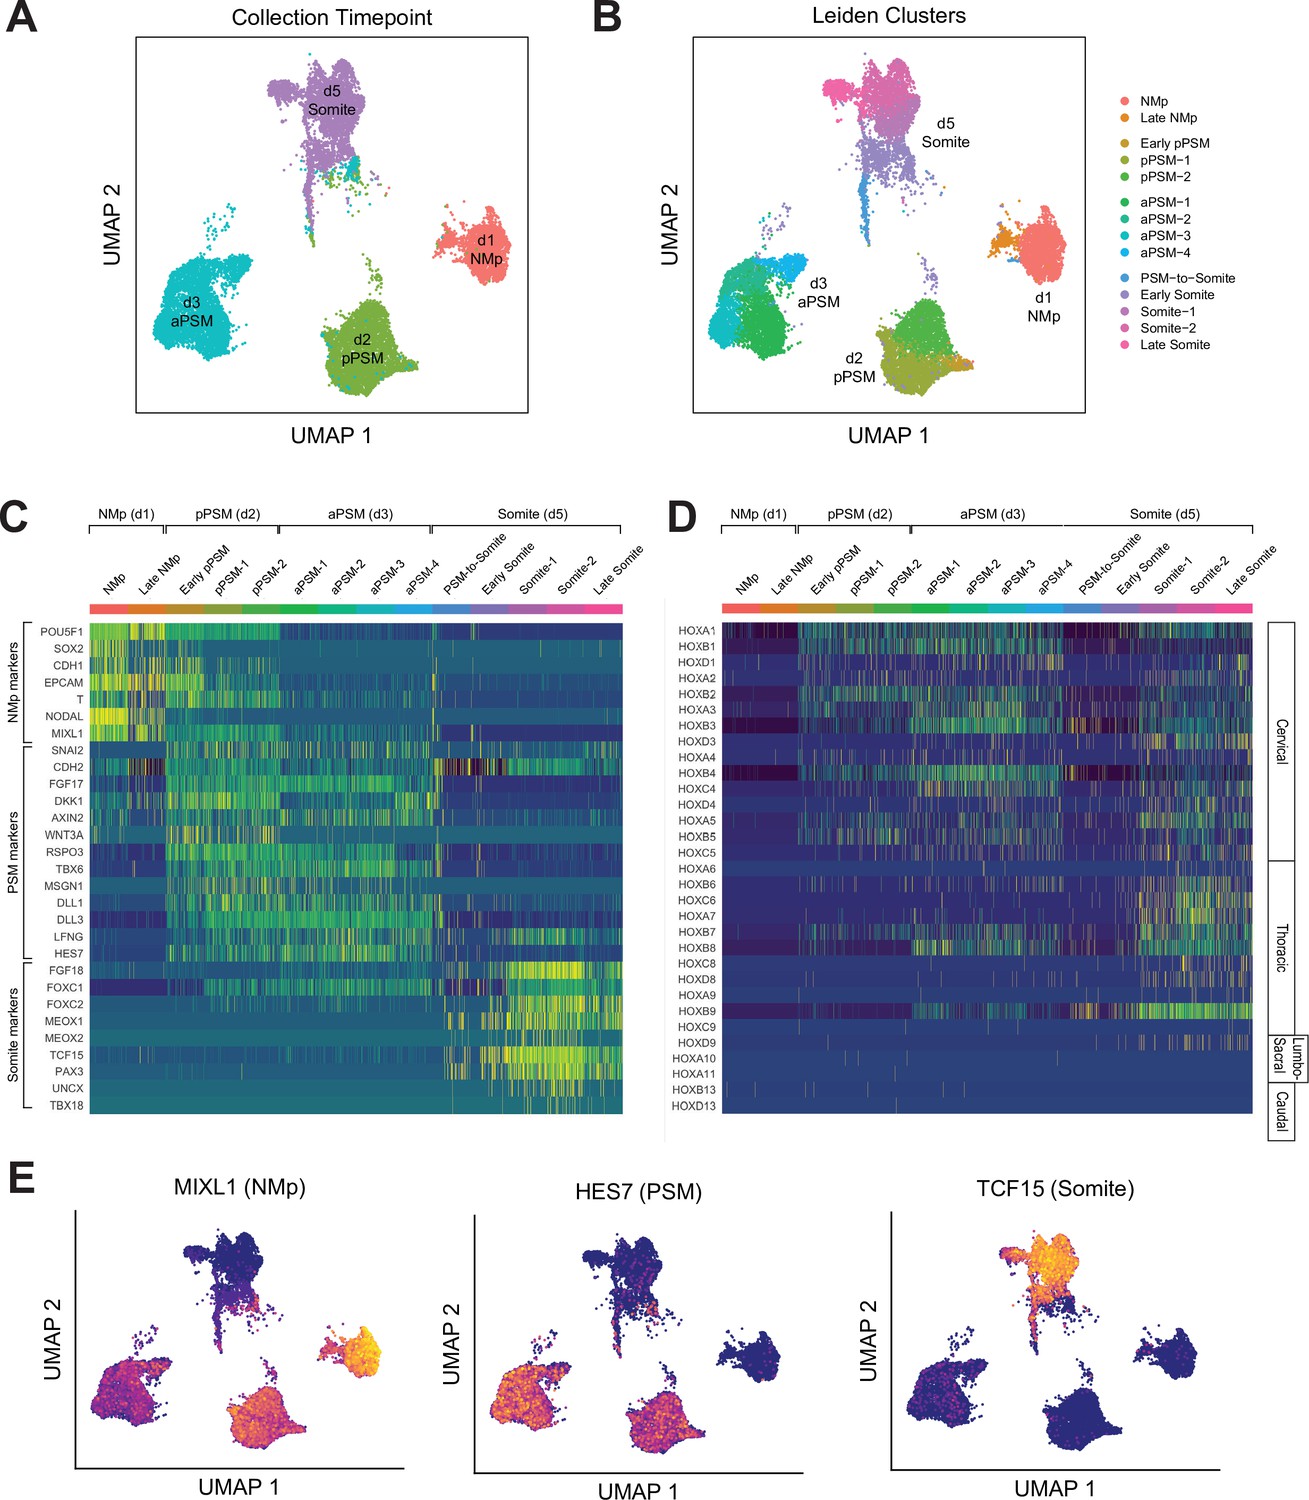
Single-cell RNA-sequencing analysis of paraxial mesoderm PM organoids (Somitoids) reveals differentiation trajectory from NMp-like cells to somite-stage PM.
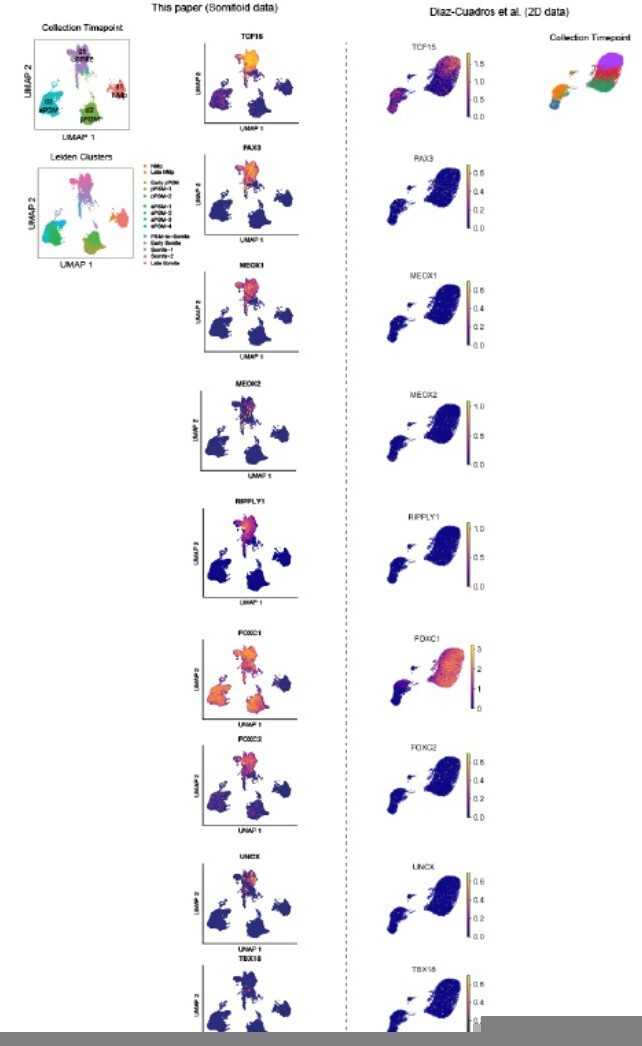
(A) Uniform Manifold Approximation and Projection (UMAP) of single-cell transcriptomes of differentiating human PM organoids, colored by collection timepoint (15,558 cells). NCRM1-derived organoids were used to collect single cells. (B) UMAP of human PM organoids, colored by assigned Leiden cluster identity based on marker gene expression profile (see Materials and methods). (C) Heatmap of selected marker genes of PM differentiation. Collection timepoint and Leiden cluster identities are indicated. Marker genes are grouped based on primary associated cell fate as indicated. (D) Heatmap of single-cell HOX gene expression levels. Cells are grouped by Leiden cluster identity. Hox genes are ordered by position, with anatomical positions of HOX paralogues indicated on the right. (E) UMAP plots overlaid with normalized transcript counts of representative cell fate marker genes.
Figure 4—figure supplement 1
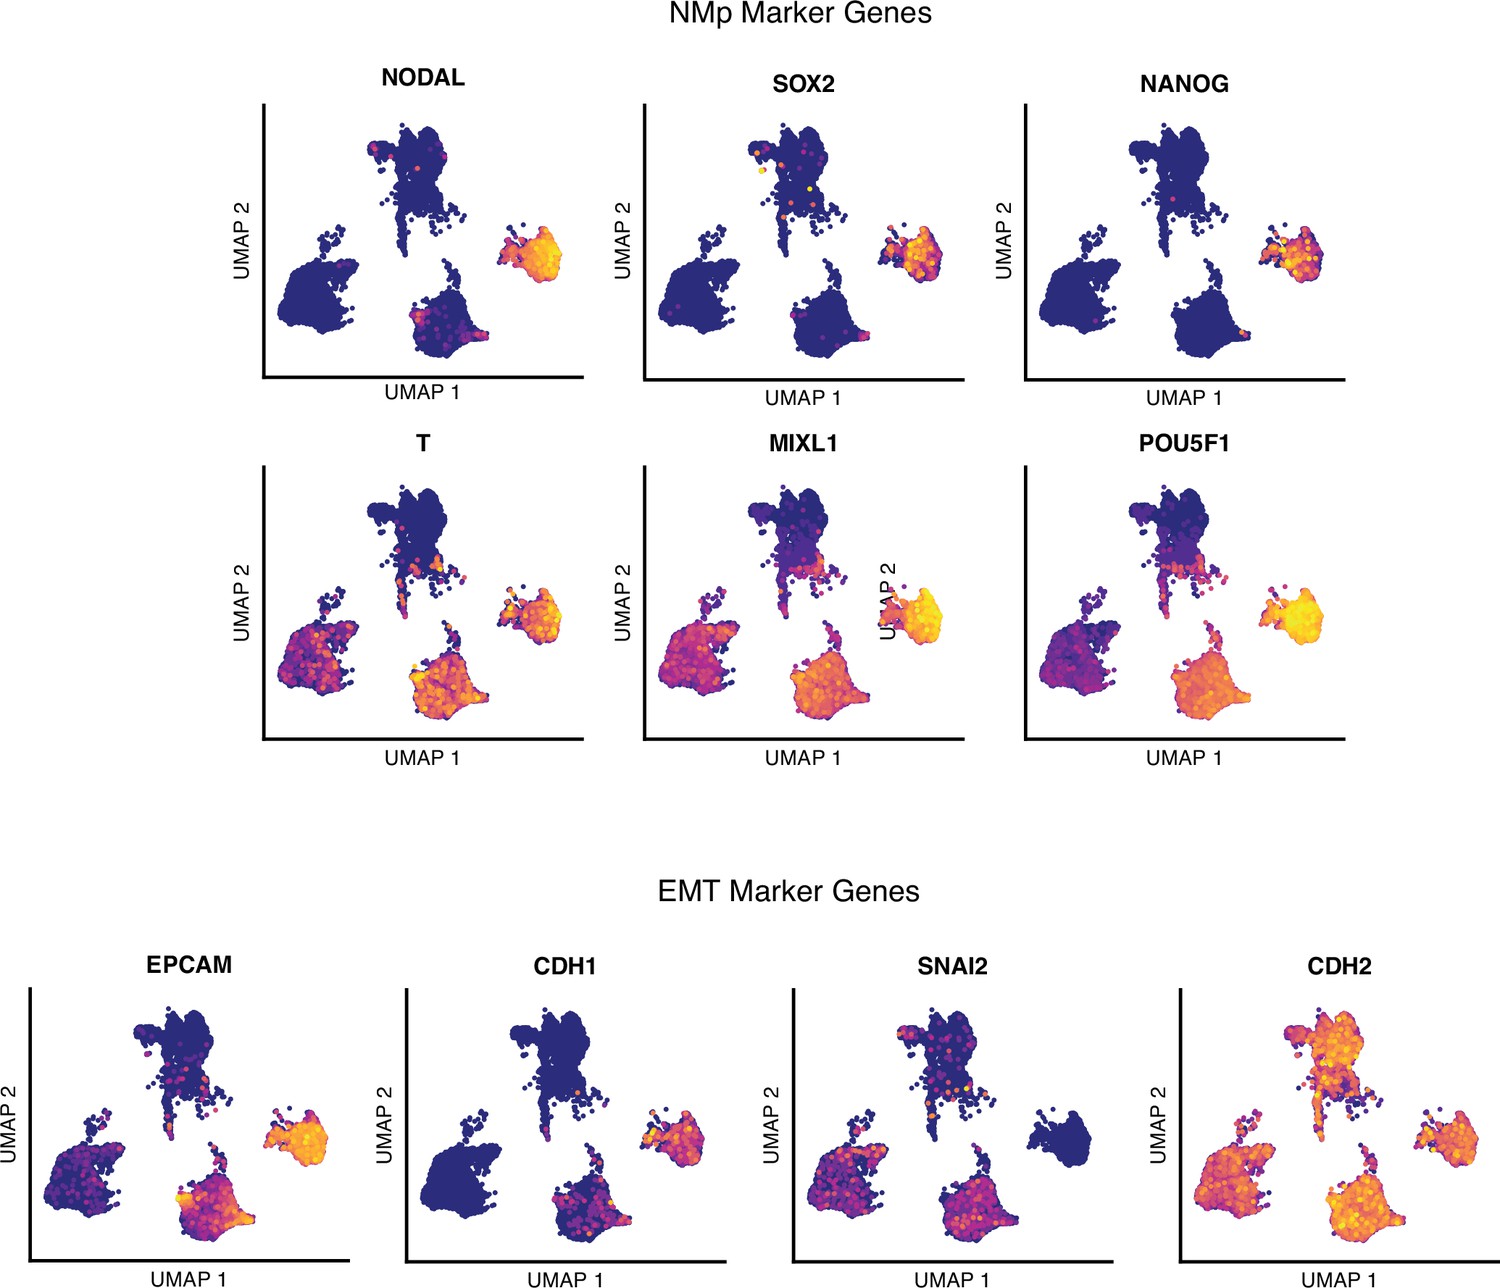
Single-cell RNA-sequencing analysis of differentiating human paraxial mesoderm (PM) organoids, neuromesodermal progenitor (NMp) marker genes.
Uniform Manifold Approximation and Projection (UMAP) plots of single-cell transcriptomes of differentiating human PM organoids overlaid with normalized transcript counts of selected marker genes. EMT, epithelial-to-mesenchymal transition.
Figure 4—figure supplement 2
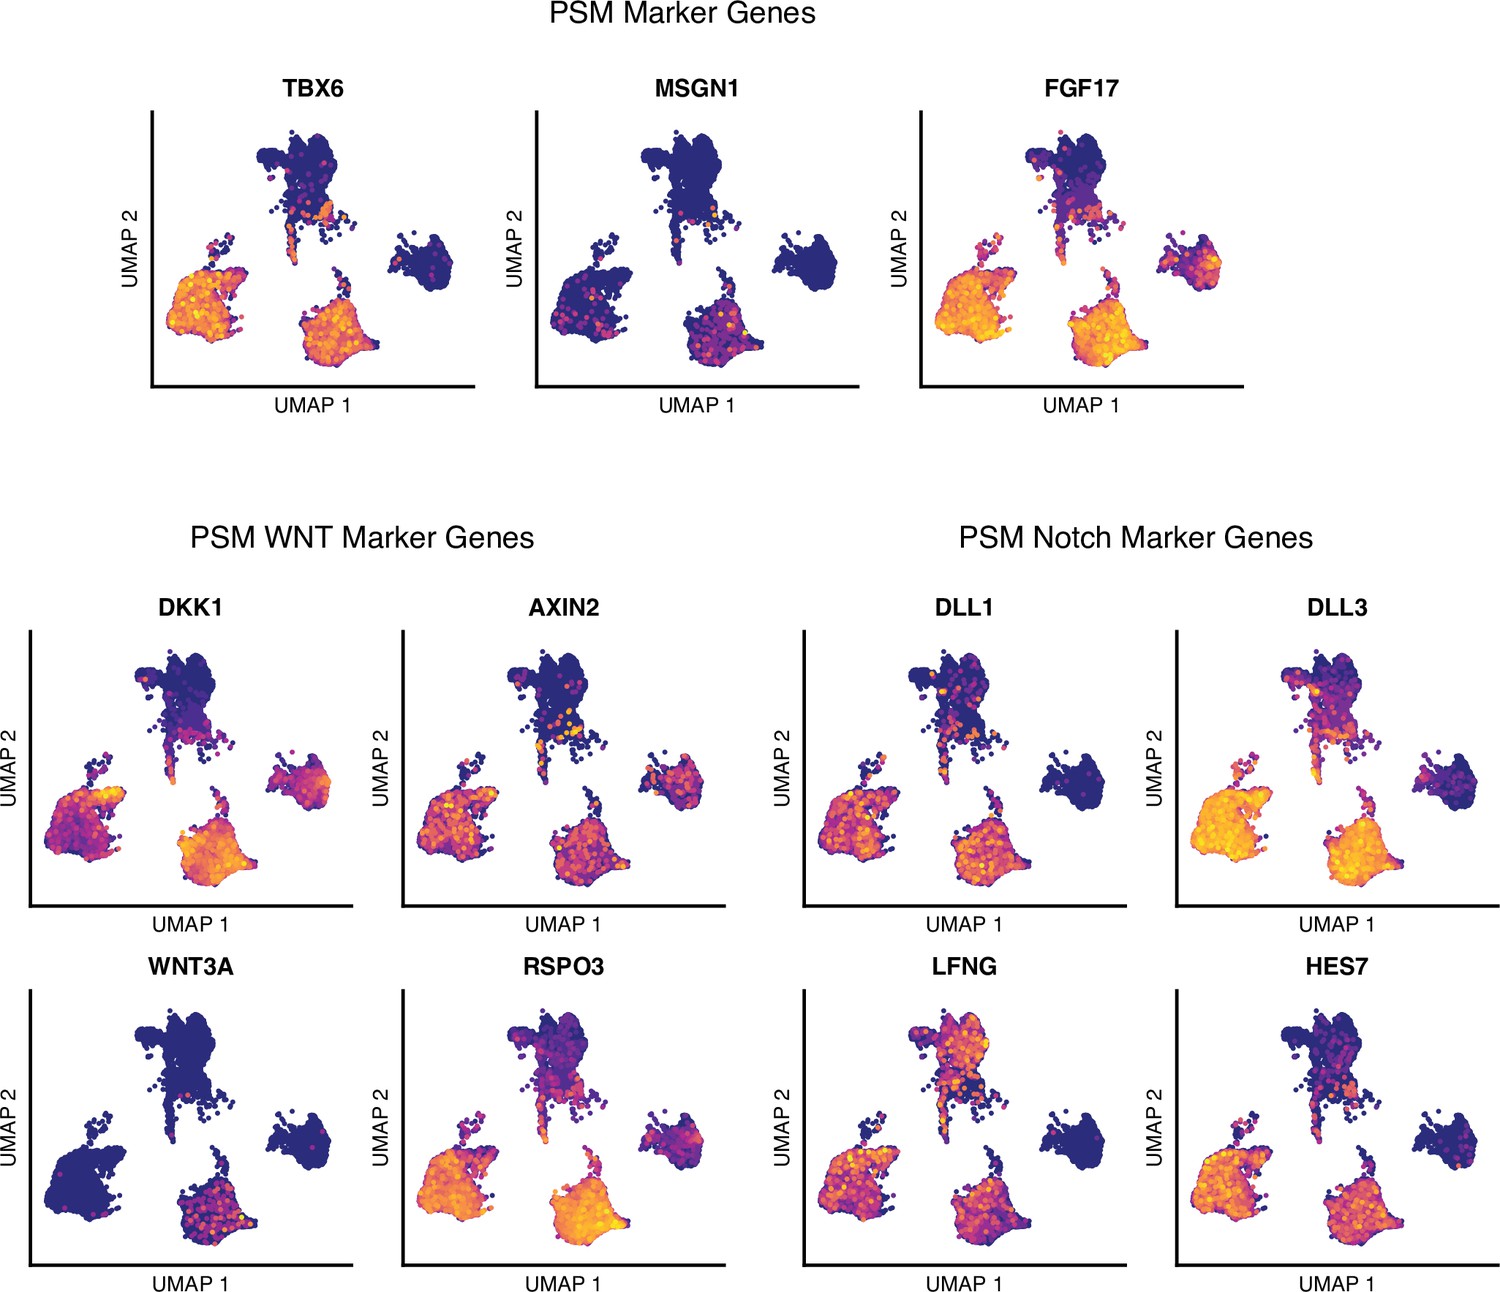
Single-cell RNA-sequencing analysis of differentiating human paraxial mesoderm (PM) organoids, presomitic mesoderm (PSM) marker genes.
Uniform Manifold Approximation and Projection (UMAP) plots of single-cell transcriptomes of differentiating human PM organoids overlaid with normalized transcript counts of selected marker genes.
Figure 4—figure supplement 3
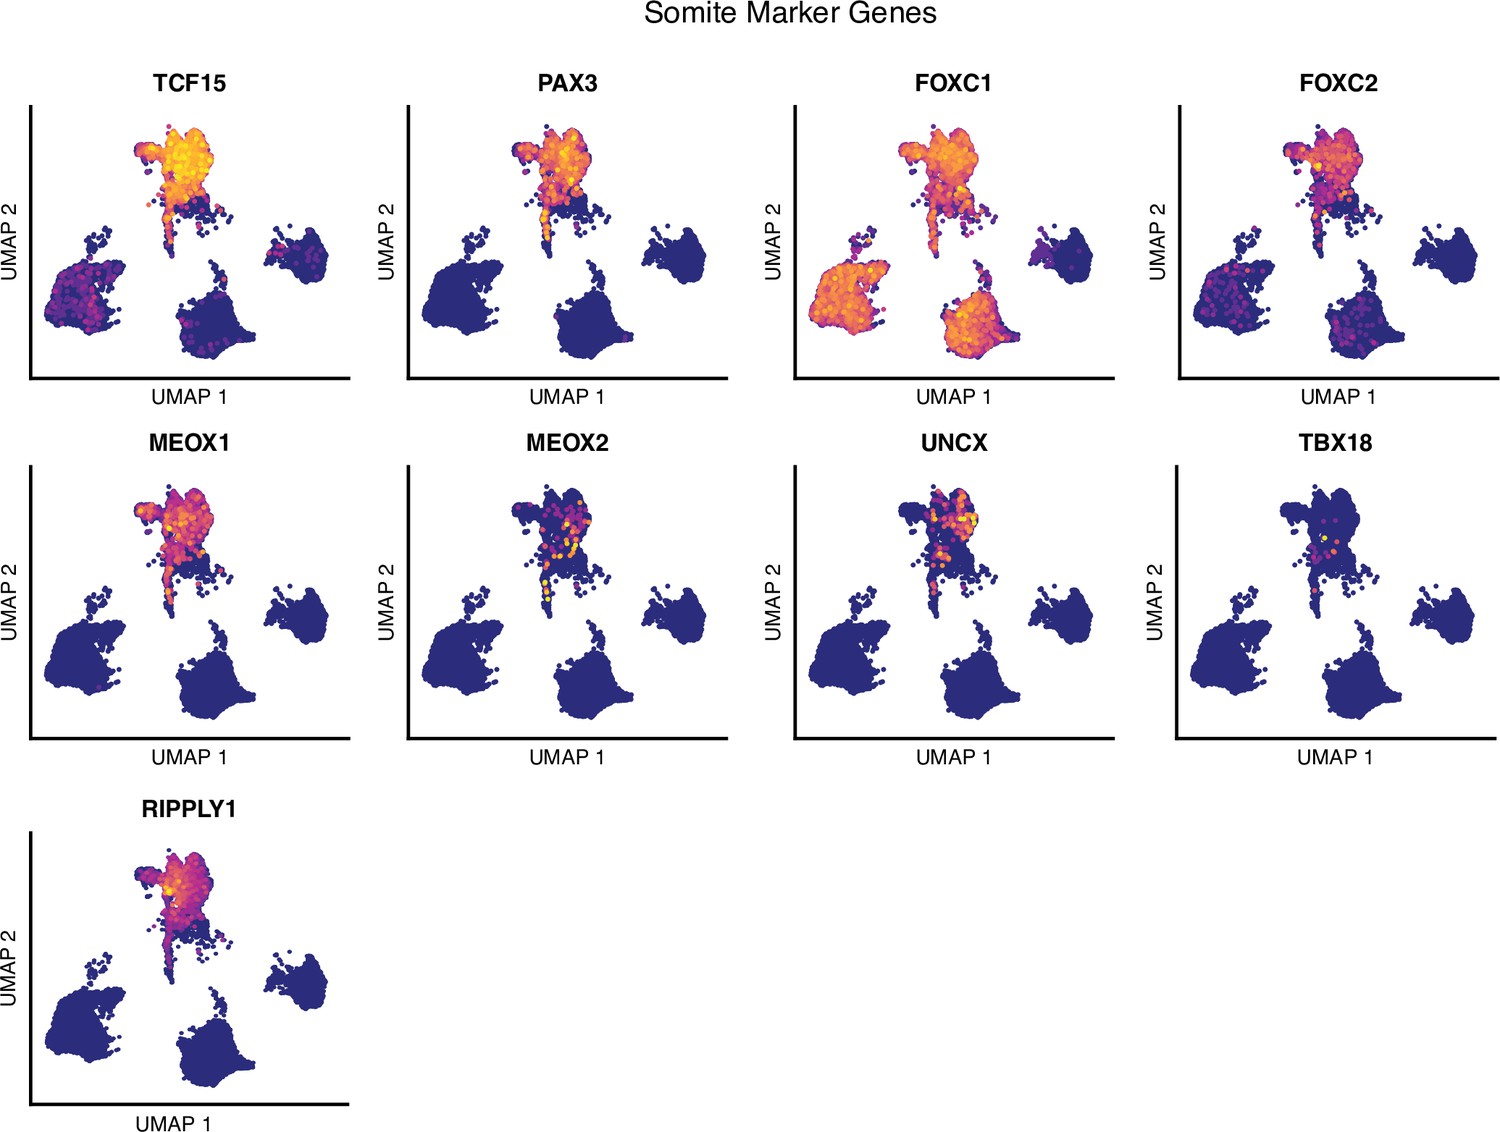
Single-cell RNA-sequencing analysis of differentiating human paraxial mesoderm (PM) organoids, somite marker genes.
Uniform Manifold Approximation and Projection (UMAP) plots of single-cell transcriptomes of differentiating human PM organoids overlaid with normalized transcript counts of selected marker genes.
Figure 4—figure supplement 4
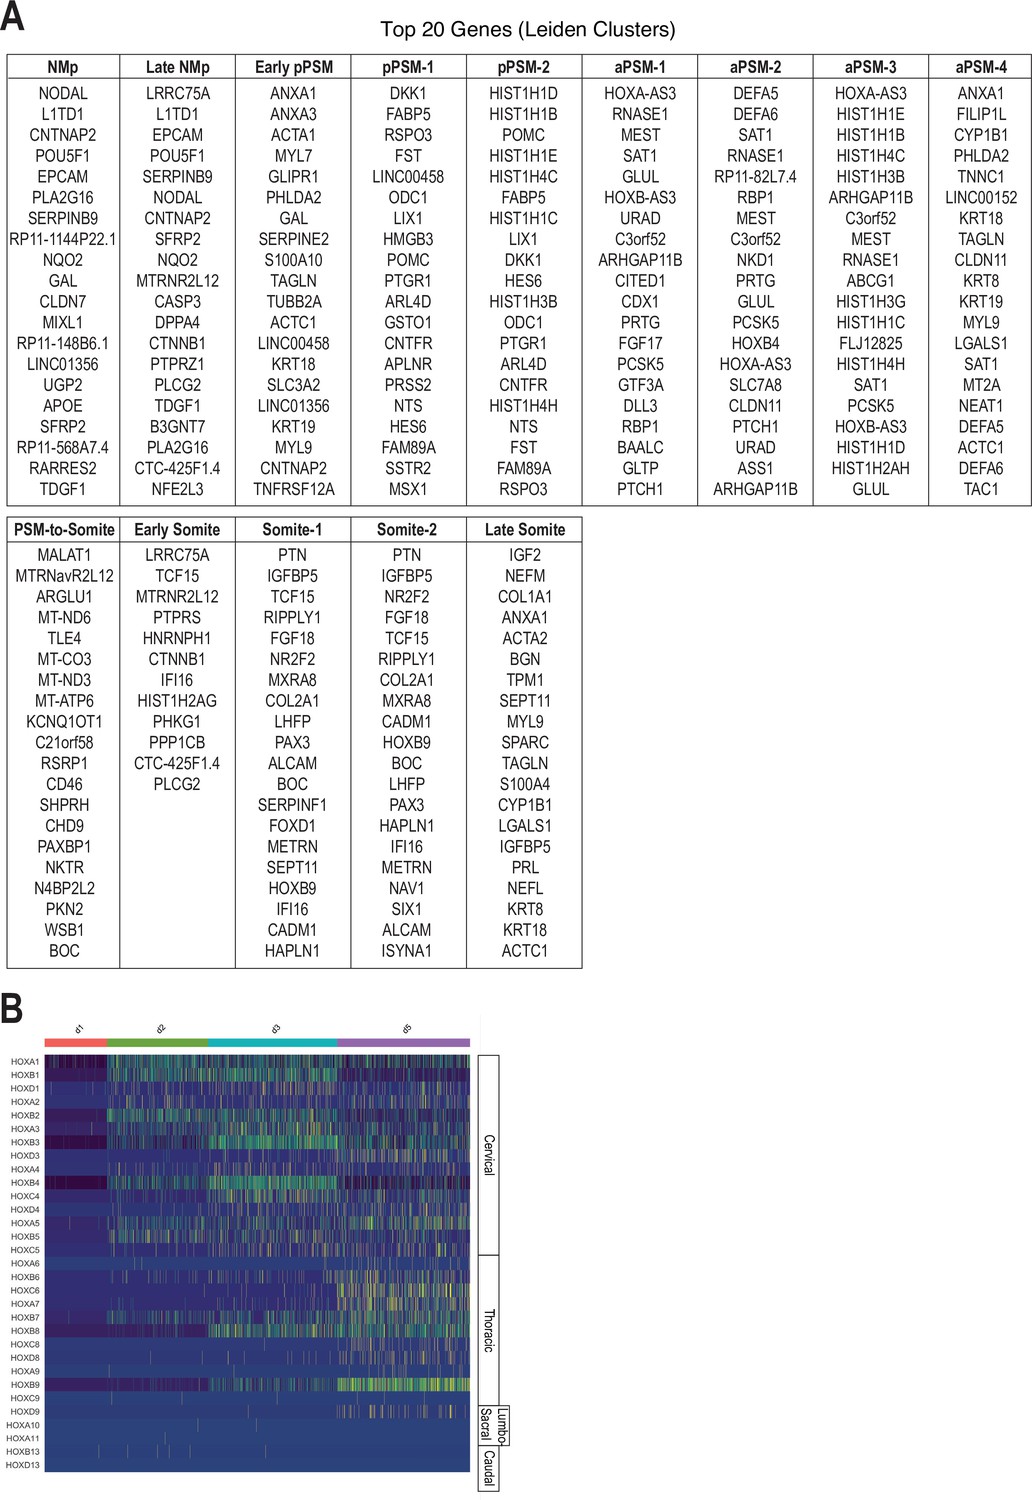
Single-cell RNA-sequencing analysis of differentiating human paraxial mesoderm (PM) organoids, cluster-based marker gene identification, and HOX gene analysis.
(A) Top 20 positively enriched genes for identified Leiden clusters relative to all other clusters. Genes were identified by a two-sided Wilcoxon rank-sum test and are ranked by adjusted p-values based on Bonferroni correction. See Supplementary file 1, Table S1 for a complete list of identified marker genes for each cluster, adjusted p-values, and fold-change values. (B) Heatmap of single-cell HOX gene expression levels. Cells are grouped by collection timepoint. Hox genes are ordered by position, with anatomical positions of HOX paralogues indicated on the right.
Figure 4—figure supplement 5
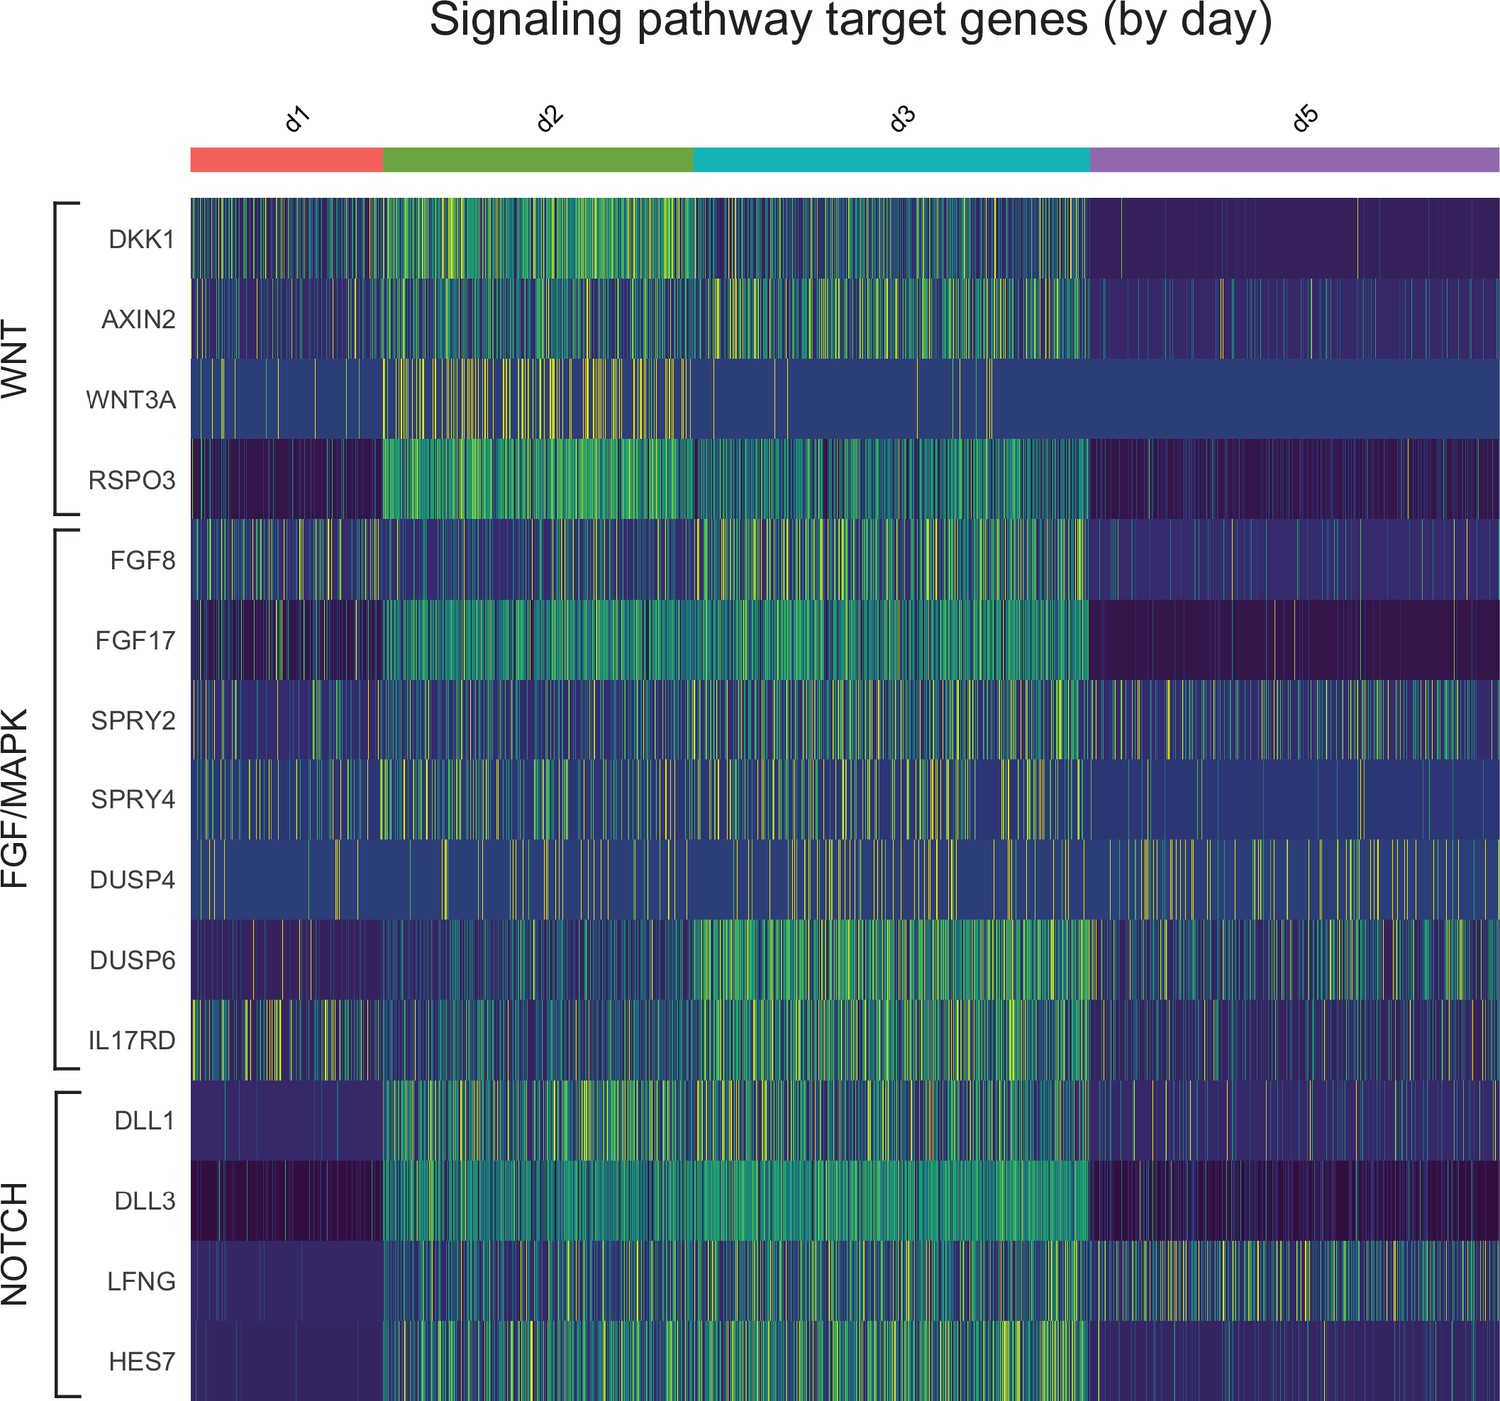
Single-cell RNA-sequencing analysis of differentiating Somitoids reveals downregulation of WNT, FGF, and NOTCH target genes in day 5 somite-like cells.
Heatmap of single-cell signaling target gene expression levels. Cells are grouped by collection timepoint. Genes are grouped based on their signaling pathway, indicated on the left. Day 5 somitic cells autonomously downregulate many WNT, FGF, and NOTCH signaling target genes.
Figure 5 with 1 supplement
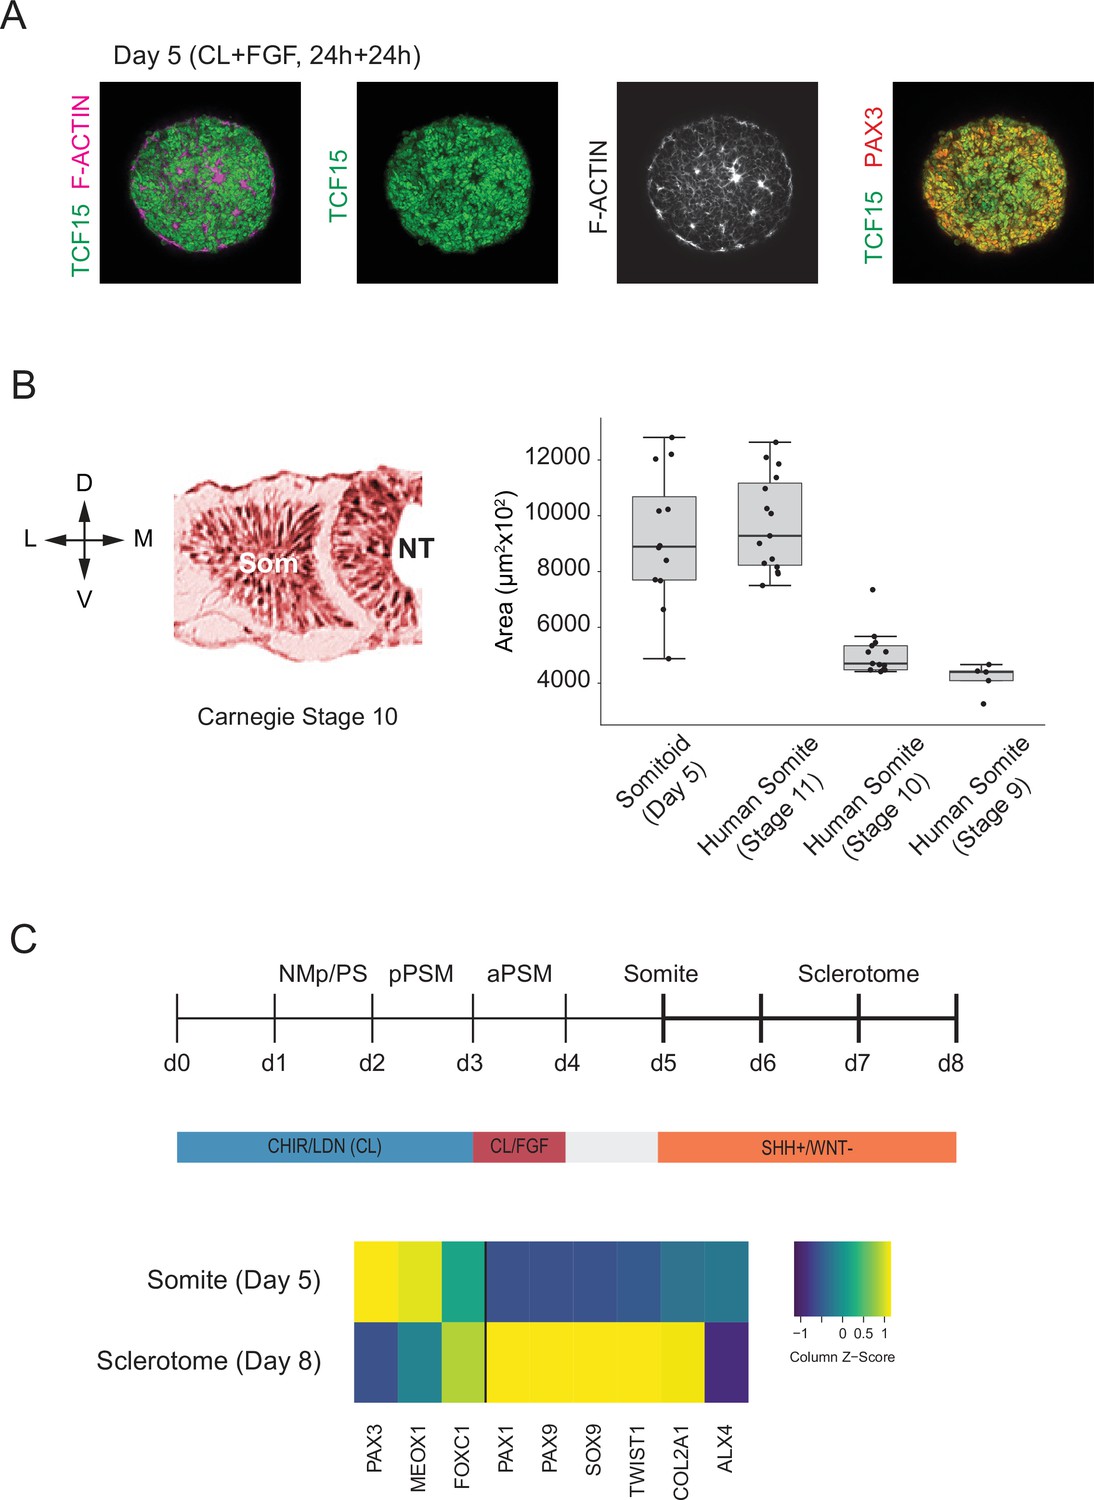
Somitoids express known somite-stage-specific marker genes and can differentiate to sclerotome fate.
(A) Whole-mount Immunofluorescence analysis of day 5 Somitoids reveals co-expression of somite markers TCF15/PARAXIS and PAX3 and polarized rosette-like structures as indicated by F-ACTIN localization, suggesting that somite-like structures resemble in vivo counterparts in both a molecular and morphological manner. Representative images are shown as maximum intensity z-projections from three organoid replicates. NCRM1 human induced pluripotent stem cells (hiPSCs) were used to generate Somitoids. (B) Quantification of somite-like structure sizes in day 5 human Somitoids and human embryos (Carnegie stages 9–11) reveals that the median and interquartile range of in vitro somite-like structure sizes (calculated as area) is comparable to Carnegie stage 11 human somites in vivo (see Materials and methods). Boxes indicate interquartile range (25th percentile to 75th percentile). End of whiskers indicates minimum and maximum. Points indicate individual somite-like structures. Central lines represent the median. Carnegie embryo data were obtained from the Virtual Human Embryo Project (https://www.ehd.org/virtual-human-embryo). NCRM1 hiPSCs were used to generate Somitoids. Source data is available in Figure 5—source data 1. (C) Sclerotome differentiation of Somitoids. Day 5 Somitoids were exposed to SHH agonist and WNT inhibitors to induce sclerotome differentiation as indicated. qPCR analysis of somite and sclerotome markers reveals induction of sclerotome markers on day 8. Relative gene expression levels are shown as Z-scores, expressed as fold-change relative to undifferentiated iPSCs (see Materials and methods). NCRM1 hiPSCs were used to generate Somitoids. Source data is available in Figure 5—source data 2.
-
Figure 5—source data 1
Comparative somite size quantification of in vitro somite-like structures and human somites from the Carnegie collection.
- https://cdn.elifesciences.org/articles/68925/elife-68925-fig5-data1-v2.csv
-
Figure 5—source data 2
qPCR raw data of sclerotome differentiation.
- https://cdn.elifesciences.org/articles/68925/elife-68925-fig5-data2-v2.txt
Figure 5—figure supplement 1
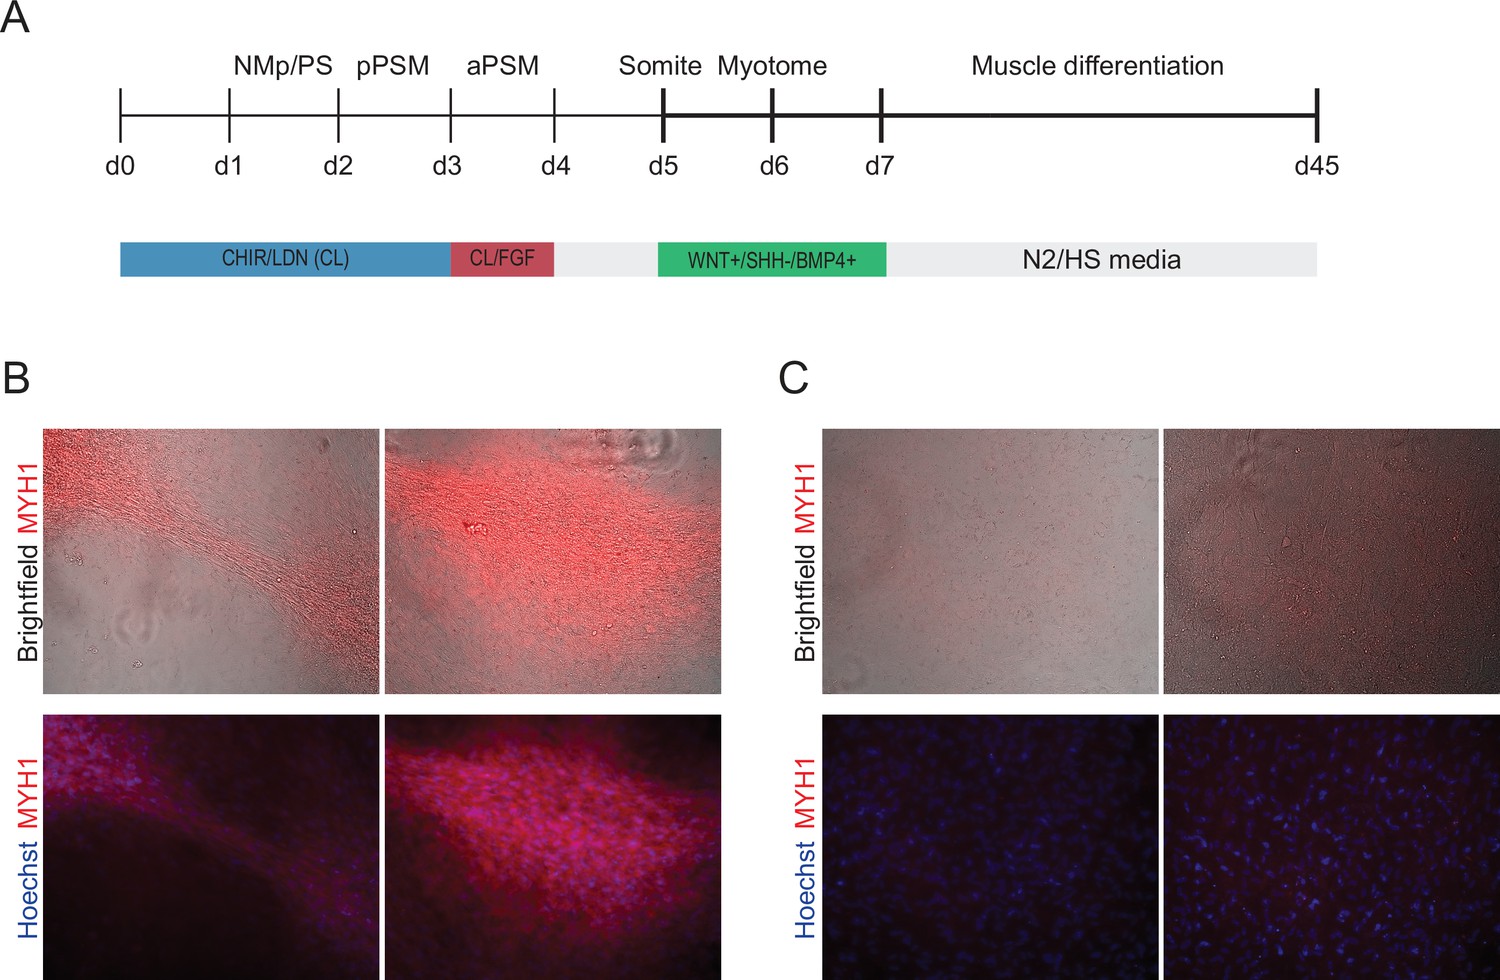
Differentiation of Somitoid-derived cells towards skeletal muscle.
(A) Day 5 somite-stage organoids were further differentiated towards skeletal muscle. Organoids were first exposed to signaling modulators of WNT, SHH, and BMP4 for 48 hr to differentiate them to dermomyotome. Next, organoids were dissociated and further differentiated as monolayer cultures on Matrigel in muscle differentiation medium. Day 5 control organoids were cultured for an additional 48 hr in basal media (days 5–7) and not pulse-treated with WNT+/SHH-/BMP4+ prior to dissociation. Day 45 cells were stained for myosin heavy chain (MYH1), which is expressed in myocytes, myotubes, and skeletal myofibers. (B) Day 45 cells derived from Somitoids were fixed and stained for myosin heavy chain (MYH1) and Hoechst (nuclear stain). Somite-stage organoids (day 5) were treated with WNT+/SHH-/BMP4+ signaling modulators for 48 hr from day 5 to day 7. (C) Same as in (B) but with control cells that were not pulse-treated with WNT+/SHH-/BMP4+ signaling modulators but instead cultured in basal media from day 5 to day 7.
Author response image 1
Tables
Key resources table
| Reagent type (species) or resource | Designation | Source or reference | Identifiers | Additional information |
|---|---|---|---|---|
| Cell line (Homo sapiens) | NCRM1 | RUCDR Infinite Biologics | RRID:CVCL_1E71 | hiPSC line |
| Cell line (H. sapiens) | ACTB-GFP | Allen Institute | AICS-0016-184; RRID:CVCL_JM16 | hiPSC line |
| Cell line (H. sapiens) | WTC-11 | Coriell Institute | GM25256; RRID:CVCL_Y803 | hiPSC line |
| Antibody | Anti-CDH2/N-CADHERIN (rabbit polyclonal) | Abcam | ab18203 | (1:400) |
| Antibody | Anti-PAX3 (mouse monoclonal) | DSHB | Pax3-c | (1:250) |
| Antibody | Anti-SOX2 (goat polyclonal) | R&D Systems | AF2018 | (1:200) |
| Antibody | Anti-T/BRACHYURY (rabbit monoclonal) | Abcam | ab209665 | (1:200) |
| Antibody | Anti-TBX6 (rabbit polyclonal) | Abcam | ab38883 | (1:300) |
| Antibody | Anti-TCF15 (rabbit polyclonal) | Abcam | ab204045 | (1:50) |
| Antibody | Anti-MYH1 (mouse monoclonal) | DSHB | MF20-c | (1:300) |
| Sequence-based reagent | RT-qPCR primers | Supplementary file 2 | ||
| Chemical compound, drug | CHIR99021 | Sigma | SML1046 | |
| Chemical compound, drug | LDN193189 | Stemgent | 04-0074 | |
| Chemical compound, drug | Y-27362 dihydrochloride | Tocris | 1254 |
Additional files
-
Supplementary file 1
Supplemental Table 1: cluster-based marker genes of single-cell RNA-sequencing (scRNA-seq) dataset.
- https://cdn.elifesciences.org/articles/68925/elife-68925-supp1-v2.csv
-
Supplementary file 2
Supplemental Table 2: RT-qPCR primer sequences.
- https://cdn.elifesciences.org/articles/68925/elife-68925-supp2-v2.csv
-
Transparent reporting form
- https://cdn.elifesciences.org/articles/68925/elife-68925-transrepform1-v2.docx
Download links
A two-part list of links to download the article, or parts of the article, in various formats.
Downloads (link to download the article as PDF)
Open citations (links to open the citations from this article in various online reference manager services)
Cite this article (links to download the citations from this article in formats compatible with various reference manager tools)
Paraxial mesoderm organoids model development of human somites
eLife 11:e68925.
https://doi.org/10.7554/eLife.68925


