Protein allocation and utilization in the versatile chemolithoautotroph Cupriavidus necator
- School of Engineering Sciences in Chemistry, Biotechnology and Health, Science for Life Laboratory, KTH – Royal Institute of Technology, Sweden
Figures
Figure 1 with 3 supplements

C. necator expresses most of its annotated genes.
(A) Four different limitations were chosen covering different entry points to central metabolism. Cells were cultivated in chemostat bioreactors and dilution rate (equals growth rate) was stepwise increased from 0.05 to 0.25 hr–1. The proteome was analyzed by LC-MS/MS. Enzyme abundance was used to constrain a resource balance analysis (RBA) model, and enzyme utilization was investigated for the different limitations. (B) Protein mass fraction (%) of all proteins (5357) mapped to their respective genes on chromosome 1, 2, and megaplasmid pHG1 (mean of four substrate limitations, µ = 0.25 hr–1). Density is mean protein mass fraction for a sliding window of five genes. The genes of the cbb operon (arrows) are the most expressed regions on chromosome 2 and pHG1.
Figure 1—figure supplement 1
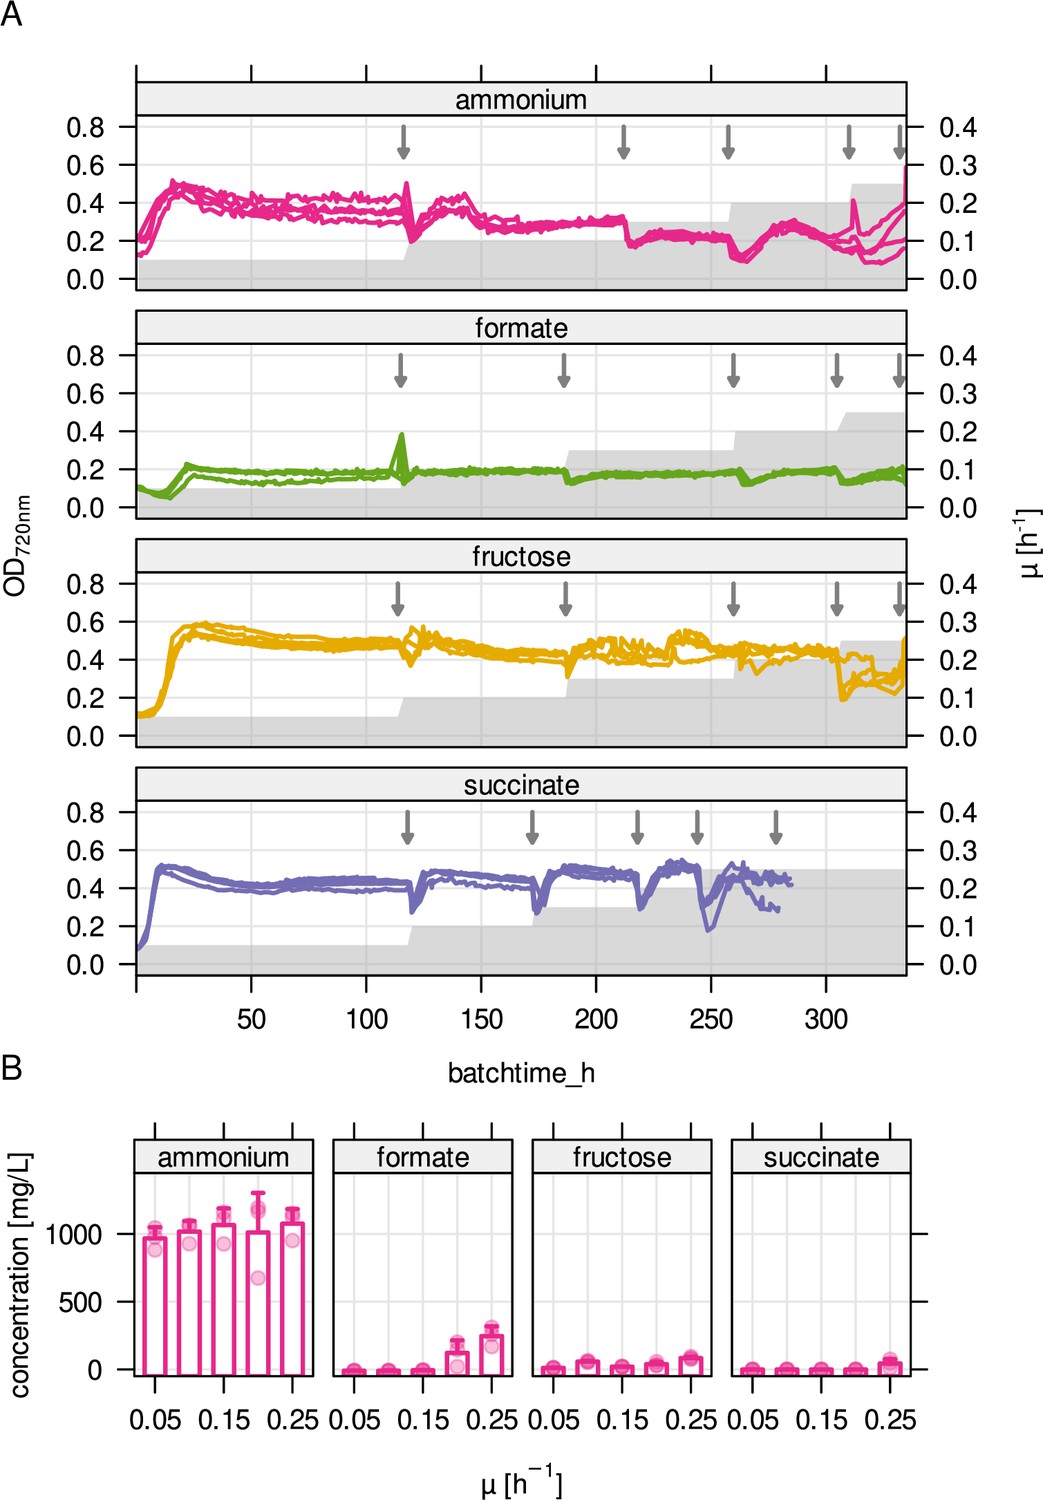
Cultivation parameters for substrate-limited chemostats.
(A) Stepwise increase in growth rate over cultivation time (gray area) and optical density at 720 nm (OD720nm) during chemostat cultivation (four replicates, colored lines). Arrows mark sampling time points. (B) Residual substrate concentration for the four limiting conditions. For ammonium limitation, residual fructose concentration is shown.
Figure 1—figure supplement 2
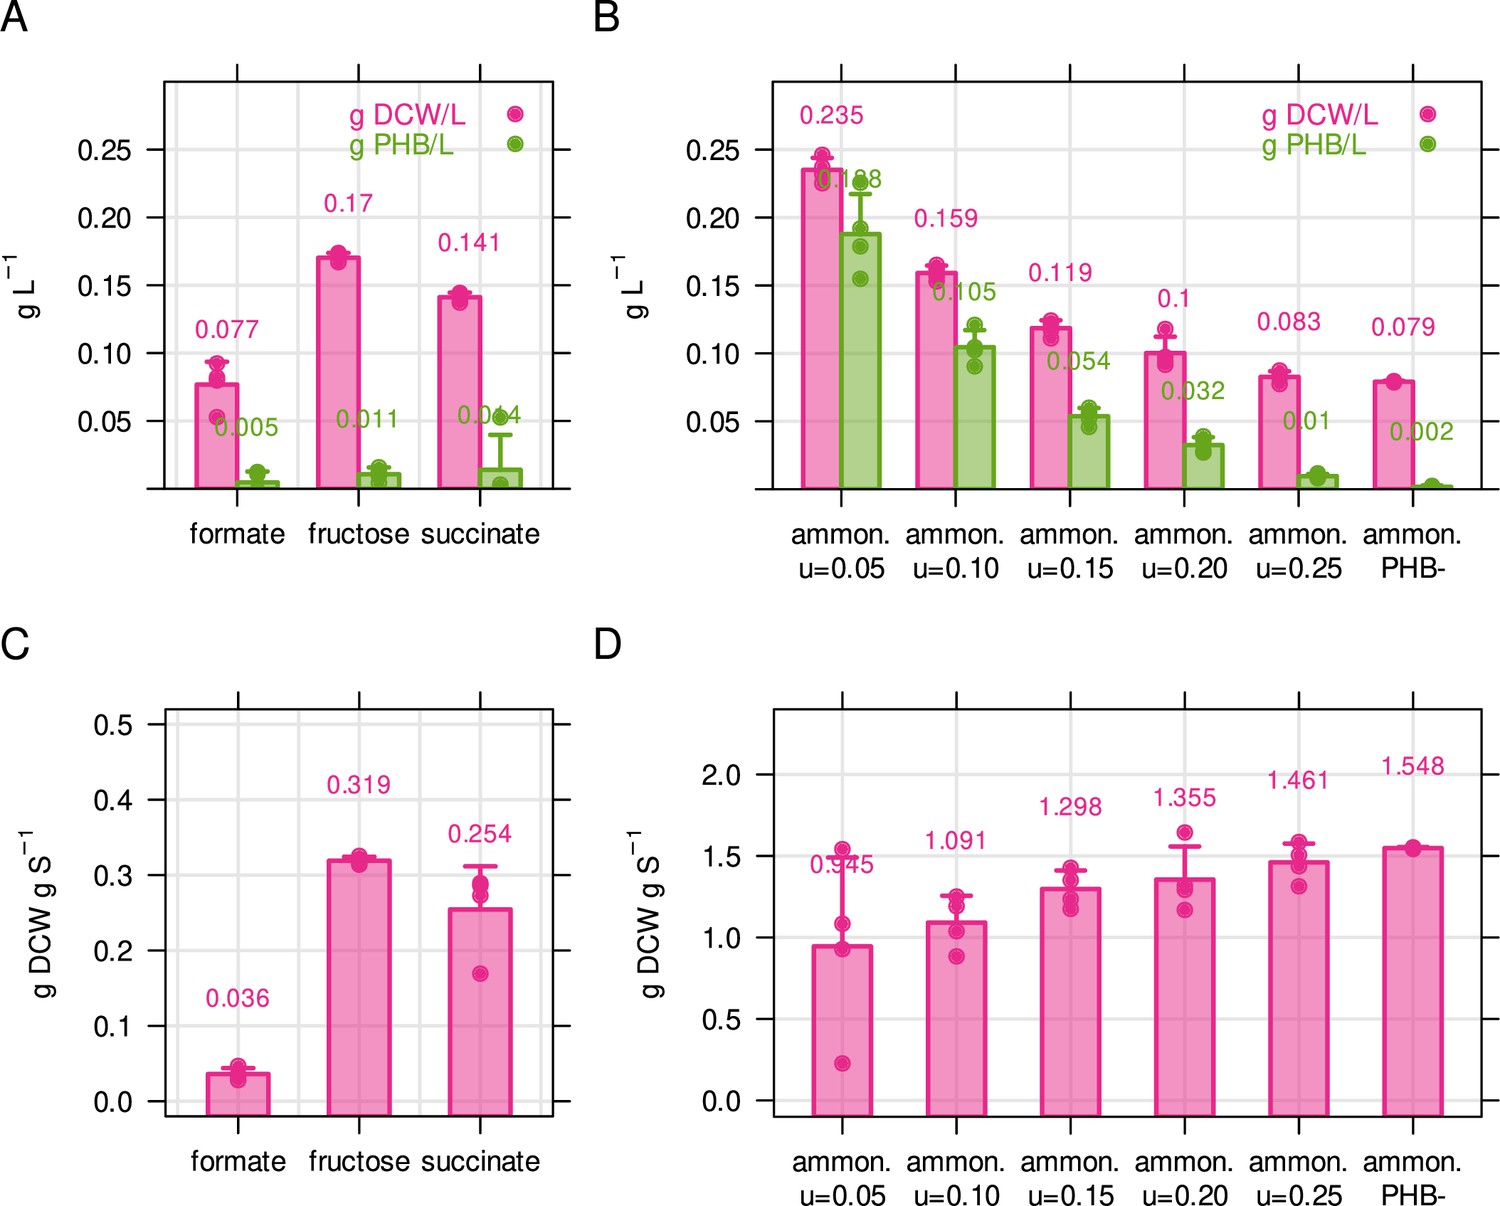
Biomass and PHB content of C. necator for different limiting conditions.
(A) Biomass concentration and PHB content for C. necator in g L–1. Cultivations were performed in 50 mL shake flasks with 2 g L–1 formate, 0.5 g L–1 fructose or 0.5 g L–1 succinate. Biomass concentration was determined by dry cell weight measurement (DCW), and PHB content was determined by solvent extraction and acid hydrolysis, see Methods. (B) Biomass concentration and PHB content for ammonium limited C. necator (2 g/L fructose, 0.05 g/L NH4Cl). Bacteria were cultivated in chemostat bioreactors with growth rate increasing from 0.05 to 0.25 hr–1. PHB-, PHB knockout strain used as negative control. (C) PHB-free biomass yield for three different carbon sources, calculated from (A). (D) PHB-free biomass yield for ammonium calculated from (B). Bars and error bars represent mean and standard deviation of four biological replicates.
Figure 1—figure supplement 3
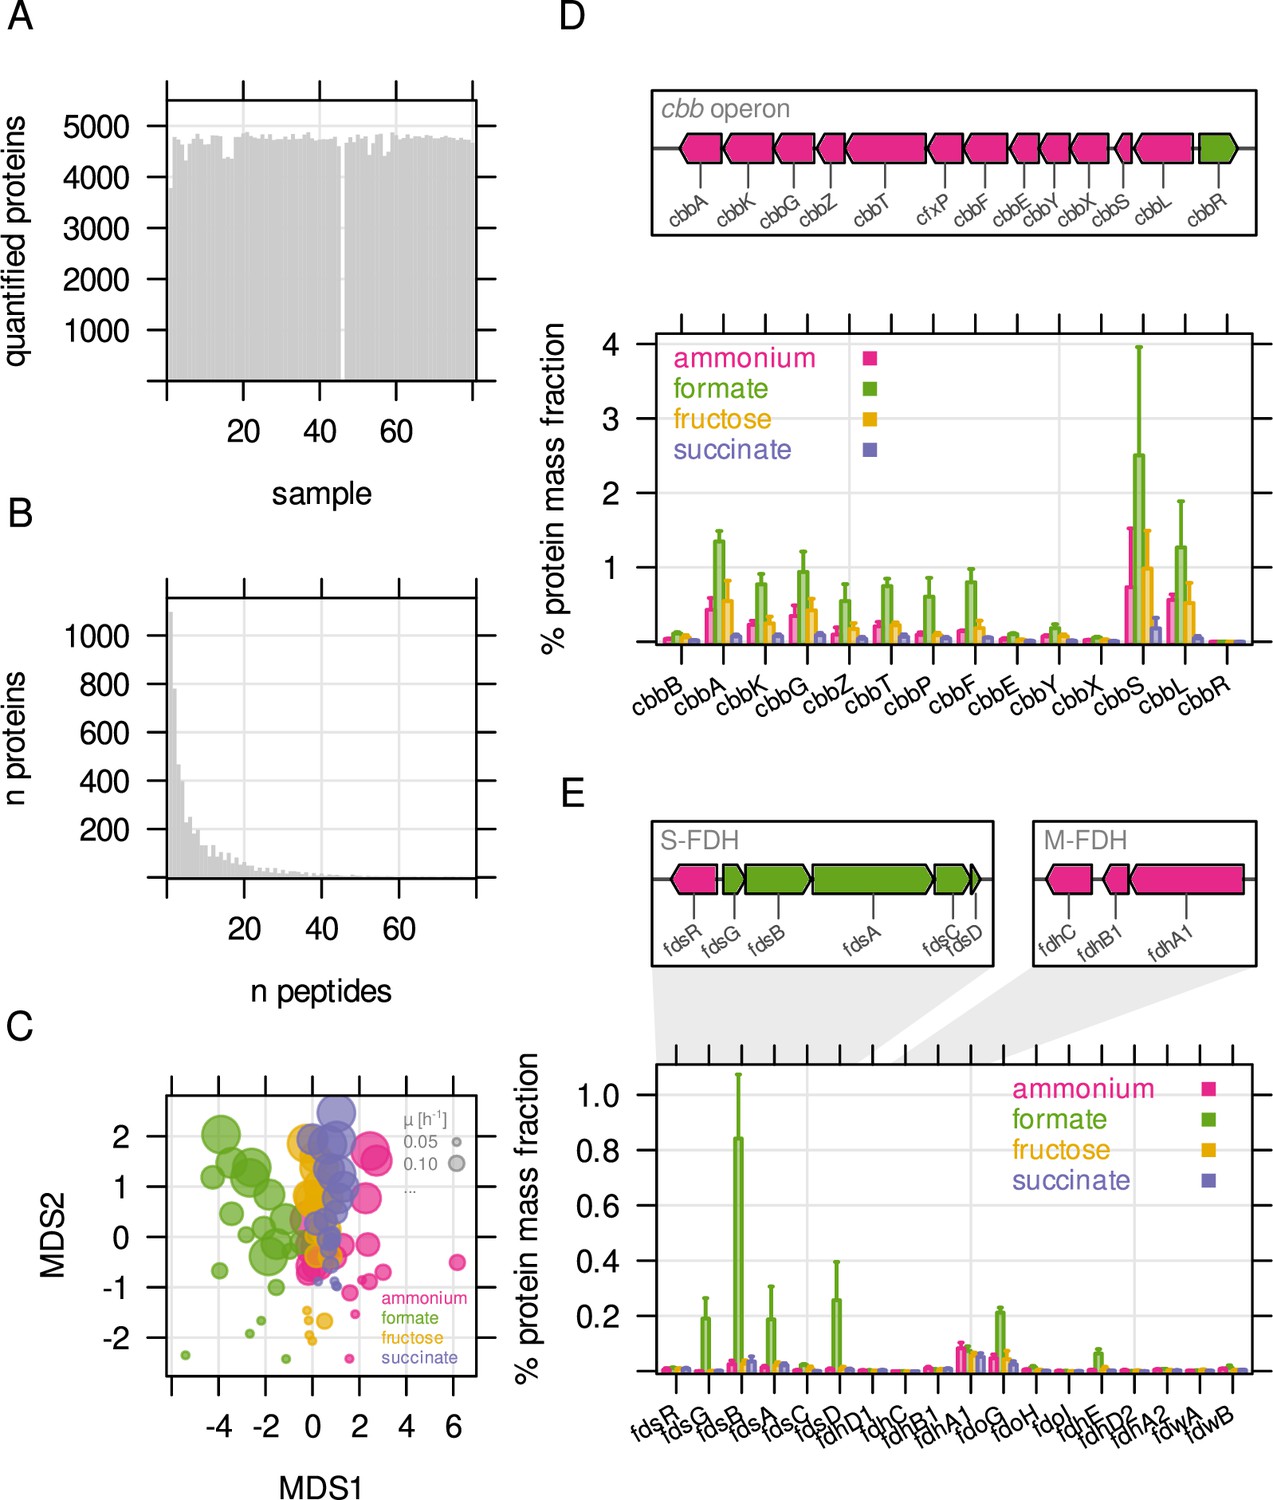
Overview about mass spectrometry based protein quantification.
(A) Number of quantified proteins for all 80 samples analyzed by LC-MS. Quantification for one sample failed. (B) Number of proteins quantified by number of unique peptides. (C) Sample similarity by protein abundance visualized using non-metric multidimensional scaling (NMDS). Each point represents one replicate sample (n = 4). Bubble size - growth rate; bubble color - type of limitation. (D) Genome organisation of the cbb operon (chromosome 2) and mass fraction (%) of cbb proteins. The two cbb copies (chromosomal, pHG1) can not be distinguished by LC-MS. Protein mass fractions were therefore summed up for this representation. (E) Protein mass fraction (%) for formate dehydrogenases. Genome maps indicate the main soluble (S-FDH) and membrane-bound formate dehydrogenase (M-FDH) operons, fds and fdh, respectively.
Figure 2 with 2 supplements
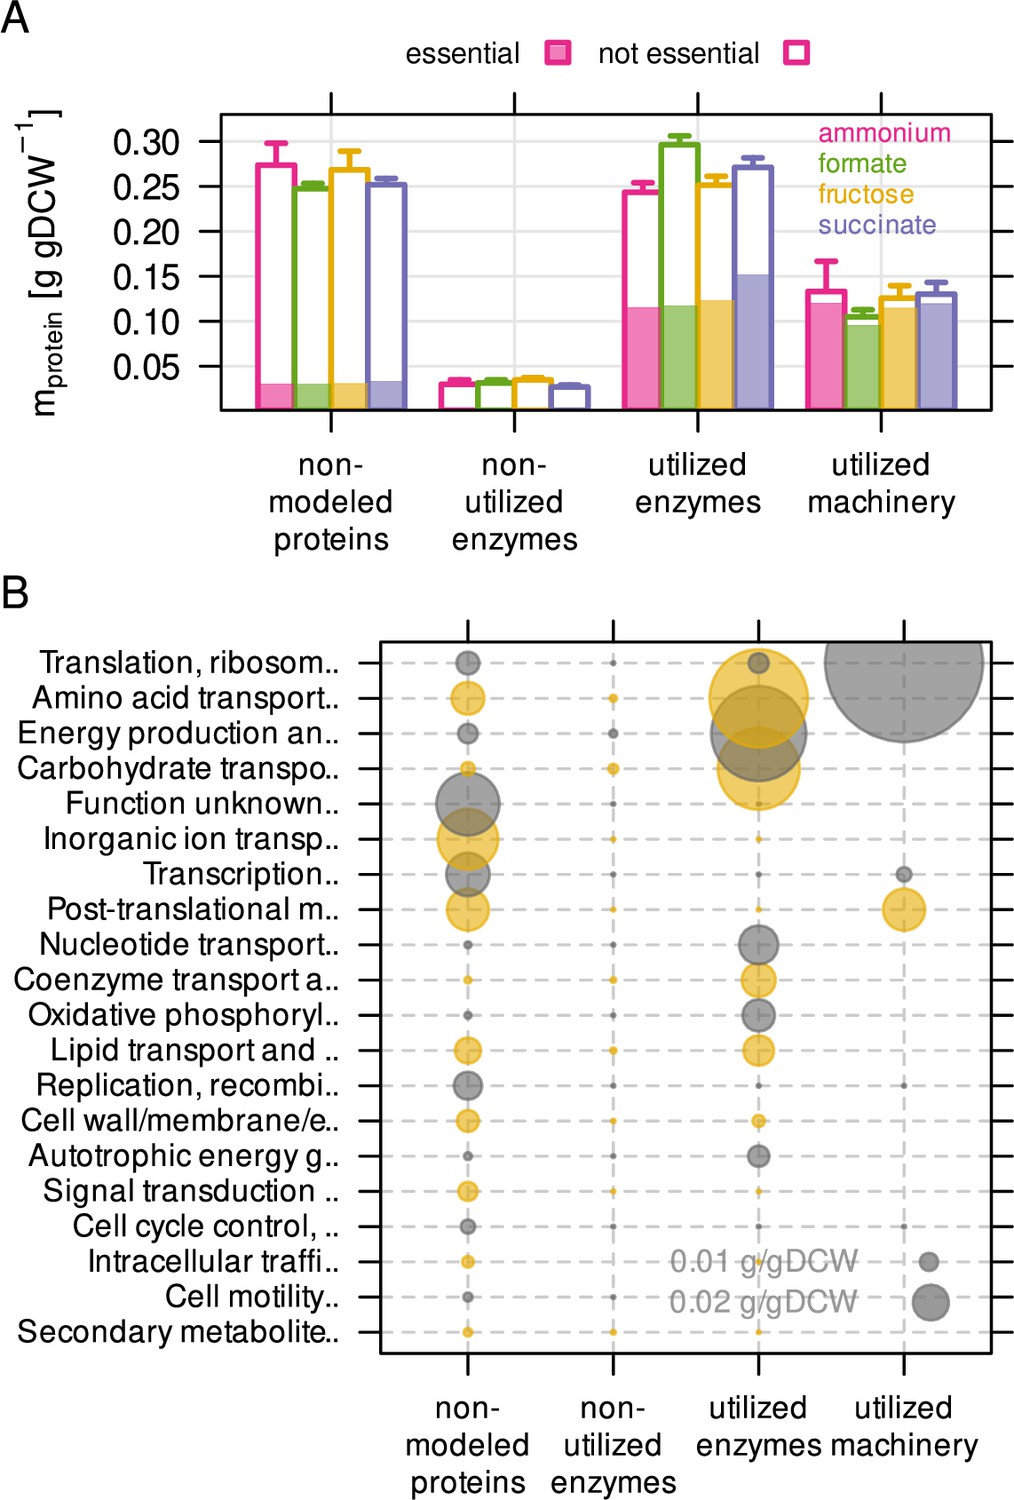
The non-modeled and non-utilized proteome of C. necator is related to environmental readiness.
(A) A series of model simulations was conducted with randomly sampled enzyme efficiency kapp (n = 200) to obtain the maximum number of potentially utilized reactions in each growth condition. The C. necator proteome (5357 proteins) was allocated to each of four utilization categories and protein mass summed up per category. Protein mass encoded by essential genes is indicated as shaded area in bars. Bars represent mean of four biological replicates, whiskers represent standard deviation. (B) Average protein mass by utilization category and functional group. Alternating color (gray and yellow) for bubbles are used in alternating rows.
Figure 2—figure supplement 1
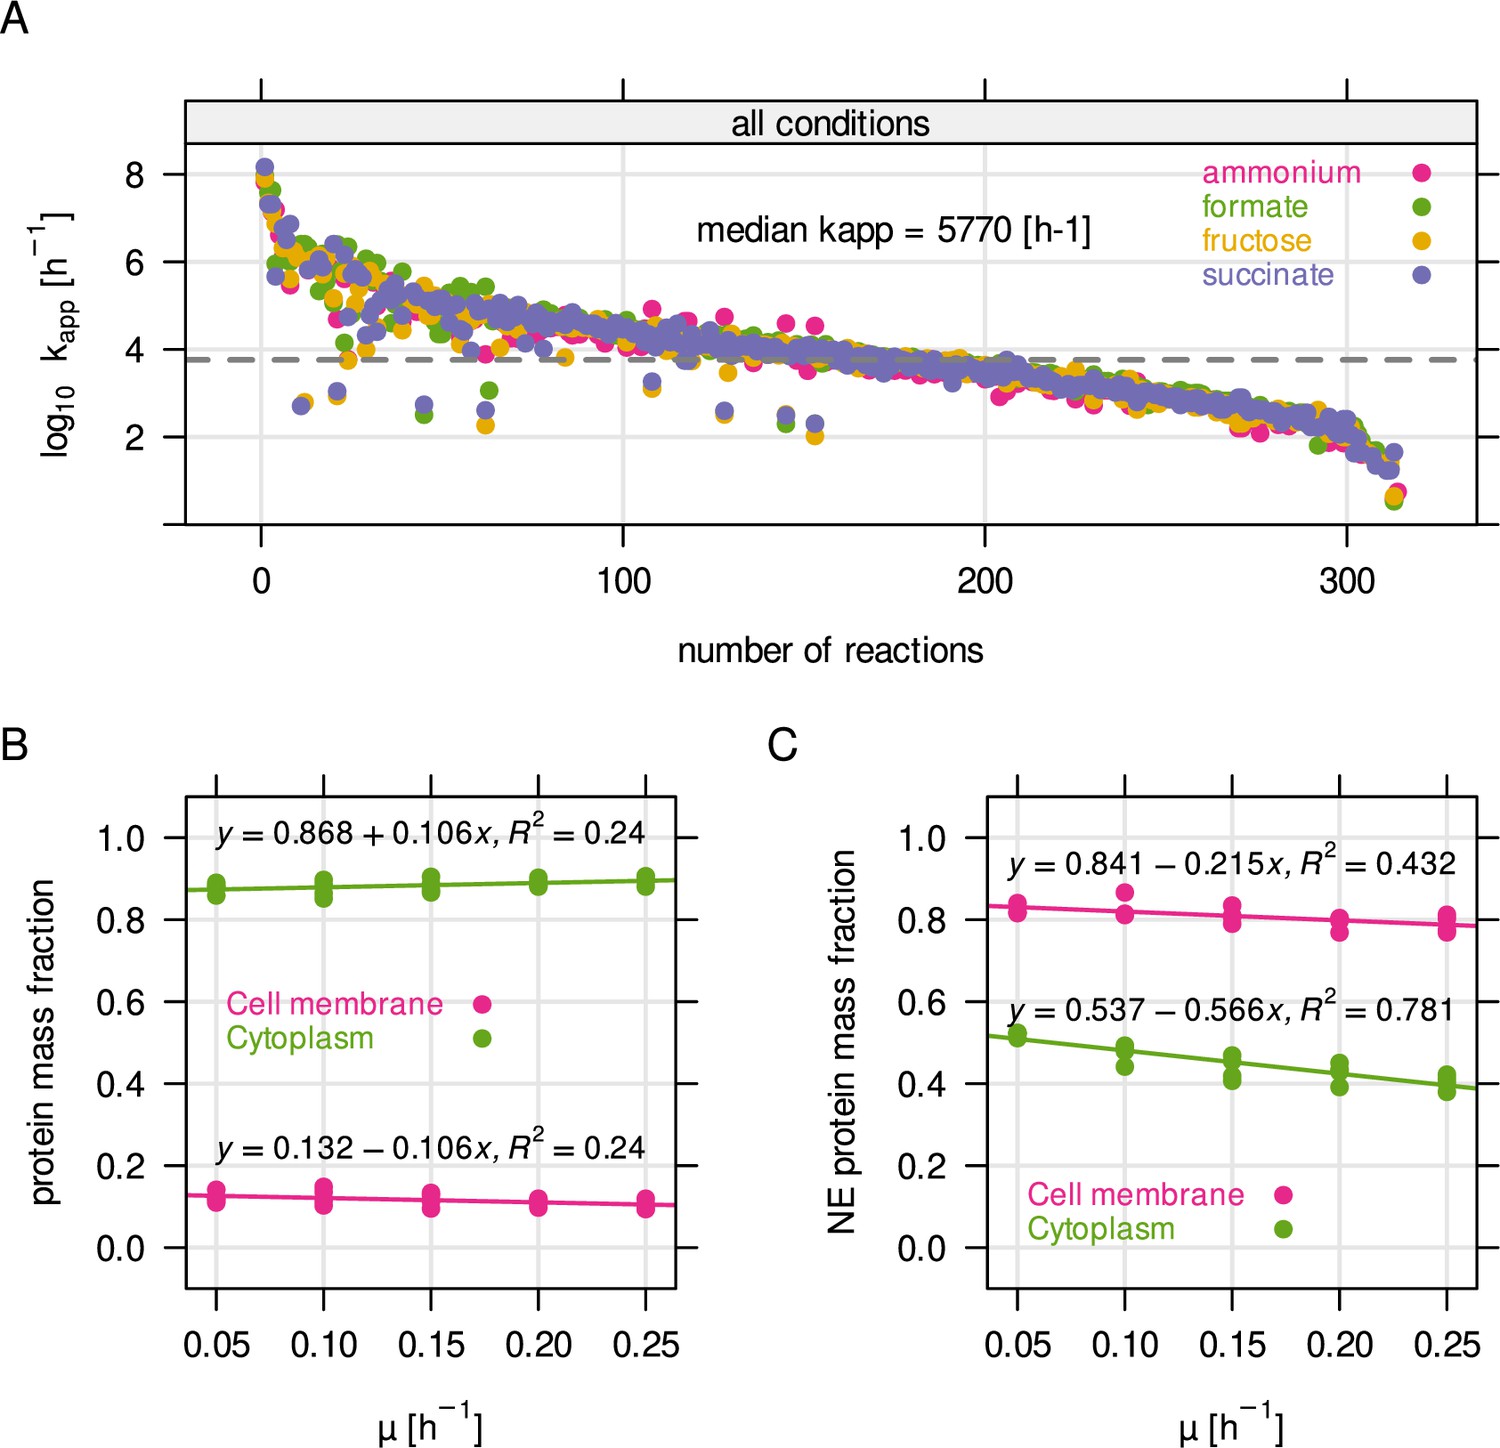
Parameter estimation for RBA model.
(A) Distribution of kapp, the enzyme efficiency, obtained from parameter estimation using RBApy (Bulović et al., 2019). Briefly, kapp was determined by dividing the expected flux of a reaction in mmol gDCW–1 hr–1 by the steady state enzyme abundance in g gDCW–1 associated with the reaction. (B) Protein mass fraction allocated to the cytoplasmic membrane and to the cytoplasm. (C) Non-enzyme (NE) protein mass fraction, per compartment.
Figure 2—figure supplement 2
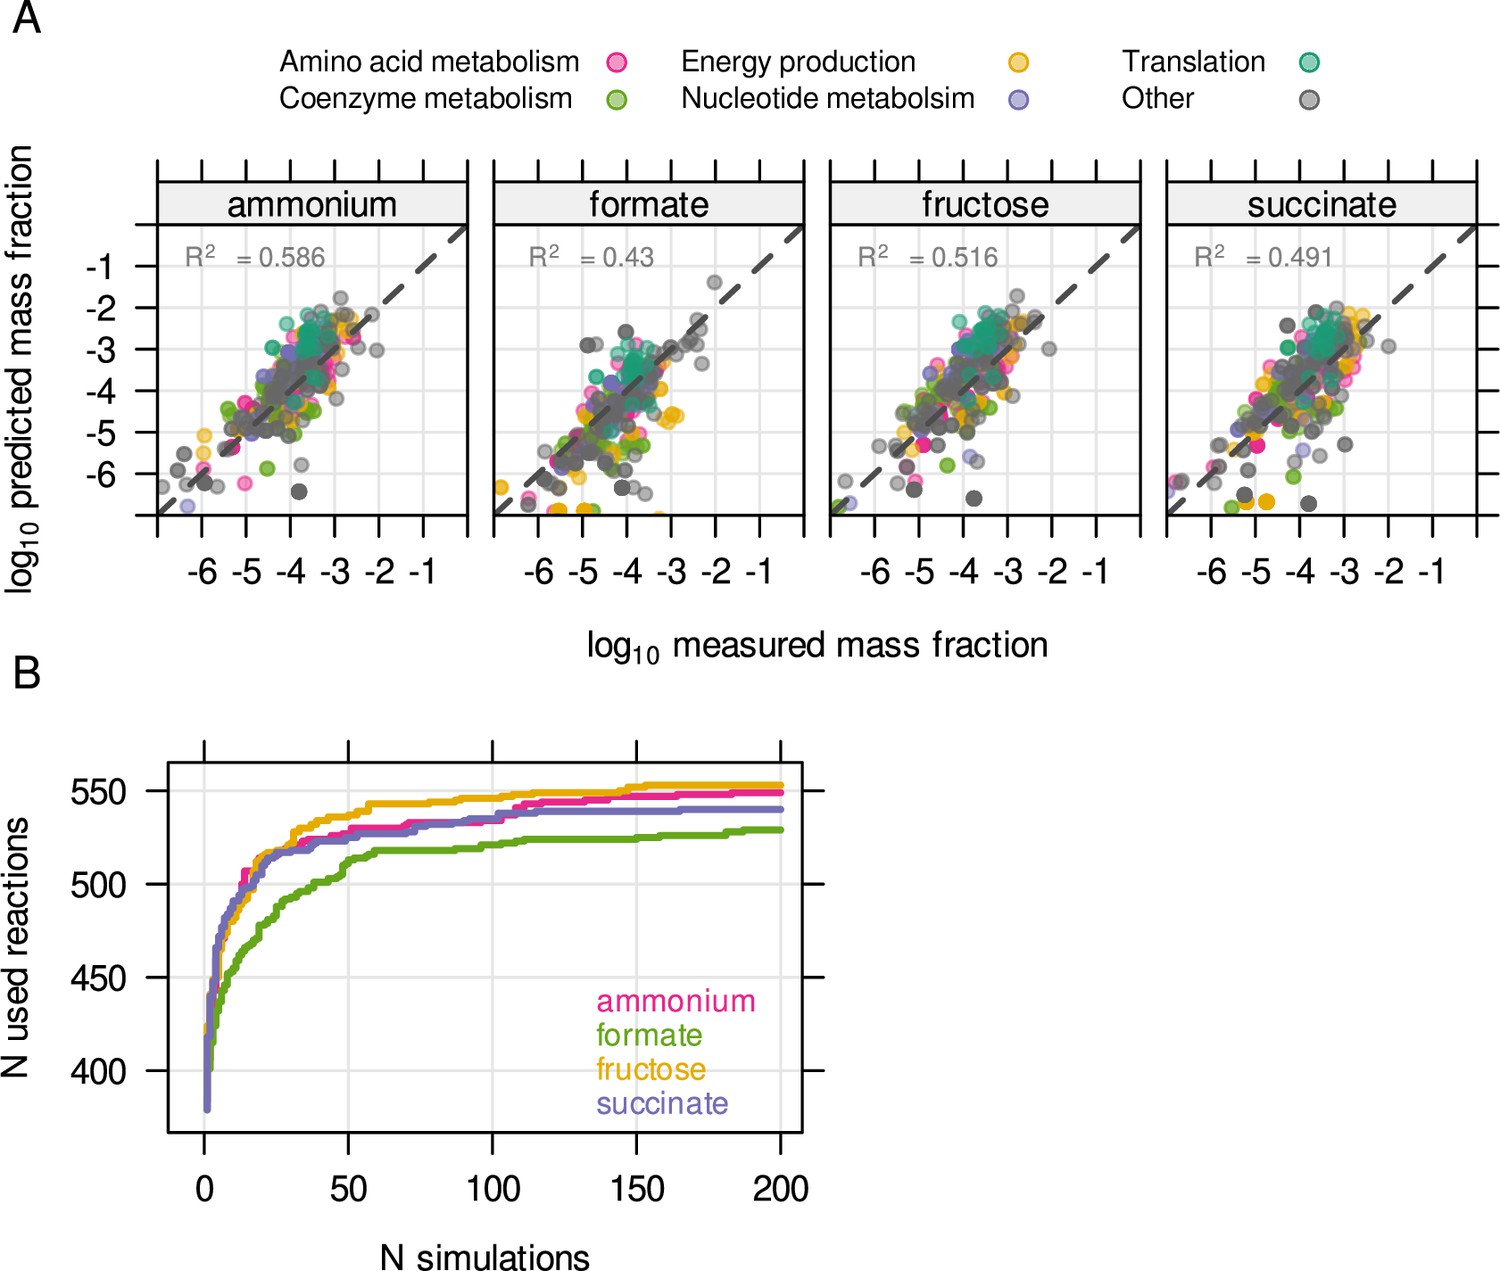
The unutilized proteome of Cupriavidus is related to environmental readiness.
(A) The resource balance analysis (RBA) model was constrained by enzyme efficiency (kapp) estimated from known protein concentrations. The model was able to reproduce measured protein allocation for four different substrate limitations. (B) Enzyme efficiency kapp was randomly sampled 200 times per condition to obtain the maximum number of potentially utilized reactions in each growth condition.
Figure 3 with 2 supplements

Highly utilized enzymes are more abundant, less variable, and often essential.
(A) Protein mass in g/gDCW allocated to enzymes with low, moderate, and high utilization. Enzymes with moderate and high utilization were significantly more abundant than enzymes with low utilization (P = 2.2 × 10⁻¹⁶ and 3.2 × 10⁻²¹, respectively; Mann-Whitney U-test, two-sided). (B) Coefficient of variation (CV) as a measure of variability in enzyme abundance. Enzymes with moderate and high utilization had significantly lower variability than enzymes with low utilization (P = 2.1 × 10⁻³ and 1.8 × 10⁻¹², respectively. Mann-Whitney U-test, two-sided). (C) Number of reactions associated with at least one essential gene, or at least one probably essential gene, or no essential gene at all, broken down by utilization. (D) Map of C. necator’s central carbon metabolism. Inset figures show enzyme abundance and utilization for the four limiting conditions (µ = 0.25 hr–1, four biological replicates). Values were rescaled from the respective minimum and maximum to a range of 0–1. Enzyme abbreviations are colored according to essentiality as described in (C).
Figure 3—figure supplement 1
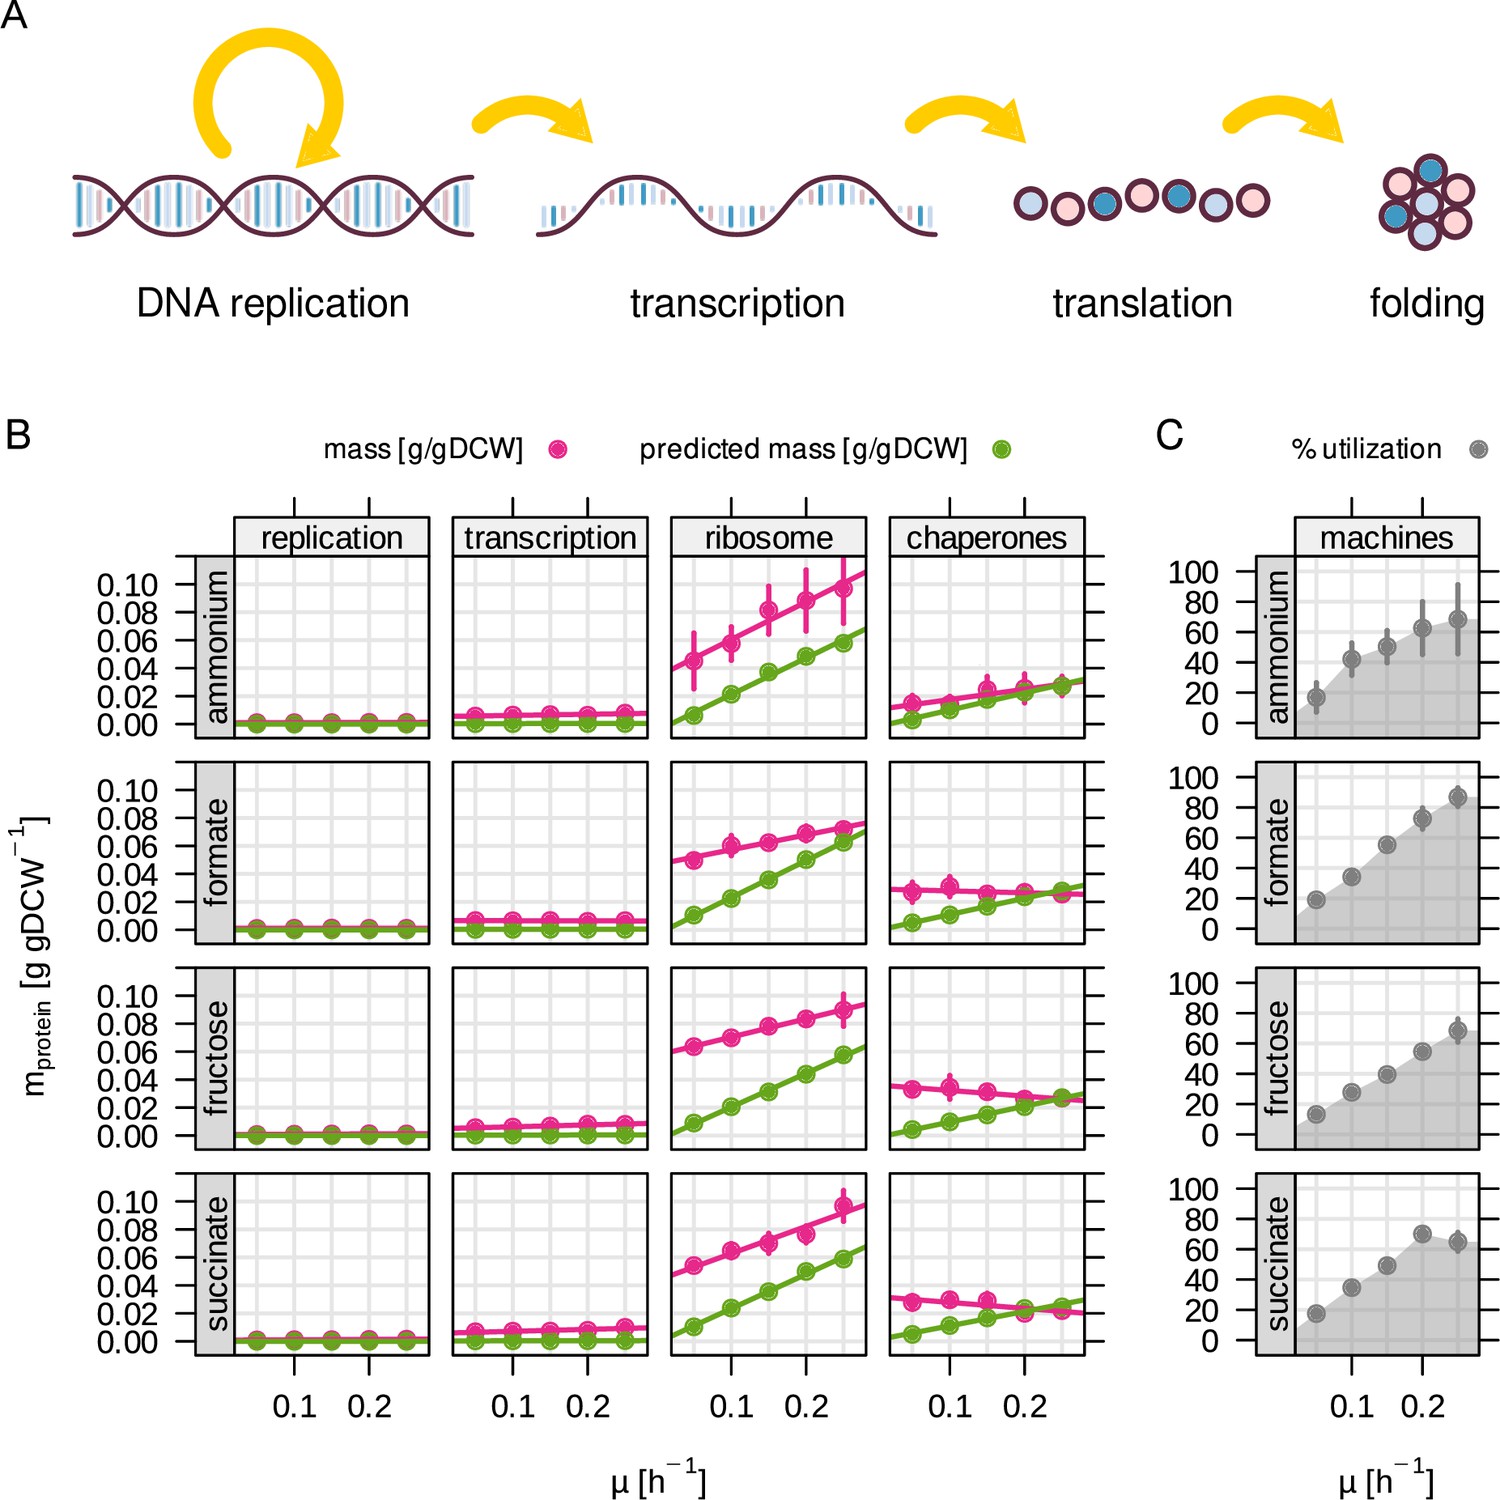
Utilization of molecular machinery related to central dogma depends on growth rate.
(A) The RBA model includes four different 'machines' for information processing. (B) Enzyme abundance in g/gDCW for each machine as a function of growth rate. Green - RBA model prediction, red - experimentally determined enzyme abundance. (C) Machine utilization in % for all machine abundances summed up.
Figure 3—figure supplement 2
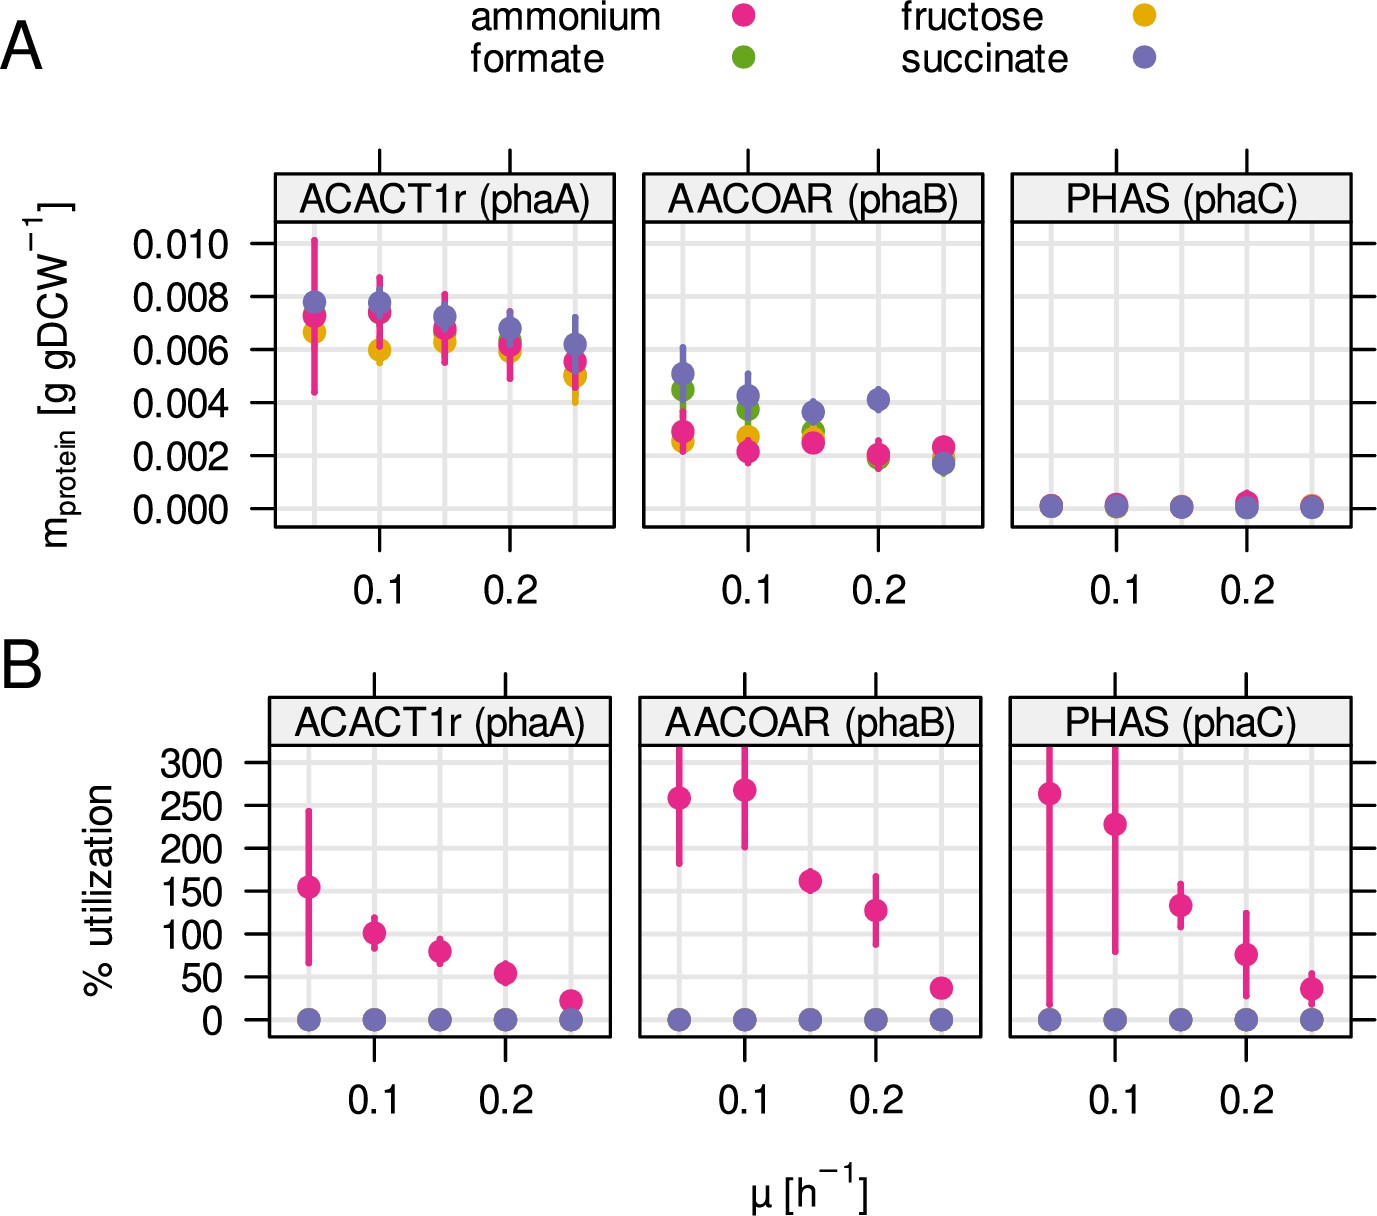
Enzyme mass and utilization of the PHB biosynthesis pathway.
(A) Protein mass fraction allocated to each enzyme during one of four different substrate limitations (ammonium, fructose, formate, succinate). (B) Predicted enzyme utilization by RBA model simulations. Contrary to most enzymes in central metabolism, utilization increased with decreasing growth rate and was only predicted for ammonium limitation.
Figure 4 with 1 supplement
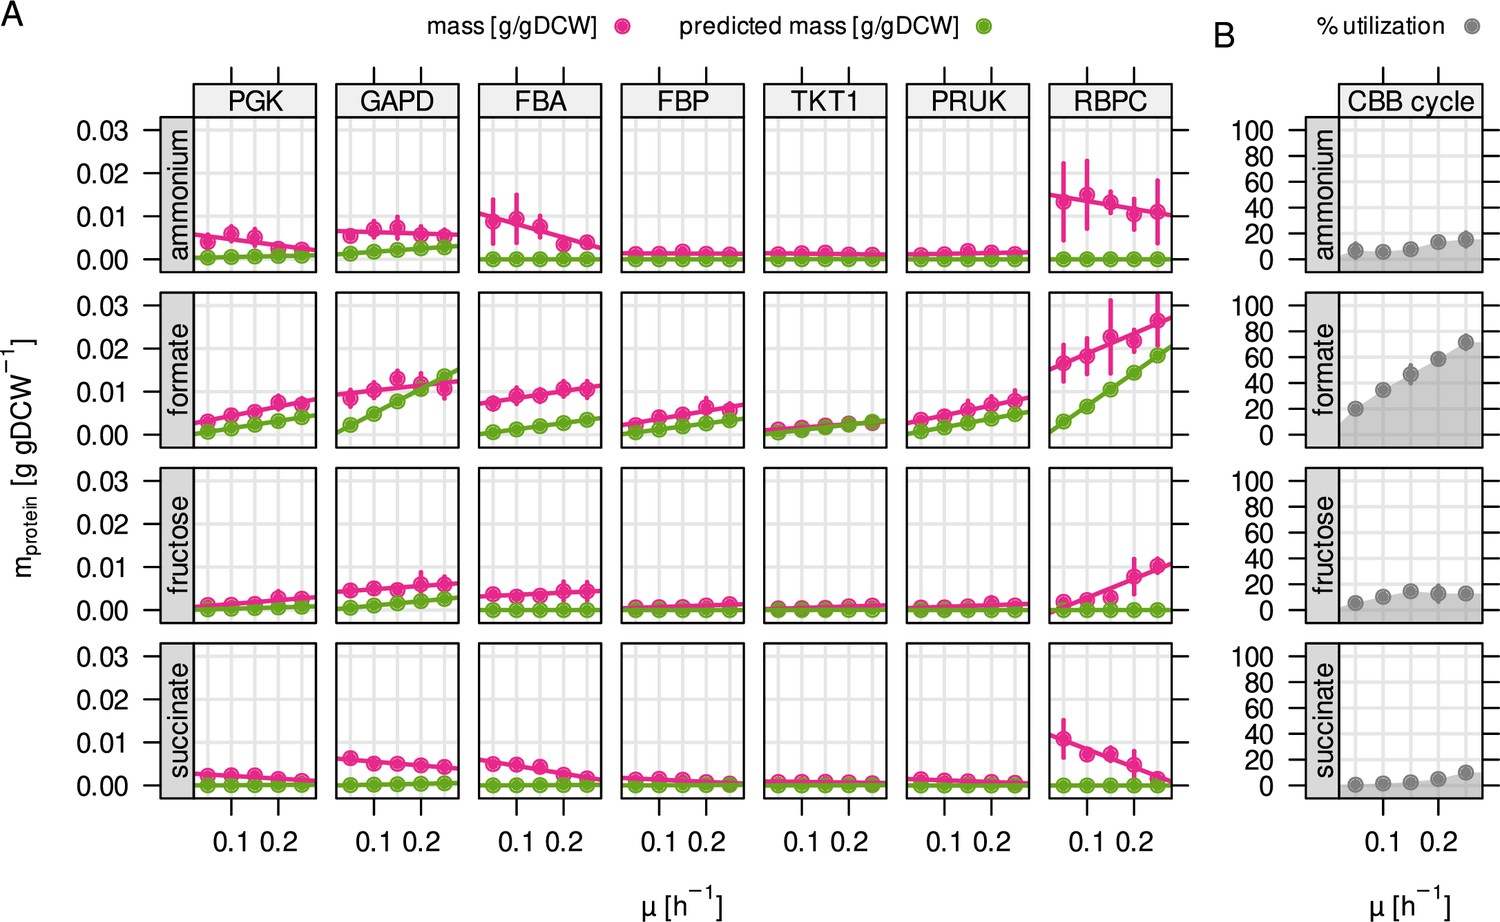
Autotrophy-related enzymes are largely underutilized.
(A) Experimentally determined and model-predicted protein concentration for the seven most abundant enzymes of the CBB cycle (points and error bars represent mean and standard deviation of four biological replicates, respectively). PGK, phosphoglycerate kinase; GAPD, glyceraldehyde-3-phosphate dehydrogenase; FBA, fructose bisphosphate aldolase; FBP, fructose bisphosphatase; TKT1, transketolase; PRUK, phosphoribulokinase; RBPC, ribulose bisphosphate carboxylase. (B) Total utilization of the enzymes in (A). Utilization was calculated as the sum of predicted (optimal) enzyme abundance divided by the sum of experimentally measured abundance.
Figure 4—figure supplement 1
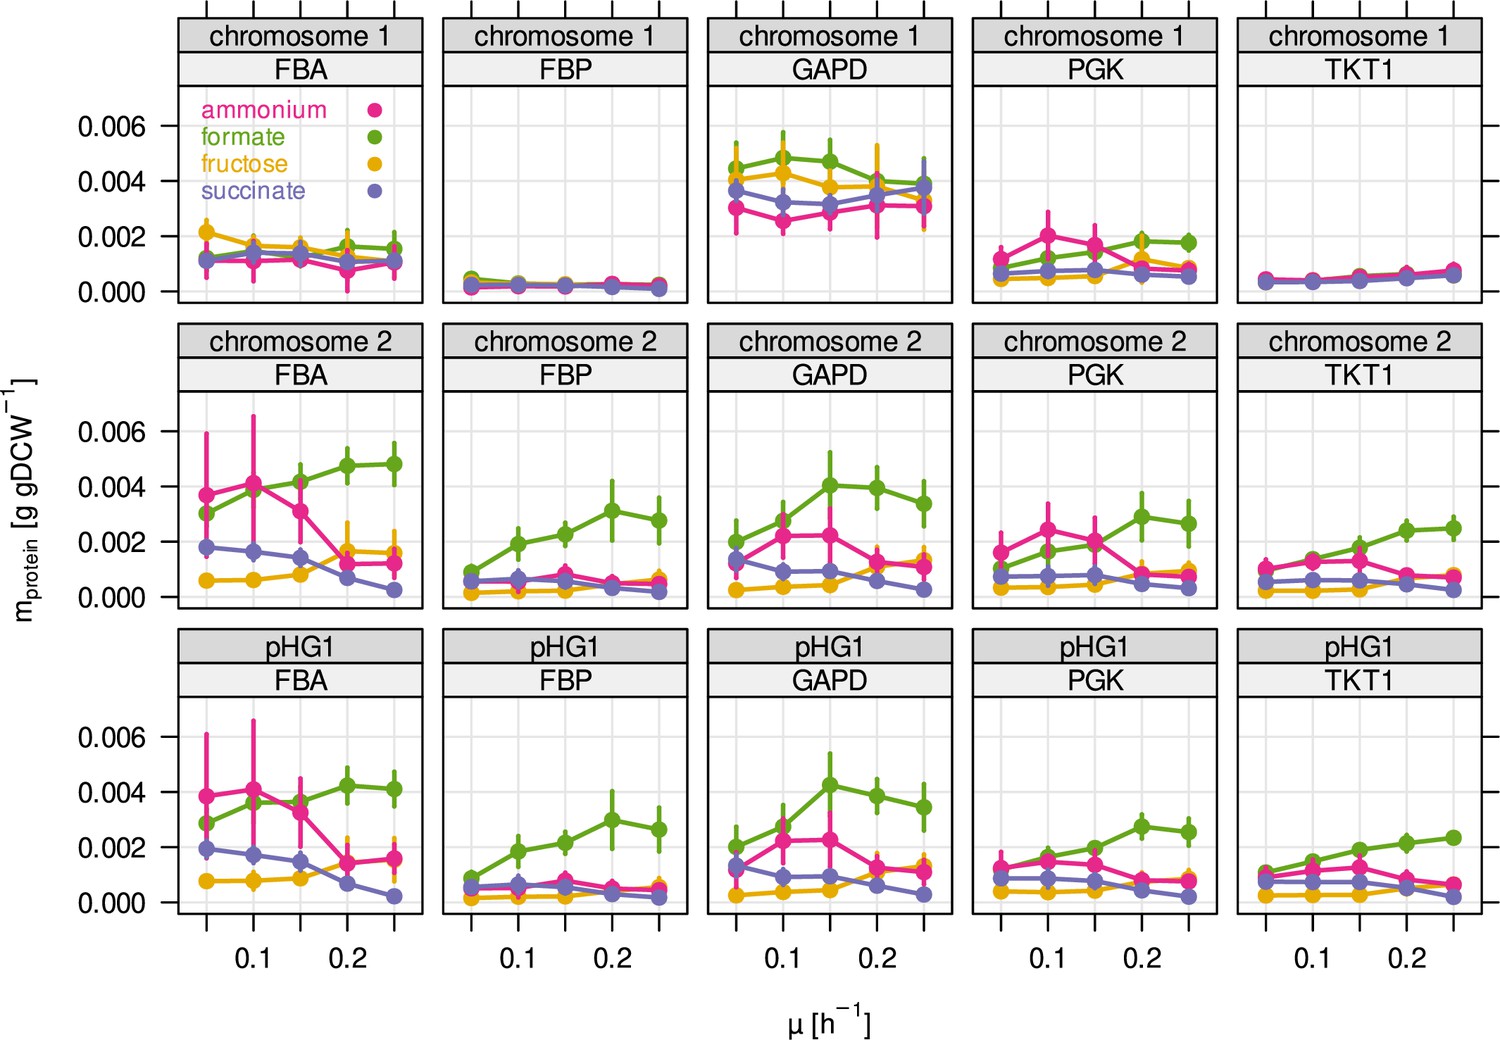
Protein mass of the five most abundant glycolytic enzymes broken down by genetic locus.
Several enzymes of glycolysis/CBB cycle are present in three different copies in the C. necator genome. Two of these copies are located in two almost identical cbb operons on chromosome 2, and megaplasmid pHG1. The remaining copy on chromosome 1 is presumably the phylogenetically most ancestral, while the other copies on chromosome 2 and pHG1 were acquired later.
Figure 5 with 1 supplement
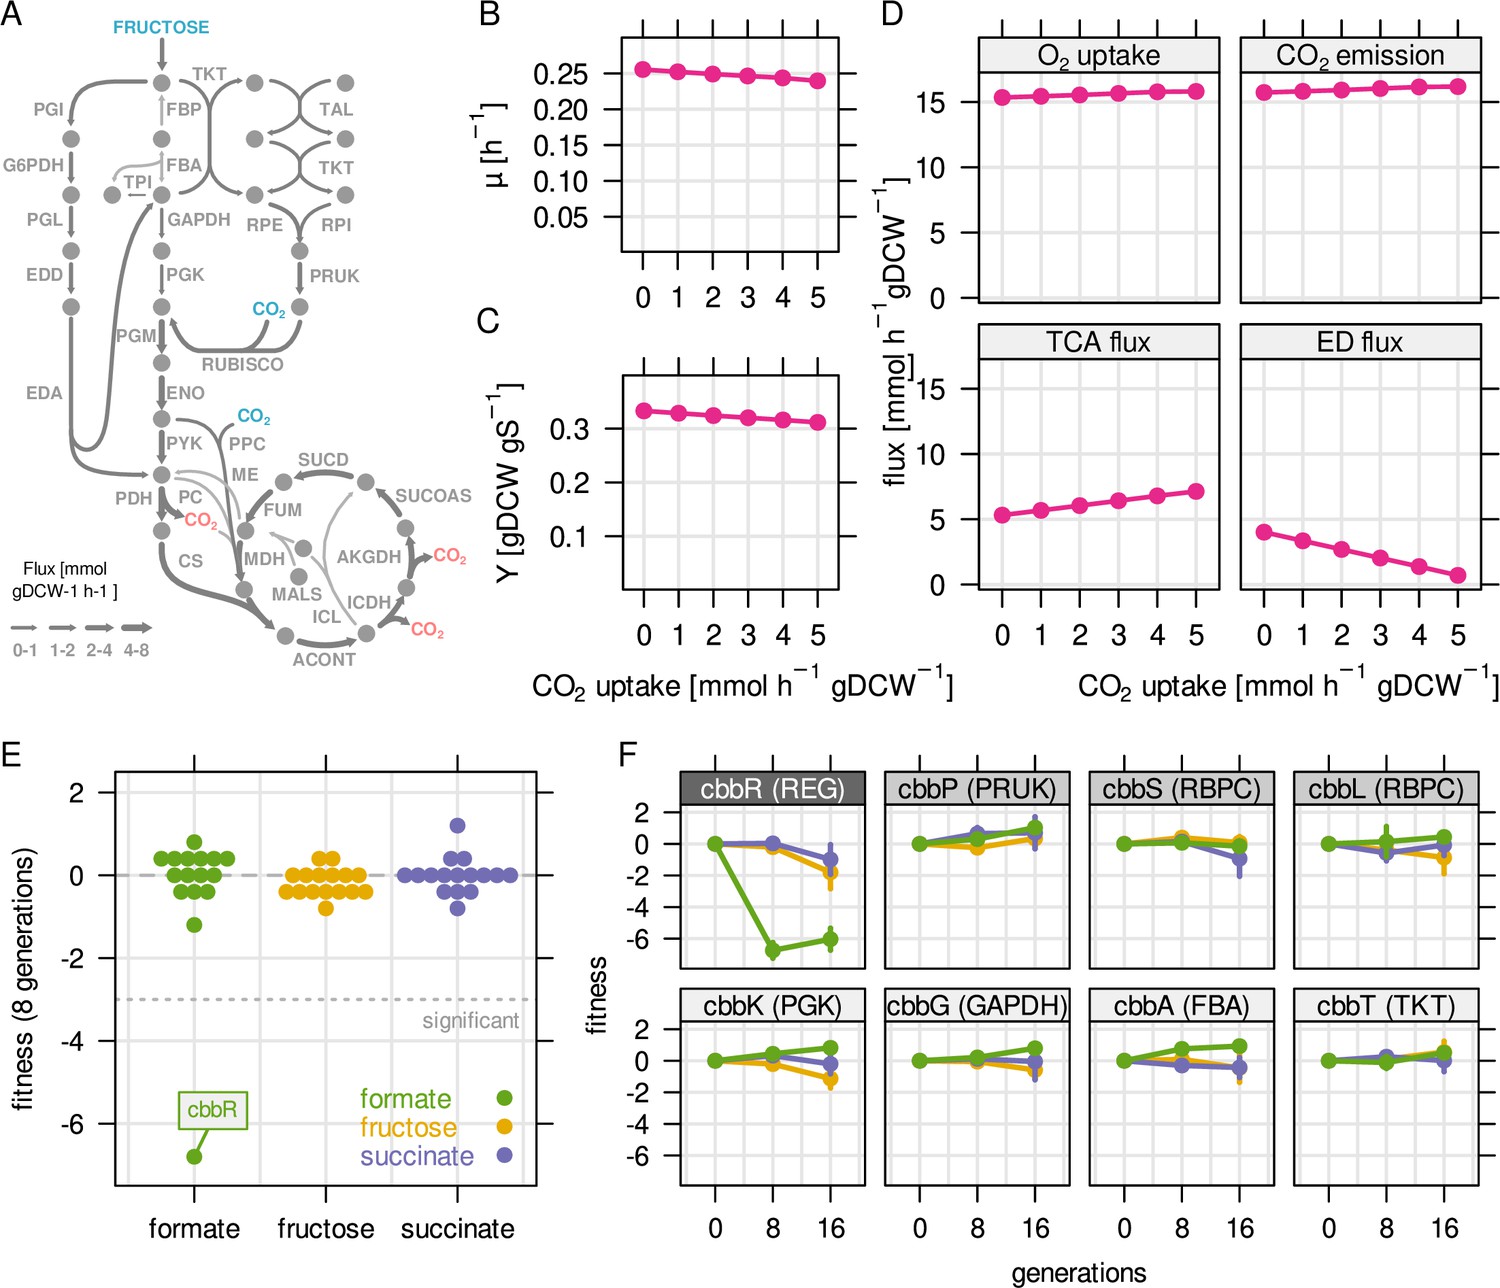
Reassimilation of CO2 is unlikely to provide a fitness benefit on fructose.
RBA model simulations were performed for a fixed fructose uptake rate combined with five different CO2 fixation rates. (A) Example metabolic flux map for a fructose uptake rate of 4.0 mmol gDCW–1 hr–1 and CO2 fixation rate of 3 mmol gDCW–1 hr–1. Blue - uptake of fructose and CO2, red - emission of CO2. (B) Predicted growth rate µ. (C) Biomass yield Y in gDCW g fructose–1. (D) Net flux through selected reactions for the same simulations as in (B) and (C). For the TCA cycle, flux through citrate synthase was used as a proxy. For the Entner-Doudoroff (ED) pathway, flux through 6-phosphogluconolactonase (EDD) was used as a proxy. (E) Fitness for all cbb genes determined by growth competition of a barcoded transposon knockout library on three different substrates. (F) Fitness over time for selected cbb genes of the pHG1 encoded operon, except cbbR which is located on chromosome 2. Chromosome 2 encoded cbb genes are not shown due to low transposon insertion frequency. Points and error bars represent mean and standard deviation of four biological replicates, respectively. Grayscale labels indicate role in CBB pathway: dark gray - transcriptional regulator, moderate gray - specific for CO2 fixation, light gray - overlapping role in glycolysis/CBB cycle.
Figure 5—figure supplement 1
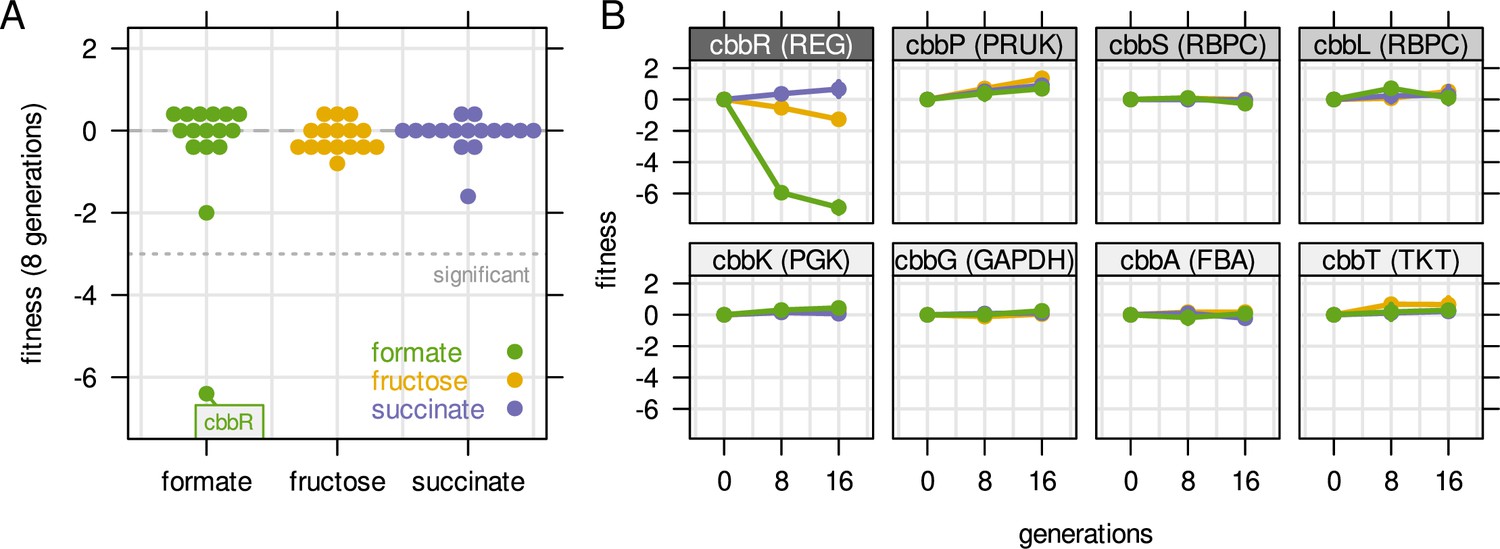
Fitness of selected genes obtained from cultivation of a barcoded transposon mutant library.
The library was cultivated for 16 generations with a pulsed growth regime (dilution at 2 hr intervals). (A) Fitness for all cbb genes during growth on three different carbon sources. Compare also Figure 5E with the same experiment but continuous dilution. (B) Fitness over time for selected cbb genes of the pHG1 encoded operon, except cbbR which is located on chromosome 2. Other chromosome 2 encoded cbb genes are not shown due to low transposon insertion frequency. Grayscale labels indicate role in CBB pathway: dark gray - transcriptional regulator, moderate gray - specific for CO2 fixation, light gray - overlapping role in glycolysis/CBB cycle. Compare also Figure 5F with the same experiment but continuous dilution.
Figure 6 with 1 supplement
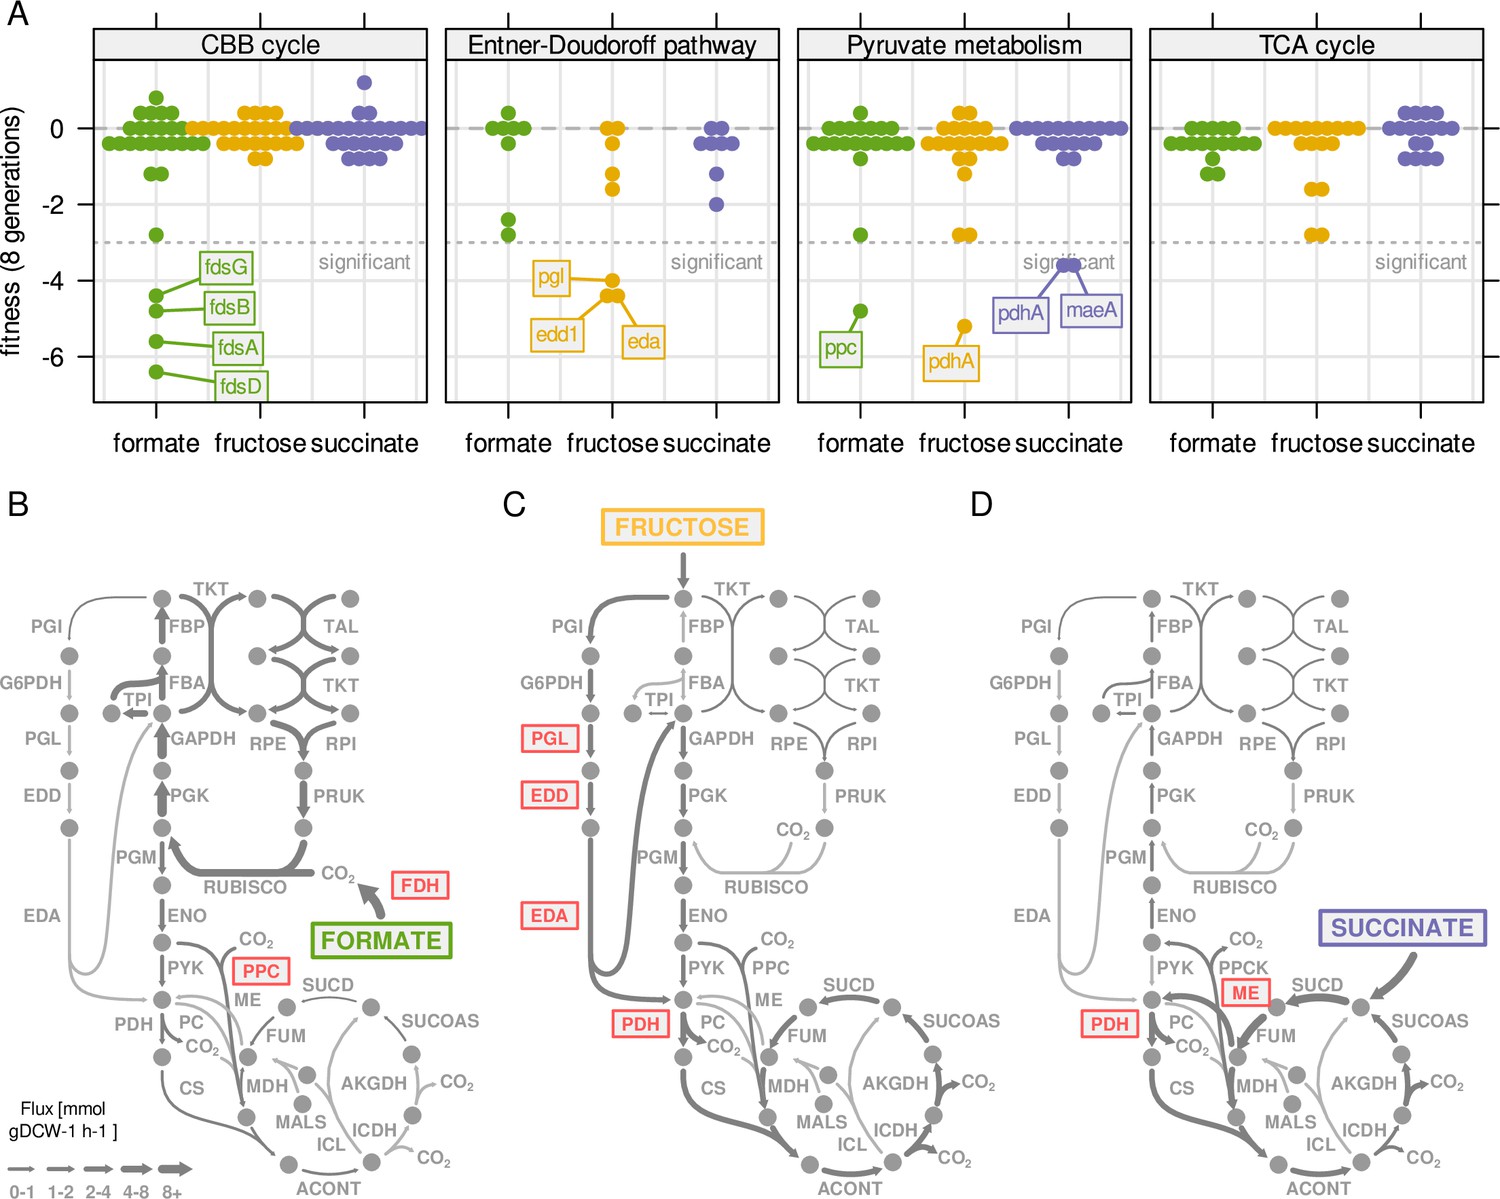
Central metabolism enzymes are highly redundant in C.
necator. (A) Fitness for all central carbon metabolism genes associated with the reactions in Figure 3D. Fitness was determined by growth competition of a barcoded transposon knockout library on three different substrates. Genes are broken down by pathway. Dotted line - fitness ≤ –3 was regarded as significant. A summary of all reactions with significantly changed fitness is available in . (B) Metabolic flux map for growth on formate. RBA simulation with formate uptake rate of 62 mmol gDCW–1 hr–1. Red - reaction where annotated genes show significantly reduced fitness in growth competition from (A). (C) Same as (B) for fructose with uptake rate of 4.0 mmol gDCW–1 hr–1. (D) Same as (B) for succinate with uptake rate of 8.3 mmol gDCW–1 hr–1.
Figure 6—figure supplement 1
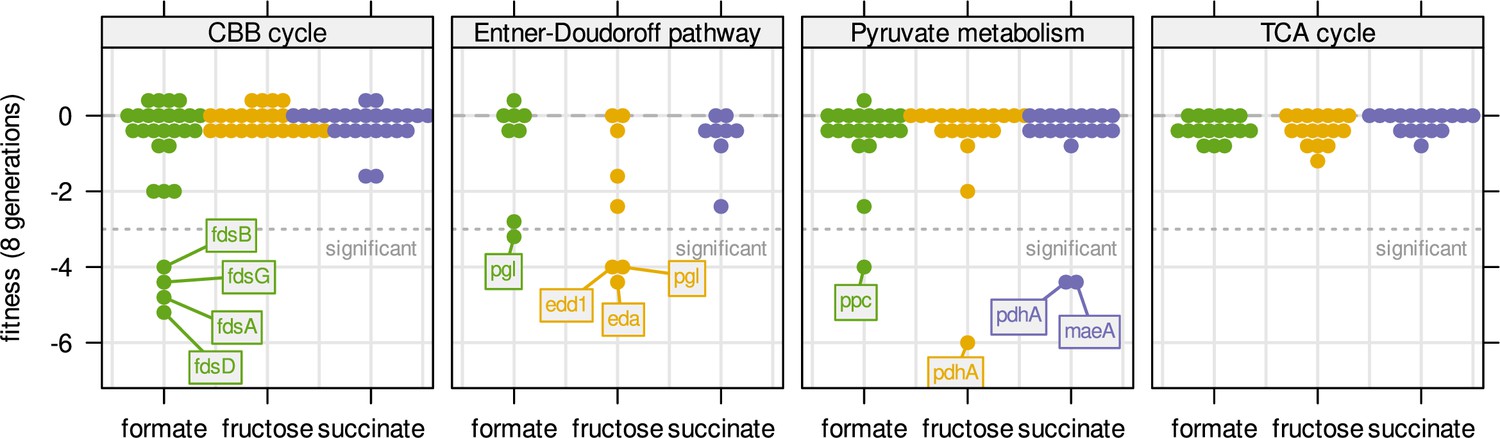
Fitness for all central carbon metabolism genes associated with the reactions in Figure 3D.
Genes are broken down by pathway. Dotted line - fitness ≤ –3 was regarded as significant. Compare also Figure 6A with the same experiment but continuous dilution.
Author response image 1

O2-limitation does not increase biomass yield, but reduces growth rate.
C. necator was grown in fructose or formate-fed turbidostats (0.5 and 1.5 g/L substrate, respectively). The oxygen concentration was stepwise reduced by mixing air with molecular nitrogen (N2).
Author response image 2
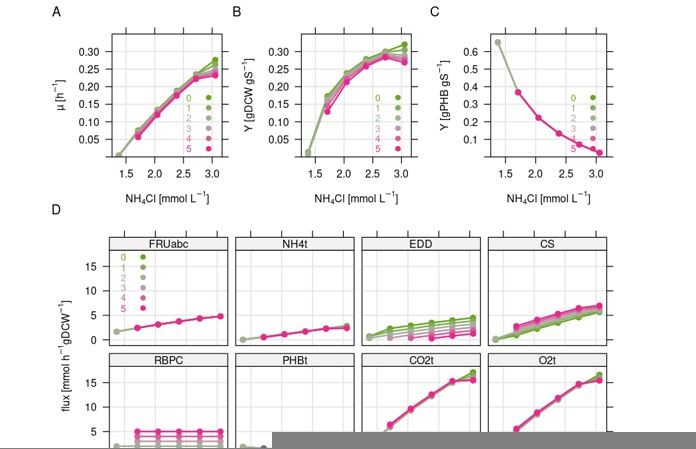
Simulation of the combined effect of nitrogen limitation and CO2 refixation via the CBB cycle.
Simulations were carried out using the resource balance analysis (RBA) model for Ralstonia eutropha as described previously. Nitrogen limitation was simulated by stepwise reduction of the nitrogen concentration in the medium, which triggers (forced) PHB formation. Colors indicate the amount of flux forced through the Calvin cycle from 0 to 5 mmol gDCW-1 h-1. Note that not all simulations were feasible due to non-positive growth rate. (A) Growth rate. (B) Biomass yield per g fructose. (C) PHB yield in g per g fructose. (D) Flux in mmol gDCW-1 h-1 for selected reactions. FRUabc, fructose transporter; NH4t, ammonium transporter; EDD, 6PG-hydratase representing ED flux; CS, citrate synthase representing TCA cycle flux; RBPC, Rubisco, representing CBB cycle flux; PHBt, PHB pseudo transport reaction; CO2t, CO2 transporter; O2t, O2 transporter.
Tables
Key resources table
| Reagent type (species) or resource | Designation | Source or reference | Identifiers | Additional information |
|---|---|---|---|---|
| Strain, strain background (Cupriavidus necator) | H16 (wild type) | German Collection of Microorganisms and Cell Cultures, DSM-428 | NCBI:txid381666 | https://www.dsmz.de/collection/catalogue/details/culture/DSM-428 |
| Strain, strain background (Cupriavidus necator) | H16 PHB-4(mutant deficient in PHB synthesis) | German Collection of Microorganisms and Cell Cultures, DSM-541 | H16 PHB-4 | https://www.dsmz.de/collection/catalogue/details/culture/DSM-541 |
| Strain, strain background (Cupriavidus necator) | H16, transposon mutant library (60,000 individual mutuants) | This study | NCBI:txid381666 | Obtained by conjugation with E. coli APA766 |
| Strain, strain background (Escherichia coli) | APA766, transposon donor strain (pKMW7 Tn5) | Wetmore et al., 2015 | WM3064 | Obtained from the original authors (Adam Deutsch- bauer lab) |
Additional files
-
Transparent reporting form
- https://cdn.elifesciences.org/articles/69019/elife-69019-transrepform1-v2.pdf
-
Supplementary file 1
Table summarizing the constraints for the RBA model.
- https://cdn.elifesciences.org/articles/69019/elife-69019-supp1-v2.docx
-
Supplementary file 2
Table of all annotated genes for the marked reactions in Figure 6B–D.
Genes that were found to be essential in one or more conditions are marked with gray background. Fitness values below or above a threshold of |F| ≥ 3 are marked with red. Non-essential genes annotated for the same reactions were included for comparison.
- https://cdn.elifesciences.org/articles/69019/elife-69019-supp2-v2.docx
-
Supplementary file 3
Table of the oligonucleotides/primers used in this study.
- https://cdn.elifesciences.org/articles/69019/elife-69019-supp3-v2.docx
Download links
A two-part list of links to download the article, or parts of the article, in various formats.
Downloads (link to download the article as PDF)
Open citations (links to open the citations from this article in various online reference manager services)
Cite this article (links to download the citations from this article in formats compatible with various reference manager tools)
Protein allocation and utilization in the versatile chemolithoautotroph Cupriavidus necator
eLife 10:e69019.
https://doi.org/10.7554/eLife.69019


