Understanding patterns of HIV multi-drug resistance through models of temporal and spatial drug heterogeneity
- Department of Integrative Biology, University of California, Berkeley, United States
- Department of Genome Sciences, University of Washington, United States
- Harper Health and Science Communications, LLC, United States
- British Columbia Centre for Excellence in HIV/AIDS, Canada
- Department of Medicine, University of British Columbia, Canada
- Department of Biology, San Francisco State University, United States
Figures
Figure 1
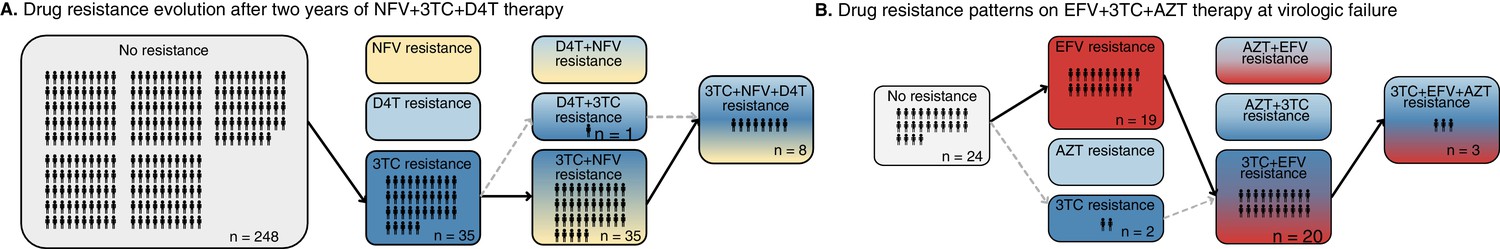
Patterns of drug resistance evolution in two studies of triple-drug treated individuals with HIV.
(A) Kempf study: Resistance to the drug 3TC emerges first among individuals with HIV taking the triple-drug cocktail NFV + 3TC + D4T (n=327) in Kempf et al., 2004 in a two year study. NFV is a protease inhibitor, and D4T and 3TC are nucleoside reverse transcriptase inhibitors. (B) Hoffman study: Resistance to the drug EFV emerges first among individuals with HIV taking the triple-drug cocktail EFV + 3TC + AZT (n=68) in Hoffmann et al., 2009 . Resistance is reported at the time of virologic failure (≤18 months). EFV is a non-nucleoside reverse transcriptase inhibitor (NNRTI), and AZT and 3TC are nucleoside reverse transcriptase inhibitors (NRTIs). Abbreviations: 3TC: lamivudine, AZT: zidovudine, D4T: stavudine, EFV: efavirenz, NFV: nelfinavir. Solid lines (followed from left to right) represent the most frequent progression of drug resistance, whereas dashed lines represent observed minority paths to resistance.
Figure 2
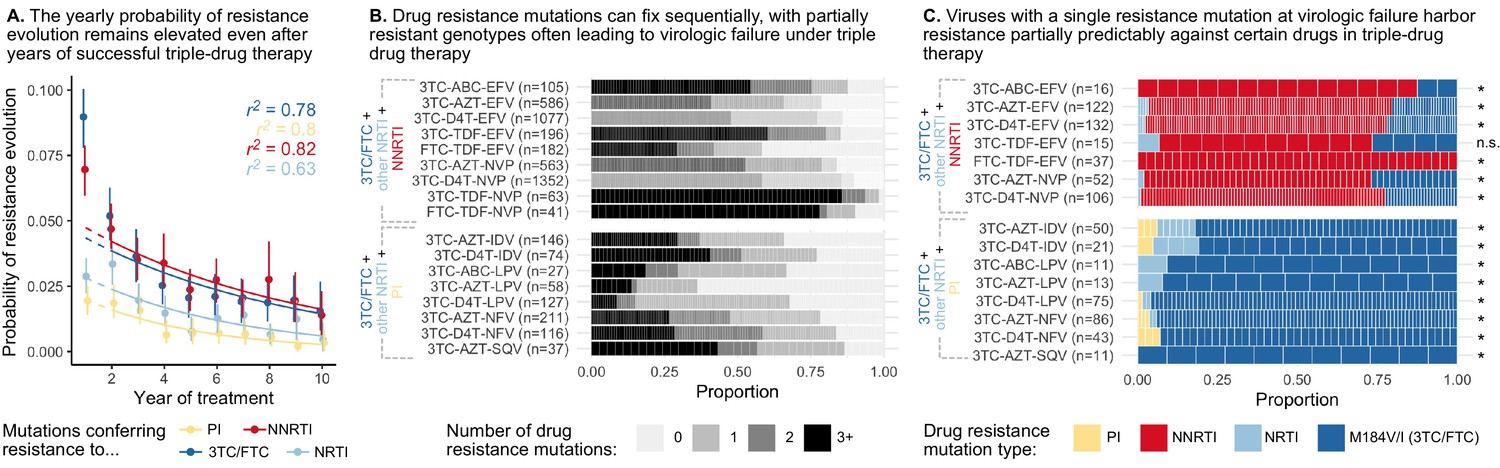
Cohort analyses of individuals with HIV reveal drug resistance evolution is ongoing after years on therapy, stepwise and partially predictable.
(A) The yearly probability of resistance evolution conditional on no prior resistance evolution in a large cohort of individuals in British Columbia treated with triple drug therapies (Rocheleau et al., 2018). Conditional evolution probabilities are plotted separately for resistance to 3TC or FTC (dark blue), NNRTIs (red), NRTIs other than 3TC or FTC (light blue) or PIs (yellow). Drug-category specific fits to an exponential model covering years 2–10 and describing the model fit are also plotted. Bars represent 95% confidence intervals. (B) Across individuals treated with three-drug combination therapies based on two NRTIs paired with an NNRTI (top) or PI (bottom), many sequences are detected with 0, 1, 2, or 3+ drug resistance mutations in a large cohort (data source: Feder et al., 2016a). (C) In individuals treated with three-drug combination therapies based on two NRTIs paired with an NNRTI (top) who have exactly one resistance mutation, that mutation most often confers resistance to the NNRTI of the treatment (red), although sometimes resistance to 3TC (dark blue) or the other NRTI (light blue) develops. Among individuals treated with a PI paired with 3TC and a second NRTI who have a single drug resistance mutation, that mutation most often confers resistance to 3TC (dark blue), although sometimes it confers resistance to the other NRTI (light blue) or the PI (yellow). Asterisks mark treatments for which the first mutation confers resistance to the NNRTI (top) or 3TC (bottom) more often than expected under the relative mutation probabilities of the three drugs (binomial test, 5% false discovery rate). (Data source: Feder et al., 2016a). Each square in both B and C represents a single individual, and the sample sizes are given next to the treatment names. Abbreviations: abacavir, ABC; indinavir, IDV; lamivudine, 3TC; lopinavir, LPV; nelfinanvir, NFV; stavudine, D4T; saquinavir, SQV; zidovudine, AZT.
Figure 3

Dose response curves help explain the dynamics of treated viral populations.
(A) HIV antigen levels initially decline when treated with AZT monotherapy (6x200 mg/day) to below a detectable threshold (dotted line). Starting at week 16, the viral population begins to rebound even in the presence of the drug, indicating the evolution of drug resistance. (A) Is reprinted with annotations from Figure 1A from The Lancet, 1 (8582), Reiss et al, ‘Resumption of HIV antigen production during continuous zidovudine treatment’, Page 421, Copyright (1988), with permission from Elsevier. It is not covered by the CC-BY 4.0 licence and further reproduction of this panel would need permission from the copyright holder. (B) Schematic shows different regimes of viral behavior dependent on the concentration of a particular drug. At high concentrations (right side of the plot), both drug-resistant (dashed red) and drug-sensitive (solid black) viruses are suppressed, with R0 below 1. As drug concentration decreases, a window of concentrations emerges where the drug-resistant virus can grow in population size in the presence of the drug (), but the drug-sensitive genotype cannot. This is termed the ‘mutant selection window’ (Drlica, 2003). At lowest concentrations, both wild-type (WT) and drug-resistant viruses can replicate, but the WT virus out-competes the drug-resistant type because it does not carry the fitness penalty of costly drug resistance mutations. Labels 1 and 2 show how the dynamics of the population in A can be explained by a mutation which behaves like the black arrow in B. If the drug concentration is higher and the resistance mutation only confers a change in R0 according to the blue arrow, the viral population will remain suppressed.
© 1988, Elsevier. is reprinted with annotations from Figure 1A from Reiss et al., 1988, Copyright (1988), with permission from Elsevier. It is not covered by the CC-BY 4.0 licence and further reproduction of this panel would need permission from the copyright holder.
Figure 4
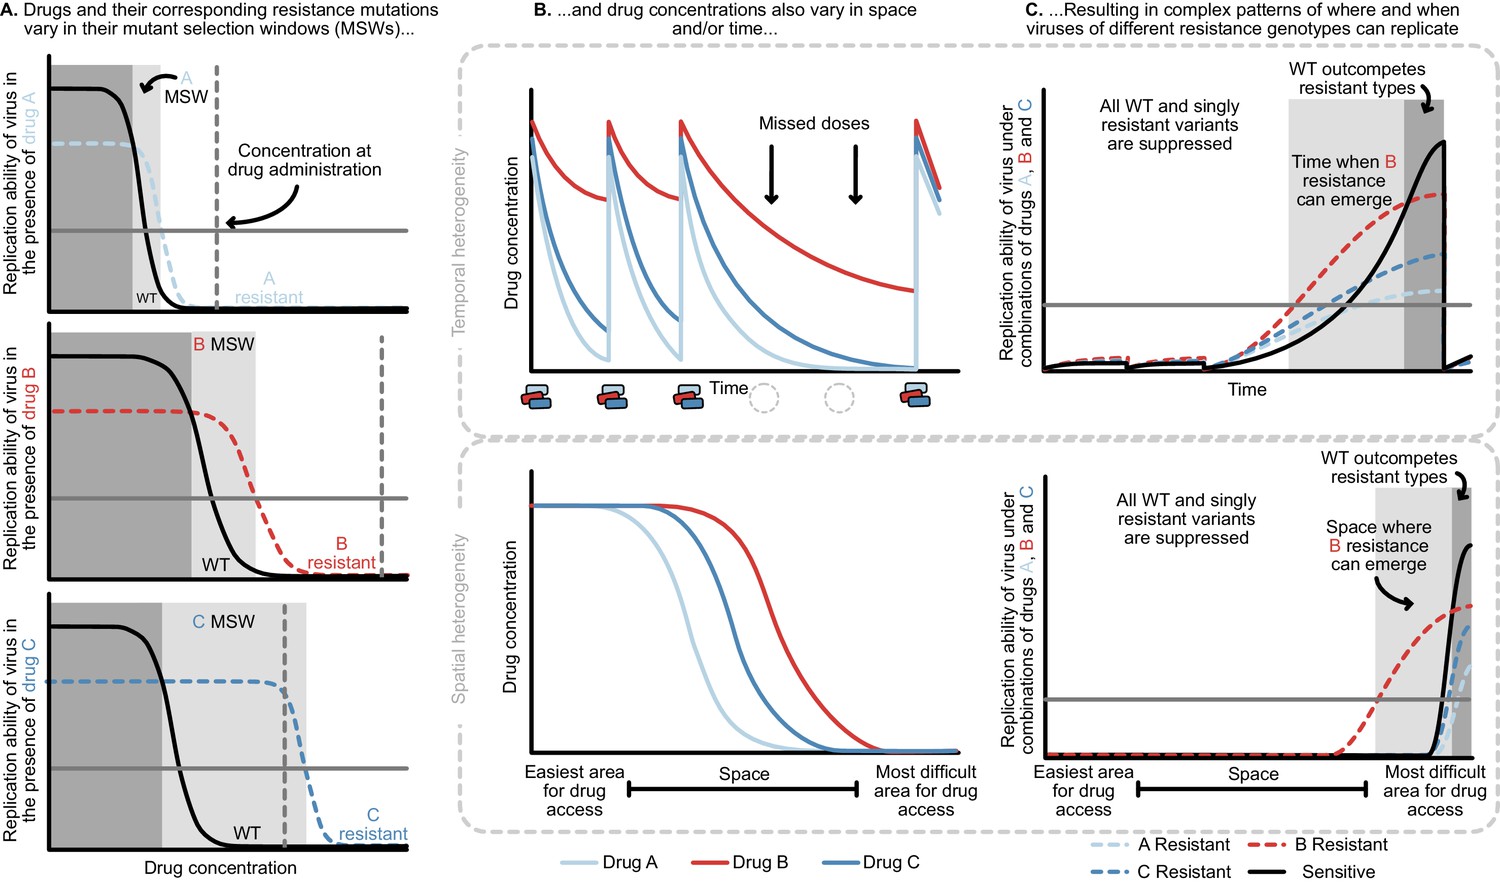
Heterogeneity in time or space can allow the spread of drug resistant viruses.
(A) Different drugs and their associated drug resistance mutations have differently shaped concentration response curves and corresponding mutant selection windows (MSW). Pictured here, drug A (light blue) has the smallest MSW, whereas drug C (dark blue) has the widest MSW. Drug B (red) has an intermediate MSW. (B) Variable MSWs also interact with drugs that have heterogeneous concentrations either in time (top) or space (bottom). Missed doses (due to incomplete adherence, plotted on top) can allow only drugs with long half-lives (here, Drug B) to remain present. This can create windows in time (pictured in C) which select resistance to only this longest half-life drug. If drug levels are allowed to decline sufficiently low, viral replication of non-resistant types can emerge as well. Drugs that do not reach all of the body (plotted on bottom) can create areas where single drug resistance mutations (pictured in C) can replicate. Areas where effectively no drugs reach can create a sanctuary where some viral replication of the wild-type (WT) virus can continue.
Figure 5 with 2 supplements
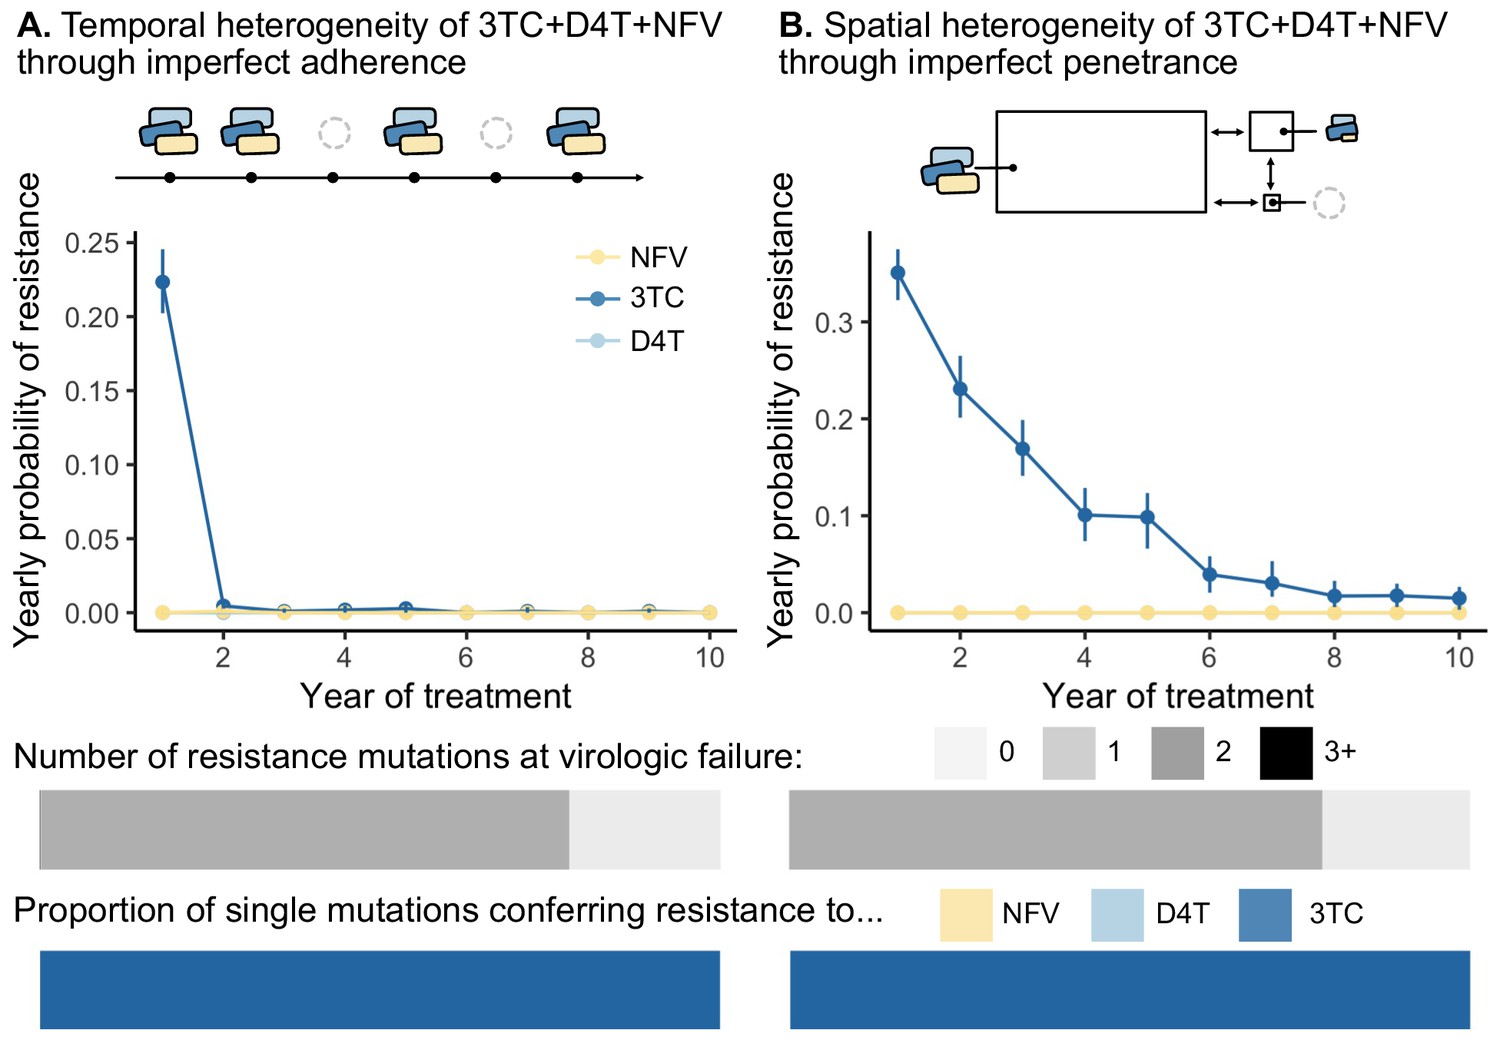
Models of spatial and temporal heterogeneity of drug levels explain certain evolutionary patterns observed in clinical data.
Using parameterized models of (A) temporal and (B) spatial heterogeneity of drug levels stemming from imperfect adherence and imperfect penetrance, respectively, we can assess the presence or absence of patterns found in clinical data. First, we plot the yearly probability of resistance evolution conditional on no resistance to this point for 3TC, D4T and NFV for each year of treatment. Bars represent 95% confidence intervals. Second, we plot the proportion of individuals with 0, 1, 2 or 3 resistance mutations at the time of virologic failure ( under temporal heterogeneity and under spatial heterogeneity). Third, we plot the proportion of individuals with resistance to NFV, D4T, or 3TC conditional on having a single resistance mutation at the time of virologic failure ( under temporal heterogeneity and under spatial heterogeneity). Note, the cartoon model of spatial heterogeneity in drug levels does not show the compartment sizes to scale.
Figure 5—figure supplement 1
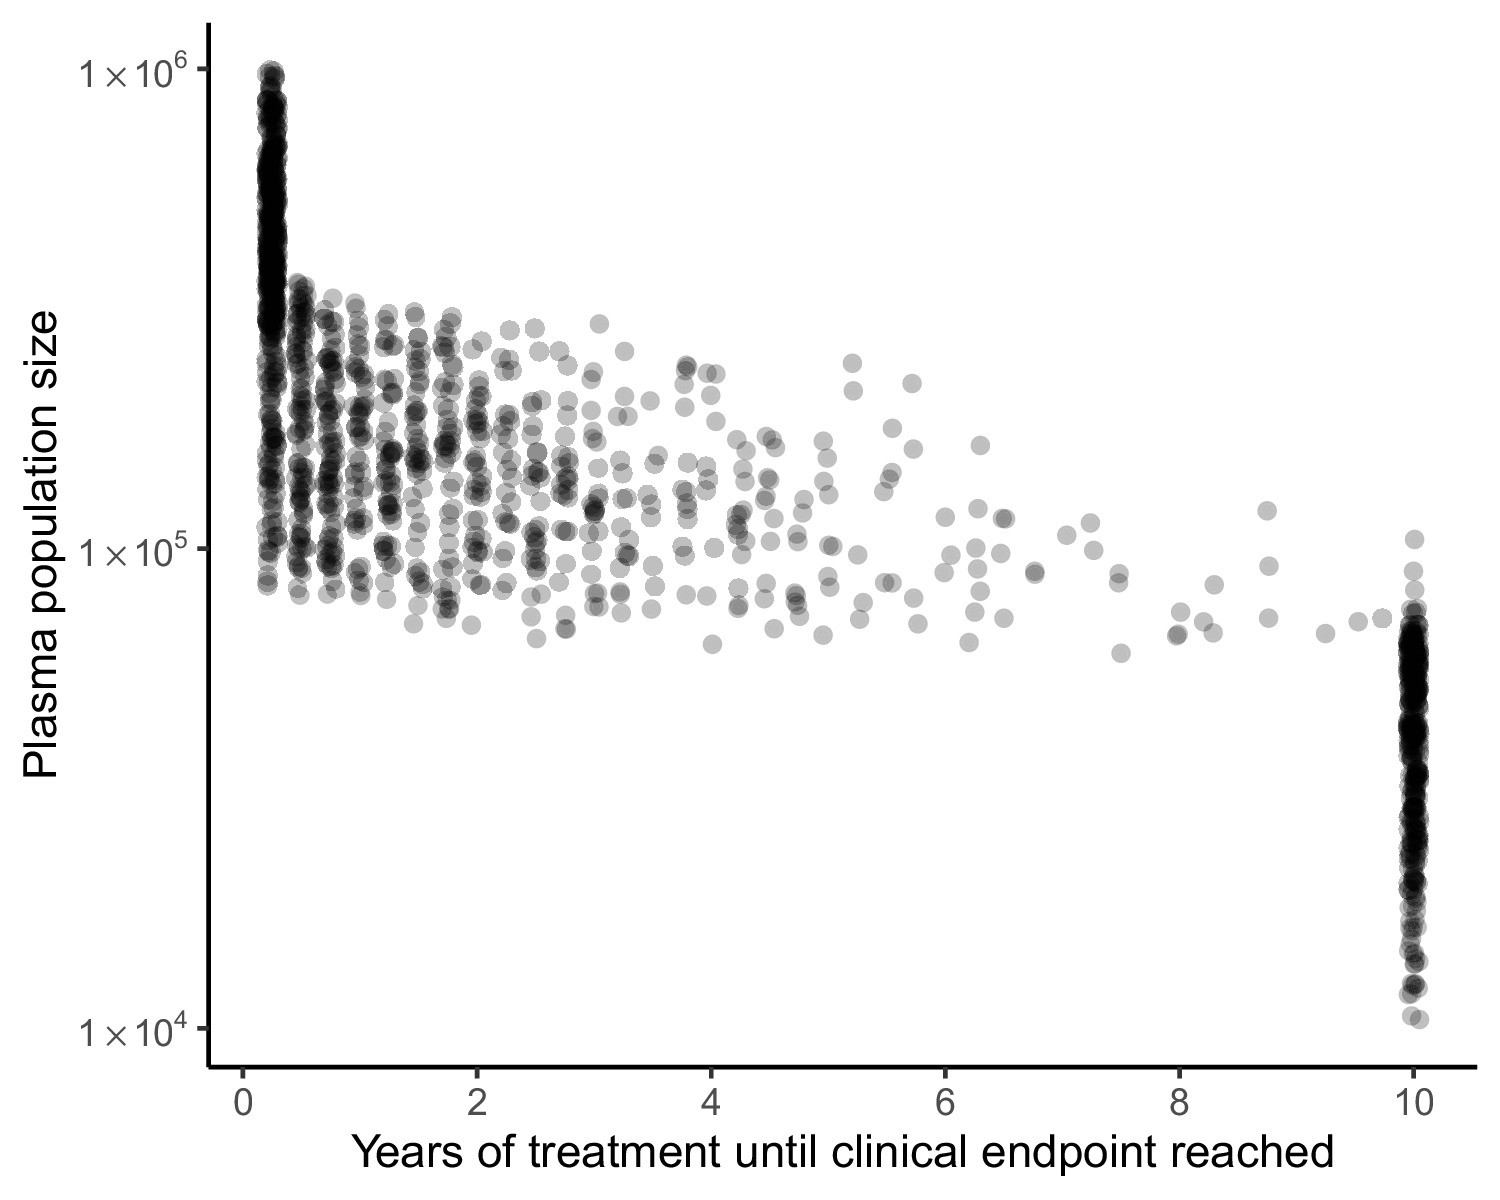
Clinical endpoint timing covaries with plasma population size in model of spatial heterogeneity of 3TC+D4T+NFV.
Clinical endpoints (virologic failure, or 10 years with no virologic failure) occur early in individuals with large plasma population sizes and later in individuals with smaller plasma population sizes (N = 1500). Individuals who reach 10 years of treatment with no virologic failure overwhelmingly have plasma population size under 105.
Figure 5—figure supplement 2
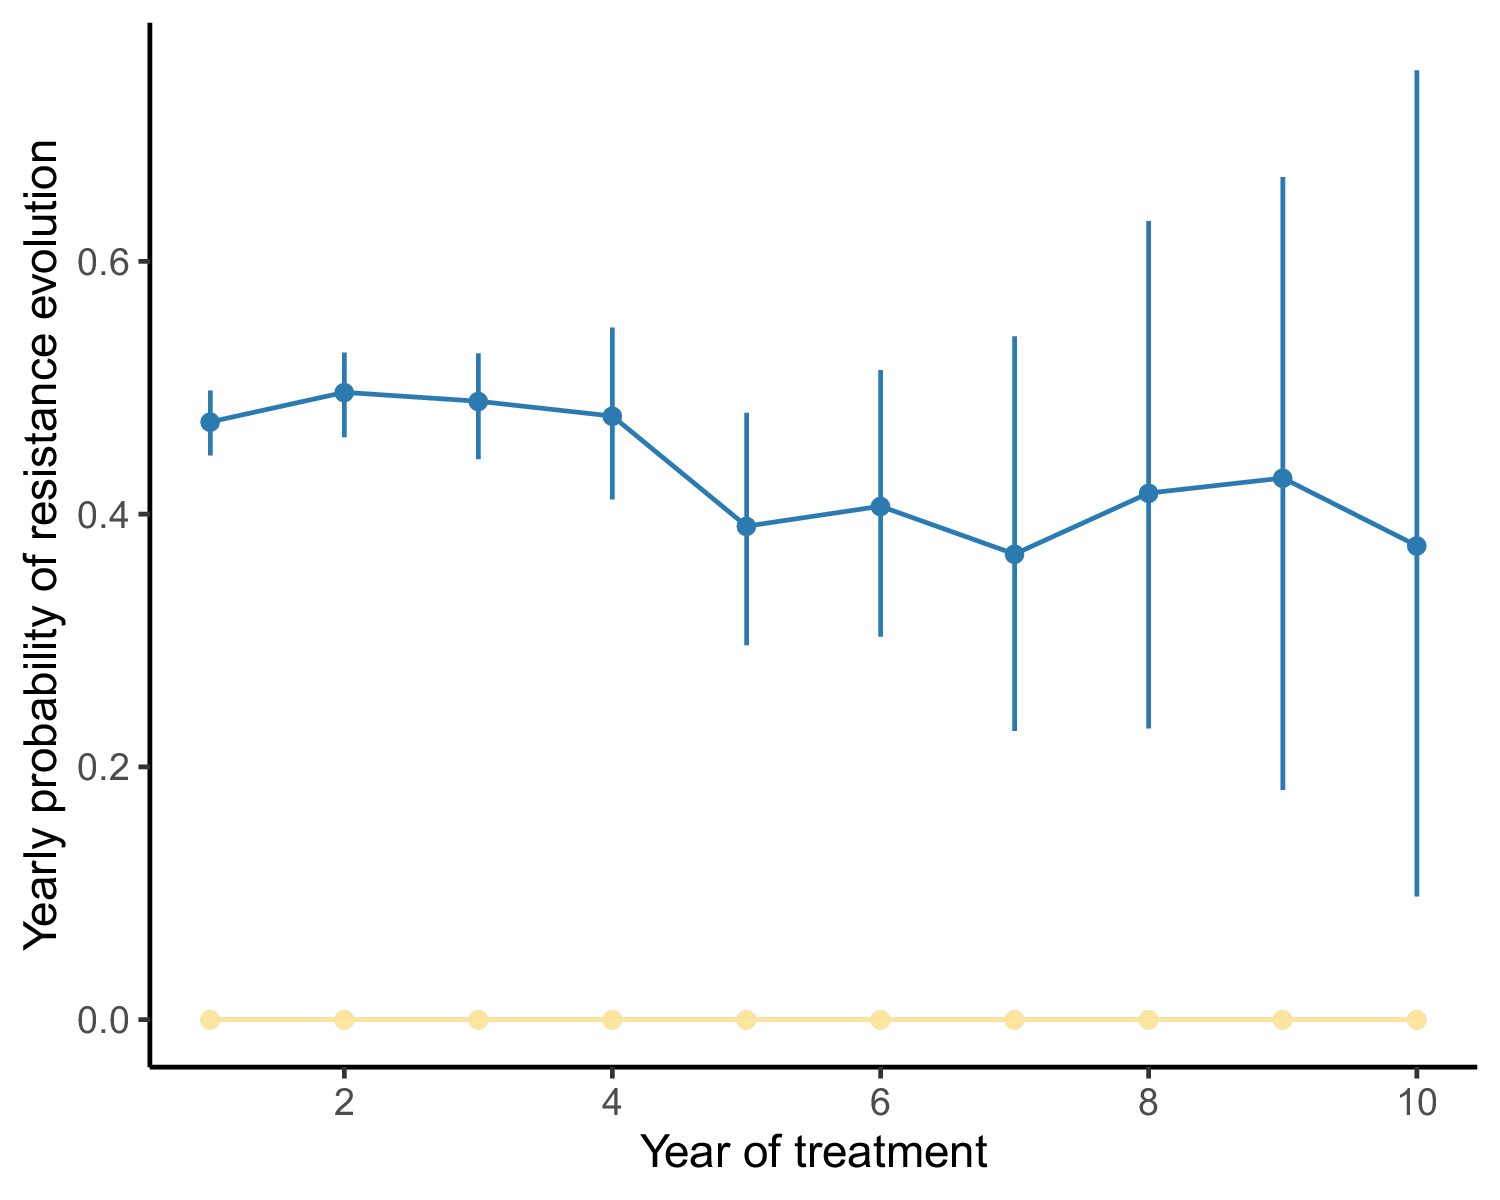
Yearly probability of resistance evolution under a model of spatial heterogeneity of 3TC+D4T+NFV varies little over time when the population size range is narrow.
Analogously to Figure 5, we compute the conditional probability of resistance evolution of individuals in their year of treatment given no resistance events up to year using the package CondSURV (Meira-Machado and Sestelo, 2016). In this figure, the underlying distribution of patient viral loads is narrower than in Figure 5 (IQR: here versus in Figure 5, full viral load specifications in Materials and methods), and the rate of resistance evolution remains approximately constant over time. Dark blue line represents 3TC resistance evolution, yellow represents NFV resistance evolution and light blue line (not visible beneath yellow line) represents D4T resistance evolution.
Additional files
-
Supplementary file 1
We briefly review salient existing models that investigate the evolution of HIV resistance evolution via drug heterogeneity in time or space.
- https://cdn.elifesciences.org/articles/69032/elife-69032-supp1-v1.xlsx
-
Supplementary file 2
Conditional survival probabilities for resistance evolution in a large cohort of HIV-infected individuals in British Columbia treated with three-drug combination therapies.
- https://cdn.elifesciences.org/articles/69032/elife-69032-supp2-v1.csv
-
Supplementary file 3
Exponential fits for conditional survival probabilities in Figure 2A.
Variables in table are fit as follows .
- https://cdn.elifesciences.org/articles/69032/elife-69032-supp3-v1.csv
-
Supplementary file 4
Computed rates toward single drug resistance for anti-retrovirals assessed in Figure 2C.
See materials and methods section 'Determining the total number of resistance mutations and the first drug resistance mutation on a treatment' for more details.
- https://cdn.elifesciences.org/articles/69032/elife-69032-supp4-v1.csv
-
Supplementary file 5
Binomial test summaries to assess if 3TC resistance precedes other categories of resistance in individuals treated with PI-based combination therapies.
- https://cdn.elifesciences.org/articles/69032/elife-69032-supp5-v1.csv
-
Supplementary file 6
Binomial test summaries to assess if NNRTI resistance precedes other categories of resistance in individuals treated with NNRTI-based combination therapies.
- https://cdn.elifesciences.org/articles/69032/elife-69032-supp6-v1.csv
-
Supplementary file 7
Drug-specific model parameters for 3TC, NFV and D4T.
- https://cdn.elifesciences.org/articles/69032/elife-69032-supp7-v1.xlsx
-
Transparent reporting form
- https://cdn.elifesciences.org/articles/69032/elife-69032-transrepform-v1.docx
Download links
A two-part list of links to download the article, or parts of the article, in various formats.
Downloads (link to download the article as PDF)
Open citations (links to open the citations from this article in various online reference manager services)
Cite this article (links to download the citations from this article in formats compatible with various reference manager tools)
Understanding patterns of HIV multi-drug resistance through models of temporal and spatial drug heterogeneity
eLife 10:e69032.
https://doi.org/10.7554/eLife.69032


