RNase III-mediated processing of a trans-acting bacterial sRNA and its cis-encoded antagonist
- Department of Molecular Infection Biology II, Institute of Molecular Infection Biology, University of Würzburg, Germany
Figures
Figure 1 with 4 supplements
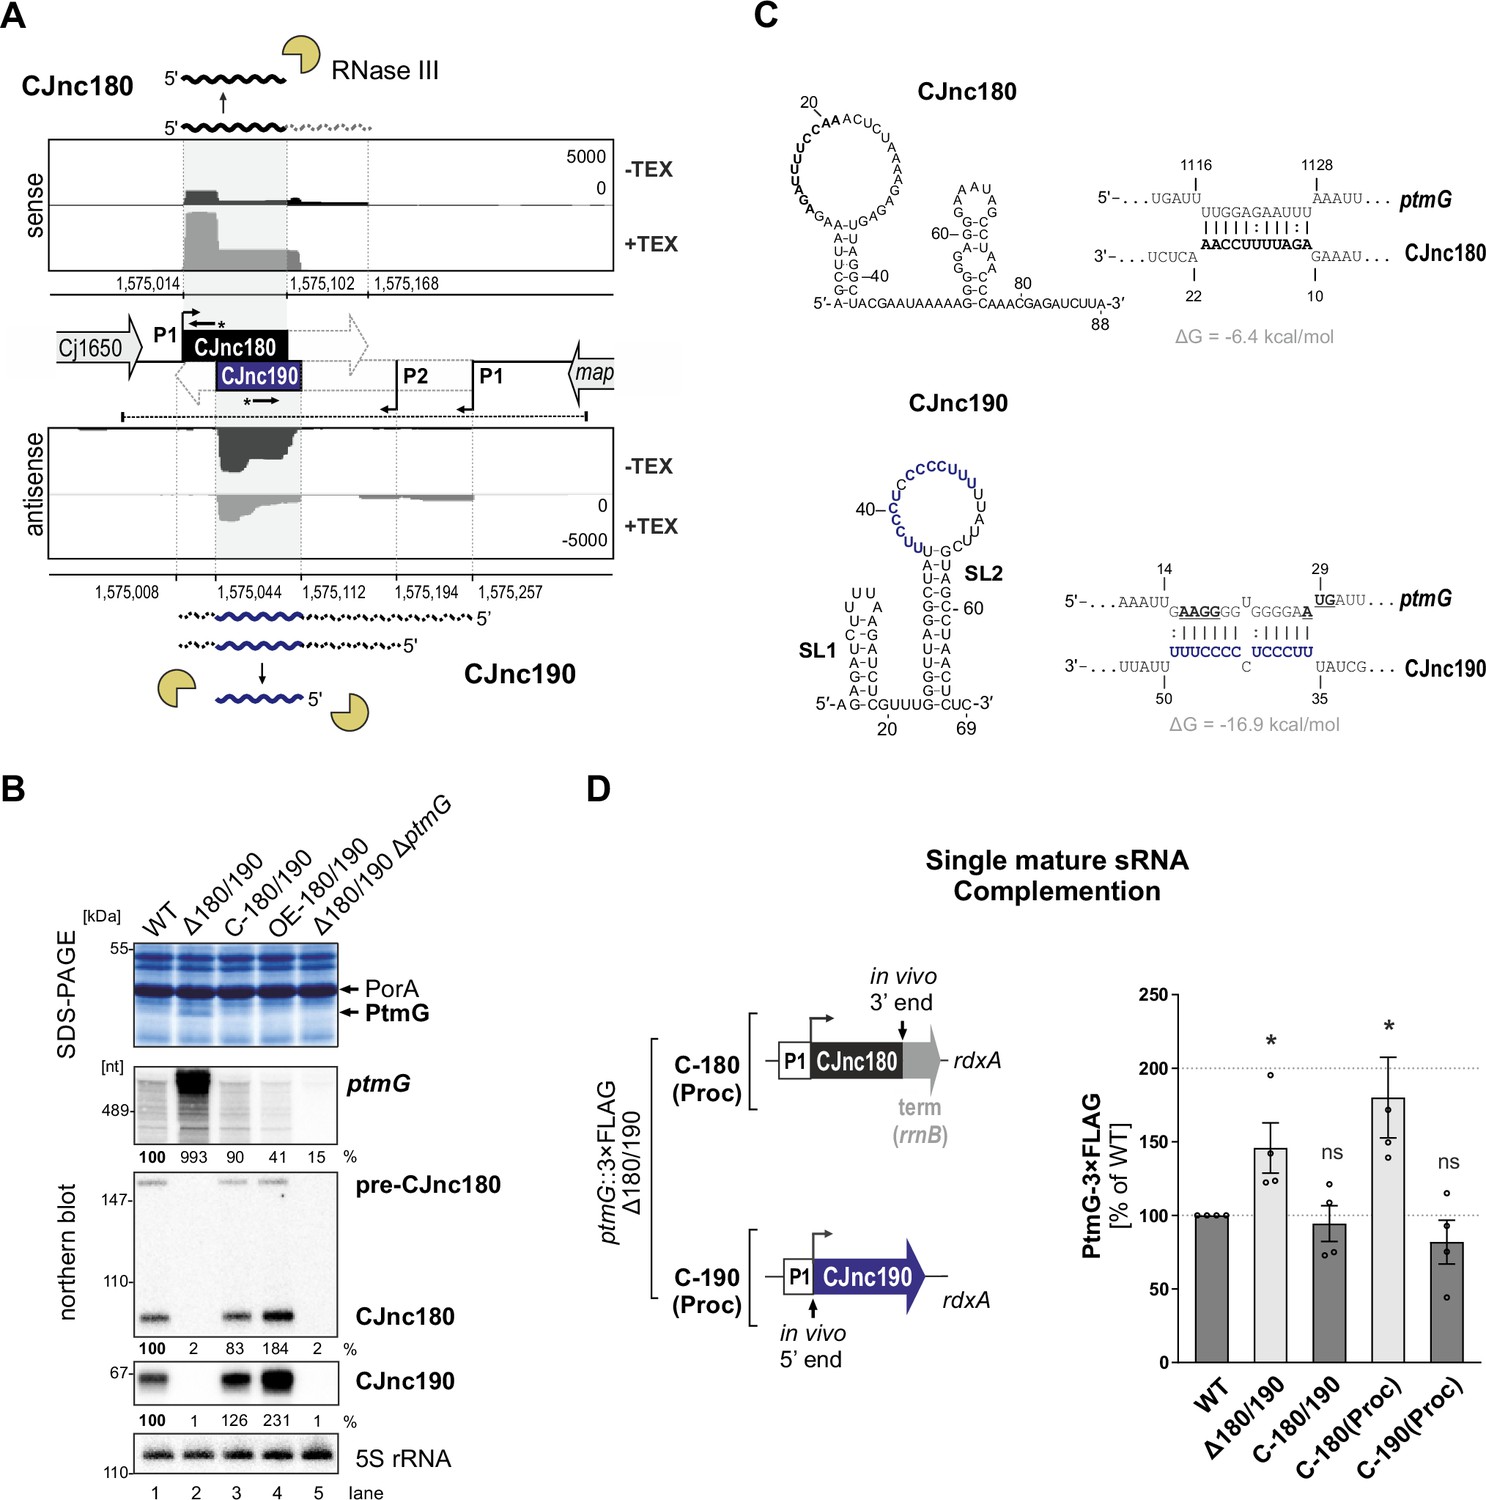
The processed CJnc190 sRNA represses ptmG expression.
(A) Differential RNA-seq (dRNA-seq) coverage for CJnc180 and CJnc190 sRNAs in Campylobacter jejuni NCTC11168 (Dugar et al., 2013). -/+ TEX: mock/treated terminator exonuclease (TEX) dRNA-seq libraries. TEX treatment degrades processed (non-triphosphorylated) 5’ ends, enriching 5’-triphosphorylated primary transcript ends at transcription start sites (TSS). Bent arrows: TSS. Black dashed line: genomic region used for complementation (C-180/190). Starred arrows: northern blot probes for mature sRNAs. P1/P2: promoter motifs. (B) SDS-PAGE and northern blot analyses of total protein and RNA, respectively, from C. jejuni wild-type (WT) and sRNA/ptmG mutant strains. Upregulated ~45 kDa PtmG and non-regulated PorA control are indicated. Probes for the mature sRNAs (CSO-0189/0185 for CJnc180/190), respectively (starred arrows, panel A), and the 5’ end of the ptmG ORF (CSO-1666) were used. As a loading control, 5S rRNA was probed with CSO-0192. OE, second-copy overexpression. (C) Predicted secondary structures (RNAfold) (Lorenz et al., 2011) and ptmG interactions (IntaRNA) (Mann et al., 2017) for mature CJnc180 and CJnc190. Bold/blue: potential ptmG pairing residues for CJnc180/CJnc190, respectively. Underlined: ptmG RBS/start codon. (D) Complementation of ptmG regulation in Δ180/190 with single mature sRNAs. (Left) To express CJnc180 only (C-180(Proc)), its mature 3’ end was fused to the Escherichia coli rrnB terminator; transcription is driven from its native promoter. For C-190(Proc), the mature CJnc190 5′ end was fused to its annotated TSS (P1 promoter) and 125 nucleotides upstream. (Right) PtmG-3×FLAG levels measured by western blotting. Error bars represent standard error of the mean (SEM) of four independent replicates. *: p < 0.05, ns: not significant, vs. WT. See also Figure 1—figure supplement 4A.
-
Figure 1—source data 1
Full northern and western blot images for the corresponding detail sections shown in Figure 1, raw data for western blot quantifications, and mature CJnc180/CJnc190 and ptmG target sequences used for interaction predictions.
- https://cdn.elifesciences.org/articles/69064/elife-69064-fig1-data1-v2.zip
Figure 1—figure supplement 1
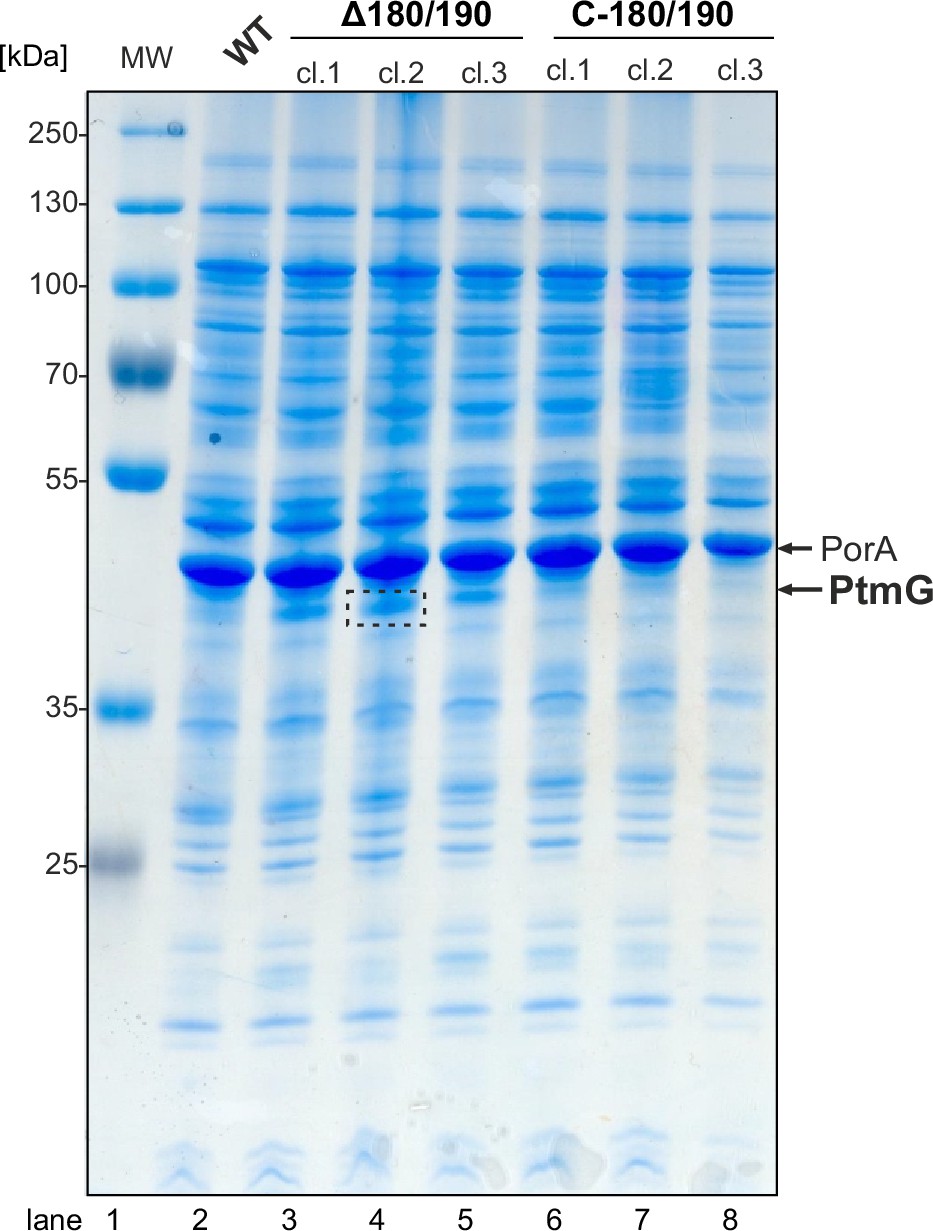
Identification of CJnc180/190 targets by SDS-PAGE and mass spectrometry analysis.
Samples were harvested for total protein analysis from the wild-type (WT) strain and three independent clones (cl.) of Δ180/190 and C-180/190 in mid-exponential phase (OD600 approx. 0.5). Proteins from 0.1 OD600 of cells were separated per well on a 12% SDS-polyacrylamide gel and stained with PageBlue. The region surrounded by the dashed box was excised and subjected to trypsin digestion and mass spectrometry for identification of Campylobacter jejuni proteins (see Supplementary file 1a). PorA served as a loading control. MW: prestained protein molecular weight ladder.
-
Figure 1—figure supplement 1—source data 1
Full image of SDS-PAGE used for mass spectrometry analysis.
- https://cdn.elifesciences.org/articles/69064/elife-69064-fig1-figsupp1-data1-v2.zip
Figure 1—figure supplement 2
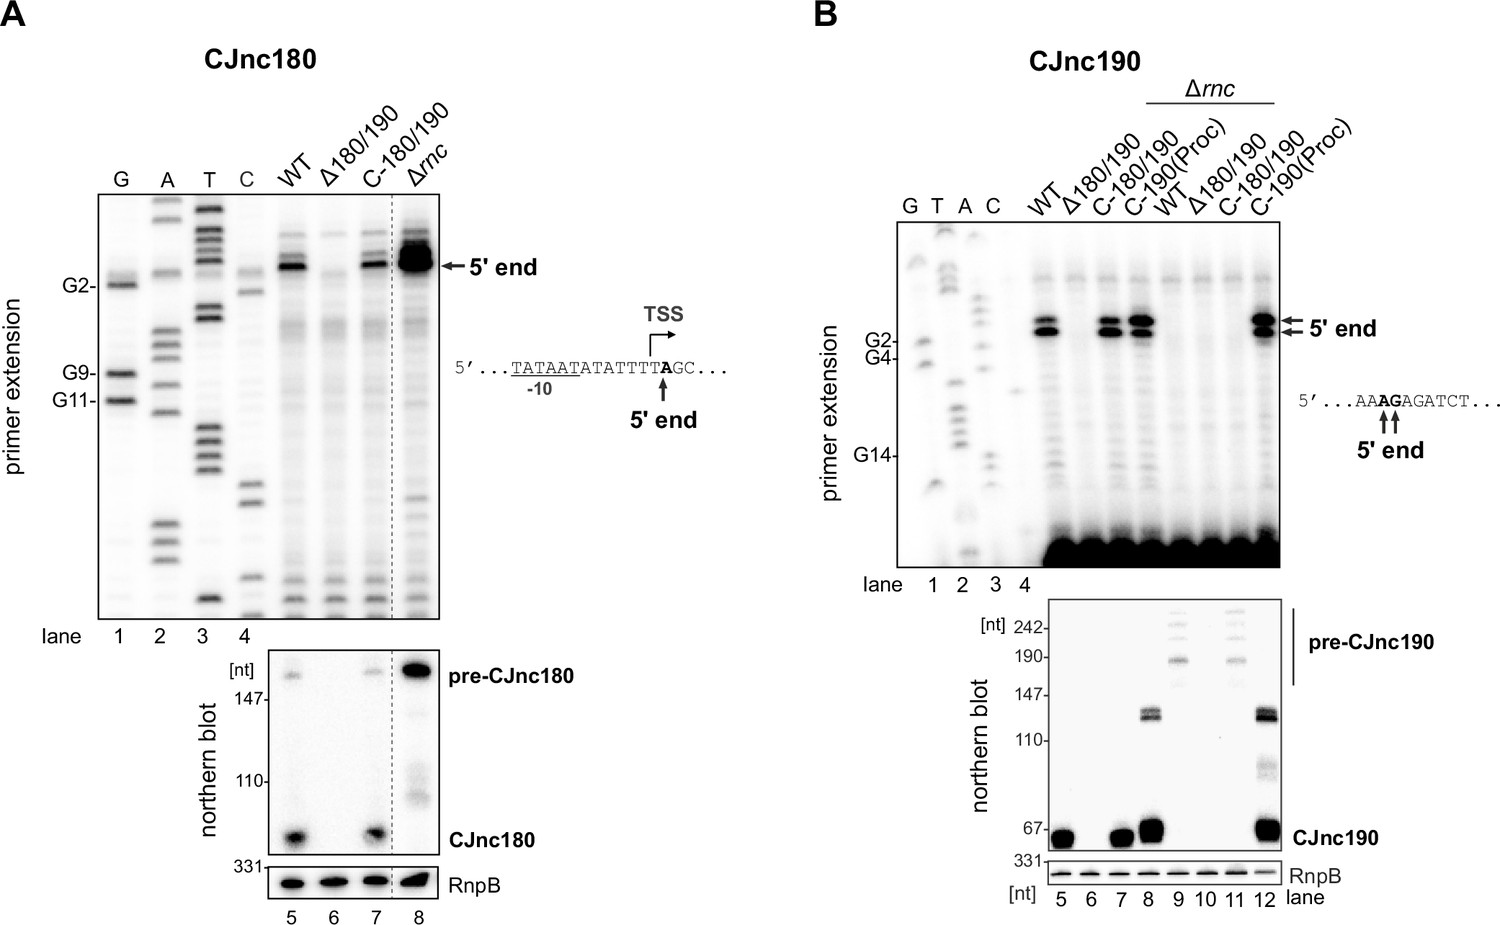
Mapping 5′ boundaries of mature CJnc180 and CJnc190 by primer extension.
(A) Total RNA from Campylobacter jejuni NCTC11168 wild-type (WT), Δ180/190, Δ180/190 complemented with CJnc180/190, or Δrnc was subjected to primer extension analysis with a probe annealing to mature CJnc180 (CSO-0189). (B) Total RNA from WT, Δ180/190, and Δ180/190 complemented with CJnc180/190 or CJnc190(Proc) (see main Figure 1D) was subjected to primer extension analysis with a probe annealing to mature CJnc190 (CSO-0185). For both panels, the arrows mark detected 5’ ends, which are also displayed in relation to annotated transcription start sites (TSS) (Dugar et al., 2013) and promoter –10 box or nucleotide sequence to the right. Lanes 1–4: CJnc180/190 sequencing ladders generated with the same probe. Northern blots of the same RNA samples were also probed with the oligonucleotides used for primer extension (CSO-0189/CSO-0185 for CJnc180/190) and RnpB as a loading control (CSO-0497). For panel A, intervening lanes were cropped from the gel/blot pictures (vertical dashed line).
-
Figure 1—figure supplement 2—source data 1
Full northern blot and primer extension images for the corresponding detail sections shown in Figure 1—figure supplement 2.
- https://cdn.elifesciences.org/articles/69064/elife-69064-fig1-figsupp2-data1-v2.zip
Figure 1—figure supplement 3
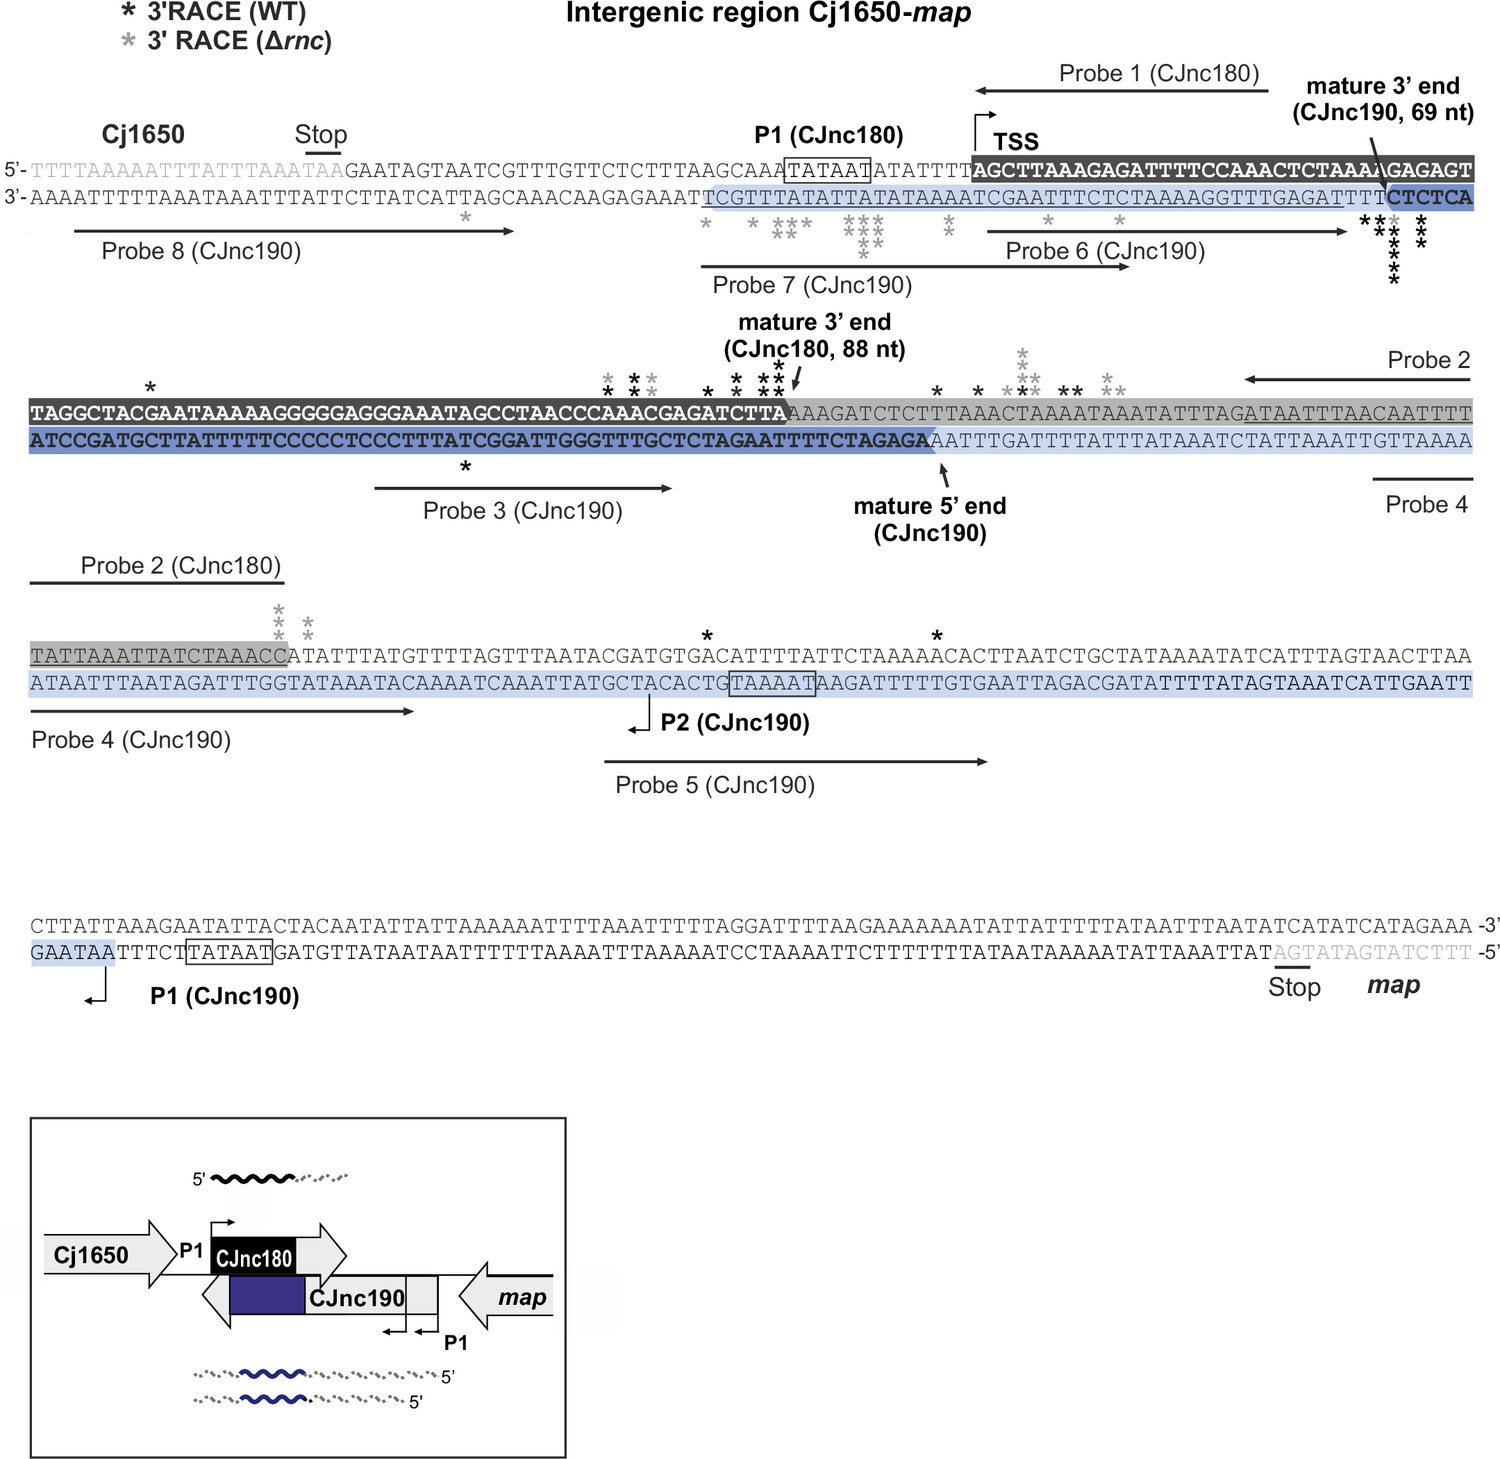
Identification of CJnc180/CJnc190 3’ ends by RACE (rapid amplification of cDNA ends).
An RNA linker was ligated to 3′ ends of total RNA from wild-type (WT) or Δrnc, followed by reverse transcription and PCR with linker/sRNA-specific primers. Cloned amplicons were sequenced to locate 3’ end-linker junctions. Asterisks indicate 3′ ends detected in single RACE clones in WT (black) or Δrnc (gray). Bent arrows: transcription start sites. Northern blot probe-binding sites are underlined (Probes 1–8, see also Figure 3—figure supplement 2). Black/dark blue highlighted residues: mature CJnc180/190. Light gray/blue highlighted residues: regions present only in CJnc180/190 precursors.
Figure 1—figure supplement 4
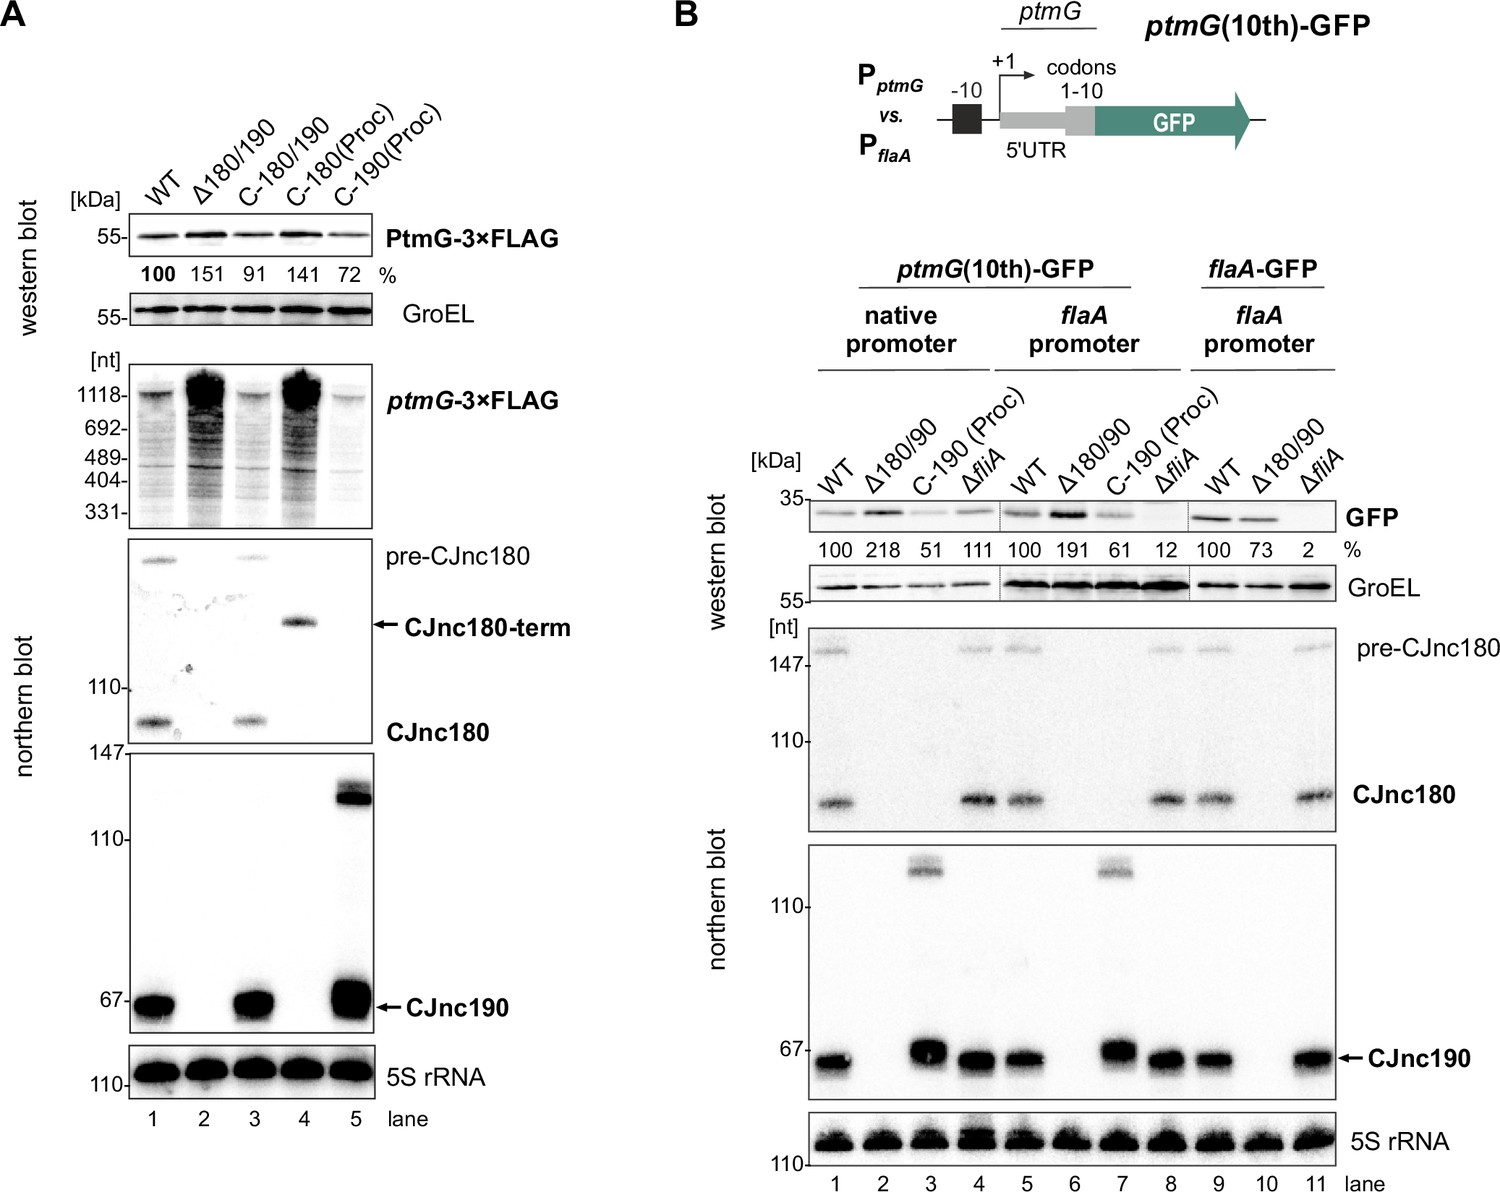
Post-transcriptional regulation of ptmG by CJnc190.
(A) CJnc190 is sufficient to repress ptmG. Related to main Figure 1D. Total protein and RNA samples were harvested from the indicated strains, and PtmG-3×FLAG levels were measured by western blotting with an anti-FLAG antibody. GroELwas measured as a loading control. Northern blot analysis confirmed the expression of a mature CJnc180-rrnB terminator fusion and a mature CJnc190-promoter P1 fusion (Figure 1D). ‘Mature’ CJnc190 expressed in this context appears slightly longer than in wild type (WT). This is likely due to 3′ end differences, as its 5’ end was confirmed to be the same as in WT by primer extension (Figure 1—figure supplement 2B, lane 8). A putative transcriptional readthrough product (>110 nt) was also detected. (B) Promoter independence of CJnc190 ptmG regulation. A ptmG(10th)-GFP translational reporter expressed from either the native ptmG promoter or the unrelated FliA (σ28)-dependent flaA promoter was measured by western blotting in WT, Δ180/190, or C-190(Proc) strains. The 5′UTR (24 nt) and first 10 codons of ptmG were fused to the second codon of GFP and introduced into the unrelated Cj0046 locus (Kim et al., 2008) in a ΔptmG background. CJnc190(Proc) was expressed from rdxA. As a control, a PflaA-flaA 5′UTR GFP reporter was also included (lanes 9–11); the gene encoding σ28 (fliA) was also deleted (lanes 4, 8, 11). The PtmG(10th)-GFP reporter was detected with an anti-GFP antibody, as well as GroEL as a loading control. For all northern blots, probes for mature CJnc180/190 (CSO-0189/0185) and the 5′ end of the ptmG ORF (CSO-1666) or GFP (CSO-0789) were used, while 5S rRNA (CSO-0192) served as a loading control.
-
Figure 1—figure supplement 4—source data 1
Full northern and western blot images for the corresponding detail sections shown in Figure 1—figure supplement 4.
- https://cdn.elifesciences.org/articles/69064/elife-69064-fig1-figsupp4-data1-v2.zip
-
Figure 1—figure supplement 4—source data 2
Full northern and western blot images for the corresponding detail sections shown in Figure 1—figure supplement 4.
- https://cdn.elifesciences.org/articles/69064/elife-69064-fig1-figsupp4-data2-v2.zip
Figure 2 with 1 supplement

CJnc190 represses translation of ptmG via base-pairing with its G-rich ribosome-binding site (RBS).
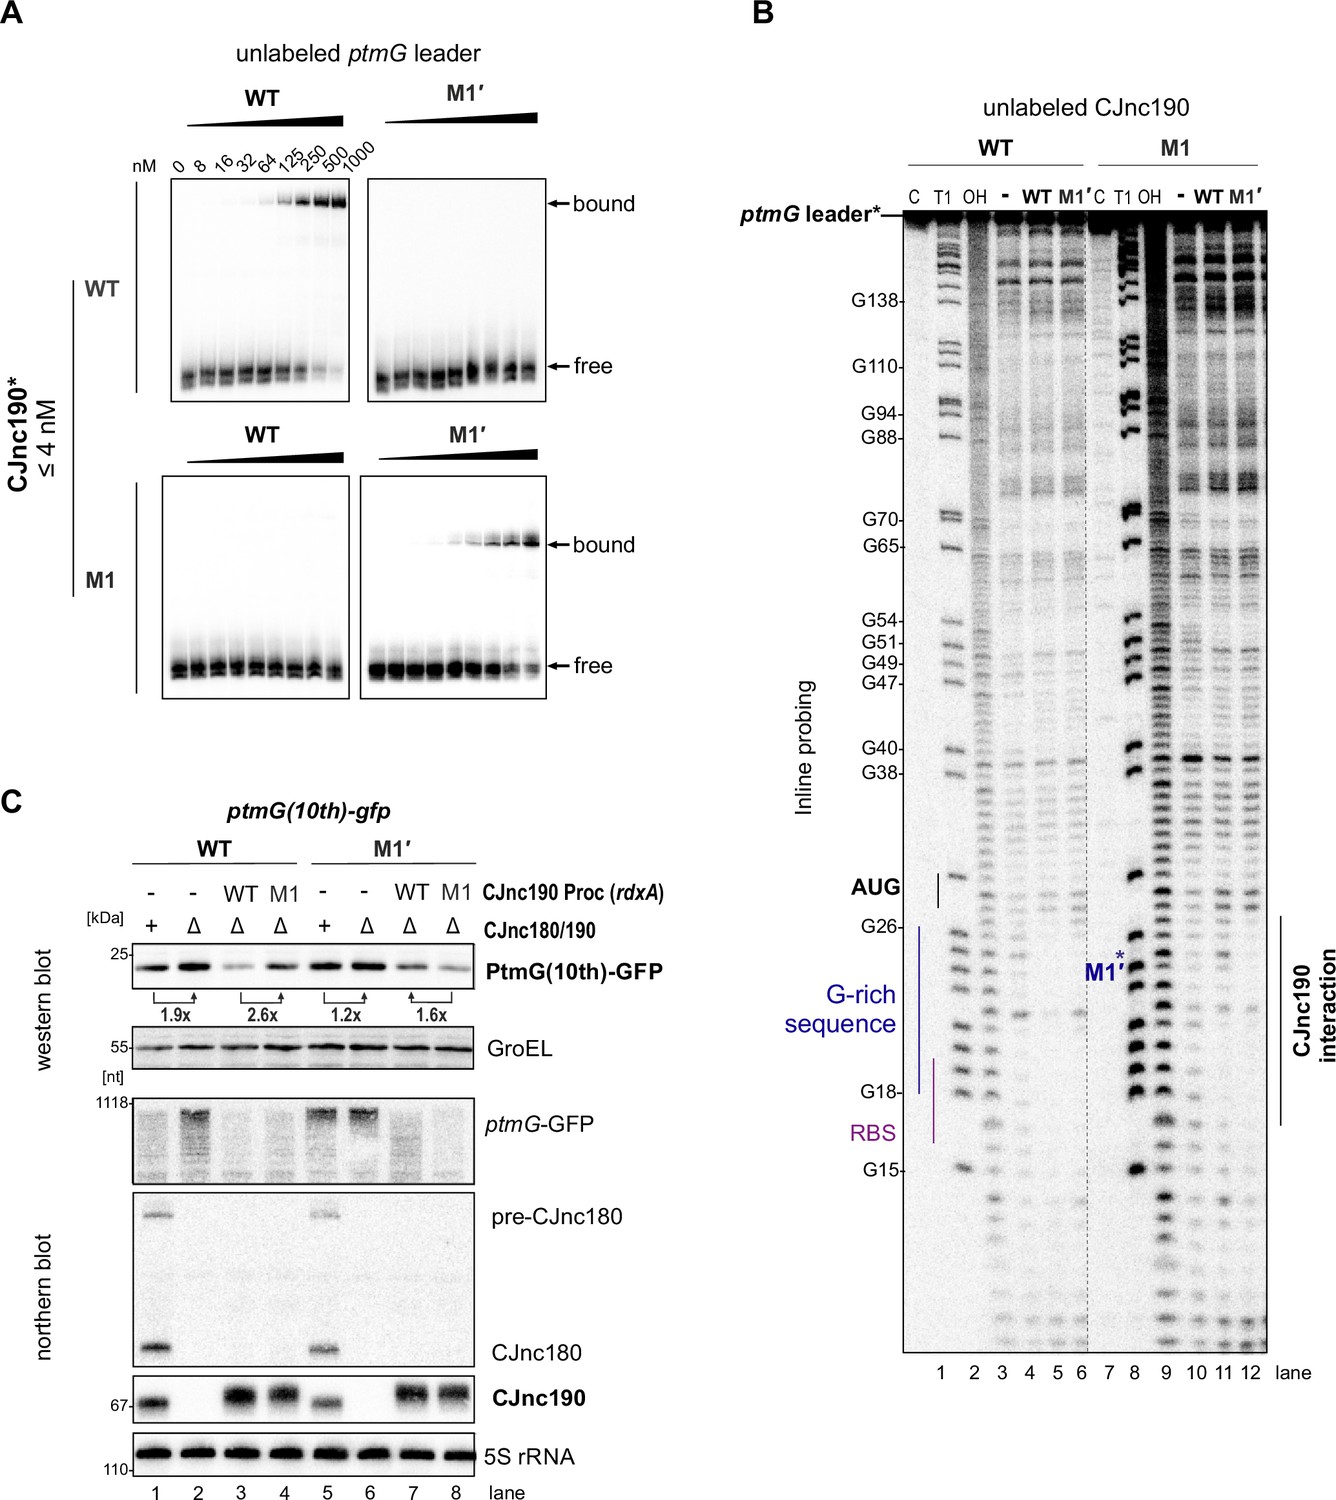
(A) CJnc190 secondary structure based on Inline probing (panel C) and interaction with the ptmG leader showing mutations (M1/M1′) introduced into the interaction site. Circled residues: single-stranded regions mapped by Inline probing. Blue/bold residues: ptmG/CJnc190 nucleotides protected in Inline probing (panel A and Figure 2—figure supplement 1B). RBS/start codon are underlined. (B) In vitro gel shift assay of 32P-5′-labeled (marked with *) ptmG leader (WT/M1′) with unlabeled CJnc190 WT/M1, as well as CJnc180, sRNAs. (C) Inline probing of 0.2 pmol 32P 5′-end-labeled CJnc190 sRNA in the absence or presence of 0.2/2/20 pmol unlabeled ptmG leader (WT/M1′). (C) Untreated control; T1 ladder – G residues (indicated on left); OH – all positions (alkaline hydrolysis). (D) In vitro translation of a ptmG(10th)-GFP reporter (5′ UTR and first 10 codons) of ptmG fused to gfpmut3 (2 pmol) in an Escherichia coli cell-free system ± CJnc190 (WT/M1; +: 2 pmol, ++: 20 pmol, +++: 100 pmol) detected by western blotting with an anti-GFP antibody. A Coomassie-stained gel of the same samples served as a loading control. (E) PtmG(10th)-GFP (WT/M1′) reporter expression in vivo ± mature CJnc190 (WT/M1) measured by western blot analysis. PtmG(10th)-GFP levels are the mean of three (left) or five (right) independent replicates, with error bars representing the SD. **: p < 0.01, *: p < 0.05, ns: not significant, vs. wild type (WT). See also Figure 2—figure supplement 1C.
-
Figure 2—source data 1
Full electrophoretic mobility shift assay (EMSA), Inline probing, western blot, and SDS-PAGE images for the corresponding detail sections shown in Figure 2, as well as raw values for western blot quantifications.
- https://cdn.elifesciences.org/articles/69064/elife-69064-fig2-data1-v2.zip
Figure 2—figure supplement 1
Direct repression of ptmG by CJnc190 via base-pairing.
(A) In vitro gel mobility shift assay of mature CJnc190 binding to the ptmG 5′ UTR. 32P-labeled (5′ end) CJnc190 in vitro transcript (wild type [WT]/M1, see main Figure 2A) was incubated with increasing amounts of unlabeled ptmG leader (WT/M1′). Bound/free complexes were separated on native gels. (B) Inline probing of CJnc190 interaction with ptmG. 32P-labeled (5′ end) ptmG leader in vitro transcript (0.2 pmol) (WT or M1′, see main Figure 2A) was incubated with unlabeled CJnc190 (WT/M1) under mild alkaline conditions. Cleavage products were analyzed on denaturing gels. Lanes 1–3: C, no addition; T1, G residues (RNase T1); OH, all positions (alkaline hydrolysis). G residues are numbered with respect to the ptmG transcription start site (TSS) (Dugar et al., 2013). The ptmG ribosome-binding site (RBS), start codon (AUG), G-rich sequence, M1′ mutation, and CJnc190 interaction site are labeled. (C) Compensatory exchange analysis of ptmG:CJnc190 interaction. Related to main Figure 2E. A ptmG(10th)-GFP translational reporter (Figure 1—figure supplement 2B) expressed from the Cj0046 locus was measured by western and northern blotting in a CJnc180/190 WT, Δ180/190, or C-190(Proc) (WT/M1, at rdxA) complemented background. The PtmG(10th)-GFP reporter was detected with an anti-GFP antibody. For northern blots, probes for mature CJnc180/190 (CSO-0189/0185) and the 5′ end of the ptmG ORF (CSO-1666) were used. GroEL served as a loading control for western blot analysis, while 5S rRNA served as a loading control on the northern blot (CSO-0192).
-
Figure 2—figure supplement 1—source data 1
Full electrophoretic mobility shift assay (EMSA), Inline probing, western blot, and SDS-PAGE images for the corresponding detail sections shown in Figure 2—figure supplement 1, as well as raw values for western blot quantifications.
- https://cdn.elifesciences.org/articles/69064/elife-69064-fig2-figsupp1-data1-v2.zip
Figure 3 with 3 supplements
RNase III processes CJnc190 precursors expressed from two promoters.
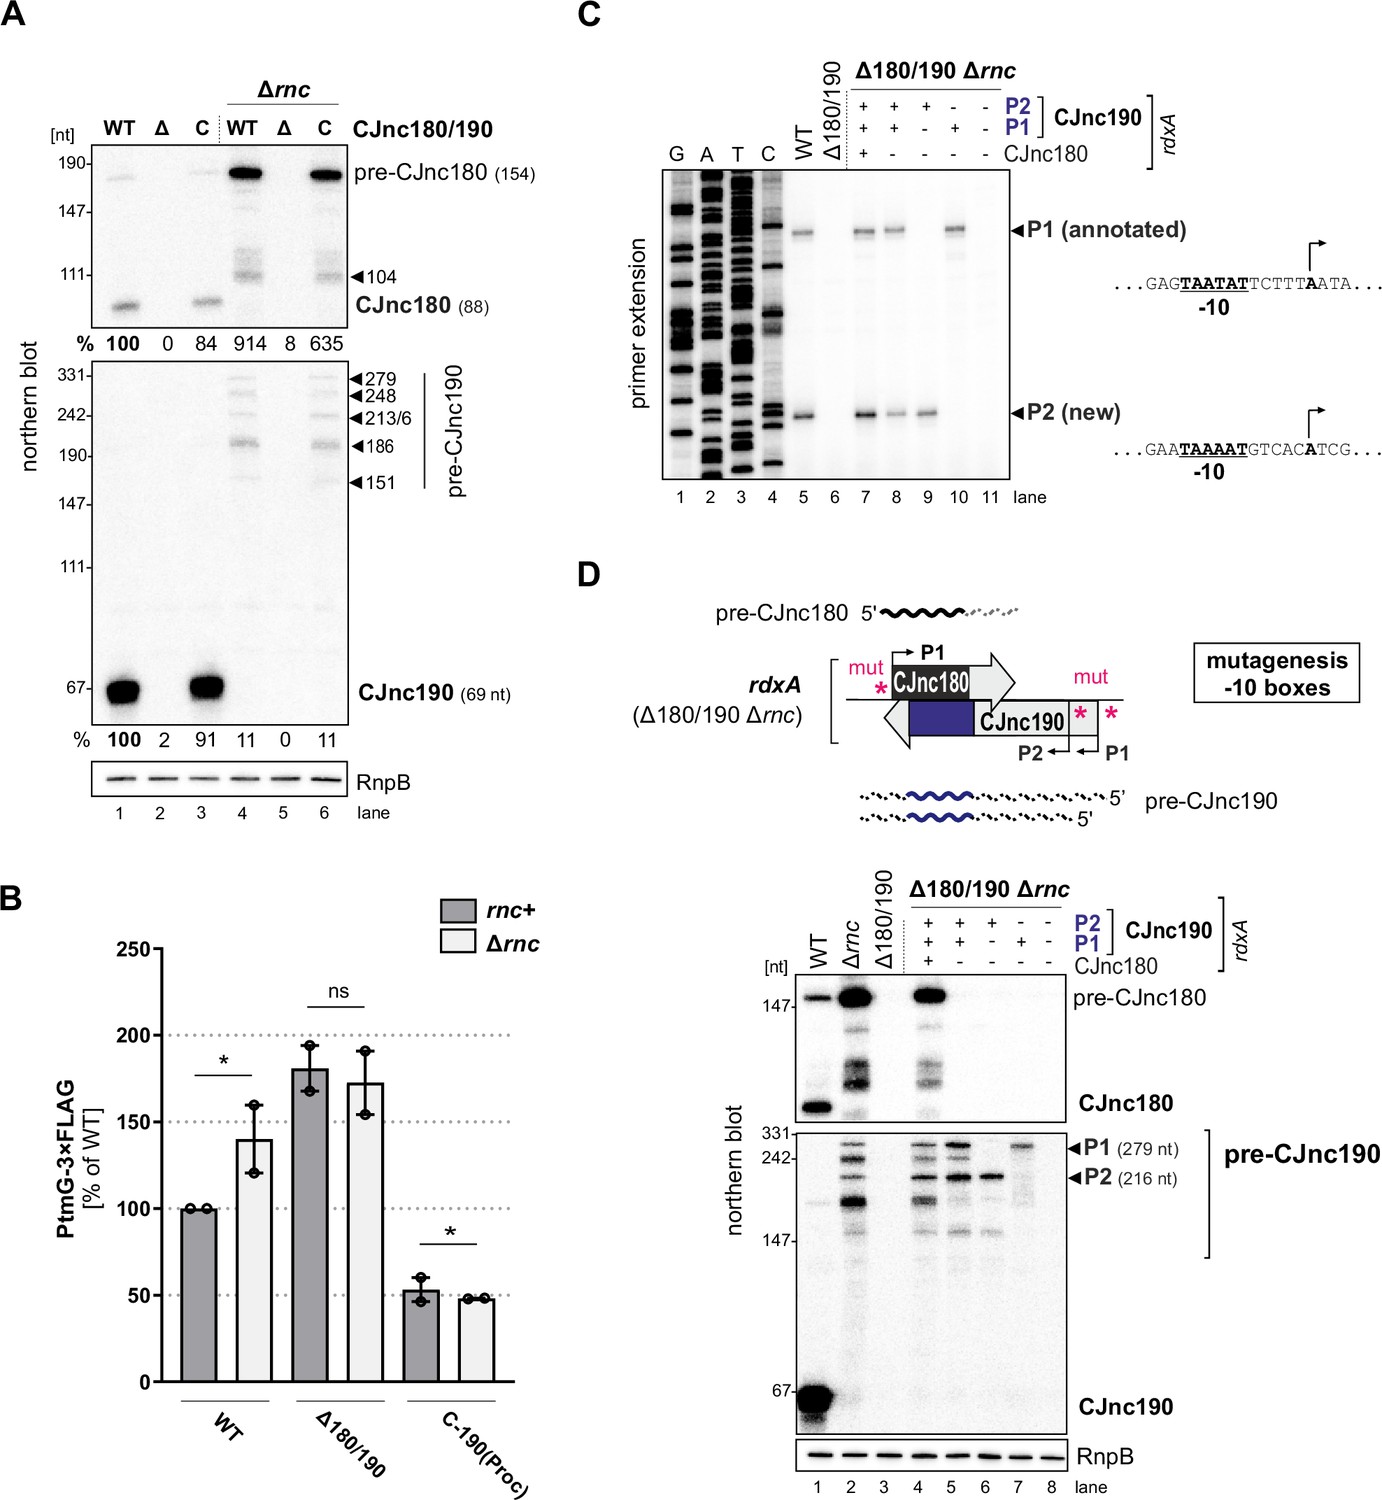
(A) Northern blot of CJnc180 and CJnc190 processing by RNase III in total RNA. Lengths are based on primer extension and 3’ RACE (rapid amplification of cDNA ends). Quantification is for all CJnc190 bands detected in a single strain combined. (B) Effect of rnc (RNase III) deletion on PtmG-3×FLAG levels in the absence or presence of CJnc180/190 sRNAs. Error bars represent the standard error of the mean (SEM) of two independent replicates. *: p < 0.1, ns: not significant, Student’s unpaired t-test. See also Figure 3—figure supplement 1B. (C) Primer extension analysis of pre-CJnc190 5′ ends in wild type (WT) and promoter mutant strains (Δrnc background). Total RNA was annealed with the same probe for mature CJnc190 used for northern blots (CSO-0185). A sequencing ladder was generated with the same probe (lanes 1–4). P1/P2: putative CJnc190 primary transcripts/5’ ends. The full gel is shown in Figure 3—figure supplement 3. (D) Validation of CJnc180/190 promoters. (Top) Strategy for testing CJnc180/190 promoter activity by complementation of Δ180/190 with –10 box mutant alleles at rdxA. ‘mut’ – several point mutations introduced into the predicted –10 box (see Supplementary file 1e for details). (Bottom) Northern blot analysis of pre-CJnc180/CJnc190 in sRNA promoter mutant strains (Δrnc background). (-/+): promoter mutant/WT. Probes for the mature sRNAs were used (CSO-0189/0185, respectively, for CJnc180/190; Figure 1A). RnpB served as loading control (probed with CSO-0497). For primer extension analysis of the same strains, see panel C.
-
Figure 3—source data 1
Full northern blot and primer extension images for the corresponding detail sections shown in Figure 3, as well as raw values for western blot quantifications.
- https://cdn.elifesciences.org/articles/69064/elife-69064-fig3-data1-v2.zip
Figure 3—figure supplement 1
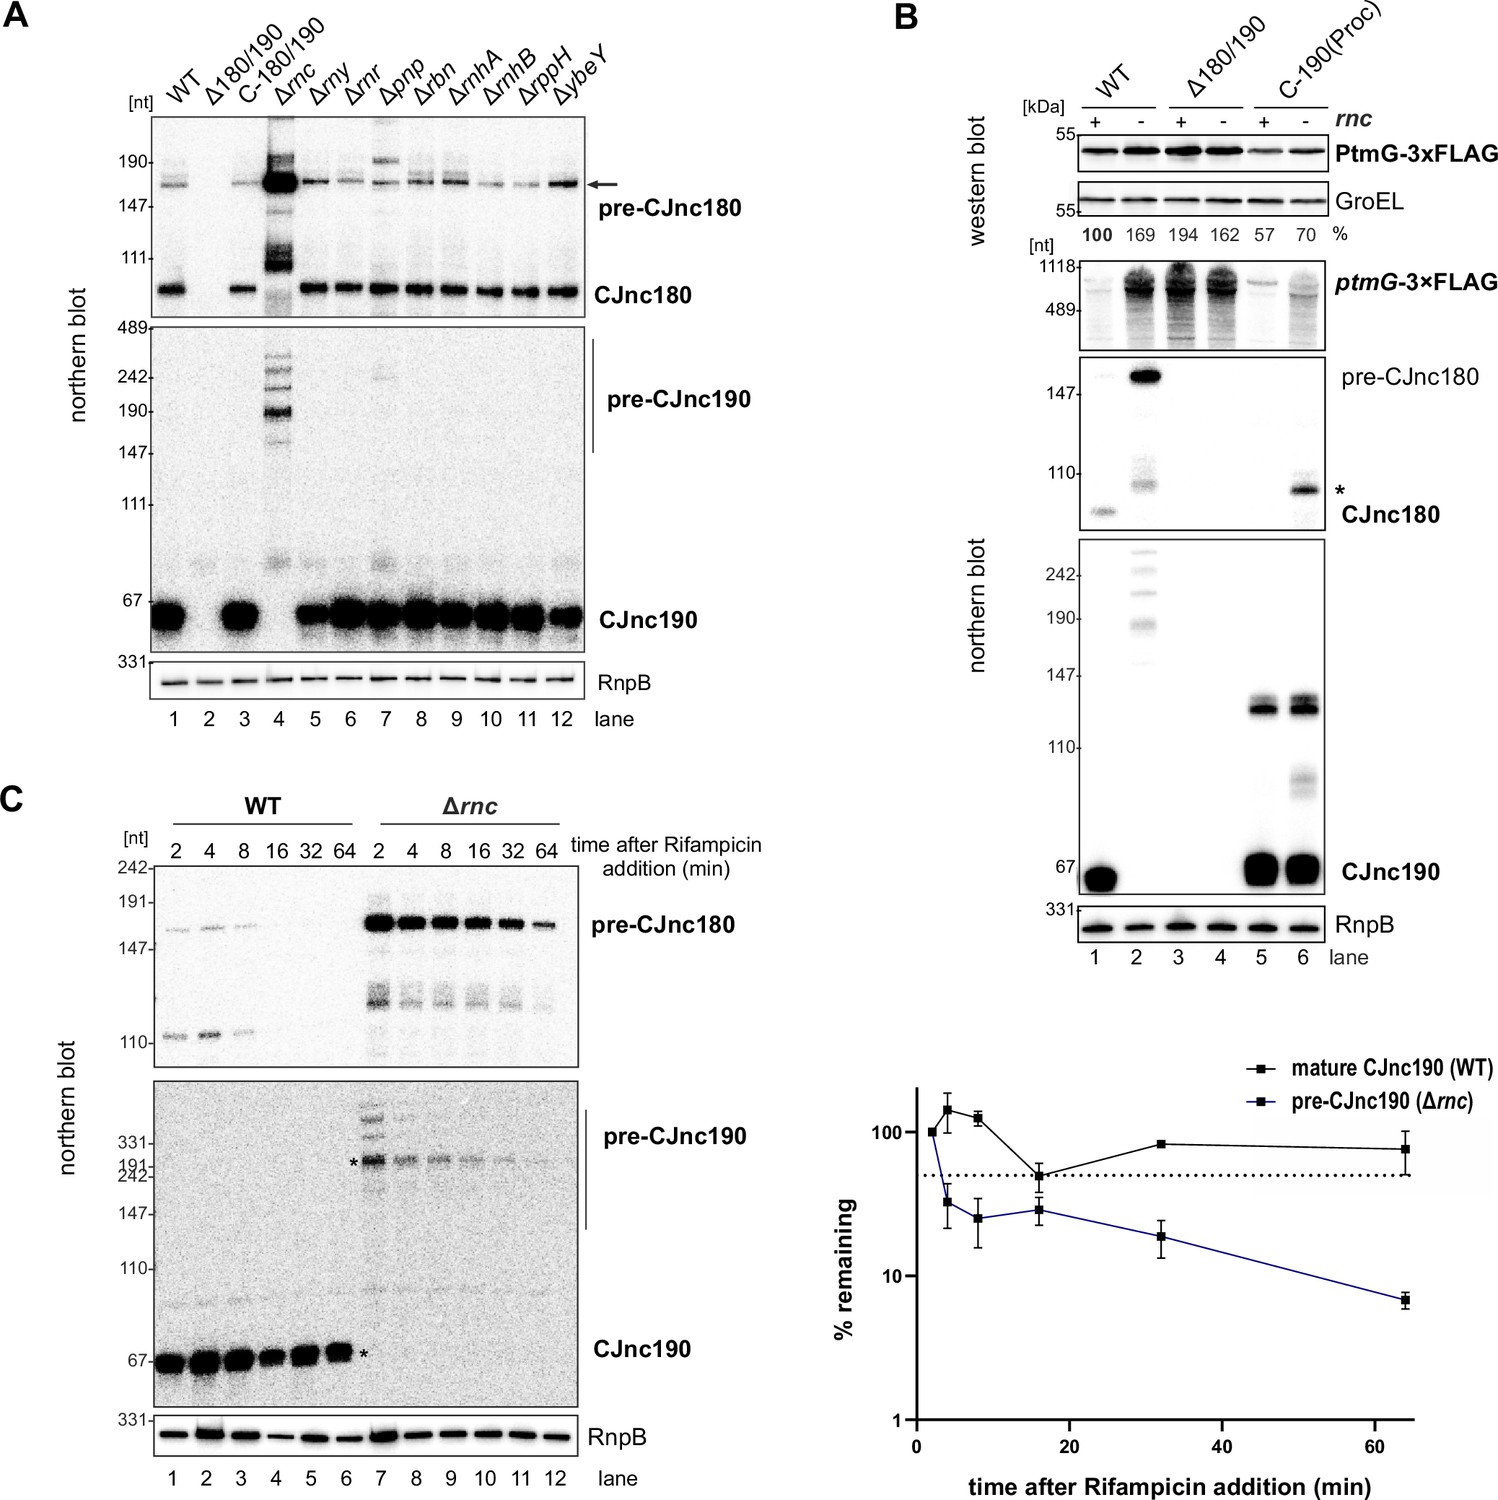
RNase III affects CJnc190 processing, stability, and ptmG regulation.
(A) Effect of deletions in genes encoding RNases and RNA-metabolism enzymes on CJnc180 and CJnc190 processing. Total RNA from wild type (WT) and the indicated Campylobacter jejuni NCTC11168 mutant strains grown to mid-log phase was analyzed by northern blotting. Gene products are as follows: rnc – RNase III (Cj1635c); rny – RNase Y (Cj1209), rnr – RNase R (Cj0631c); pnp – PNPase (Cj1253); rbn – RNase BN (Cj1212c); rnhA – RNase HI (Cj1636c); rnhB – RNase HII (Cj0010c); rppH – RNA 5' pyrophosphohydrolase (Cj0581); ybeY – endoribonuclease YbeY (Cj0121). (B) RNase III affects PtmG expression via CJnc190 processing. Related to main Figure 3B. PtmG-3×FLAG protein and transcript were measured in WT, Δ180/190, and C-190(Proc) strains (Δrnc/rnc+) by western and northern blot (CSO-1666), respectively. GroEL and RnpB (CSO-0497) served as loading controls for western and northern blots, respectively. The asterisk indicates a CJnc180 species still expressed from the C-190(Proc) construct. (C) RNA stability of CJnc180/190 in WT and Δrnc measured after transcription inhibition by rifampicin during logarithmic growth. Probes specific for processed CJnc180/190 (CSO-0189/0185) or the 5′ end of the ptmG ORF (CSO-1666) were used for all northern blots, while RNase P RNA (RnpB, RNase III-independent) was probed as a loading control (CSO-0497). (Right) Quantified bands with asterisks (left) with standard errors calculated from two independent replicates. Dashed line: 50% remaining.
-
Figure 3—figure supplement 1—source data 1
Full northern blot images for the corresponding detail sections shown in Figure 3—figure supplement 1, as well as raw values for northern blot quantifications.
- https://cdn.elifesciences.org/articles/69064/elife-69064-fig3-figsupp1-data1-v2.zip
Figure 3—figure supplement 2
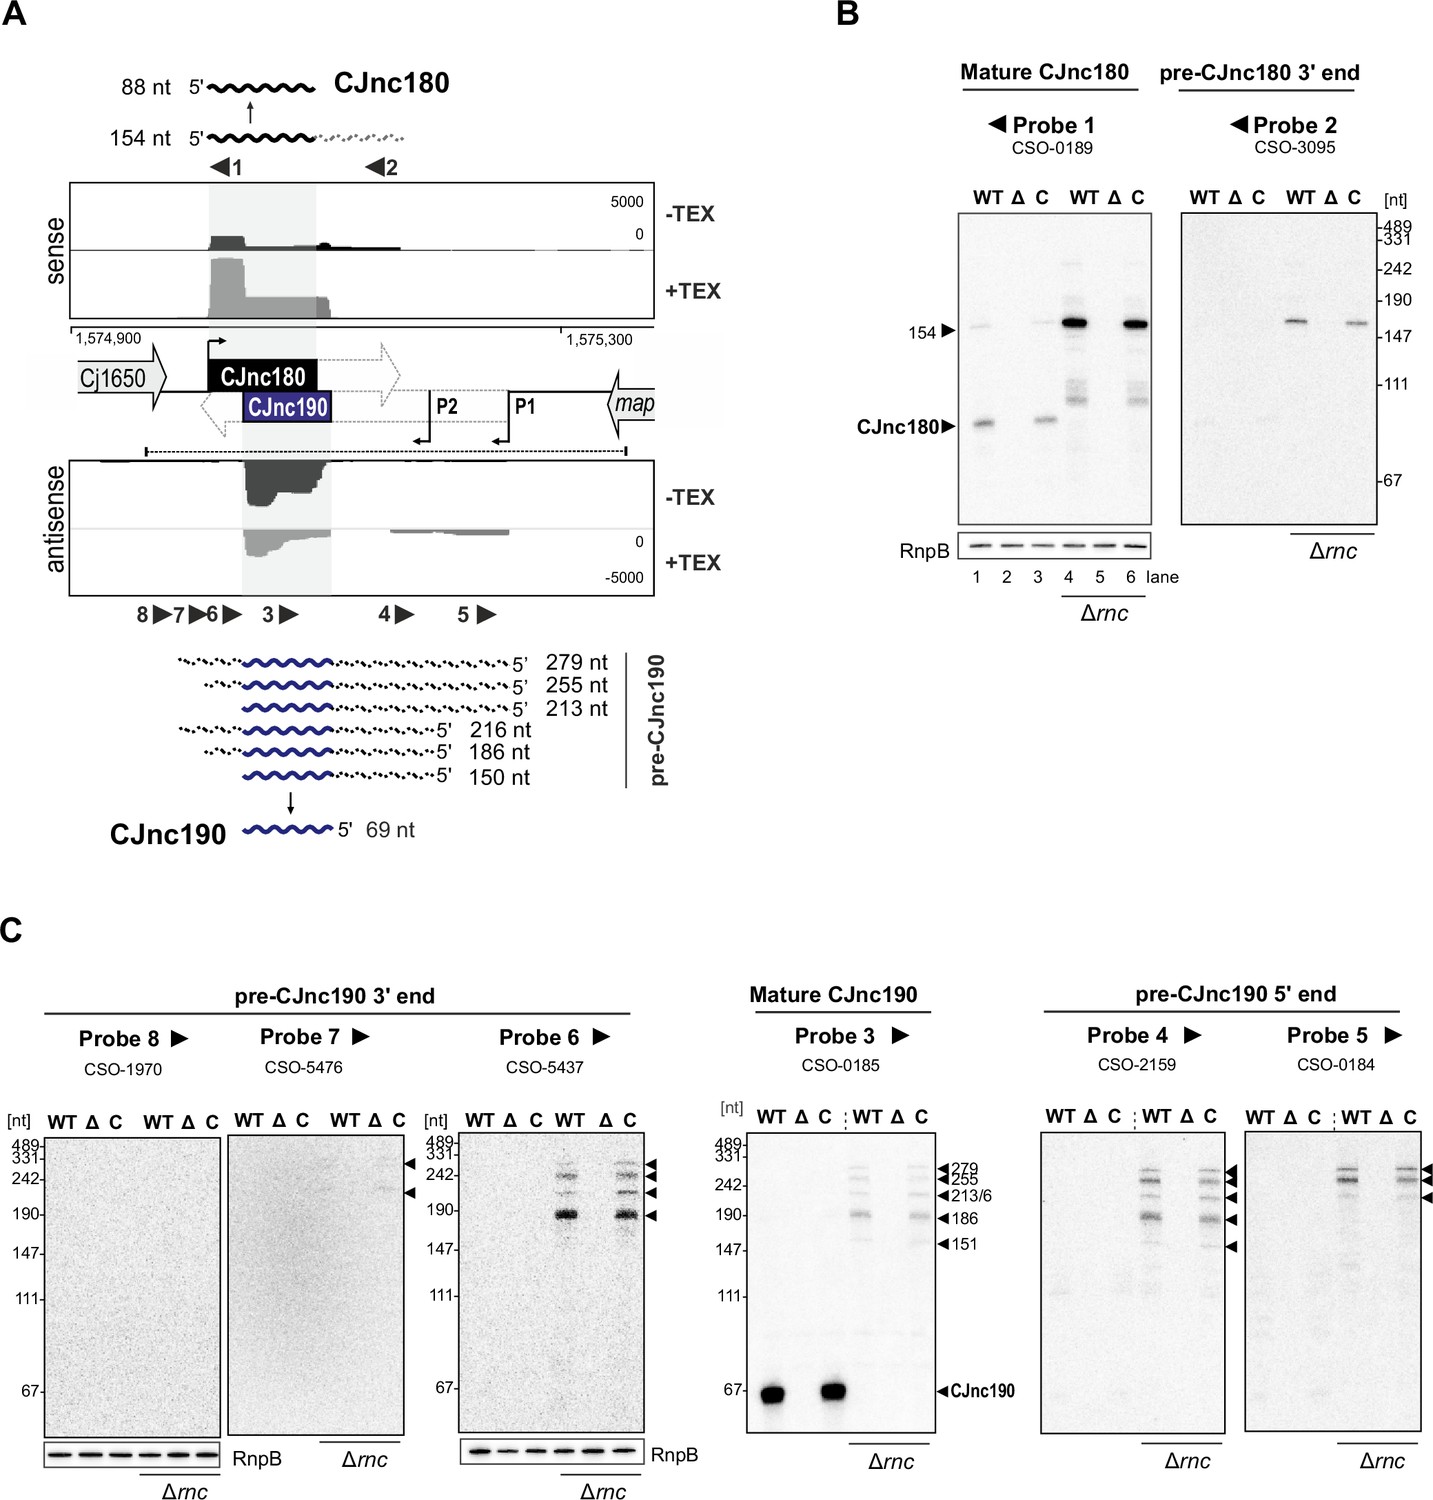
Northern blot analysis of mature/precursor CJnc180 and CJnc190.
(A) Approximate location of northern blot probes used in panels B and C and schematic of the detected CJnc180 and CJnc190 species in wild type (WT) and Δrnc backgrounds. See also Figure 1—figure supplement 3 for probe-binding sites. (B and C) Northern blot analysis of CJnc180 and CJnc190 for CJnc180/190 WT, deletion, and complementation strains in total RNA. Analysis was performed in both rnc+ and Δrnc backgrounds. All panels are the same RNA samples. Probings with CSO-0189,/3095 (panel B) and CSO-0185/2159/0184 (panel C) are on the same blot. CSO-5437 and CSO-5476/1970 were used to probe two additional blots with the same RNA samples. RnpB was also probed as a loading control (CSO-0497), and is shown only once for each blot.
-
Figure 3—figure supplement 2—source data 1
Full northern blot images for the corresponding detail sections shown in Figure 3—figure supplement 2.
- https://cdn.elifesciences.org/articles/69064/elife-69064-fig3-figsupp2-data1-v2.zip
Figure 3—figure supplement 3
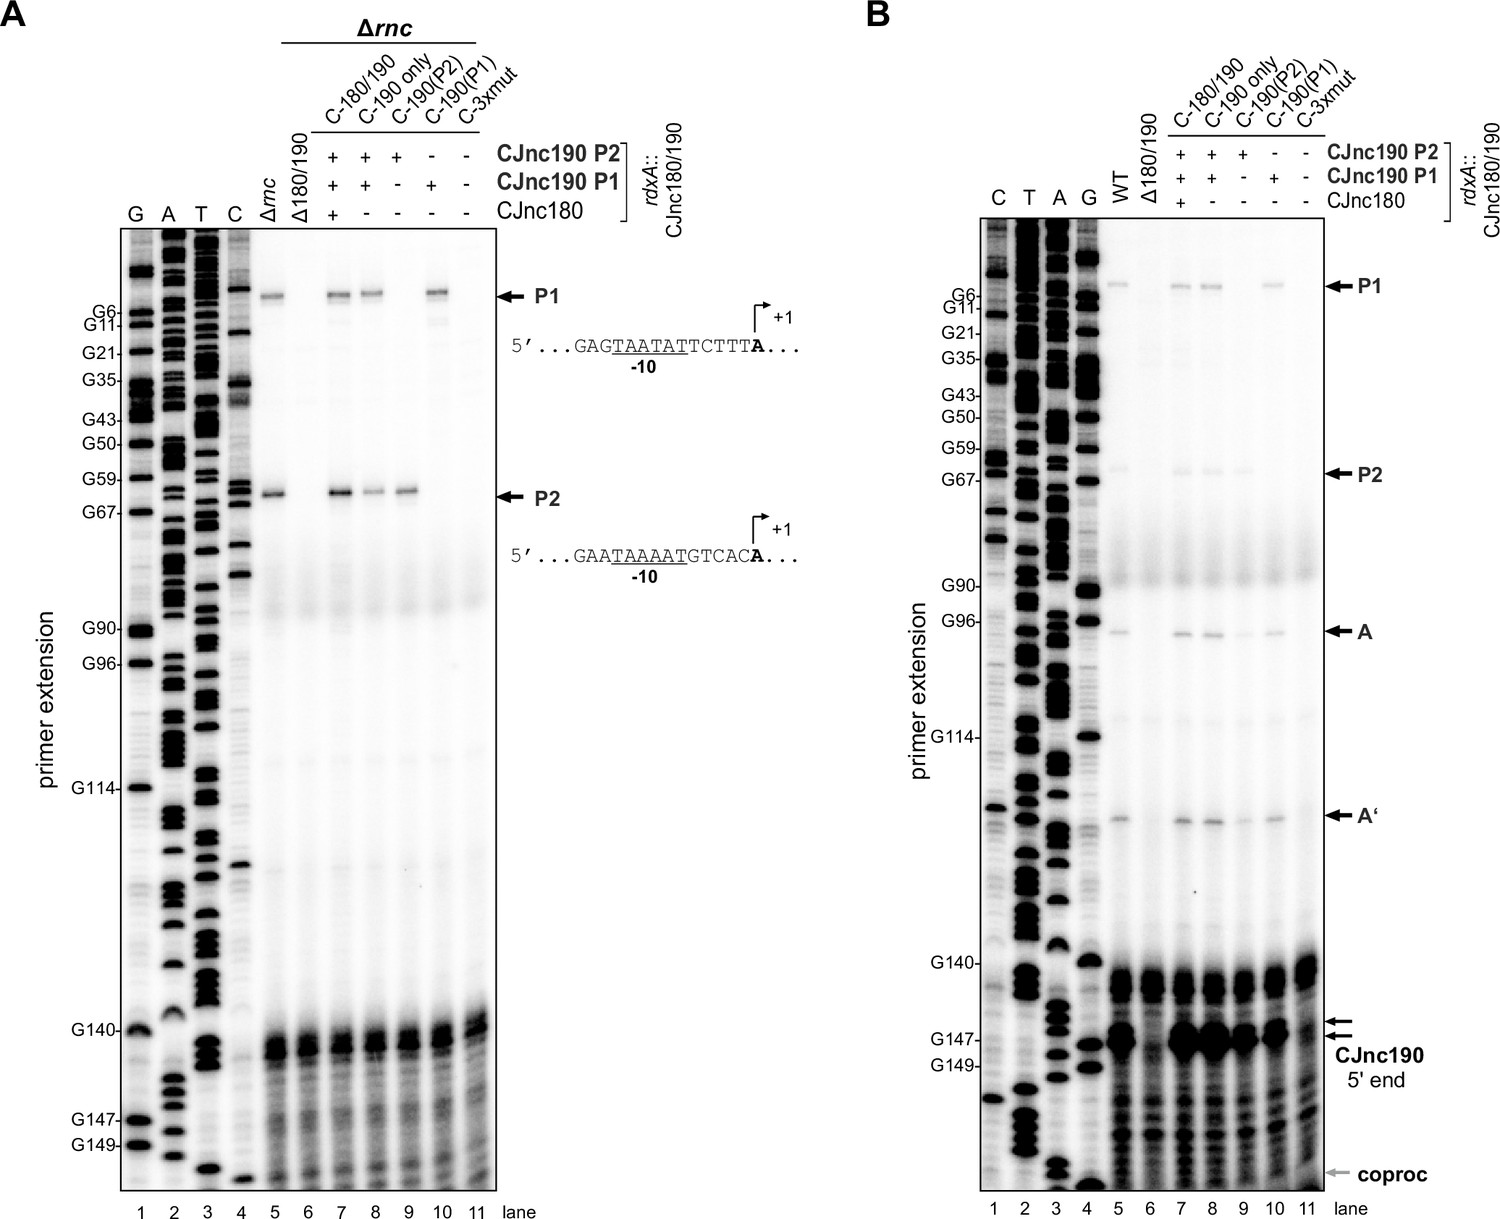
Mapping of CJnc190 mature and precursor 5’ ends in promoter mutants.
(A) Primer extension-based detection of pre-CJnc190 5’ ends for wild type (WT) and promoter mutant strains in a Δrnc background. Five-prime ends related to promoters P1 and P2 are indicated (right) together with their putative –10 boxes. Related to main Figure 3C. C-3×mut: strain complemented with CJnc180/190 region carrying point mutations in all three predicted promoter –10 boxes. (B) Primer extension analysis of CJnc190 5’ ends in an RNase III + background. Putative precursor 5’ ends (A/A’, Figure 5A) and where a putative co-processing site (coproc, see Figure 6A) would be visible are indicated on the right. For both panels, total RNA was subjected to primer extension with a probe annealing to mature CJnc190 (CSO-0185). Samples for both panels were run on the same gel with the same sequencing ladder generated from the same probe and the CJnc180/190 region of Campylobacter jejuni NCTC11168 (lanes 1–4), but the gel was cut and separated into Δrnc and WT background sample panels for clarity. G residues (numbered based on the P1 primary transcript) are indicated on the left.
-
Figure 3—figure supplement 3—source data 1
Full primer extension images for the corresponding detail sections shown in Figure 3—figure supplement 3.
- https://cdn.elifesciences.org/articles/69064/elife-69064-fig3-figsupp3-data1-v2.zip
Figure 4

CJnc180 requires its antisense partner for RNase III-mediated processing, while CJnc190 processing is CJnc180-independent.
Top of both panels: Approach for testing processing in the presence/absence of the antisense partner using promoter mutant alleles. ‘mut’ – several point mutations introduced into the –10 box (see Supplementary file 1e for details). (A) Northern blot analysis of pre-CJnc190 processing in vivo in the presence/absence CJnc180. The Δ180/190 strain was complemented at rdxA with wild type (WT) or CJnc180/190 promoter mutant alleles in an rnc+ background. (+/-) indicates if a promoter in the CJnc180/190 allele is WT/mutant. (B) Pre-CJnc180 processing in the presence or absence of CJnc190. Pre-CJnc180 was introduced into rdxA of a Δ180/190 strain. Different CJnc190 species were expressed from the unrelated Cj0046 pseudogene locus. For northern blot detection of CJnc180 and CJnc190, probes for the mature sRNAs were used (CSO-0189 and CSO-0185, respectively). RnpB (probed with CSO-0497) served as a loading control.
-
Figure 4—source data 1
Full northern blot images for the corresponding detail sections shown in Figure 4, as well as raw values for northern blot quantifications.
- https://cdn.elifesciences.org/articles/69064/elife-69064-fig4-data1-v2.zip
Figure 5 with 2 supplements
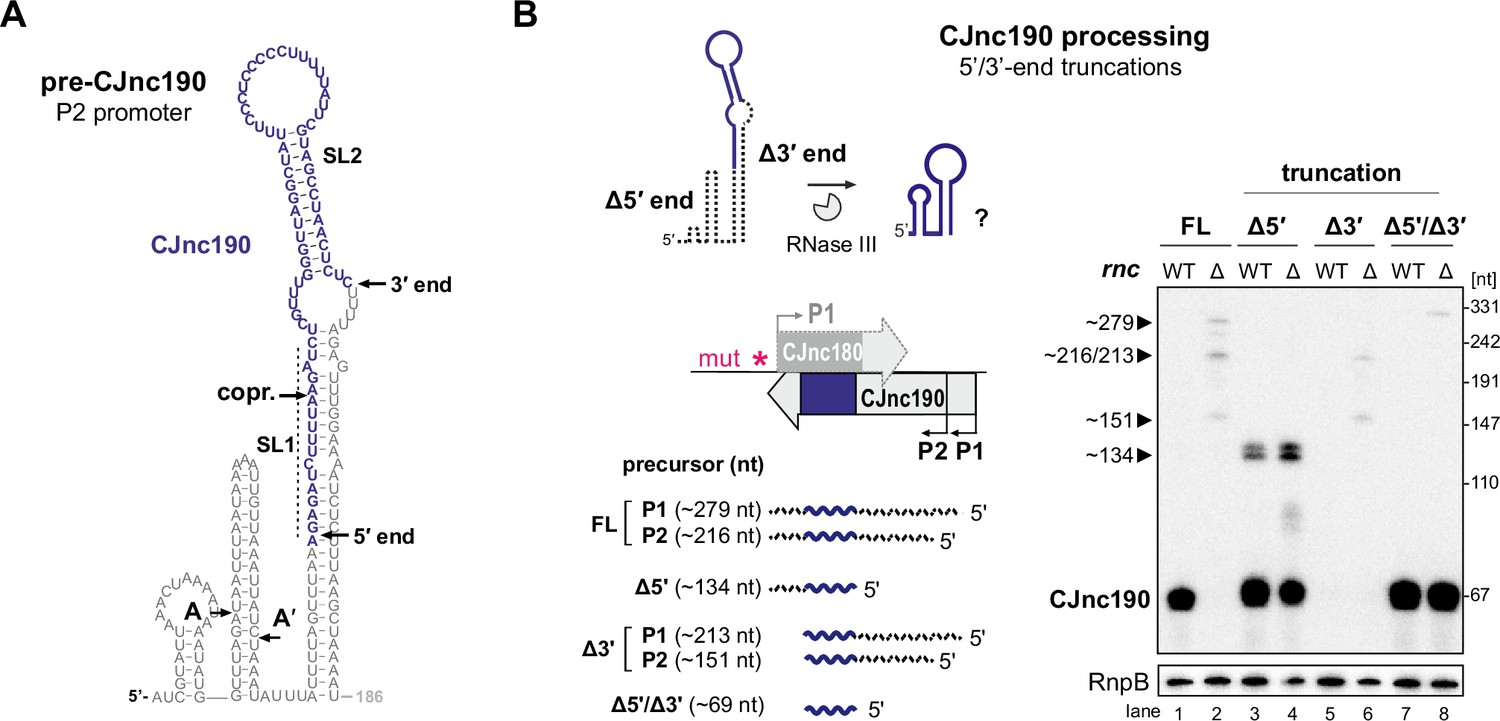
Intramolecular duplex-mediated processing of CJnc190.
(A) Predicted secondary structure of the 186 nucleotide (nt) pre-CJnc190 precursor transcribed from P2. Blue residues: mature sRNA. A/A’: putative intermediate 5’ ends identified by primer extension (Figure 3—figure supplement 3B). A putative co-processing site (“copr.”) with CJnc180 (see Figure 6A, bottom) is indicated. (B) Both 5′ and 3′ ends of CJnc190 are required for processing in vivo. (Bottom left) CJnc190 (without CJnc180) was expressed from the rdxA locus in Δ180/190 as full-length (FL) or as three versions with truncations at the mature sRNA ends (Δ5’, Δ3’). For 5’ truncations, CJnc190 was fused to its P1 promoter. ‘mut’ – several point mutations introduced into the predicted CJnc180 –10 box (see Supplementary file 1e for details). (Right) CJnc190 expression and processing was detected by northern blotting with a probe for the mature sRNA (CSO-0185), while RnpB (CSO-0497) served as a loading control. Total RNA from strains expressing CJnc190 versions on the left were analyzed in an Rnc+ (WT) or Δrnc background. The expected size of each unprocessed precursor is indicated on the left.
-
Figure 5—source data 1
Full northern blot images for the corresponding detail sections shown in Figure 5.
- https://cdn.elifesciences.org/articles/69064/elife-69064-fig5-data1-v2.zip
Figure 5—figure supplement 1
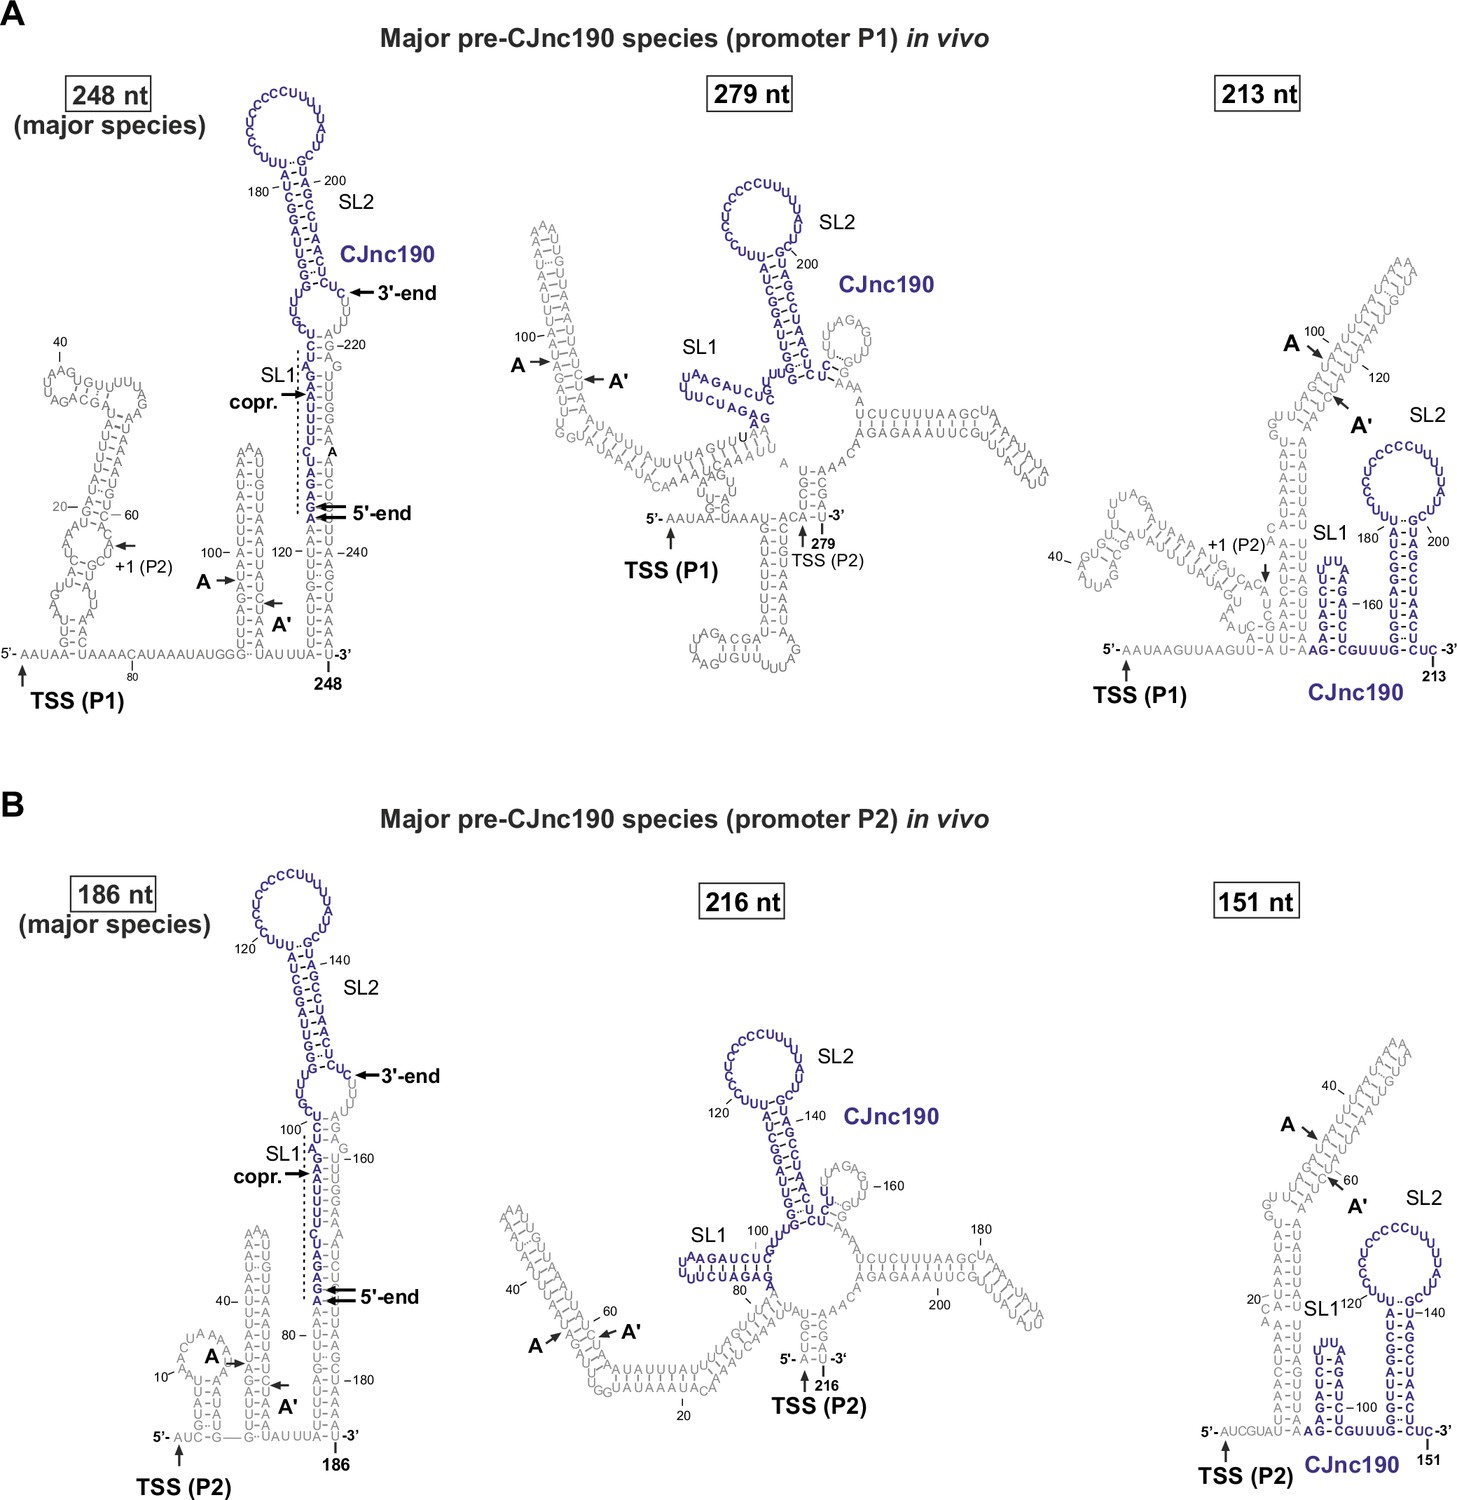
Predicted secondary structures of diverse pre-CJnc190 species detected in vivo.
Secondary structures of CJnc190 species transcribed from promoter P1 (A) and P2 (B) as suggested by primer extension and 3′ RACE (rapid amplification of cDNA ends) (Figure 1—figure supplement 2 and 3), as well as northern blotting (Figure 3A), in Δrnc. The most abundant species for P1 and P2 (based on analysis in the presence of CJnc180) are indicated. Secondary structures were predicted using the RNAfold server of Vienna RNA tools (Lorenz et al., 2011). (A/A′): potential intermediate RNase III cleavage sites (see Figure 5—figure supplement 2). ("copr.): potential co-processing site with CJnc180 (Figure 6A).
Figure 5—figure supplement 2
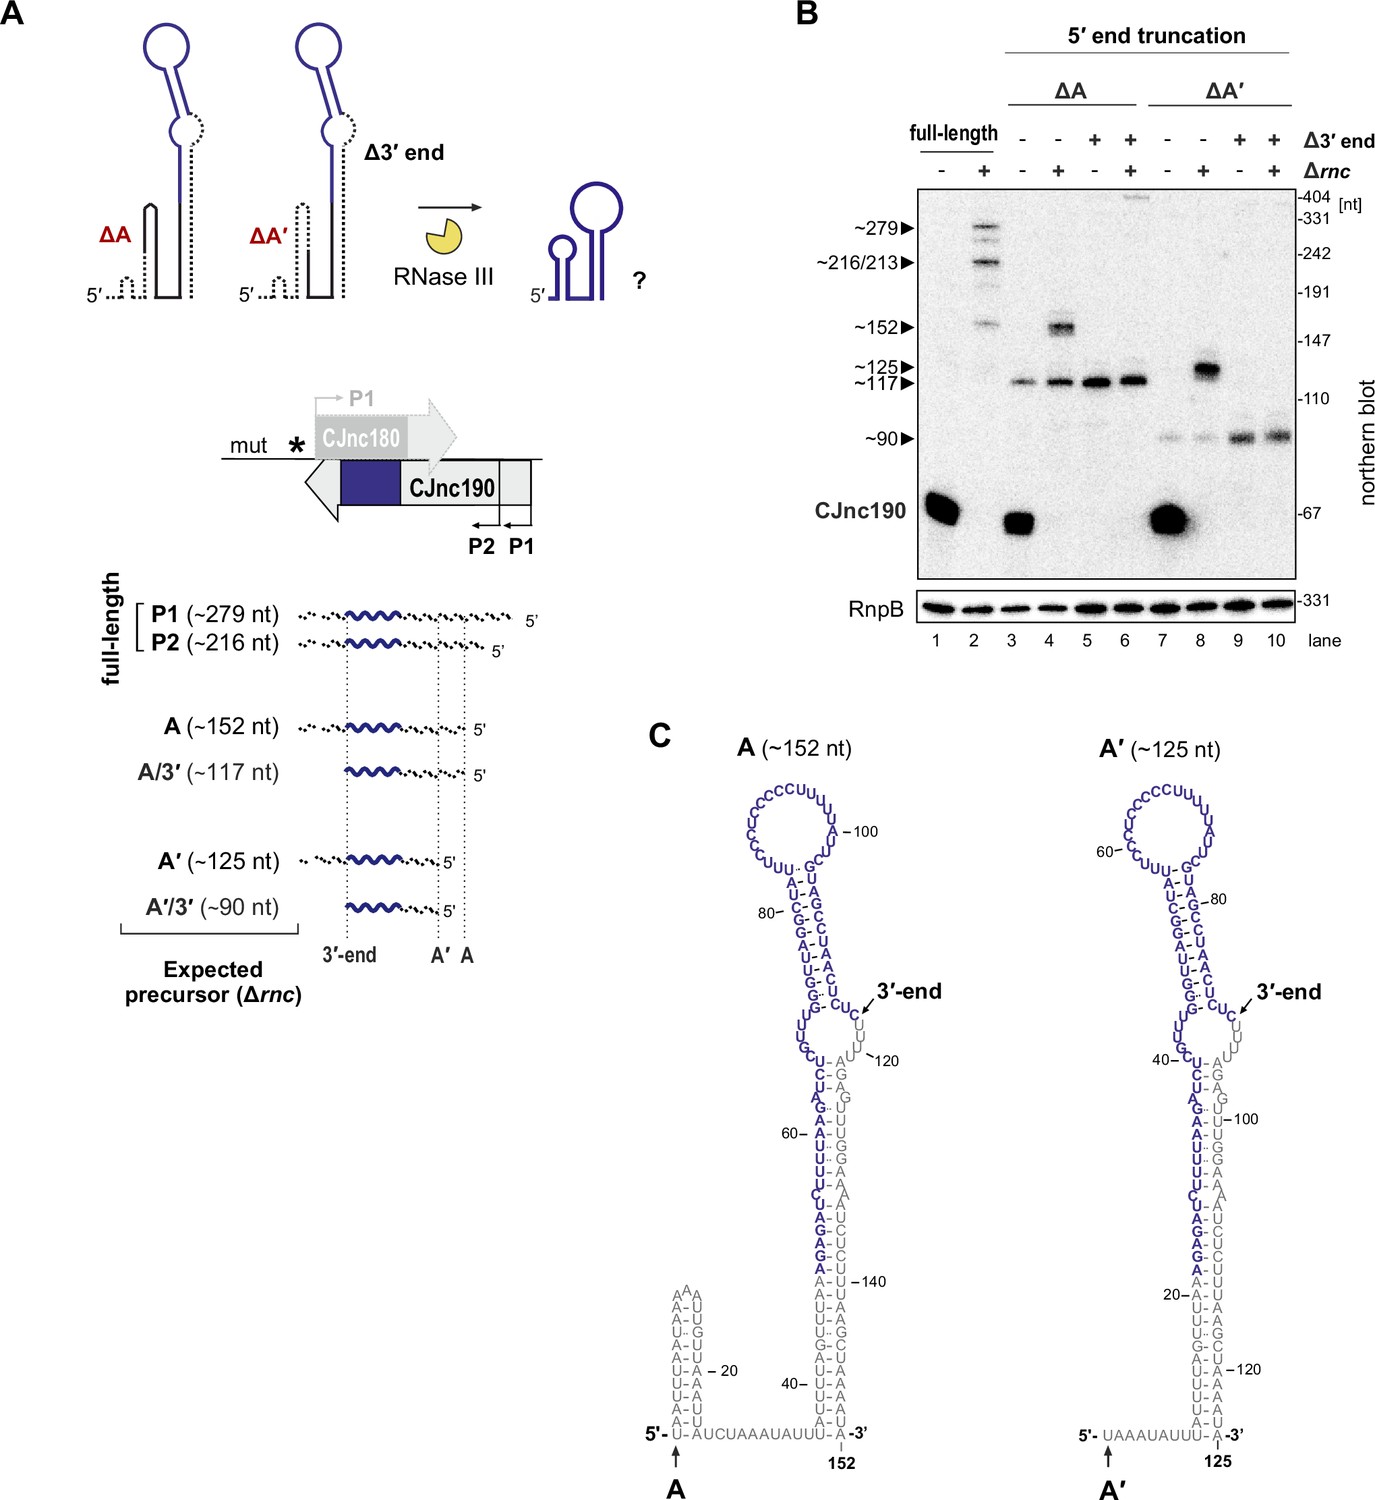
Processing of pre-CJnc190 truncated within a 5’-end hairpin.
(A) Strategy for testing the requirement of the 5’ end hairpin for processing. CJnc190 versions (5’-truncated at positions A/A’ (ΔA/ΔA’) or truncated at the mature sRNA 3' end (Δ3’)) were expressed from rdxA of Δ180/190 (without CJnc180). Expected precursor lengths are shown. (B) Northern blot analysis of CJnc190 processing in strains expressing truncated CJnc190 versions outlined in A. CJnc190 expression and processing was measured by northern blotting with a probe binding the mature CJnc180/190 sRNAs (CSO-0189/0185). RnpB (CSO-0497) was probed as a loading control. (C) Predicted secondary structures of pre-CJnc190 (promoter P2, based on 186 nucleotide (nt) precursor in Figure 5A) species truncated at 5′ positions A or A′. Structures were predicted using the RNAfold server of Vienna RNA tools (Lorenz et al., 2011).
-
Figure 5—figure supplement 2—source data 1
Full northern blot images for the corresponding detail sections shown in Figure 5—figure supplement 2.
- https://cdn.elifesciences.org/articles/69064/elife-69064-fig5-figsupp2-data1-v2.zip
Figure 6 with 1 supplement
CJnc190 drives processing of CJnc180 by RNase III.
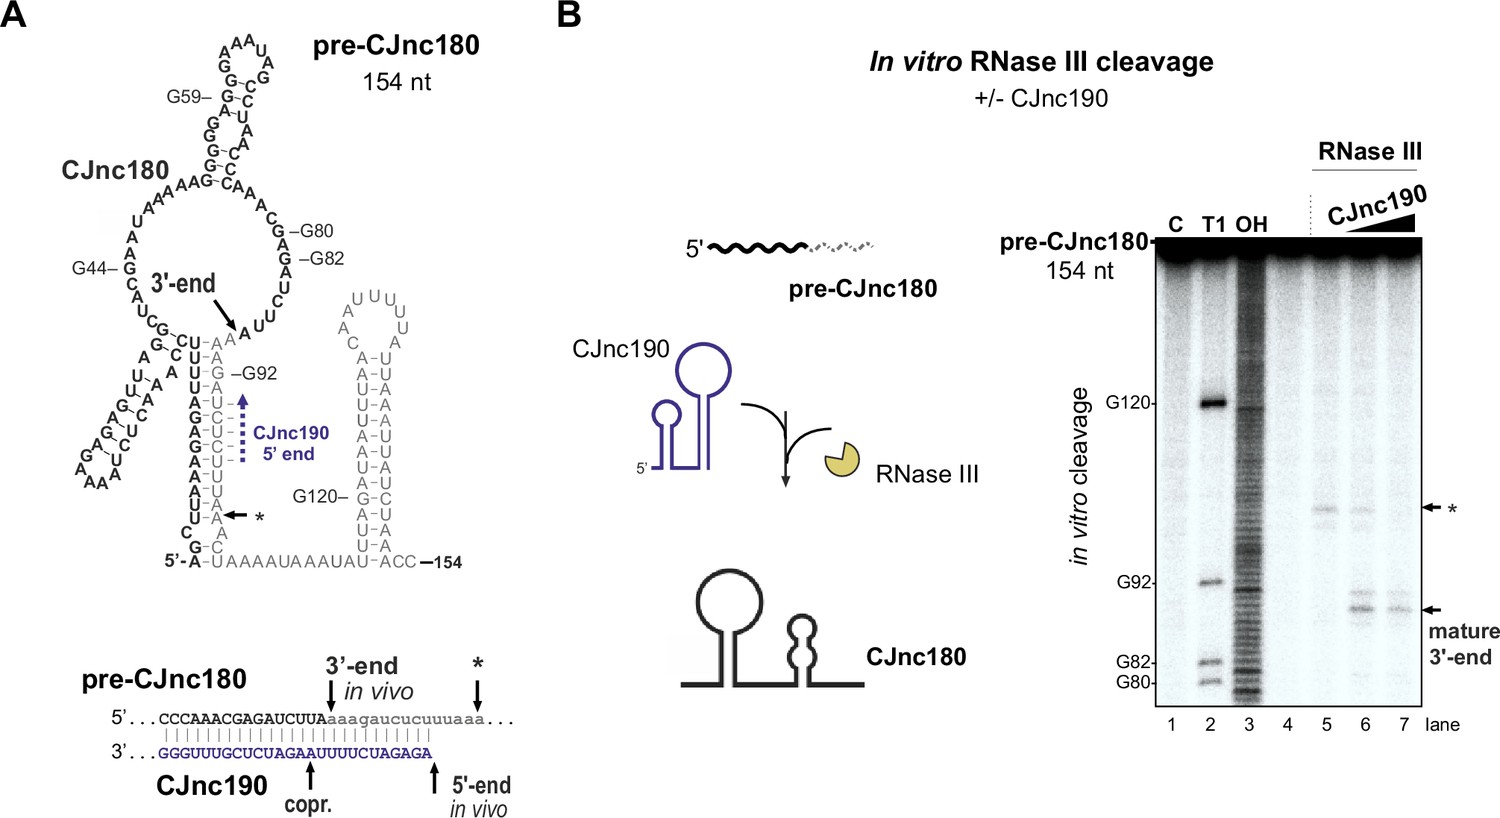
(A) Predicted secondary structure of the pre-CJnc180 precursor (154 nucleotide [nt]). Residues of the mature sRNA are black. The CJnc190-dependent CJnc180 3′ end is indicated. Asterisk: CJnc190-independent in vitro cleavage site (panel B). Blue dashed arrow: Region of potential base-pairing with the 5′ end of mature CJnc190. (Bottom) Potential co-processing of the predicted CJnc190 (mature) and pre-CJnc180 duplex. (B) In vitro RNase III cleavage of 32P-labeled (5’ end) pre-CJnc180 (154 nt). (Left) 32P-5’-end-labeled in vitro transcript (0.2 pmol) was incubated in the presence or absence of unlabeled mature CJnc190 (0.2 or 2 pmol) and subjected to cleavage with RNase III. (Right) Cleavage products were separated on a denaturing gel. C – untreated control; T1 ladder – G residues (indicated on left); OH – all positions (alkaline hydrolysis). The full gel is shown in Figure 6—figure supplement 1B.
-
Figure 6—source data 1
Full cleavage assay gel image for the corresponding detail sections shown in Figure 6.
- https://cdn.elifesciences.org/articles/69064/elife-69064-fig6-data1-v2.zip
Figure 6—figure supplement 1
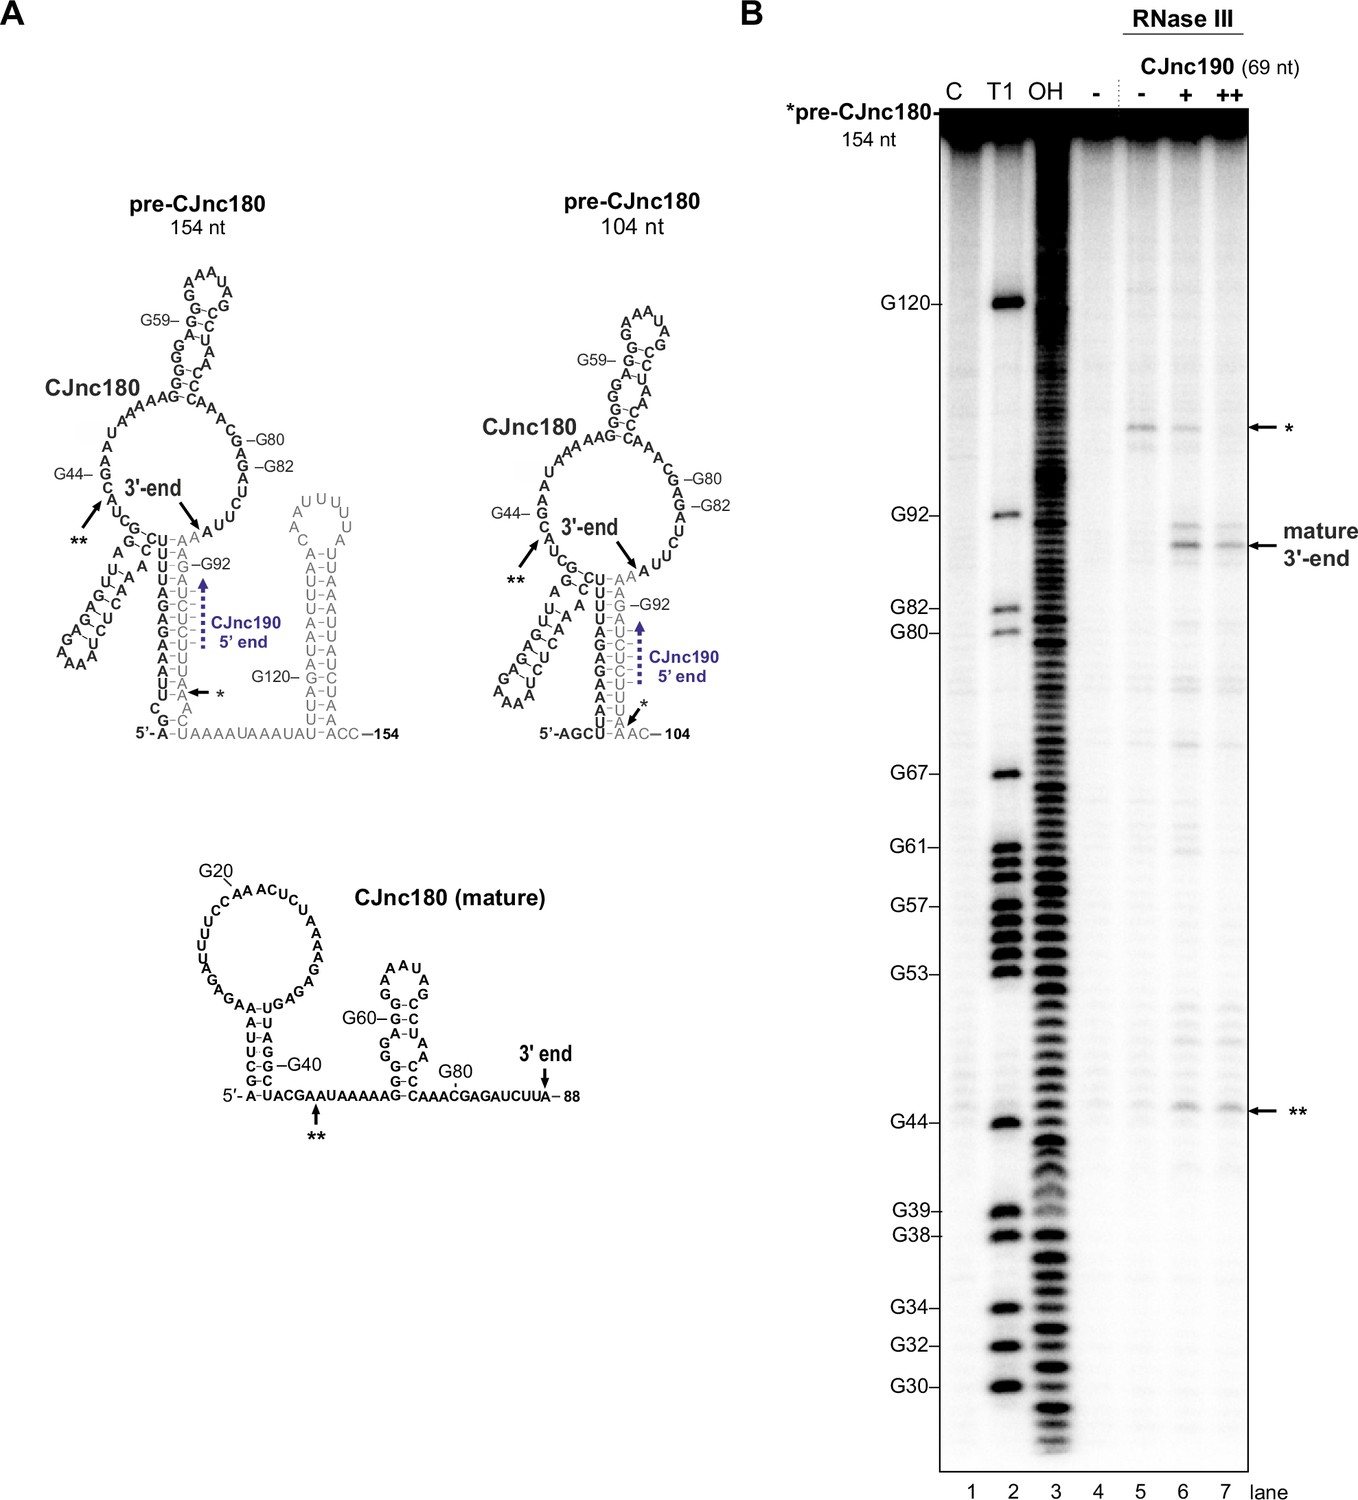
In vitro RNase III cleavage of pre-CJnc180.
(A) Predicted secondary structures of pre-CJnc180 versions (154 and 204 nucleotide [nt]) and mature CJnc180 (RNAfold; Lorenz et al., 2011). The in vivo-detected 3’ end is indicated. *: CJnc190-independent in vitro RNase III cleavage site (panel B). **: Second CJnc190-dependent in vitro RNase III cleavage site. Blue dashed arrow: Region of potential base-pairing with 5′ end of mature CJnc190. (B) In vitro RNase III cleavage of pre-CJnc180 alone or in the presence of unlabeled mature CJnc190. A pre-CJnc180 in vitro transcript (32P-5’-end-labeled, 0.2 pmol) was treated with 1/625 U RNase III. Where indicated, unlabeled mature CJnc190 RNA was added (+: 0.2 pmol, ++: 2 pmol). Cleavage products were separated on denaturing gels. Lanes 1–3: C, no addition; T1, G residue ladder (RNase T1); OH, all positions (alkaline hydrolysis). Related to main Figure 6B.
-
Figure 6—figure supplement 1—source data 1
Full cleavage assay gel image for the corresponding detail sections shown in Figure 6—figure supplement 1.
- https://cdn.elifesciences.org/articles/69064/elife-69064-fig6-figsupp1-data1-v2.zip
Figure 7 with 3 supplements
CJnc180 antagonizes CJnc190-mediated repression of ptmG.
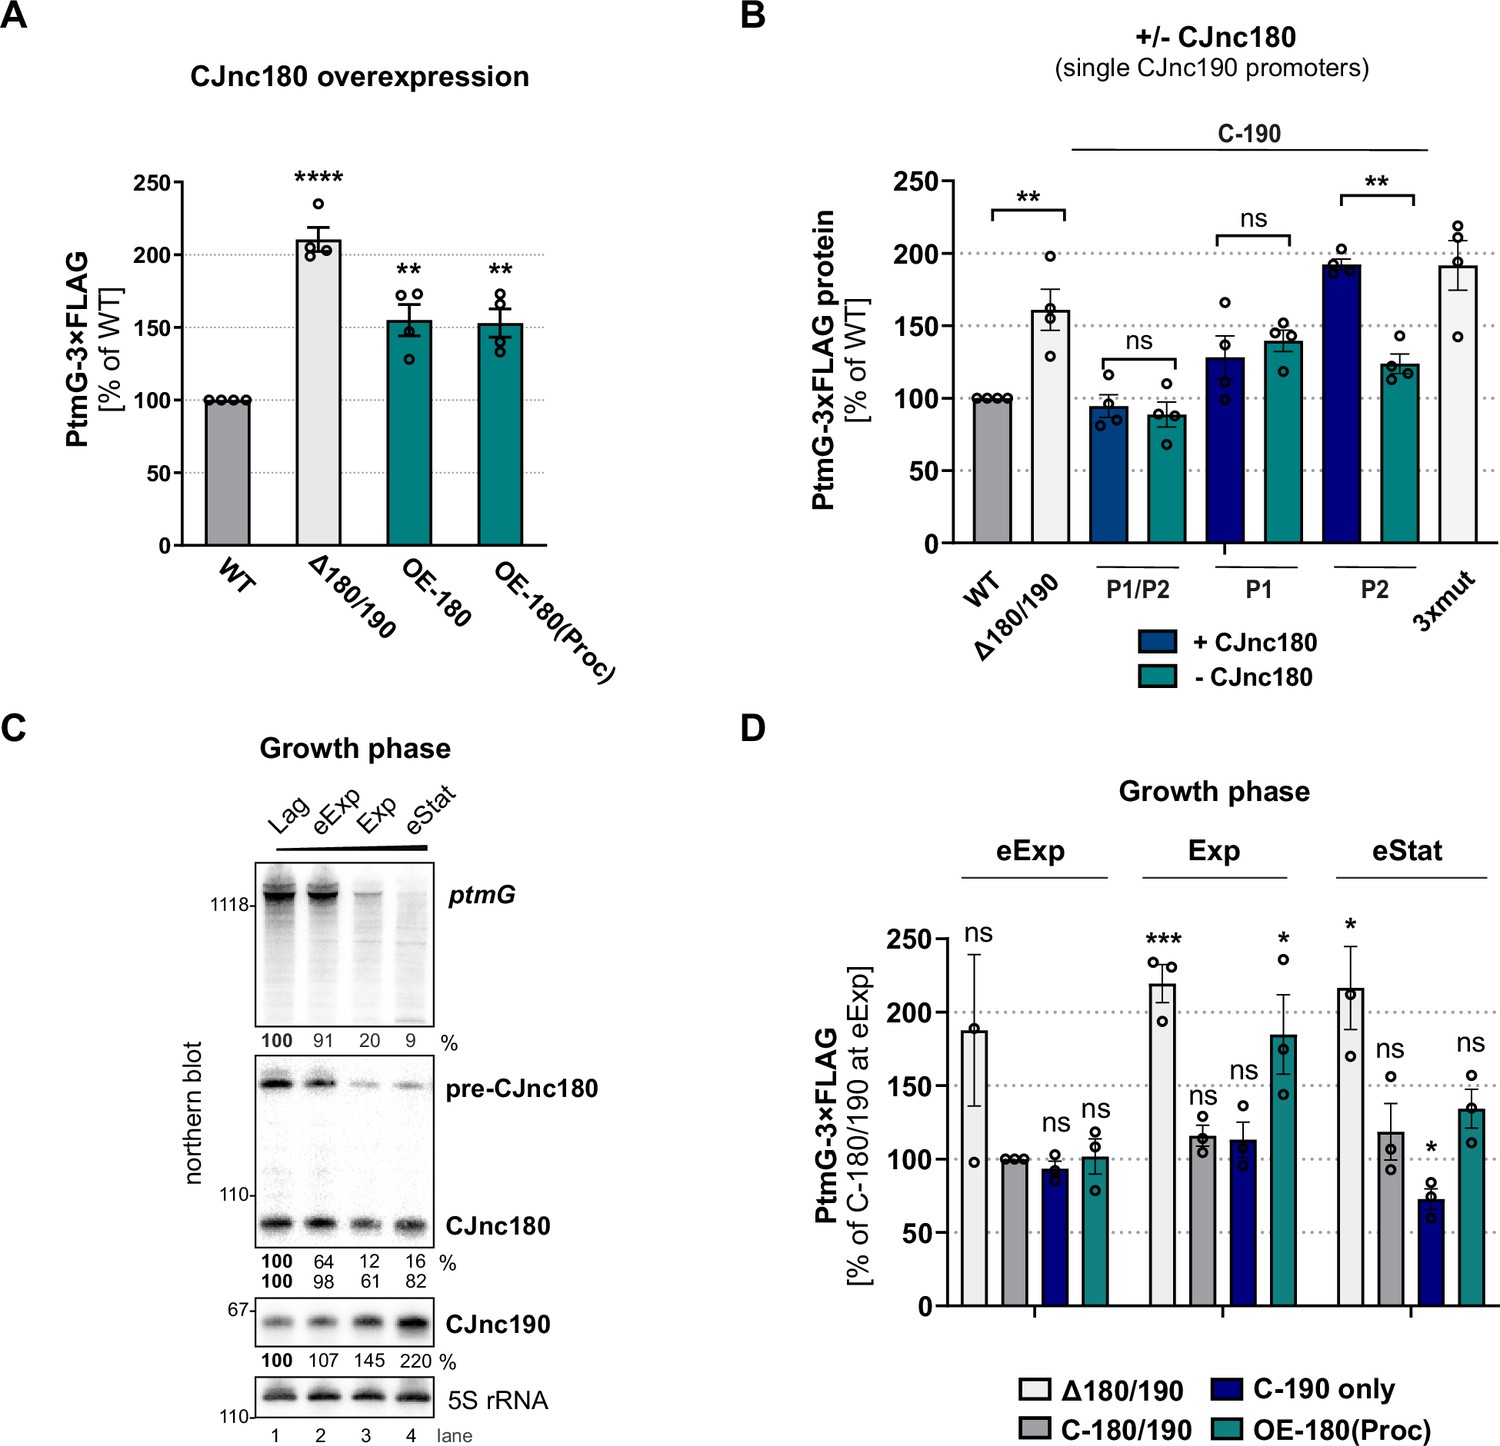
(A) The effect of CJnc180 overexpression on ptmG. OE-180: overexpression (second copy) of full-length CJnc180 from rdxA. OE-180(Proc): overexpression (second copy) of mature CJnc180 fused to the Escherichia coli rrnB terminator (see Figure 1D). Levels of PtmG-3×FLAG protein were measured by western blot in the indicated strains in log phase. Error bars: standard error of the mean (SEM) from four independent replicates. Student’s unpaired t-test vs. wild type (WT): **: p < 0.01, ****: p < 0.0001. See also Figure 7—figure supplement 1A. (B) Absence of CJnc180 derepresses ptmG when CJnc190 is expressed from a single promoter. Levels of PtmG-3×FLAG protein were measured by western blot in the indicated strains in log phase. 3× mut: Δ180/190 complemented with CJnc180/190 carrying point mutations in all three validated promoters. Error bars: SEM from four independent replicates. Student’s unpaired t-test vs. WT: **: p < 0.01, ns: not significant. See also Figure 7—figure supplement 1C,D. (C) Northern blot analysis of precursor, mature sRNA, and ptmG target mRNA expression in WT at different growth phases in rich medium under microaerobic conditions. Lag: lag phase, eExp: early exponential, Exp: exponential phase, eStat: early stationary phase (OD600 0.1, 0.25, 0.5, and 0.9, respectively). (D) The effect of the CJnc180 antagonist at different growth phases. Levels of PtmG-3×FLAG protein were measured in the indicated strains at three growth phases by western blot. Error bars: SEM from three independent replicates. Student’s unpaired t-test vs. WT: ***: p < 0.001, *: p < 0.05, ns: not significant vs. C-180/190 (dark gray bars) in eExp. See also Figure 7—figure supplement 2. For all northern blots, probes for the mature sRNAs (CSO-0189 and CSO-0185 for CJnc180 and CJnc190, respectively) and the 5′ end of the ptmG ORF (CSO-1666) were used. As a loading control, 5S rRNA (CSO-0192) or RnpB (CSO-0497) was also probed.
-
Figure 7—source data 1
Full northern blot images for the corresponding detail sections shown in Figure 7, as well as raw values for northern blot quantifications.
- https://cdn.elifesciences.org/articles/69064/elife-69064-fig7-data1-v2.zip
Figure 7—figure supplement 1
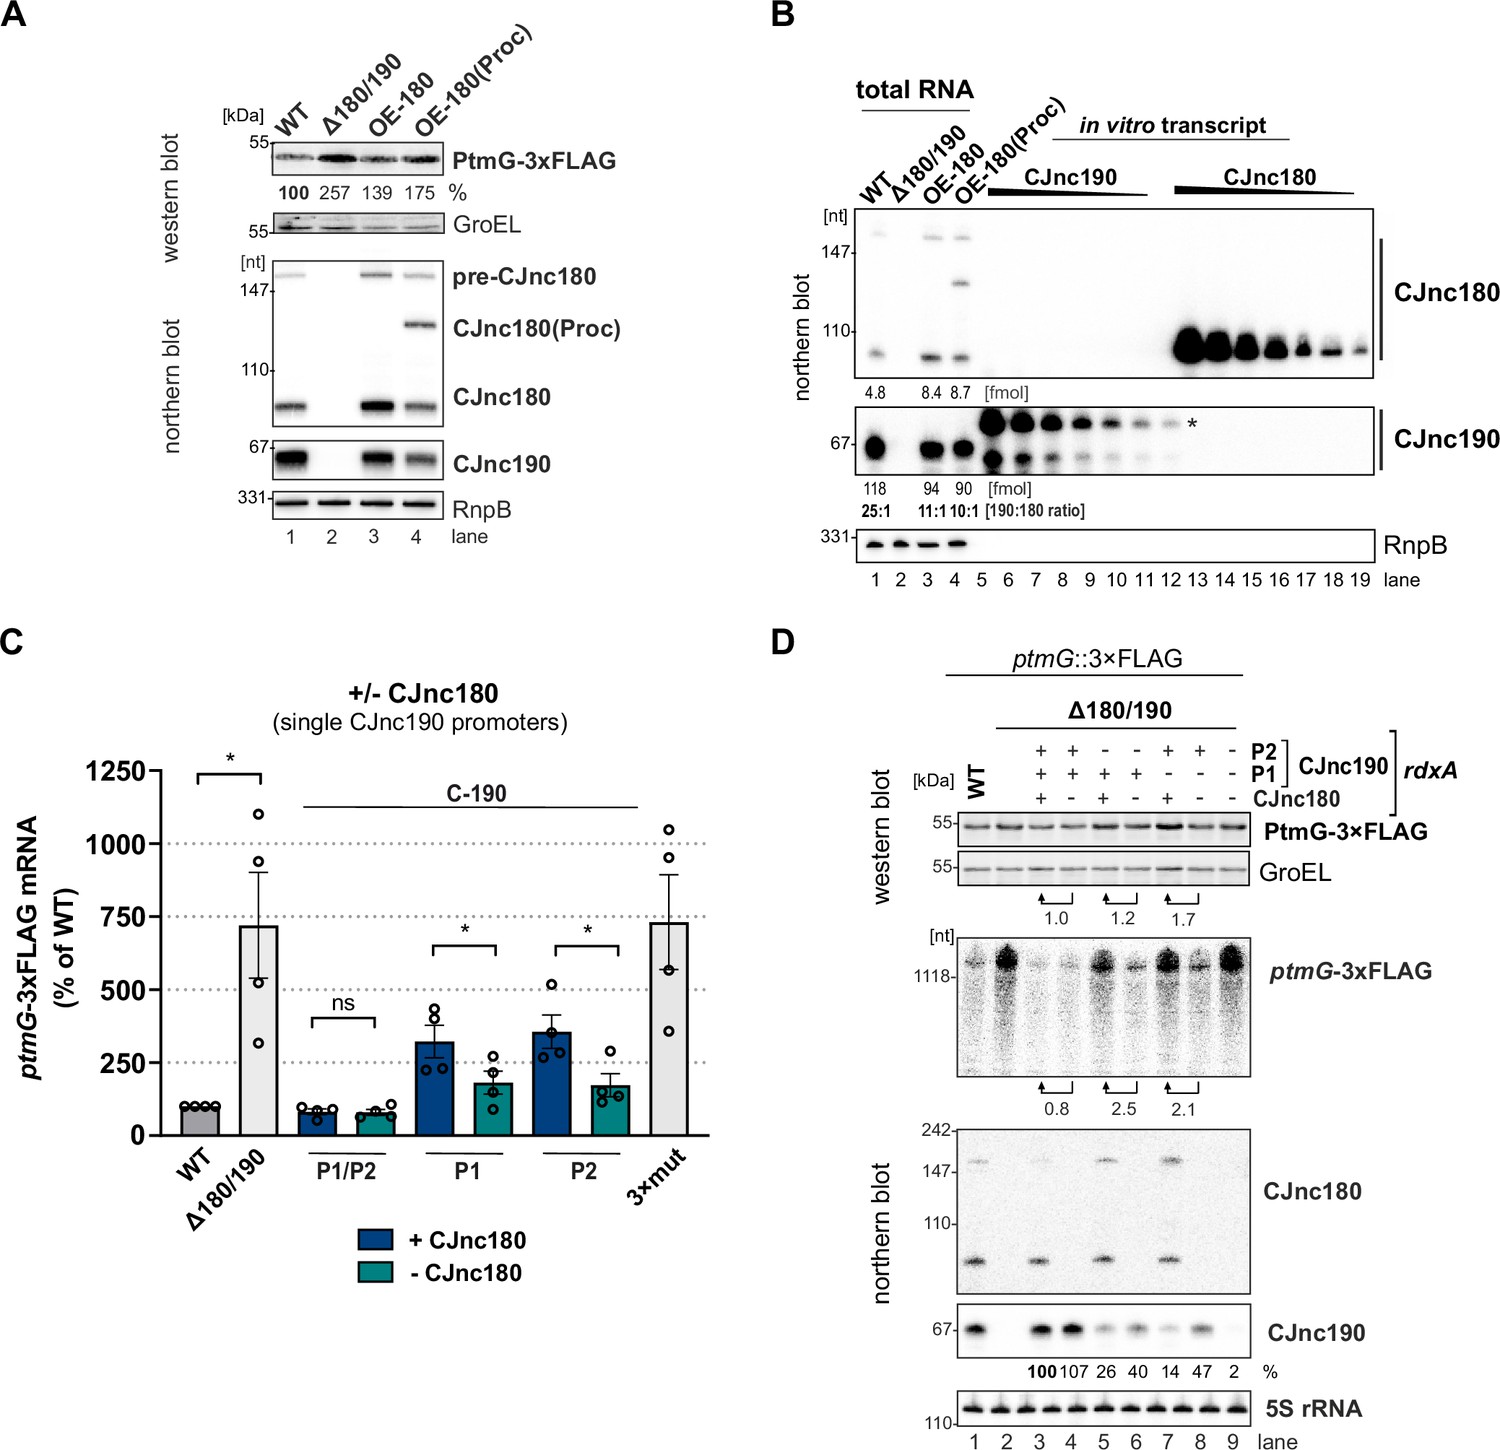
Modulation of ptmG regulation via CJnc180 expression and different CJnc190 promoters.
(A) Expression of a second copy of CJnc180 or CJnc180(Proc) de-represses ptmG. Levels of PtmG-3×FLAG protein were measured by western blot in the indicated strains in log phase. GroEL was detected as a loading control. Related to main Figure 7A. (B) Estimation of relative CJnc180 and CJnc190 levels in a wild type (WT) or OE-CJnc180 background in log phase. CJnc180 and CJnc180 levels in total RNA were determined by comparison to serial dilutions of in vitro transcripts by northern blot analysis. The regions of the lanes that were quantified for CJnc180 and CJnc190 are indicated by vertical bars on the right. Related to main Figure 7A. (C) Absence of CJnc180 de-represses ptmG when CJnc190 is expressed from a single promoter. Levels of ptmG-3×FLAG protein were measured by northern blot in the indicated strains in log phase. 3× mut: Δ180/190 complemented with CJnc180/190 carrying point mutations in all three validated promoters. Error bars: standard error of the mean (SEM) from four independent replicates. Student’s unpaired t-test vs. WT: *: p < 0.05, ns: not significant. Related to main Figure 7B. (D) Representative western/northern blot for the effect of the CJnc180 antagonist absence or presence on PtmG levels in log phase. Related to main Figure 7B and panel C. For northern blots, probes for mature CJnc180/190 sRNAs (CSO-0189/0185) and the 5′ end of the ptmG ORF (CSO-1666) were used. GroEL and 5S rRNA (CSO-0192) were detected as loading controls for protein and RNA samples, respectively. PtmG-3×FLAG fold-changes were calculated with GroEL-normalized measurements.
-
Figure 7—figure supplement 1—source data 1
Full western and northern blot images for the corresponding detail sections shown in Figure 7—figure supplement 1, as well as raw values for northern blot quantifications.
- https://cdn.elifesciences.org/articles/69064/elife-69064-fig7-figsupp1-data1-v2.zip
Figure 7—figure supplement 2

Modulation of ptmG regulation via CJnc180 expression at different growth phases.
Related to main Figure 7D. Lag: lag phase, eExp: early exponential phase, Exp: exponential phase, eStat: early stationary phase (OD600 0.1, 0.25, 0.5, and 0.9, respectively). Northern blot probes for mature CJnc180/190 sRNAs (CSO-0189/0185) and the 5’ end of the ptmG ORF (CSO-1666) were used, as well as CSO-0192 (5S rRNA) as a loading control. ± denotes whether the indicated sRNA is expressed in the strain.
-
Figure 7—figure supplement 2—source data 1
Full western and northern blot images for the corresponding detail sections shown in Figure 7—figure supplement 2, as well as raw values for northern blot quantifications.
- https://cdn.elifesciences.org/articles/69064/elife-69064-fig7-figsupp2-data1-v2.zip
Figure 7—figure supplement 3
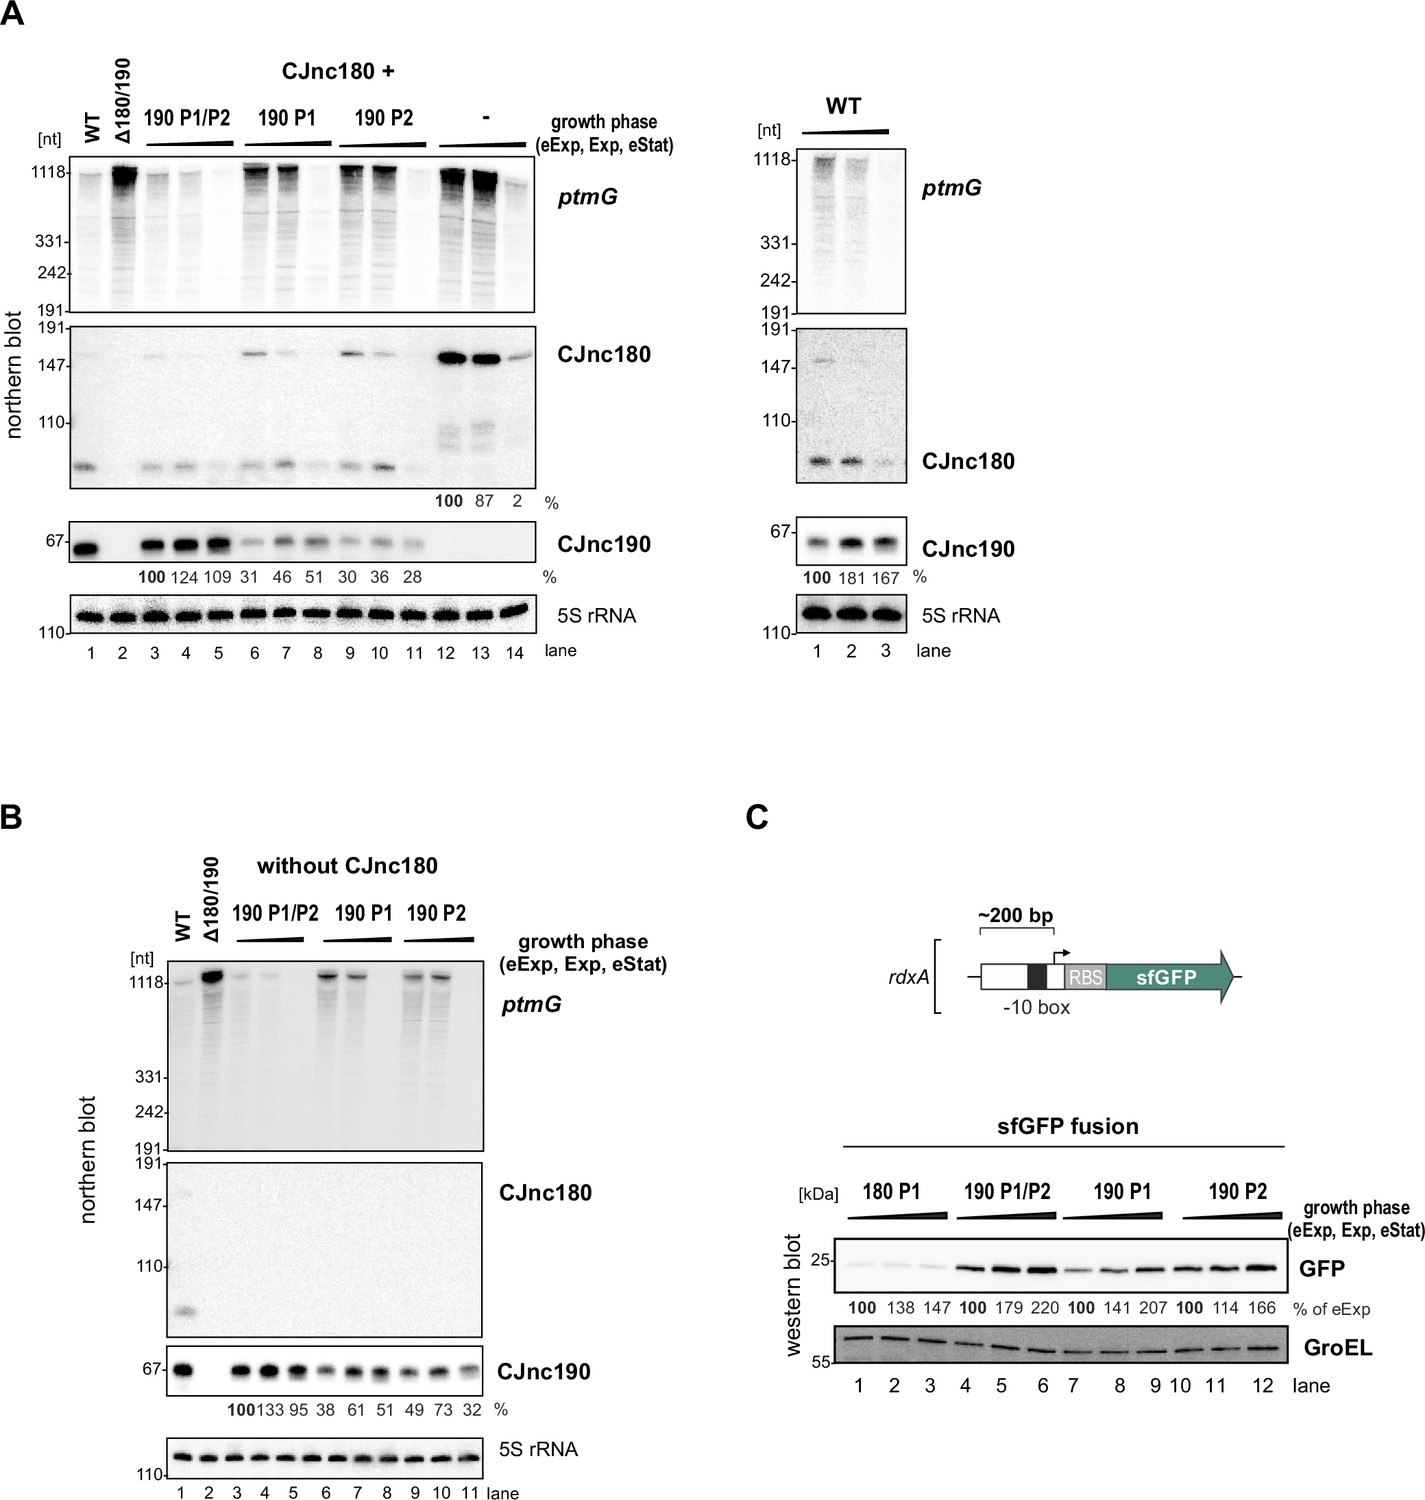
CJnc180 and CJnc190 levels and promoter activity at different growth phases.
(A) and (B) Levels of CJnc190 expressed from promoter P1 or P2, as well as ptmG, at different growth phases. Levels were determined in the presence (panel A) or absence (panel B) of CJnc180. Promoter point mutant strains (see main Figure 3C) were used. (C) Expression of superfolder GFP (sfGFP) transcriptional reporters for CJnc180 P1 and CJnc190 P1/P2, P1, or P2 at different growth phases. Approximately 200 bp upstream and 10 bp downstream of the CJnc180, CJnc190 P1, and CJnc190 P2 TSSs were fused to sfGFP with an ribosome-binding site (RBS) from the unrelated hupB gene to generate CJnc180 P1, CJnc190 P1, and CJnc190 P1/P2 strains. Site-directed mutagenesis (see Supplementary file 1e for details) was used to inactivate CJnc190 P1 in the P1/P2 strain to generate a CJnc190 P2-only reporter. GFP levels in cells harvested from the indicated growth phases were detected using an anti-GFP antibody, with GroEL as a loading control. Black triangles above all the blots indicate increasing growth phase (eExp, Exp, Stat). Northern blot probes for mature CJnc180/190 sRNAs (CSO-0189/0185) and the 5’ end of the ptmG ORF (CSO-1666) were used, as well as for 5S rRNA (CSO-0192) as a loading control.
-
Figure 7—figure supplement 3—source data 1
Full western and northern blot images for the corresponding detail sections shown in Figure 7—figure supplement 3, as well as raw values for northern blot quantifications.
- https://cdn.elifesciences.org/articles/69064/elife-69064-fig7-figsupp3-data1-v2.zip
-
Figure 7—figure supplement 3—source data 2
Full western and northern blot images for the corresponding detail sections shown in Figure 7—figure supplement 3.
- https://cdn.elifesciences.org/articles/69064/elife-69064-fig7-figsupp3-data2-v2.zip
Figure 8

CJnc180/190 biogenesis, interplay, and regulation of ptmG.
(Left) CJnc180/CJnc190 precursors are transcribed from one/two promoters, respectively, in response to so far still unknown signals/regulators. (Bottom) CJnc190 precursors harbor a long duplex structure involving regions flanking the mature CJnc190 sRNA (blue). Mature CJnc190 is processed from the extended duplex structure in pre-CJnc190 by RNase III in the absence of CJnc180. In contrast, processing of pre-CJnc180 requires both RNase III and duplex formation with CJnc190 (top). Mature CJnc190 represses translation of ptmG mRNA, encoding a colonization factor, by base-pairing between its C/U-rich loop and the G-rich ptmG RBS (right). Antisense CJnc180 antagonizes CJnc190 levels/activity by sequestration, decay, and/or transcriptional interference.
Author response image 1
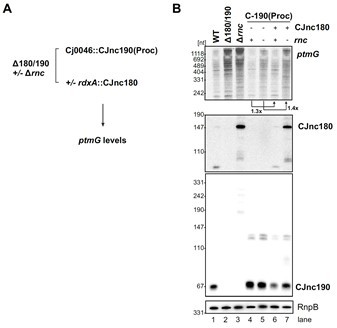
Antagonism of CJnc190 by CJnc180 in the presence and absence of RNase III.
(A) CJnc190(Proc) was inserted at the Cj0046 pseudogene locus under control of its native P1 promoter. CJnc180 was introduced into the unrelated rdxA locus under its native promoter. Analysis was performed in a RNase III+ or Δrnc background. (B) Total RNA was analyzed by northern blotting for sRNA expression and ptmG mRNA levels. RnpB RNA was detected as a loading control.
Author response image 2
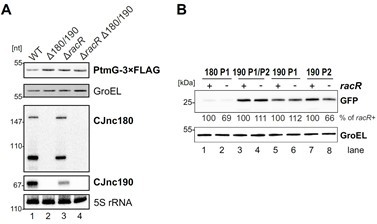
Deletion of the gene encoding the RacR two-component response regulator results in lower CJnc190 levels.
(A) Total RNA from sRNA WT or the indicated mutant strains growing in exponential phase was analyzed by northern blotting for sRNA expression. As a loading control, 5S rRNA was also probed. All strains were in a PtmG-3xFLAG background, allowing parallel western blot detection of target levels with an anti-FLAG antibody. GroEL served as a loading control. (B) Activity of CJnc180/190 promoters in the presence and absence of RacR. Expression of promoter GFP reporter fusions to CJnc180 P1, CJnc190 P1/P2, CJnc190 P1, or CJnc190 P2 was measured by western blotting in bacteria growing in exponential phase. Levels were determined in RacR+ or ΔracR (-) backgrounds. GroEL served as a loading control.
Tables
Key resources table
| Reagent type (species) or resource | Designation | Source or reference | Identifiers | Additional information |
|---|---|---|---|---|
| Strain, strain background | Escherichia coli TOP10 | Invitrogen | See Supplementary file 1b | |
| Strain, strain background | Campylobacter jejuni NCTC11168 | Arnoud van Vliet, Institute of Food Research, Norwich, UK | See Supplementary file 1b | |
| Sequence-based reagent | (Oligonucleotides)See Supplementary file 1c | Sigma | See Supplementary file 1c | |
| Recombinant DNA reagent | (Plasmids)See Supplementary file 1d | This study | See Supplementary file 1d | |
| Antibody | Anti-FLAG M2 (mouse monoclonal) | Sigma-Aldrich | #F1804-1MG | Western blot 1:10,000 |
| Antibody | Anti-GFP (mouse monoclonal) | Roche | #11814460001 | Western blot 1:1000 |
| Antibody | Anti-GroEL (rabbit polyclonal) | Sigma-Aldrich | #G6532-5ML | 1:10,000 |
| Antibody | Anti-mouse HRP conjugate IgG (sheep polyclonal) | GE Healthcare | #RPN4201 | 1:10,000 |
| Antibody | Anti-rabbit HRP conjugate IgG (goat polyclonal) | GE Healthcare | #RPN4301 | 1:10,000 |
| Commercial assay or kit | PURExpress | New England Biolabs | E6800S | |
| Commercial assay or kit | DNA Cycle Sequencing Kit | Jena Bioscience | #PCR-401S | |
| Commercial assay or kit | MEGAscript T7 kit (Ambion) | Thermo Fisher Scientific | AMB13345 | |
| Software, algorithm | RNAfold | Lorenz et al., 2011 (PMID:22115189) | Vienna RNA package 2.4.14 | http://www.tbi.univie.ac.at/RNA |
| Software, algorithm | IntaRNA | Mann et al., 2017 (PMID:28472523) | Version 3.2.0 linking Vienna RNA package 2.4.14 | http://rna.informatik.uni-freiburg.de/IntaRNA/Input.jsp |
| Software, algorithm | AIDA | Raytest, Germany | Version 5.0 SP1 Build 1,182 | |
| Software, algorithm | Integrated Genome Browser | UNC Charlotte | Version 9.1.8 | bioviz.org |
Additional files
-
Transparent reporting form
- https://cdn.elifesciences.org/articles/69064/elife-69064-transrepform1-v2.docx
-
Supplementary file 1
Mass spectrometry data; all strains, oligonucleotides, and plasmids used in this study, and details for mutant construction.
- https://cdn.elifesciences.org/articles/69064/elife-69064-supp1-v2.xlsx
Download links
A two-part list of links to download the article, or parts of the article, in various formats.
Downloads (link to download the article as PDF)
Open citations (links to open the citations from this article in various online reference manager services)
Cite this article (links to download the citations from this article in formats compatible with various reference manager tools)
RNase III-mediated processing of a trans-acting bacterial sRNA and its cis-encoded antagonist
eLife 10:e69064.
https://doi.org/10.7554/eLife.69064


