Multiphoton imaging of neural structure and activity in Drosophila through the intact cuticle
- Department of Neurobiology and Behavior, Cornell University, United States
- School of Applied and Engineering Physics, Cornell University, United States
- Department of Physics, University of Florida, United States
Figures
Figure 1
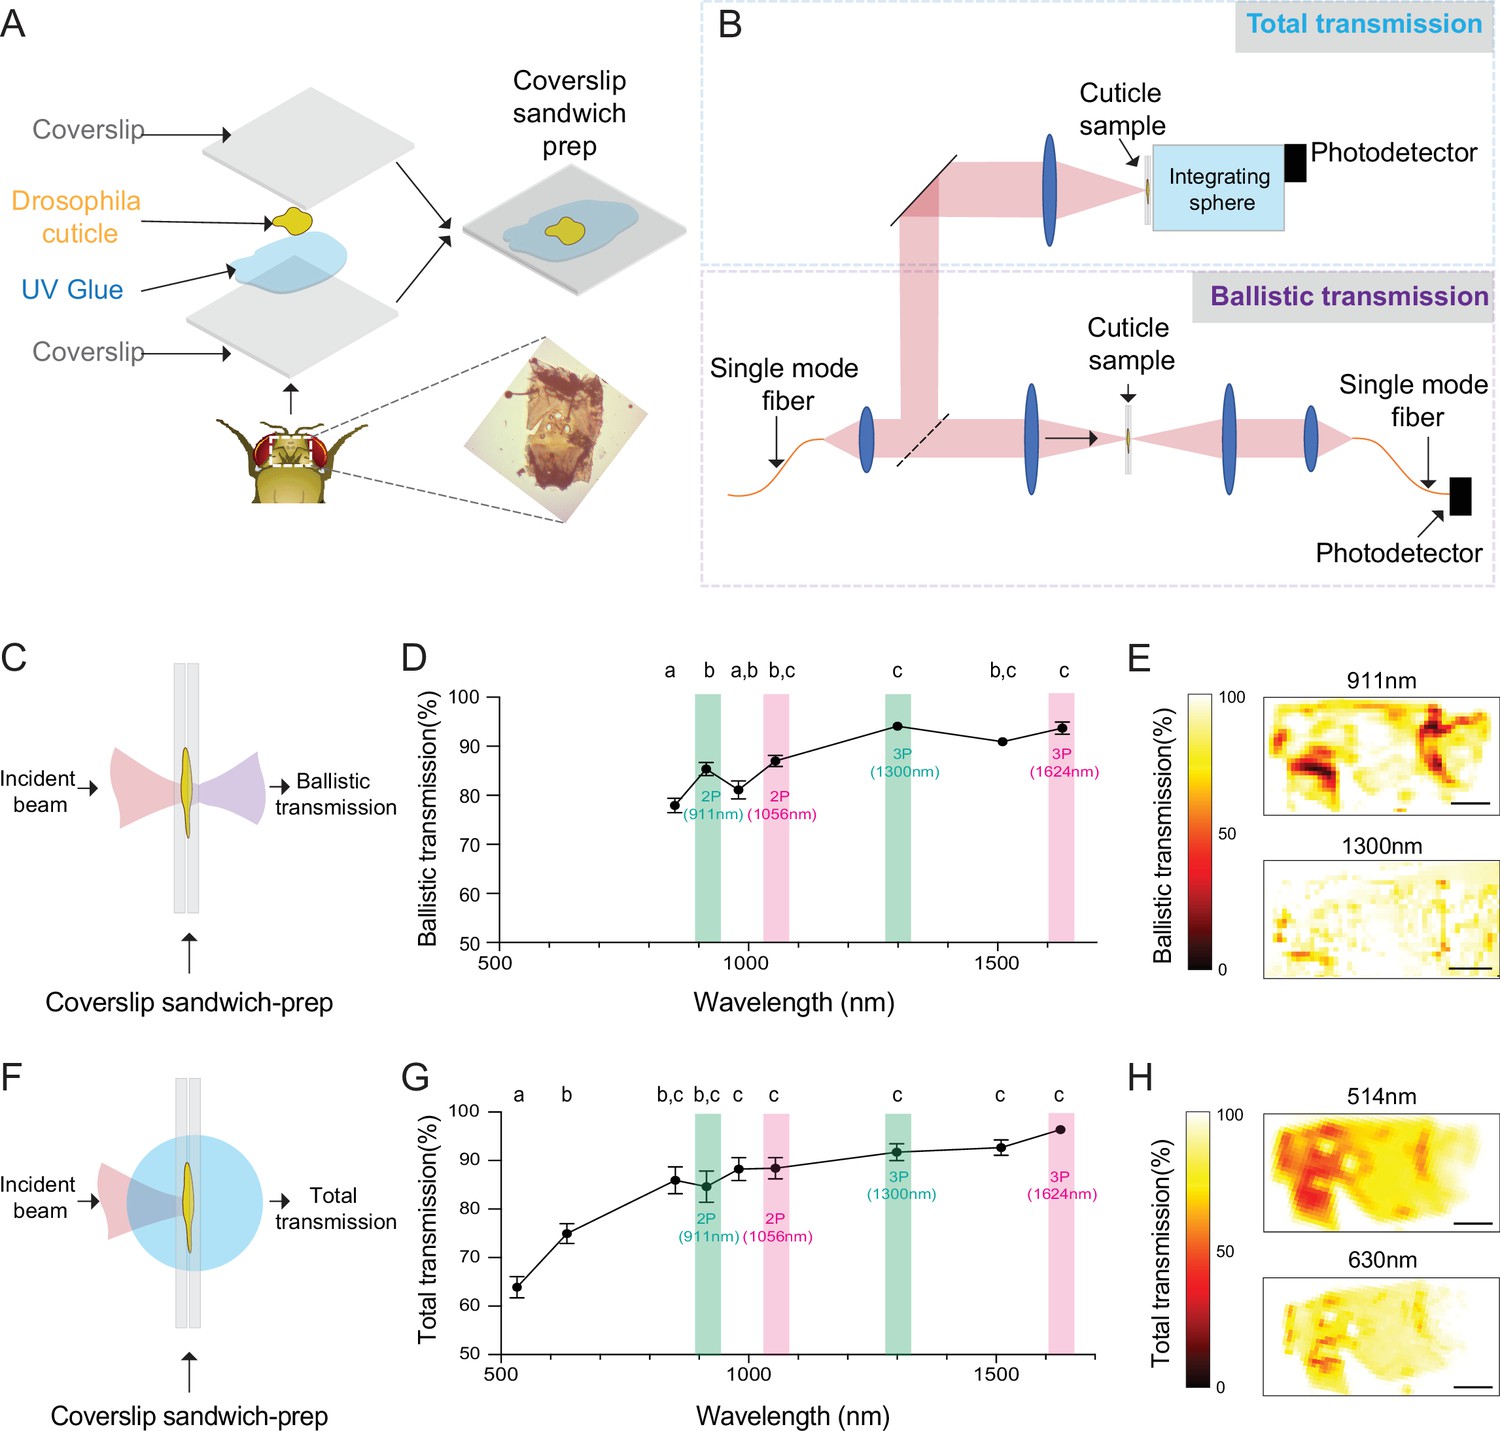
Ballistic and total optical transmission of the fly head cuticle.
(A) Schematic of the cuticle preparation. (B) Schematic of the cuticle optical transmission measurement setup. (C) Schematic of the ballistic optical transmission through the cuticle. (D) Results of the ballistic optical transmission experiments at various wavelengths (n = 56 measurements at each wavelength, 5 different samples). (E) Spatially resolved maps at 911 nm and 1300 nm with the percent ballistic transmission color-coded. Lighter colors indicate higher transmission and darker colors indicate lower transmission. (F) Schematic of the total optical transmission through the cuticle. (G) Results of the total optical transmission experiments at various wavelengths (n = 20 measurements at each wavelength, 4 different samples). (H) Spatially resolved maps at 514 nm and 630 nm with the percent total transmission color-coded. Lighter colors indicate higher transmission and darker colors indicate lower transmission. One-way ANOVA with post hoc Tukey’s test. Data points labeled with different letters in D and G are significantly different from each other (scale bars = 100 µm).
-
Figure 1—source data 1
Source data for plots Figure 1D and G.
- https://cdn.elifesciences.org/articles/69094/elife-69094-fig1-data1-v3.xlsx
Figure 2 with 1 supplement
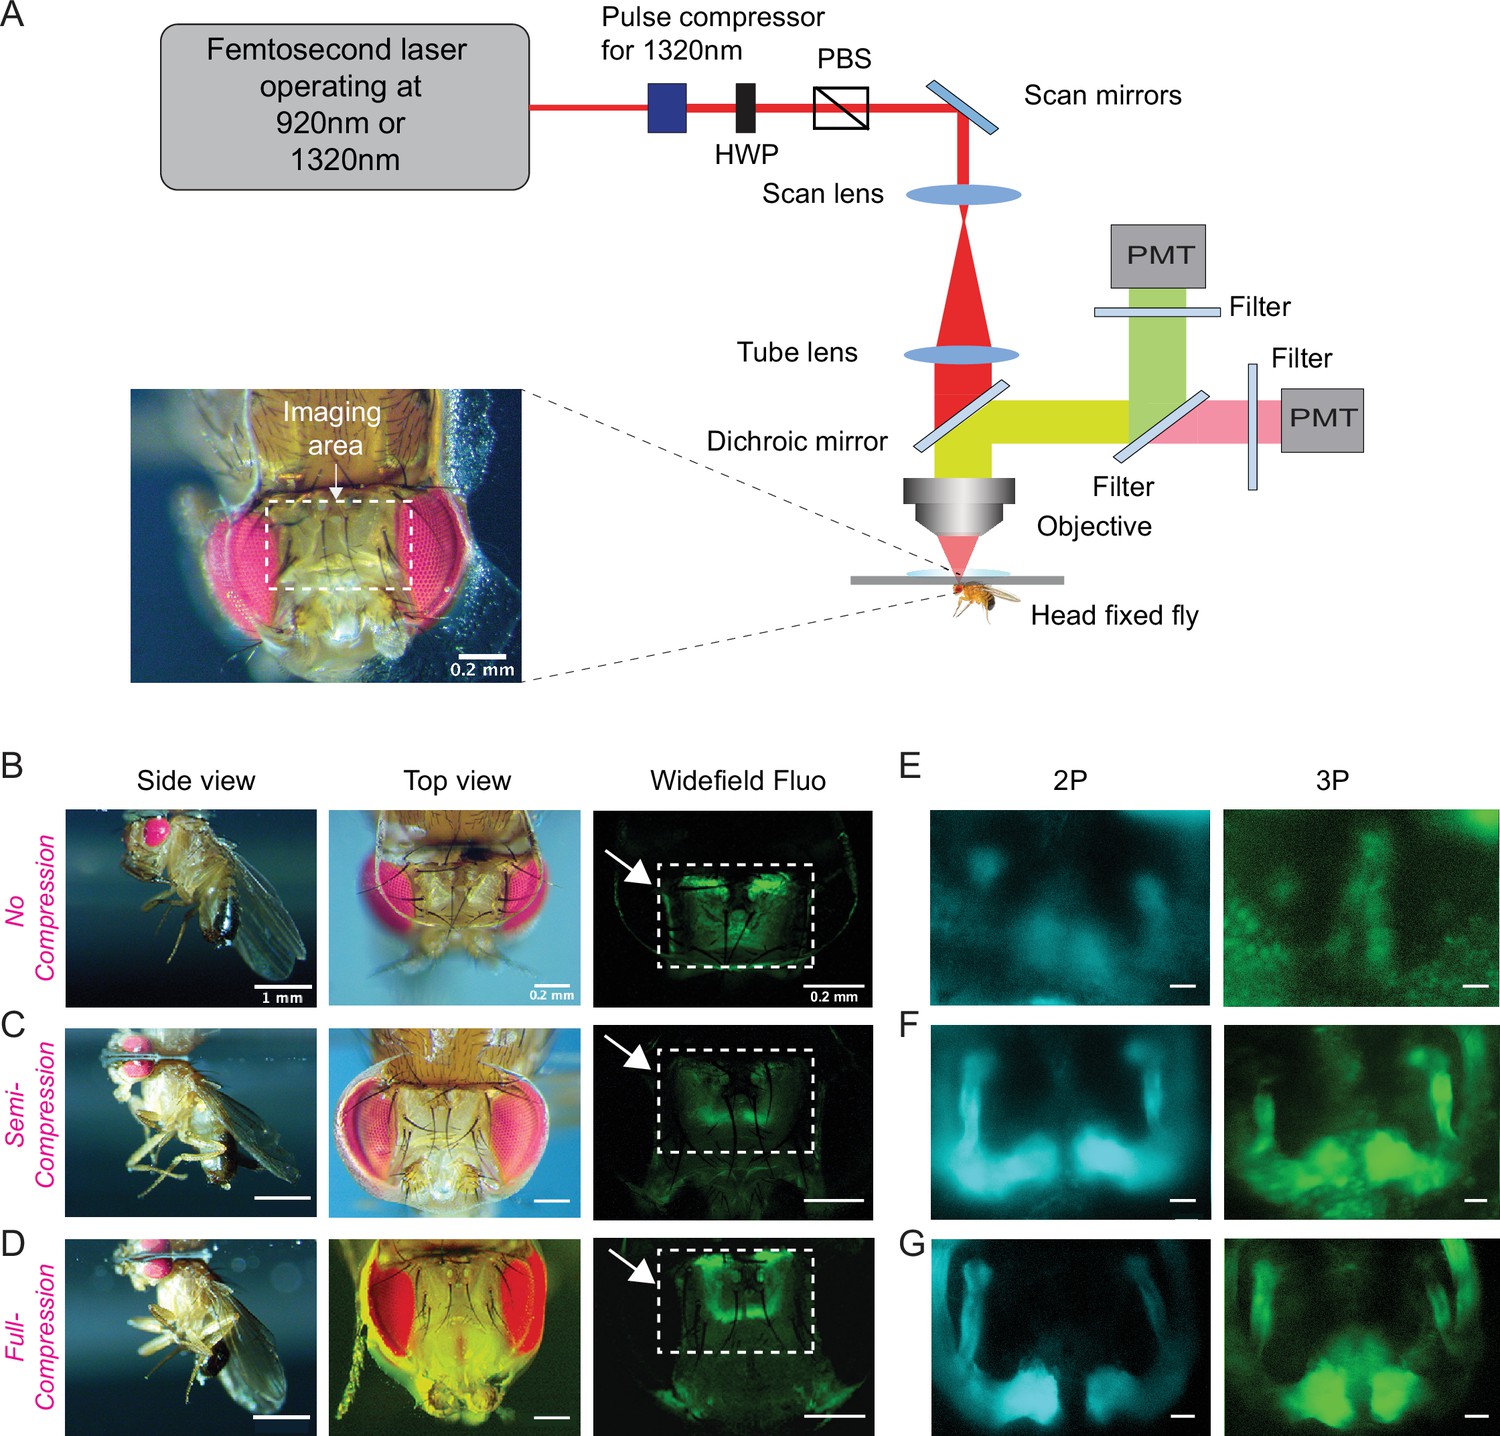
Through-cuticle imaging of the fly brain with 2P and 3P excitation.
(A) Schematic of the multiphoton microscope setup. Fly head is fixed to a cover slip and placed under the objective (HWP, half-wave plate; PBS, polarization beam splitter; PMT, photomultiplier tube). The imaging window on the fly head is shown in the picture (lower left). Scale bar = 200 µm. (B–D) The head-uncompressed and head-compressed imaging preparations. The first column shows the side image of the fly that is head fixed to the cover glass (scale bar = 1 mm). The second and third columns show the fly head visualized under a brightfield (top view) and fluorescent dissecting microscopes (widefield-fluo), respectively. Arrows and the rectangle area in widefield-fluo column indicate the imaging window (scale bar = 200 µm). (E–G) Cross-section imaging of the mushroom body Kenyon cells expressing CD8-GFP through the head cuticle at 920 nm (2P) and 1320 nm (3P) excitation. The Z projections of 2P (cyan, left) and 3P (green, right) imaging stacks. For each imaging preparation, the same fly head is imaged with 3P and 2P excitation (scale bar = 20 µm).
Figure 2—figure supplement 1
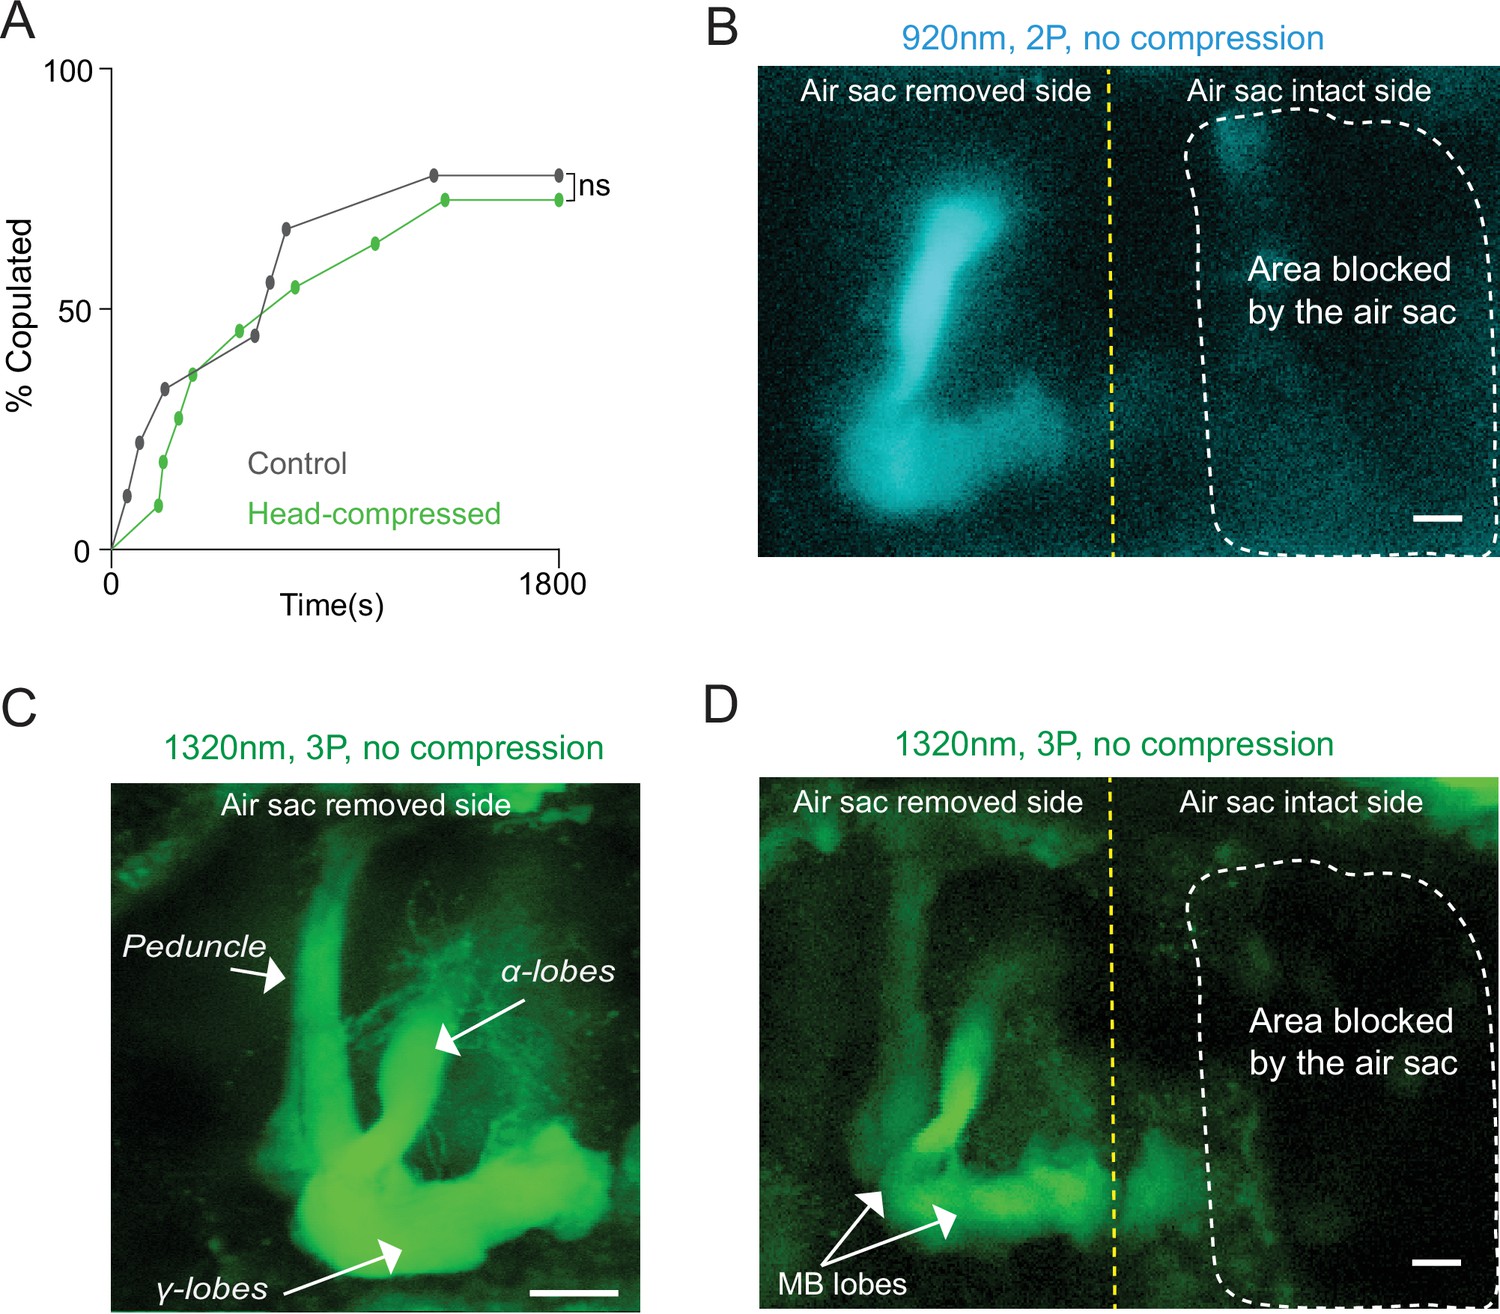
Head compression does not affect male courtship and removal of air sacs allows 2P and 3P imaging in a head-uncompressed preparation.
(A) Male copulation percentage is quantified in controls and flies that were previously head compressed (n = 7–8, log-rank (Mantel-Cox) test, p>0.05). (B–D) Cross-section imaging of the mushroom body Kenyon cells expressing GCaMP6s through the head cuticle at 920 nm (2P) and 1320 nm (3P) excitation after removing air sacs on one side of the head. The fly head is not compressed to the cover slip. The Z projections of (B) 2P (cyan) and (C, D) 3P (green) imaging stacks. For each imaging preparation, the same fly brain is imaged with 3P and 2P excitation. Mushroom body structures are visible on the side where air sacs are removed. The dotted lines show the area where the air sacs block imaging. (C) Zoomed-in 3P image taken from the side of the brain where the air sacs are removed. Mushroom body lobes and the peduncle are clearly visible in the air sac removed side without head compression (scale bars = 20 µm).
Figure 3 with 4 supplements
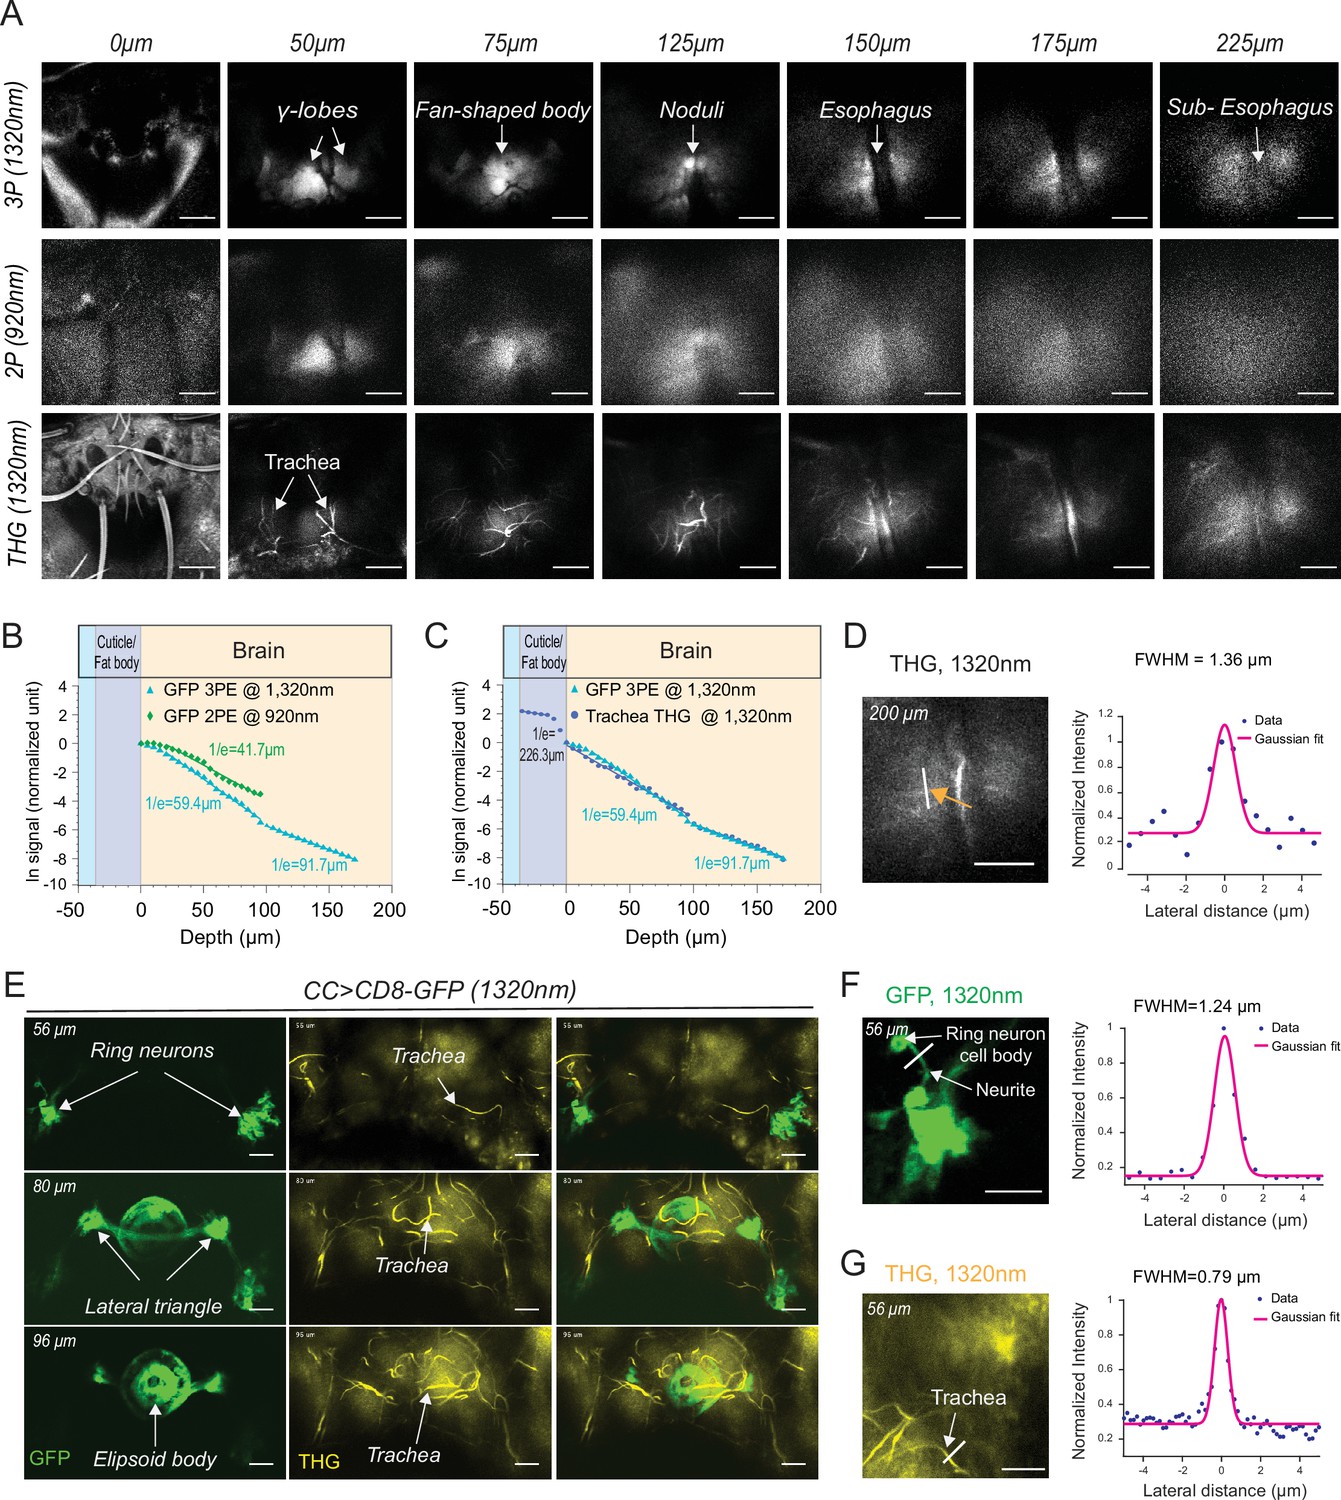
2P and 3P structural imaging of the fly brain.
(A) Cross-section images of the fly brain through the cuticle with 3P (top) and 2P (bottom) excitation at different depths. The third harmonic generation (THG) images are included at the bottom. 3P excitation power is <11 mW and the repetition rate is 333 kHz. 2P excitation power is <15 mW and the repetition rate is 80 MHz, scale bars = 50 µm. (B) GFP signal as a function of depth for 920 nm 2P excitation and 1320 nm 3P excitation. (C) Comparison of the GFP signal and THG signal as a function of depth at 1320 nm. (D) Lateral resolution measurement in the THG image captured at 200 µm depth. Lateral intensity profile measured along the white line (indicated by the orange arrow) is fitted by a Gaussian profile for the lateral resolution estimation (scale bar = 50 µm). (E) Cross-section images of the central complex (CC) ring neurons through the cuticle with 1320 nm 3P excitation (green). THG imaging visualizes the tracheal arbors (yellow). Arrows indicate different CC compartments that are identified (scale bars = 30 µm). (F–G) Lateral resolution measurements in 3P images captured at 56 µm depth. (F) The GFP fluorescence profile of CC ring neurons (green) and (G) the THG profile of surrounding trachea (yellow). Lateral intensity profiles measured along the white lines are fitted by Gaussian profiles for the lateral resolution estimation (scale bars = 20 µm).
-
Figure 3—source data 1
Source data for plots Figure 3B and C.
- https://cdn.elifesciences.org/articles/69094/elife-69094-fig3-data1-v3.xlsx
Figure 3—figure supplement 1
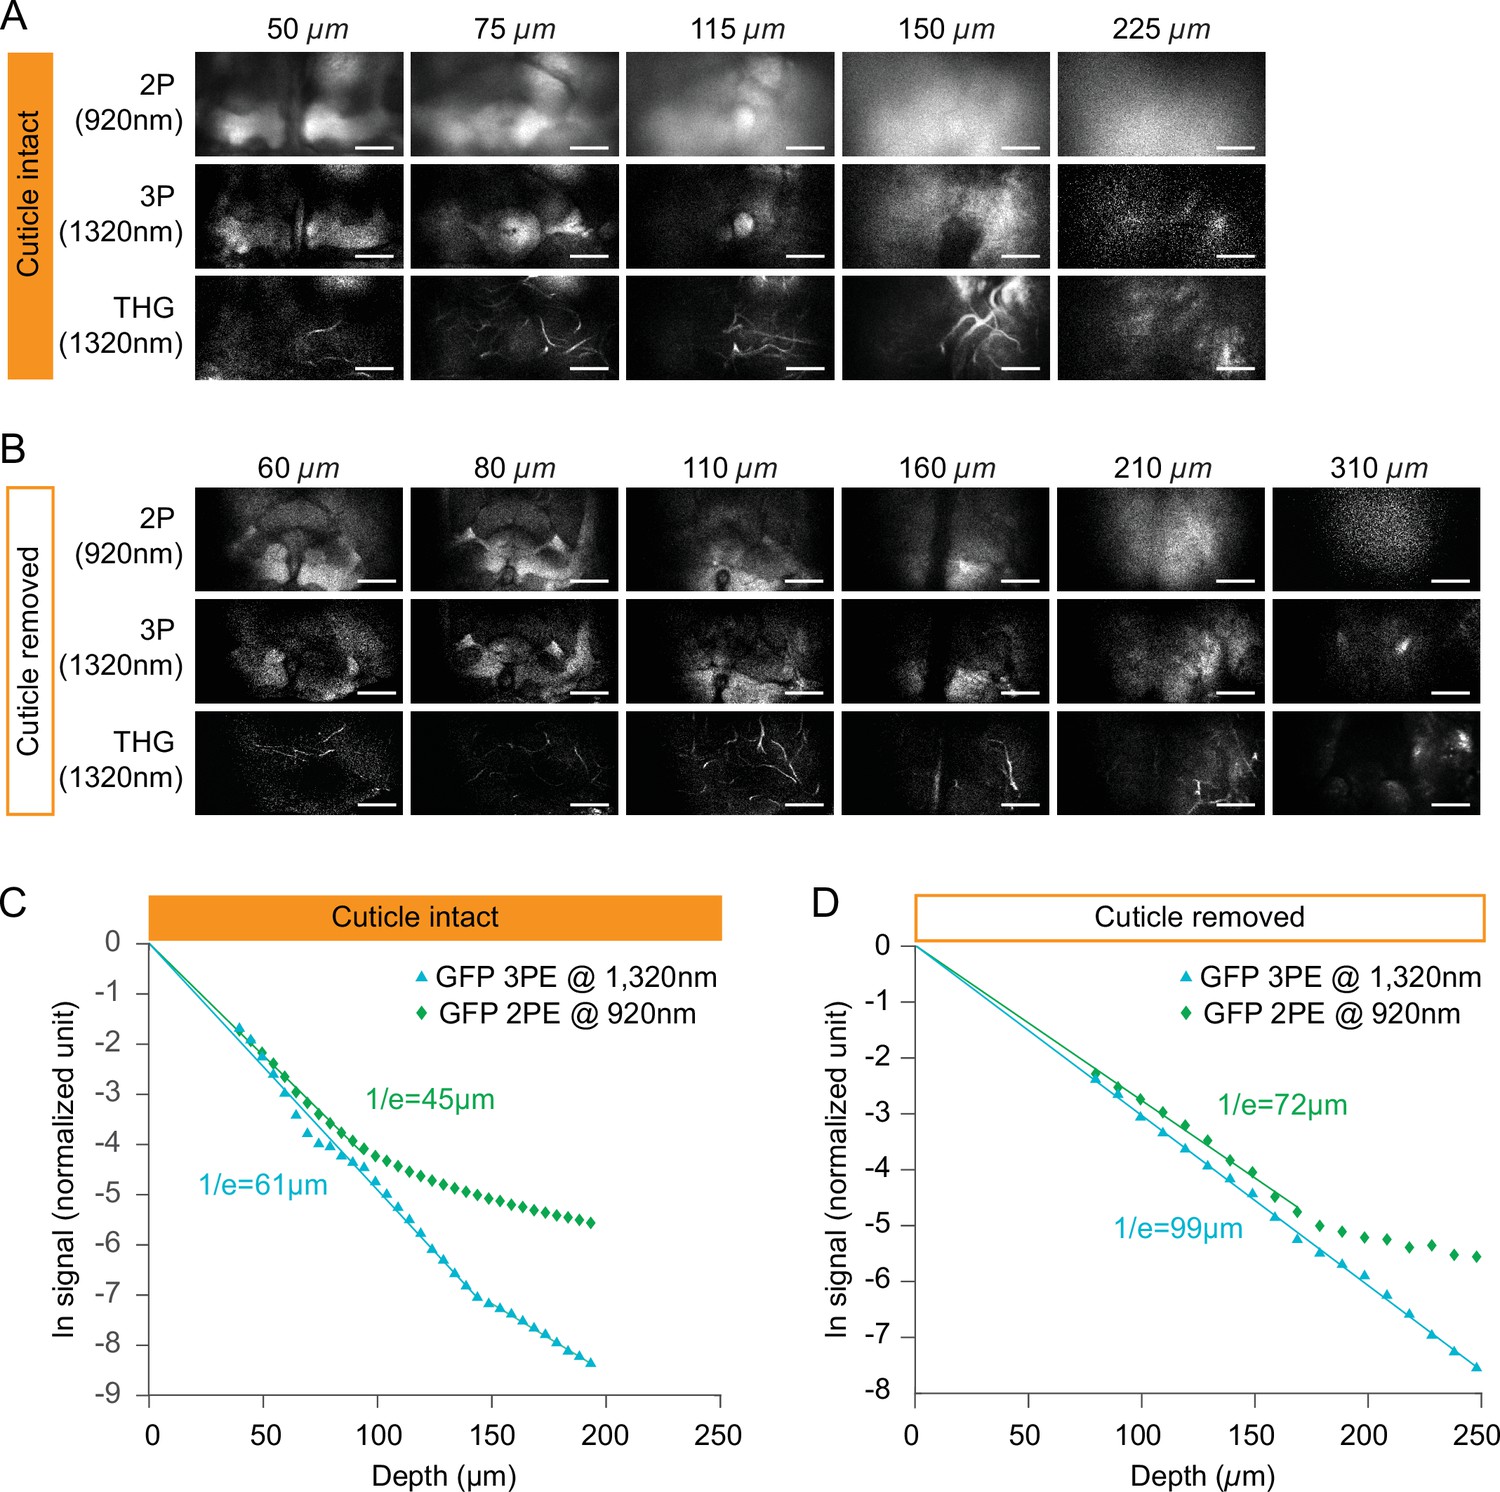
Comparing fluorescent signal attenuation with 2P and 3P excitation in cuticle-intact and cuticle-removed imaging preparations.
(A–B) Structural cross-section images through (A) a cuticle-intact imaging preparation and (B) a cuticle-removed preparation 2P fluorescence (top), 3P fluorescence (middle), and third harmonic generation (bottom). Flies expressing membrane-targeted GFP pan neuronally is used in all experiments. The excitation power for 3P imaging is <15 mW, and the repetition rate is 333 kHz. The excitation power for 2P imaging is <15 mW, and the repetition rate is 80 MHz. Scale bars = 50 µm. (C–D) Normalized signal attenuation with 920 nm 2P and 1320 nm 3P excitation in a cuticle-intact (C) and a cuticle-removed (D) fly brain.
-
Figure 3—figure supplement 1—source data 1
Source data for plots for Figure 3—figure supplement 1C and D.
- https://cdn.elifesciences.org/articles/69094/elife-69094-fig3-figsupp1-data1-v3.xlsx
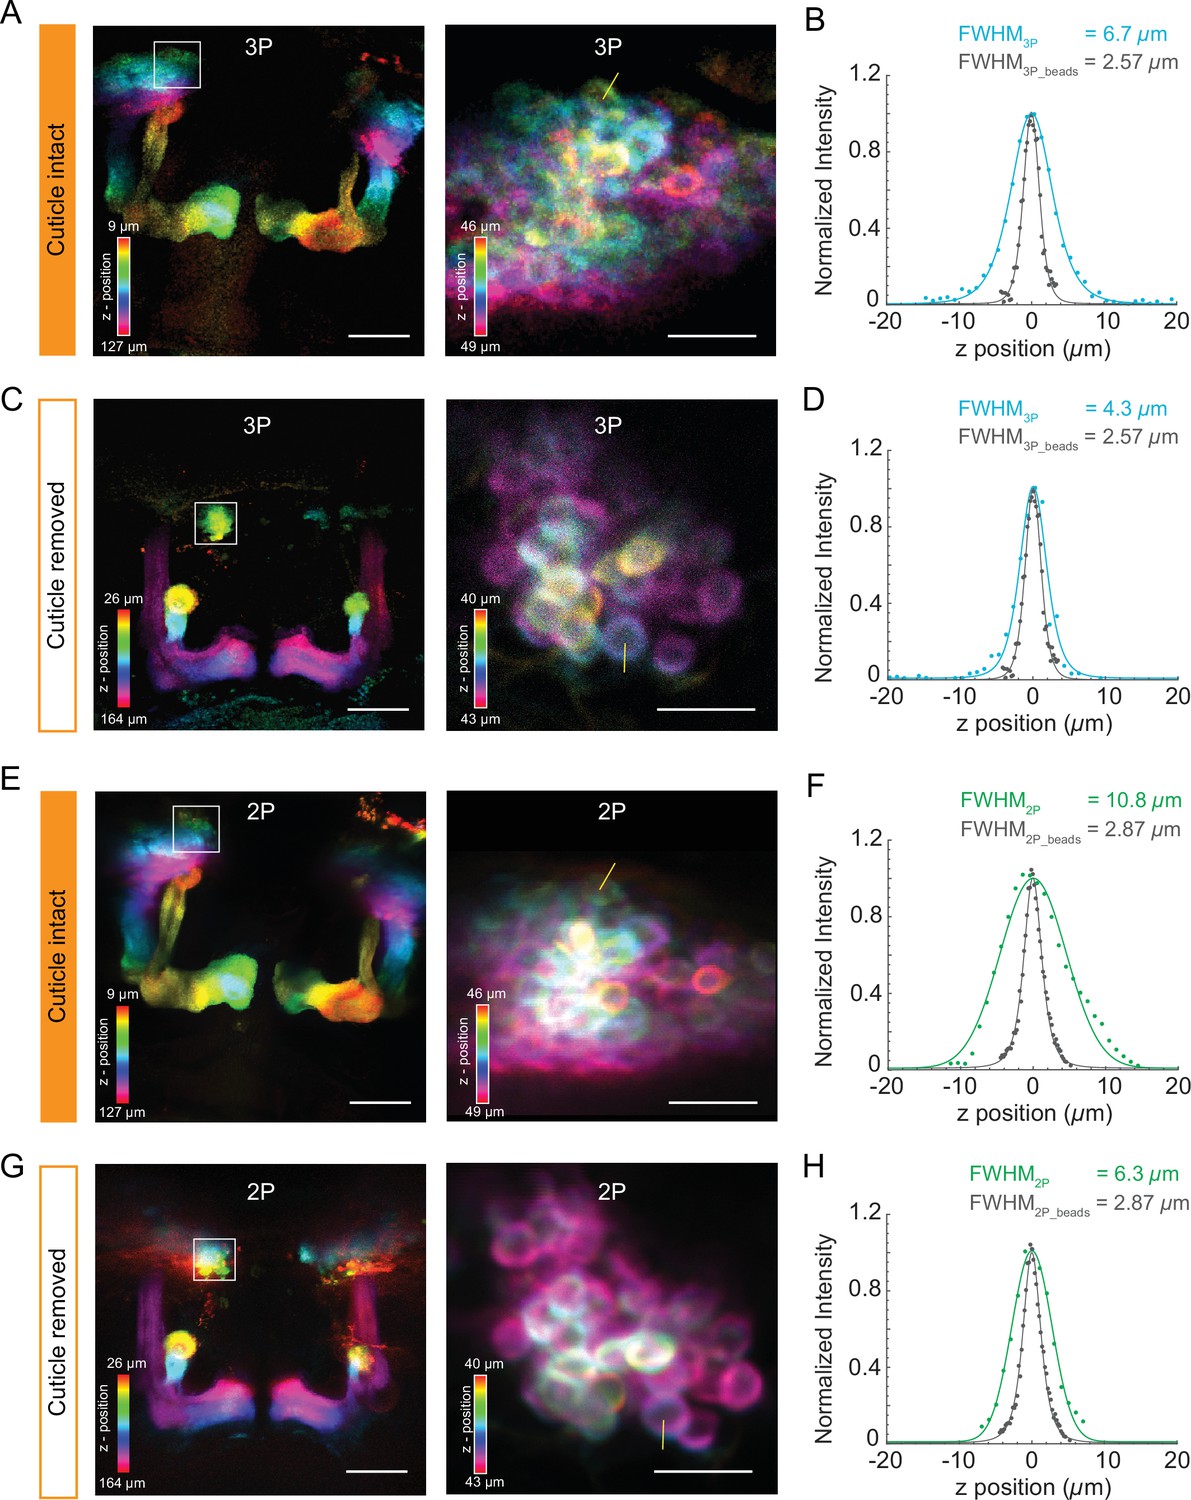
Figure 3—figure supplement 2

Structural imaging of central complex using the cuticle-intact and cuticle-removed imaging preparations.
(A, C) The Z-projection images of the central complex (left, scale bar = 50 µm) and zoomed-in images of ellipsoid body ring neurons (right, scale bar = 10 µm) obtained by 3P excitation (A) through the cuticle and (C) after removing the cuticle. Measurements of the axial resolution were taken at the locations indicated by the yellow line. (B, D) Axial intensity line profile and its full width at half maximum (FWHM) are shown. (E, G) The Z-projection images of the Central complex neuropil (left, scale bar = 50 µm) and zoomed-in images of Ellipsoid body ring neurons (right, scale bar = 10 µm) obtained by 2P excitation (E) through the cuticle and (G) after removing the cuticle. Measurements of the axial resolution were taken at the locations indicated by the yellow line. (F, H) Axial intensity line profile and its FWHM is shown. The axial resolution of the 2P and 3P microscope is measured with 0.5 µm diameter fluorescent beads (shown in gray in the axial intensity line profiles). Axial intensity line profile of the location is fitted with a Lorentzian profile to the power of 2 and 3 for 2P and 3P excitation, respectively. Color bar shows the structure of the central complex at different imaging depths.
-
Figure 3—figure supplement 2—source data 1
Source data for plots for Figure 3—figure supplement 2B–H.
- https://cdn.elifesciences.org/articles/69094/elife-69094-fig3-figsupp2-data1-v3.xlsx
Figure 3—figure supplement 3
Structural imaging of mushroom body neurons using the cuticle-intact and cuticle-removed imaging preparations.
(A, C) The Z-projection images of the mushroom body (left, scale bar = 50 µm) and zoomed-in images of Kenyon cell bodies (right, scale bar = 10 µm) obtained by 3P excitation captured (A) through the cuticle and (C) after removing the cuticle. Measurements of the axial resolution were taken at the locations indicated by the yellow line. (B, D) Axial intensity line profile and its full width at half maximum (FWHM) is shown. (E, G) The Z-projection images of the mushroom body (left, scale bar = 50 µm) and zoomed-in images of Kenyon cells (right, scale bar = 10 µm) obtained by 2P excitation captured (E) through the cuticle and (G) after removing the cuticle. Measurements of the axial resolution were taken at the locations indicated by the yellow line. (F, H) Axial intensity line profile and its FWHM is shown. The axial resolution of the 2P and 3P microscope is measured with 0.5 µm diameter fluorescent beads (shown in gray in the axial intensity line profiles). Axial intensity line profile of the location is fitted with a Lorentzian profile to the power of 2 and 3 for 2P and 3P excitation, respectively. Color bar shows the structure of the mushroom body at different imaging depths.
-
Figure 3—figure supplement 3—source data 1
Source data for plots for Figure 3—figure supplement 3B–H.
- https://cdn.elifesciences.org/articles/69094/elife-69094-fig3-figsupp3-data1-v3.xlsx
Figure 3—figure supplement 4
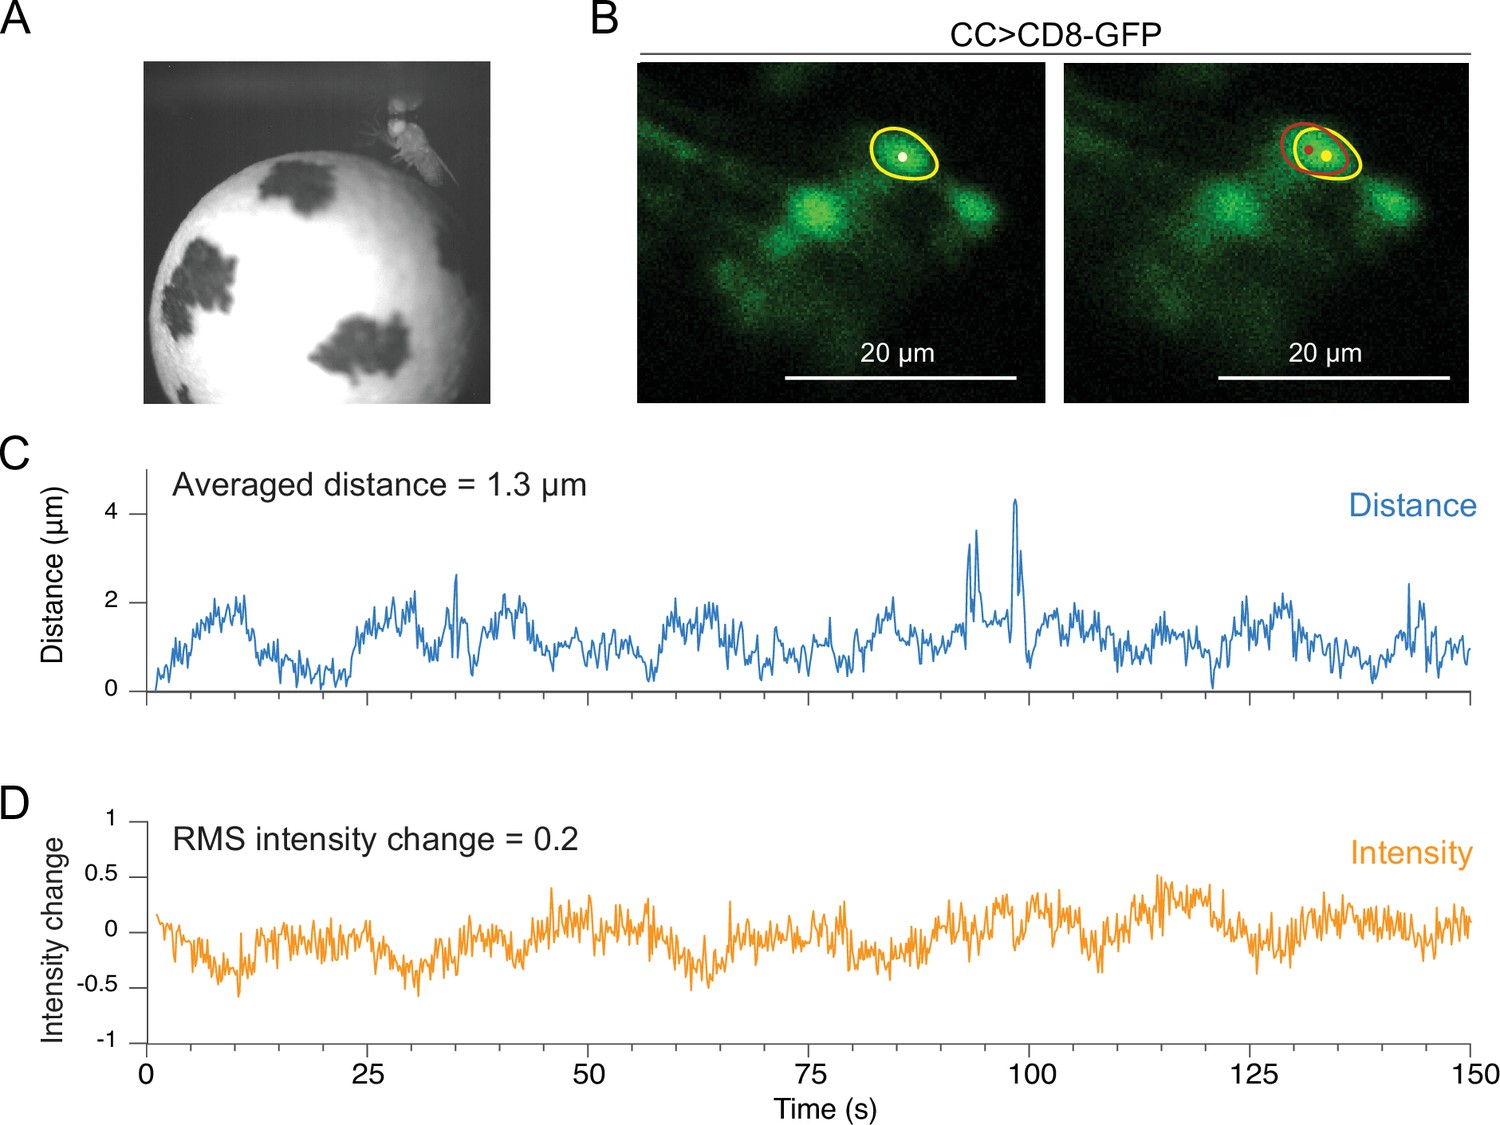
Motion analysis during through-cuticle imaging.
(A) Imaging setup. Fly is head fixed under the microscope objective, walking on a spherical treadmill. (B) Cross-section images of ellipsoid body ring neurons (scale bar = 20 µm). A single neuron’s cell body is selected as a region of interest and used for motion measurements (yellow and red circles). (C) Absolute movement distance is shown in blue. (D) The relative intensity change of a neuron, indicated as a yellow circle, is shown in orange (RMS, root mean square).
-
Figure 3—figure supplement 4—source data 1
Source data for plots for Figure 4—figure supplement 1.
- https://cdn.elifesciences.org/articles/69094/elife-69094-fig3-figsupp4-data1-v3.xlsx
Figure 4 with 1 supplement
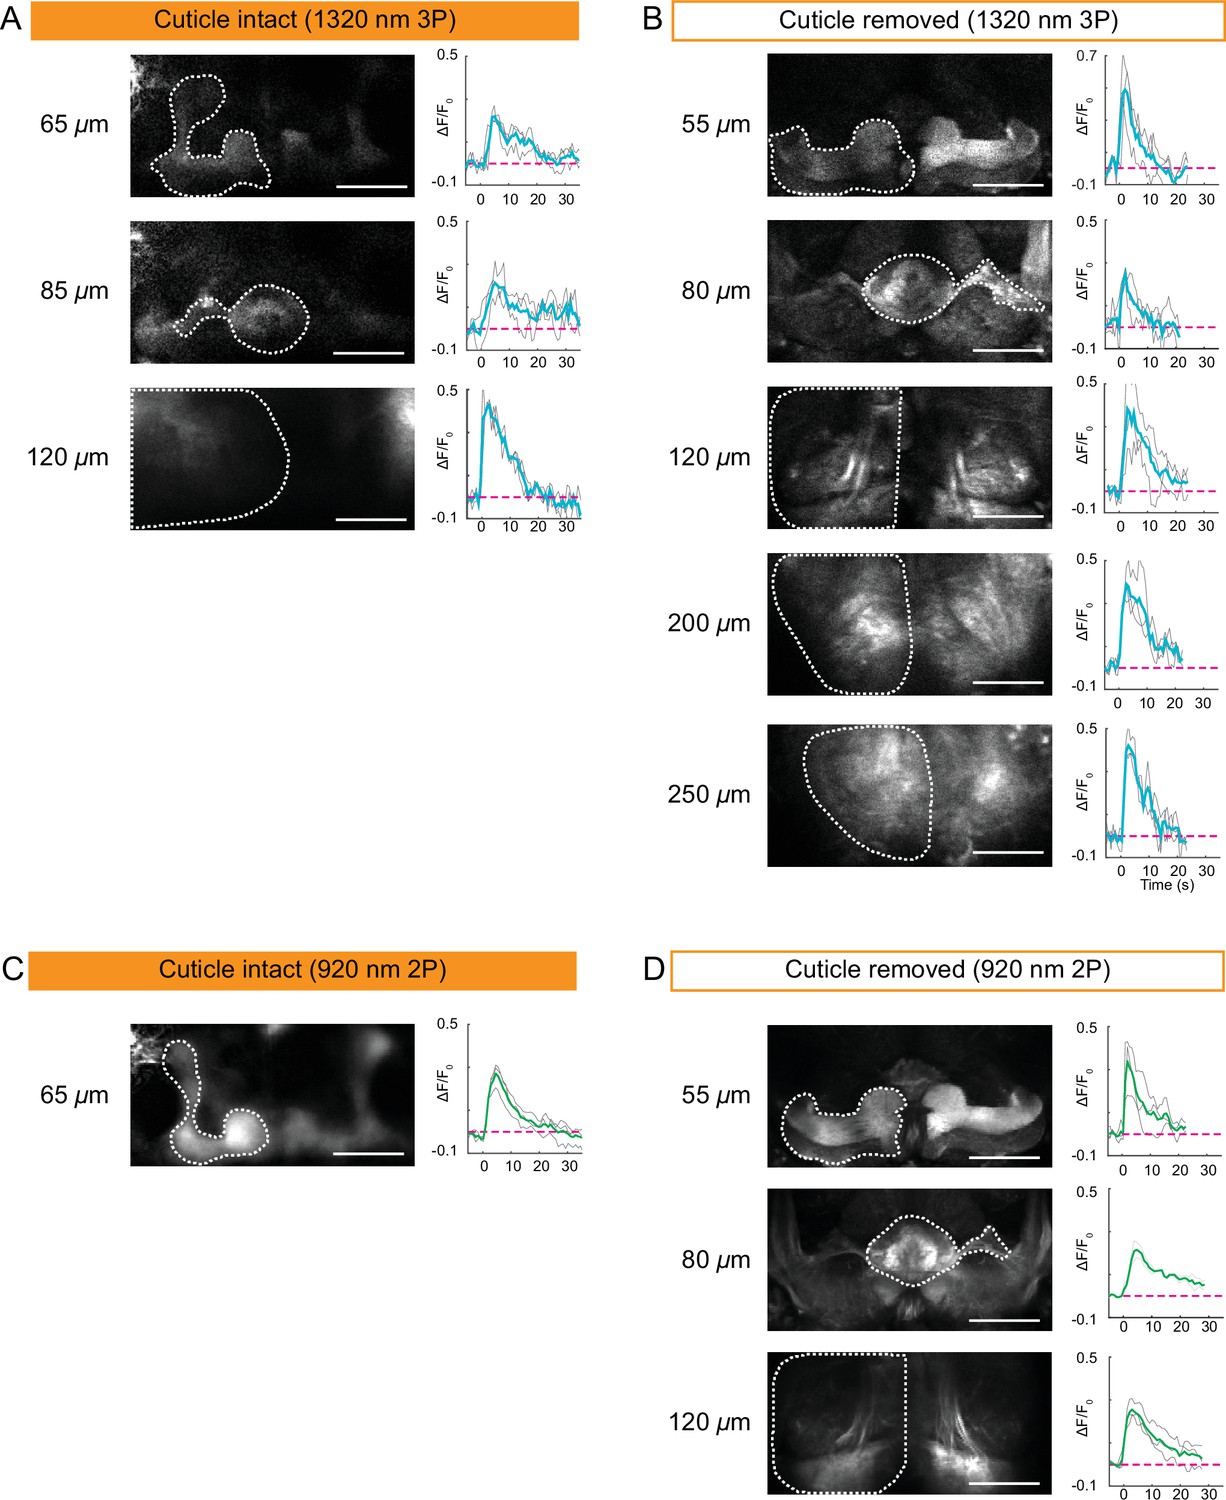
Cuticle-removed and cuticle-intact imaging of neural activity across the entire fly brain in response to electric shock.
(A–B) 3P imaging of neural activity of the fly brain neuropil at indicated depths using (A) the cuticle-intact and (B) the cuticle-removed imaging preparations upon 1 s electrical stimulation. (C–D) 2P imaging of neural activity of the fly brain neuropil at indicated depths using (C) the cuticle-intact and (D) the cuticle-removed imaging preparations upon 1 s electrical stimulation. The cross-section images at different depths are shown on the left (scale bar = 50 µm). Activity traces within the ROIs enclosed by dotted white lines are shown on the right. Gray lines show the traces of individual stimulations and green lines show the traces of an average of three stimulations. Images were captured at 256 × 128 pixels/frame and 6.5 Hz frame rate for 3P and 113 Hz frame rate for 2P. 3P and 2P data were averaged to 1.1 Hz effective sampling rate for plotting.
-
Figure 4—source data 1
Source data for plots for Figure 4A–D.
- https://cdn.elifesciences.org/articles/69094/elife-69094-fig4-data1-v3.xlsx
Figure 4—figure supplement 1
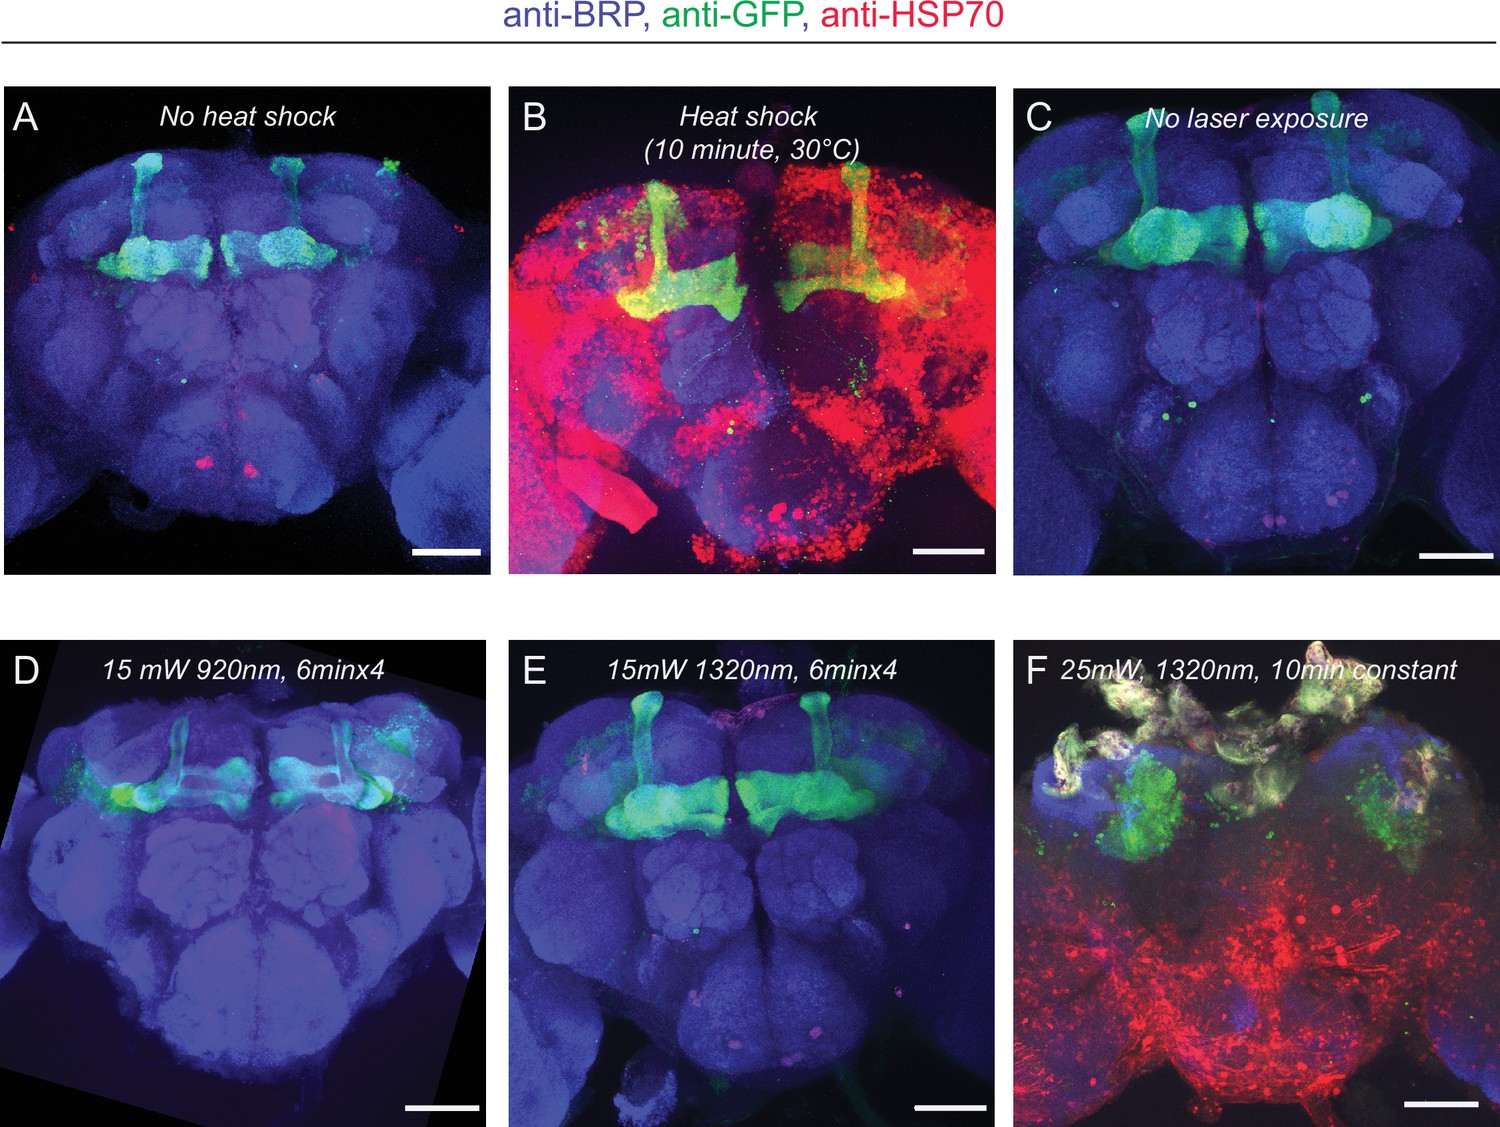
HSP70 staining of fly brains after 2P and 3P imaging.
(A–B) Representative images of fly brains before and after heat shock. (A) Without heat shock, there is minimal HSP70 protein expressed in the fly brain. (B) When flies are exposed to heat shock (30°C) for 10 min, the HSP70 protein expression is significantly elevated across the brain. (C) Flies head fixed/compressed but not exposed to laser show no HSP70 expression. (D–E) HSP70 protein expression in the fly brain after (D) 2P or (E) 3P excitation at indicated wavelengths and durations. No obvious change in HSP70 protein expression is observed at 15 mW. (F) HSP70 protein expression is significantly elevated when flies are exposed to 3P excitation above >25 mW for 10 min (scale bars = 50 µm, (n = 2–4 flies per condition)). Laser power is measured after the microscope objective lens using a power meter.
Figure 5 with 2 supplements
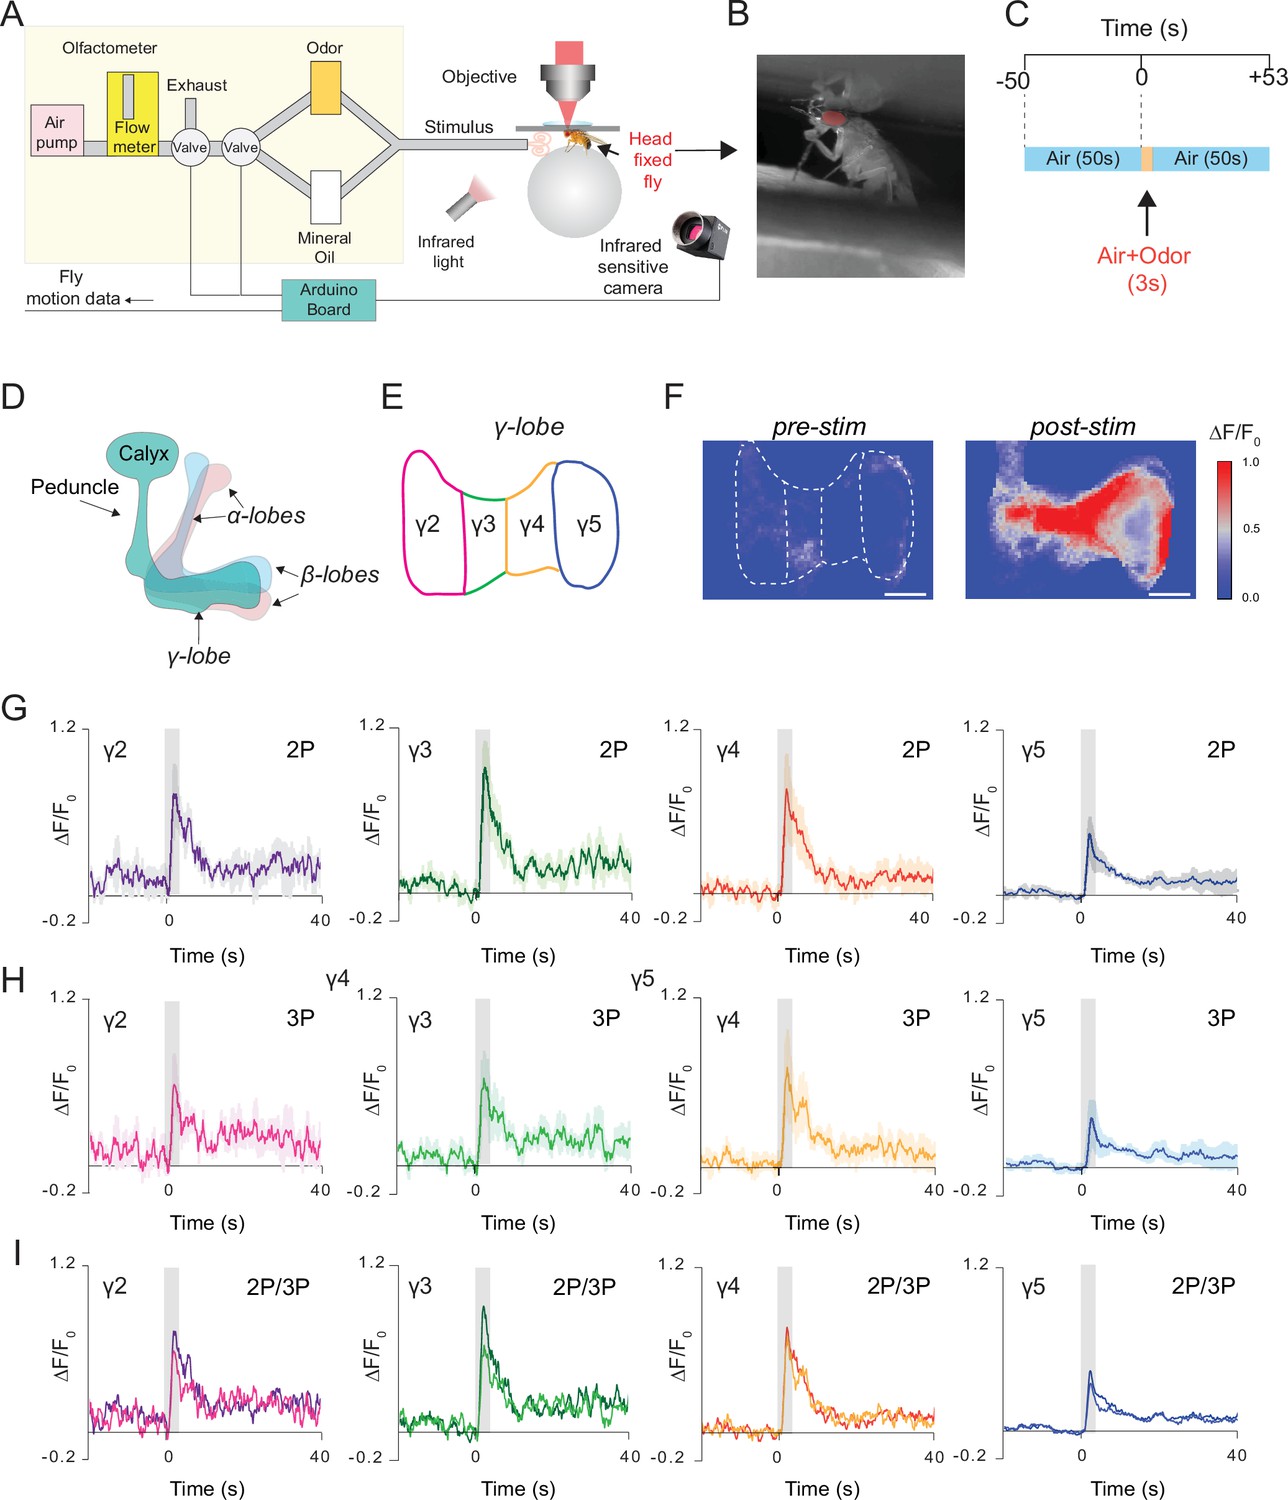
Simultaneous 2P and 3P functional imaging of short-term odor-evoked responses of the mushroom body Kenyon cells.
(A) Schematic of the custom-made olfactometer and the through-cuticle functional imaging setup. (B) Picture of the head-fixed fly on the ball under the multiphoton microscope. (C) Stimulus timeline. The same stimulus scheme was repeated five times using the same odor. (D) Schematic of the mushroom body anatomy indicating the locations of (α, β and γ) lobes. (E) γ-Lobes have discrete anatomical compartments (shown as γ2–γ5). (F) GCaMP6s is expressed in the mushroom body Kenyon cells. Normalized (ΔF/F0) GCaMP6s signal is shown before (left) and after (right) odor stimulus (scale bar = 20 m). (G) Odor-evoked responses of Kenyon cells captured by 2P excitation at 920 nm and (H) 3P excitation at 1320 nm. (I) Comparison of the average responses captured by simultaneous 2P and 3P imaging over time (n = 3 flies, 4–5 trials per fly, data are presented as mean ± SEM in (G) and (H), gray bar indicates when stimulus is present). Average laser powers are 5 mW at 920 nm and 4 mW at 1320 nm. Images were captured at 160 × 165 pixels/frame and 13.2 Hz frame rate. 2P and 3P data were averaged to 6.8 Hz effective sampling rate for plotting.
-
Figure 5—source data 1
Source data for plots Figure 5G-I.
- https://cdn.elifesciences.org/articles/69094/elife-69094-fig5-data1-v3.xlsx
Figure 5—figure supplement 1
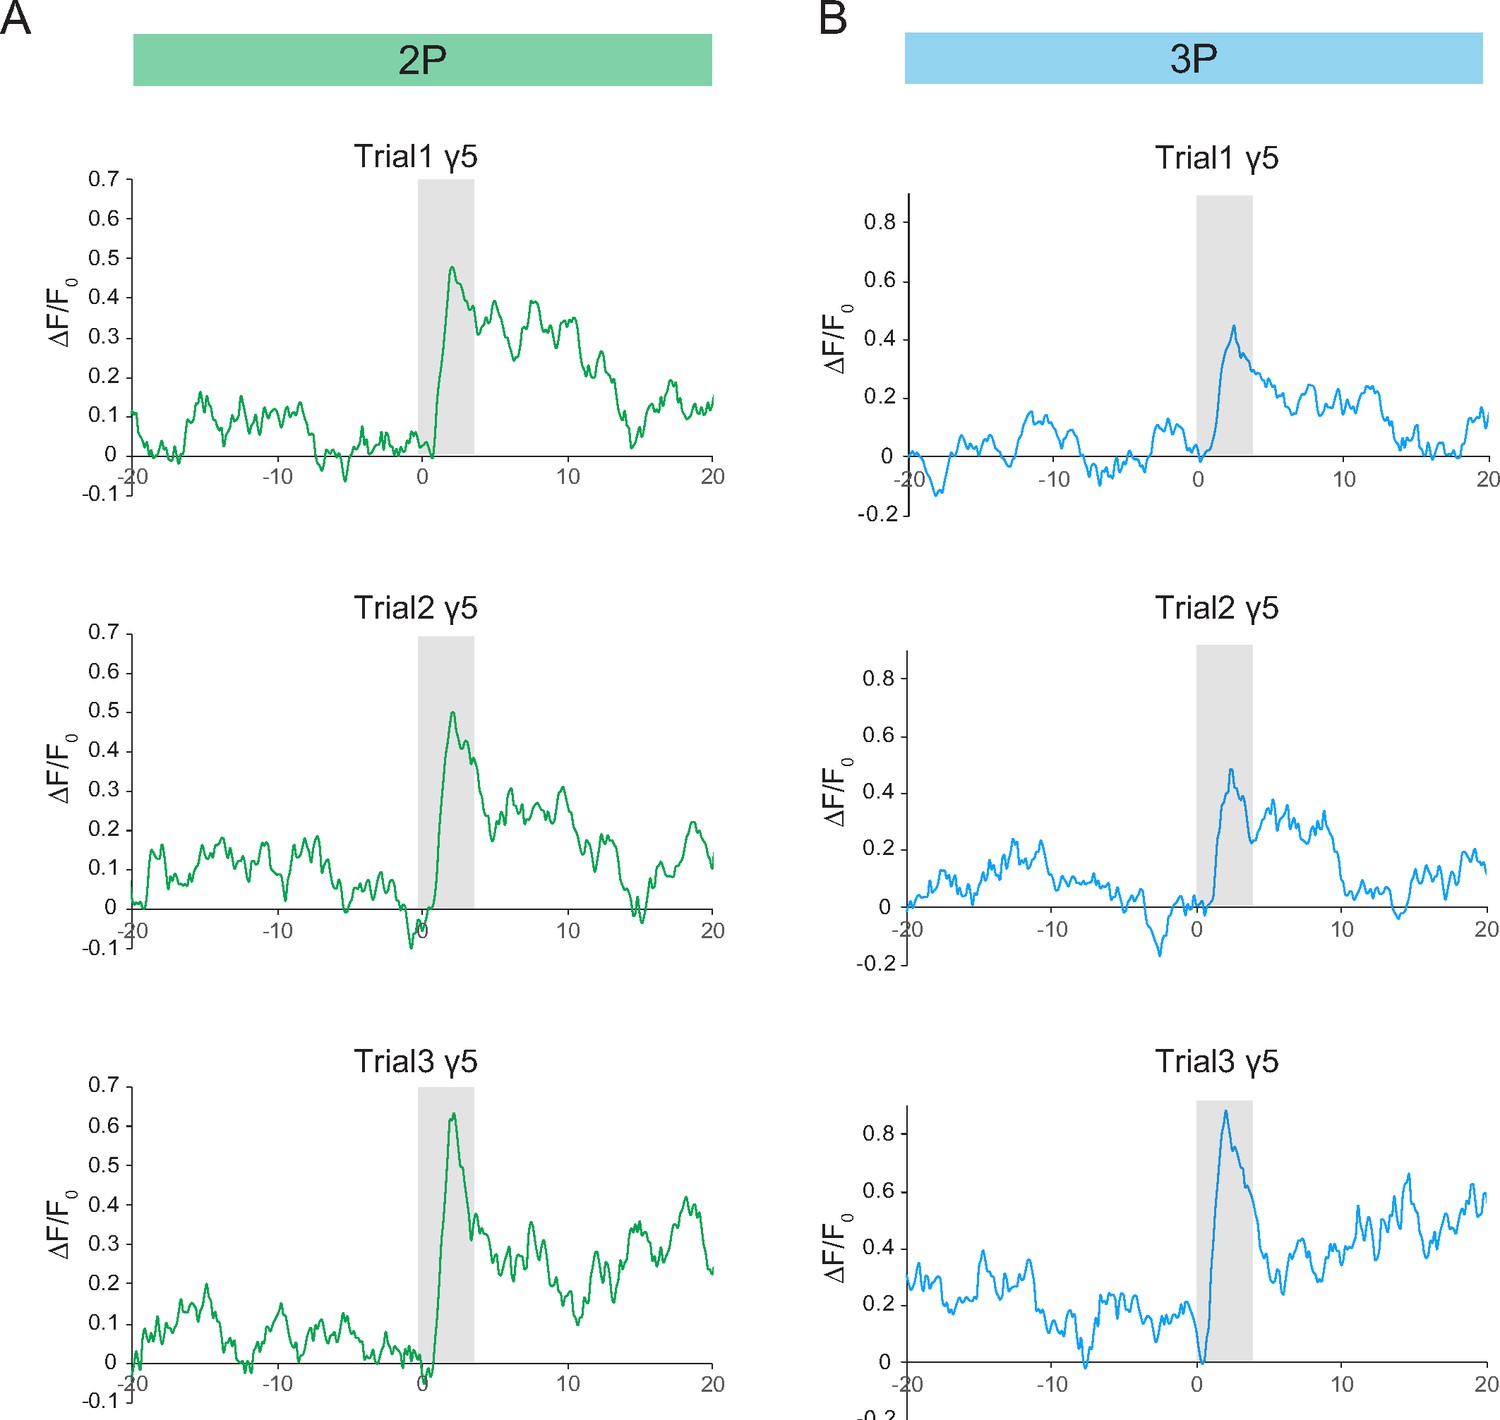
Single-trial neural activity traces of odor-evoked responses in the mushroom body γ5 lobes.
(A) Odor-evoked responses of mushroom body γ5 lobe captured by 2P excitation at 920 nm. Normalized (ΔF/F0) GCaMP6s signal is shown for three consecutive trials. (B) Odor-evoked responses of mushroom body γ5 lobe captured by 3P excitation at 1320 nm. Normalized (ΔF/F0) GCaMP6s signal is shown for three consecutive trials. Gray bar indicates when odor stimulus is present. Images were captured at 160 × 165 pixels/frame and 13.2 Hz frame rate. 2P and 3P data were averaged to 6.8 Hz effective sampling rate for plotting.
Figure 5—figure supplement 2
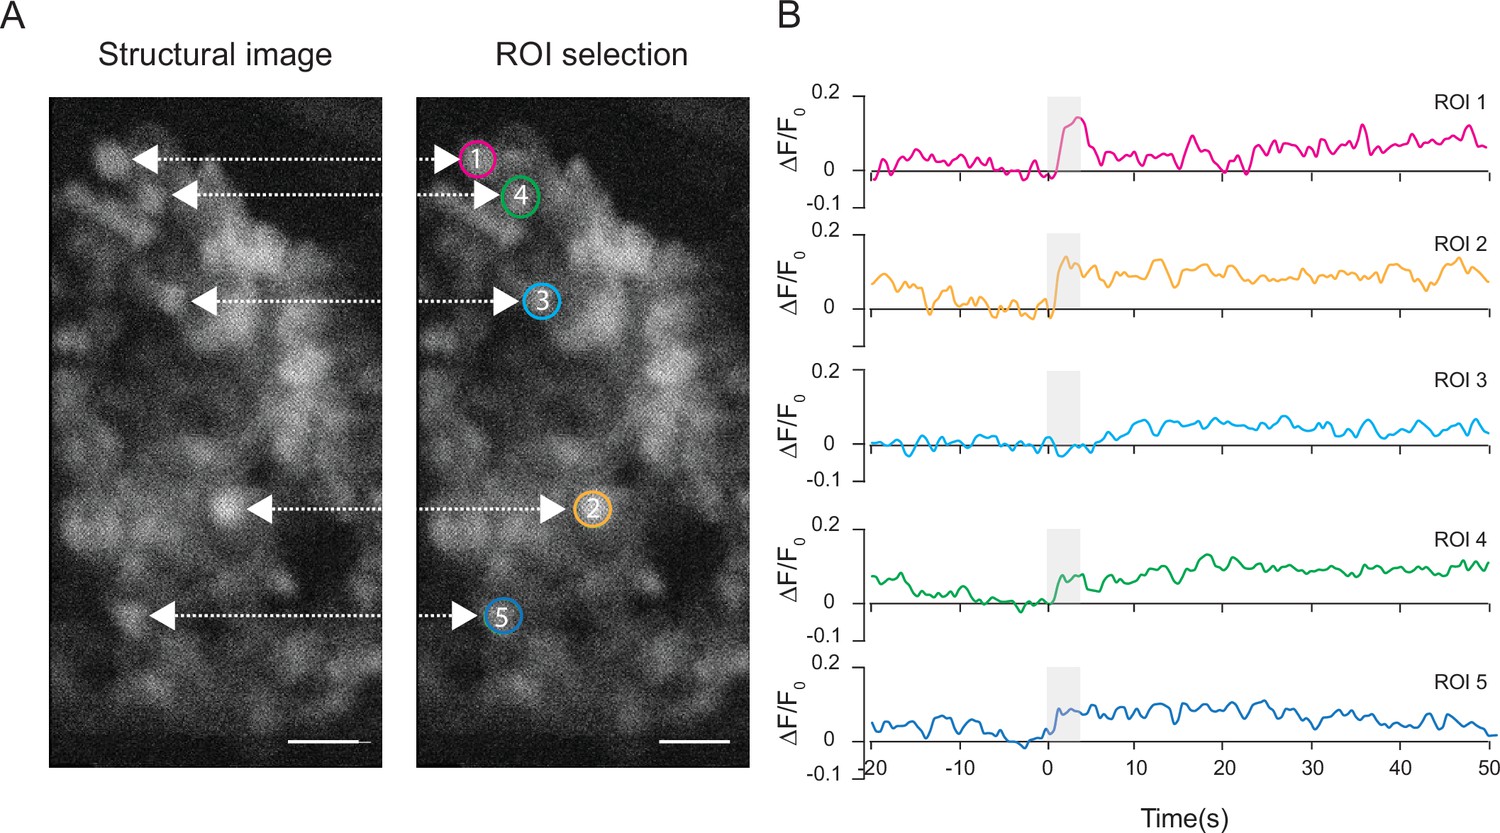
Neural activity traces from individual Kenyon cell bodies.
(A) Structural images of the Kenyon cell bodies and region of interest (ROI) selection. (B) Quantification of the normalized ΔF/F0 signal over time in five ROIs representing five Kenyon cells imaged with 3P excitation through the intact cuticle. Gray bar indicates when the odor stimulus is present (scale bars = 10 µm). Single trial responses are shown for each ROI.
Figure 6
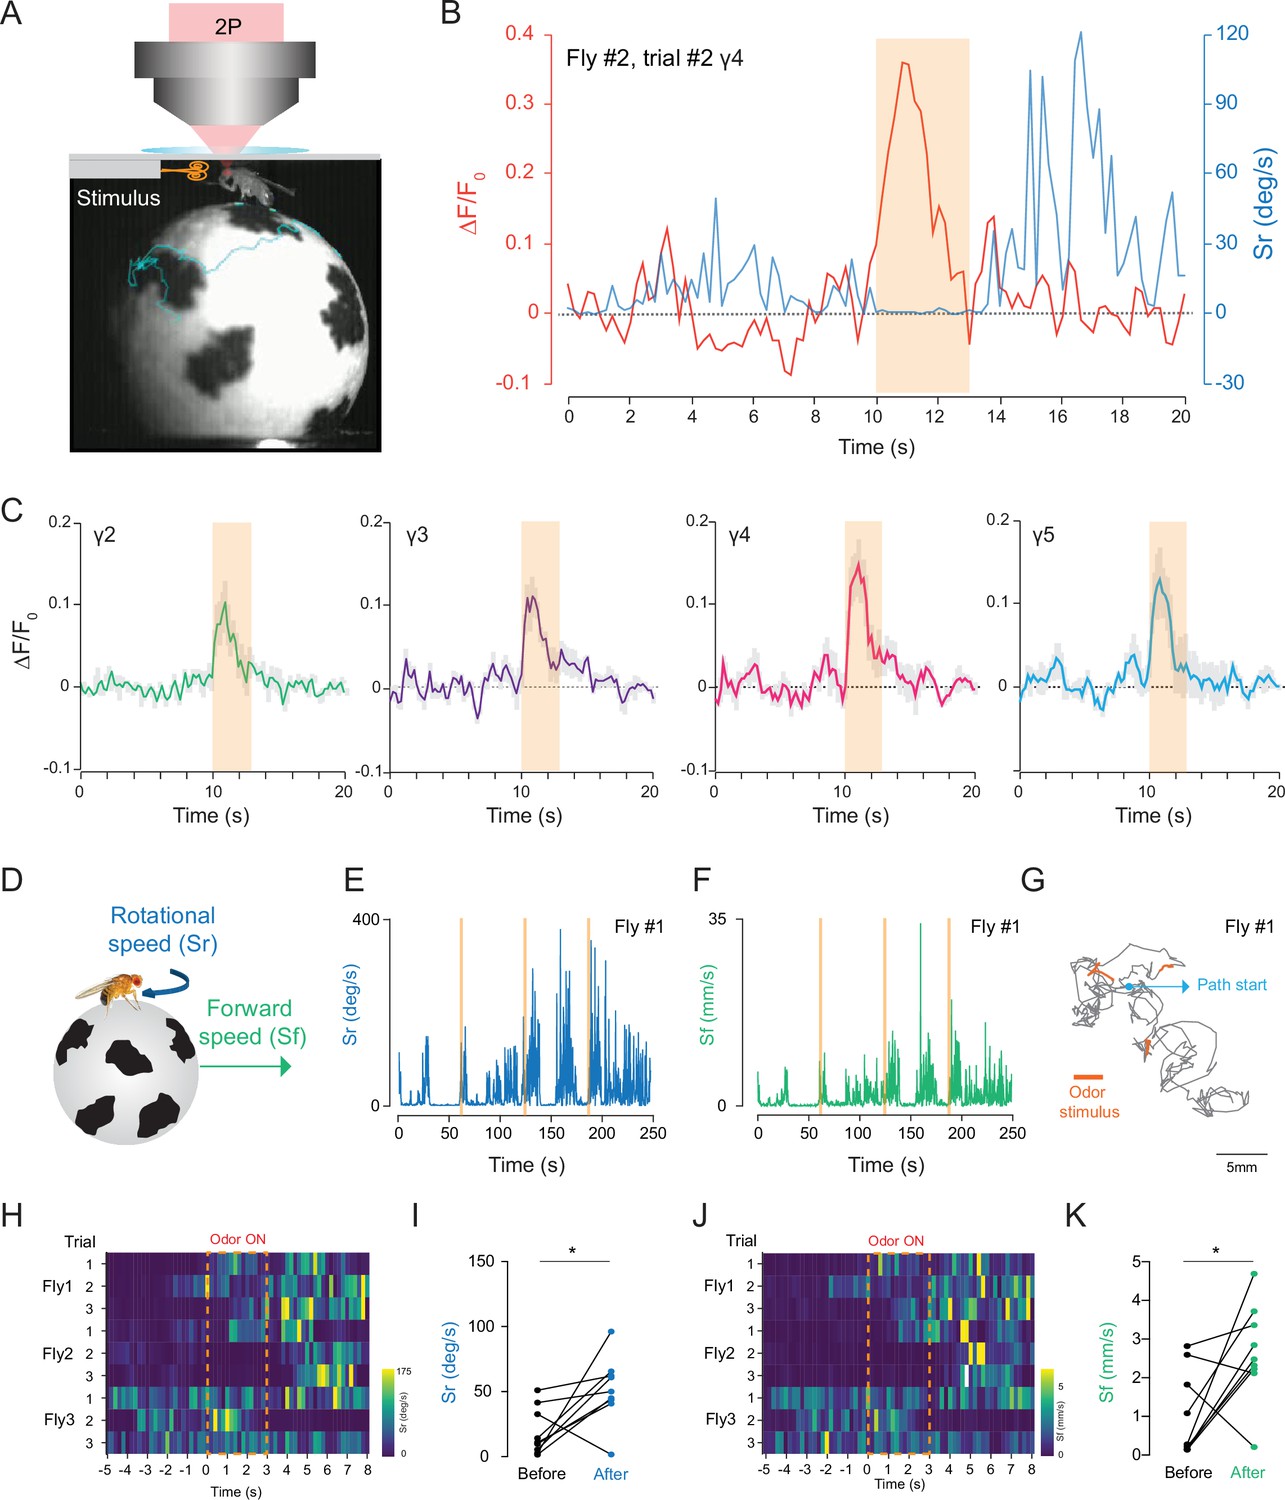
2P functional imaging of odor-evoked responses in walking flies.
(A) Schematic of the custom-made odor delivery and spherical treadmill system. (B) Odor-evoked response in mushroom body four compartment is overlaid with the rotational speed (Sr) measured at the same time. (C) Normalized (ΔF/F0) GCaMP6s signal is shown during the odor stimulation experiments. Odor-evoked responses of Kenyon cells are captured by 2P excitation at 920 nm (n = 3 flies, 3 trials per fly, data are presented as mean ± SEM). (D) Schematics showing measurements of the rotational and forward speed of flies on the spherical treadmill. (E–G) Representative plots for a single fly during the odor stimulation experiments showing rotational speed (Sr) (E), forward speed (Sf) (F) as a function of time, and the total calculated 2D fictive path (G). (H–K) Summary heatmap plots and statistical comparison for rotational (H–I) and forward speed (J–K) 5 s before and after the odor stimulation (n = 3 flies, 3 trials per fly, paired-two tail t-test, p=0.0225). Average laser power at 920 nm is <10 mW. Images were captured at 256 × 128 pixels/frame and 17 Hz frame rate. 2P data were averaged to 5 Hz effective sampling rate for plotting.
-
Figure 6—source data 1
Source data for plots Figure 6B and C.
- https://cdn.elifesciences.org/articles/69094/elife-69094-fig6-data1-v3.xlsx
-
Figure 6—source data 2
Source data for plots Figure 6E-K.
- https://cdn.elifesciences.org/articles/69094/elife-69094-fig6-data2-v3.xlsx
Figure 7
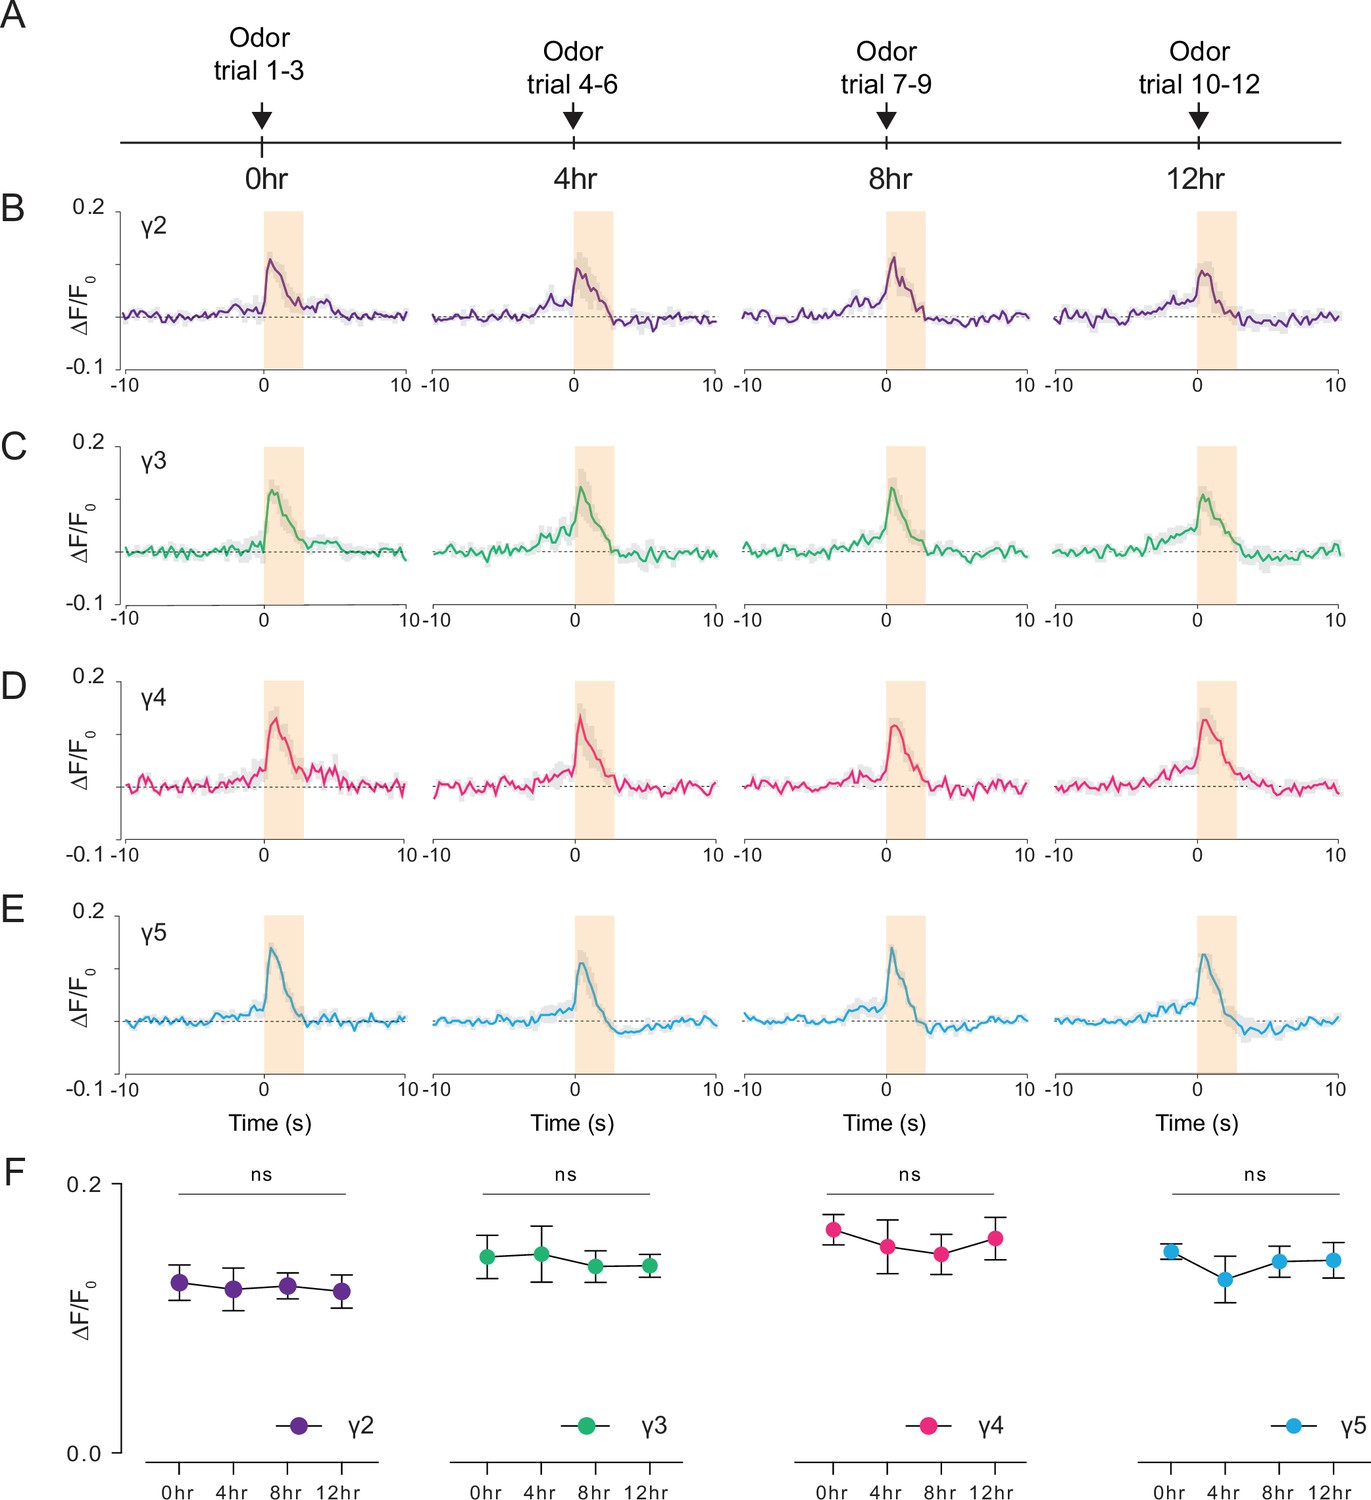
Long-term 2P imaging of odor-evoked responses of the mushroom body γ-lobes.
(A) Stimulus timeline for long-term odor imaging. GCaMP6s fluorescence signal is captured from Kenyon cells axons innervating mushroom body γ-lobes using the semi compressed preparation. (B–E) Quantification of the normalized signal (ΔF/F0) over time in each γ-lobe compartment. Light orange bar indicates when the odor stimulus is present. Each colored line indicates the average response of a fly over multiple trials in a given hour. The average response of three flies is shown. Each compartment’s response is labeled with a different color. (F) Quantification of the peak amplitude across different time points and lobes (dF/F0) (Two-way repeated measures ANOVA. Data are presented as mean ± SEM, ns, not significant; n = 3 flies, 3 trials per time point). Average laser power at 920 nm is <10 mW. Images were captured at 256 × 128 pixels/frame and 17 Hz frame rate. 2P data were averaged to 5 Hz effective sampling rate for plotting.
-
Figure 7—source data 1
Source data for plots Figure 7B-E (t=0hr).
- https://cdn.elifesciences.org/articles/69094/elife-69094-fig7-data1-v3.xlsx
-
Figure 7—source data 2
Source data for plot Figure 7B-E (t=4hr).
- https://cdn.elifesciences.org/articles/69094/elife-69094-fig7-data2-v3.xlsx
-
Figure 7—source data 3
Source data for plots Figure 7B-E (t=8hr).
- https://cdn.elifesciences.org/articles/69094/elife-69094-fig7-data3-v3.xlsx
-
Figure 7—source data 4
Source data for plots Figure 7B-E (t=12hr).
- https://cdn.elifesciences.org/articles/69094/elife-69094-fig7-data4-v3.xlsx
-
Figure 7—source data 5
Source data for plot Figure 7F.
- https://cdn.elifesciences.org/articles/69094/elife-69094-fig7-data5-v3.xlsx
Videos
Video 1
Video demonstrating how to prepare flies for through-cuticle imaging.
Video 2
Z stack of the mushroom body Kenyon cells expressing GCaMP6s.
Imaging is done through the head cuticle using 1320 nm (3P) excitation after removing air sacs only on one side of the head (scale bar = 50 µm, no head compression).
Video 3
Z stack of the ellipsoid body ring neurons expressing CD8-GFP.
Imaging through the head cuticle at 1320 nm (3P) excitation (scale bar = 20 µm, semi compressed preparation).
Video 4
T stack of the ellipsoid body ring neurons expressing CD8-GFP.
Imaging through the intact head cuticle at 1320 nm (3P) excitation (scale bar = 20 µm, air sac-removed preparation).
Video 5
Short-term 2P imaging of mushroom body γ-lobe neural activity captured through the intact fly head cuticle during walking and odor exposure.
Functional imaging is performed in walking flies during a food odor stimulation (apple cider vinegar) with 2P excitation at 920 nm (semi compressed preparation, scale bar = 50 µm). Video is 5× speed up.
Video 6
Chronic 2P imaging of mushroom body γ-lobe neural activity captured through the intact fly head cuticle during odor exposure.
Chronic functional imaging is performed during a food odor stimulation (apple cider vinegar) with 2P excitation at 920 nm (semicompressed preparation, scale bar = 50 µm). Video is 10× speed up.
Tables
Key resources table
| Reagent type (species) or resource | Designation | Source or reference | Identifiers | Additional information |
|---|---|---|---|---|
| Genetic reagent (Drosophila melanogaster) | Mef2-GAL4 | Bloomington Drosophila Stock Center | BDSC: 50,742 | |
| Genetic reagent (Drosophila melanogaster) | GMR15B07-GAL4 | Bloomington Drosophila Stock Center | BDSC: 48,678 | |
| Genetic reagent (Drosophila melanogaster) | GMR57C10-GAL4 | Bloomington Drosophila Stock Center | BDSC: 39,171 | |
| Genetic reagent (Drosophila melanogaster) | 10XUAS-IVS-mCD8-GFP | Bloomington Drosophila Stock Center | BDSC: 32,186 | |
| Genetic reagent (Drosophila melanogaster) | 20XUAS-IVS-GCaMP6s | Bloomington Drosophila Stock Center | BDSC: 42,746 | |
| Antibody | anti-GFP (Rabbit polyclonal) | Torrey Pines | TP40 | IF (1:1000) |
| Antibody | anti-HSP70(Rat monoclonal) | Sigma | SAB5200204 | IF (1:200) |
| Antibody | anti-BRP (Mouse monoclonal) | DSHB | nc82 | IF (1:20) |
| Antibody | DyLight 488(Goat polyclonal anti-Rabbit) | Invitrogen | 35,552 | IF (1:1000) |
| Antibody | AlexaFluor 546 (Goat polyclonal anti-Rat) | Invitrogen | A-11081 | IF (1:1000) |
| Antibody | AlexaFluor 633 (Goat polyclonal anti-Mouse) | Invitrogen | A-21052 | IF (1:250) |
| Other | PBS | Lonza BioWhittaker | #17-517Q | |
| Other | Vectashield | Vector Labs | #H-1000–10 |
Additional files
Download links
A two-part list of links to download the article, or parts of the article, in various formats.
Downloads (link to download the article as PDF)
Open citations (links to open the citations from this article in various online reference manager services)
Cite this article (links to download the citations from this article in formats compatible with various reference manager tools)
Multiphoton imaging of neural structure and activity in Drosophila through the intact cuticle
eLife 11:e69094.
https://doi.org/10.7554/eLife.69094


