An engineered transcriptional reporter of protein localization identifies regulators of mitochondrial and ER membrane protein trafficking in high-throughput CRISPRi screens
- Department of Genetics, Stanford University, United States
- Chan Zuckerberg Biohub, United States
- Broad Institute of MIT and Harvard, United States
- Whitehead Institute, United States
- Department of Biology, Massachusetts Institute of Technology, United States
- Department of Cellular and Molecular Pharmacology, University of California, San Francisco, United States
- Howard Hughes Medical Institute, University of California, San Francisco, United States
- Department of Biology, Stanford University, United States
Figures
Figure 1 with 5 supplements
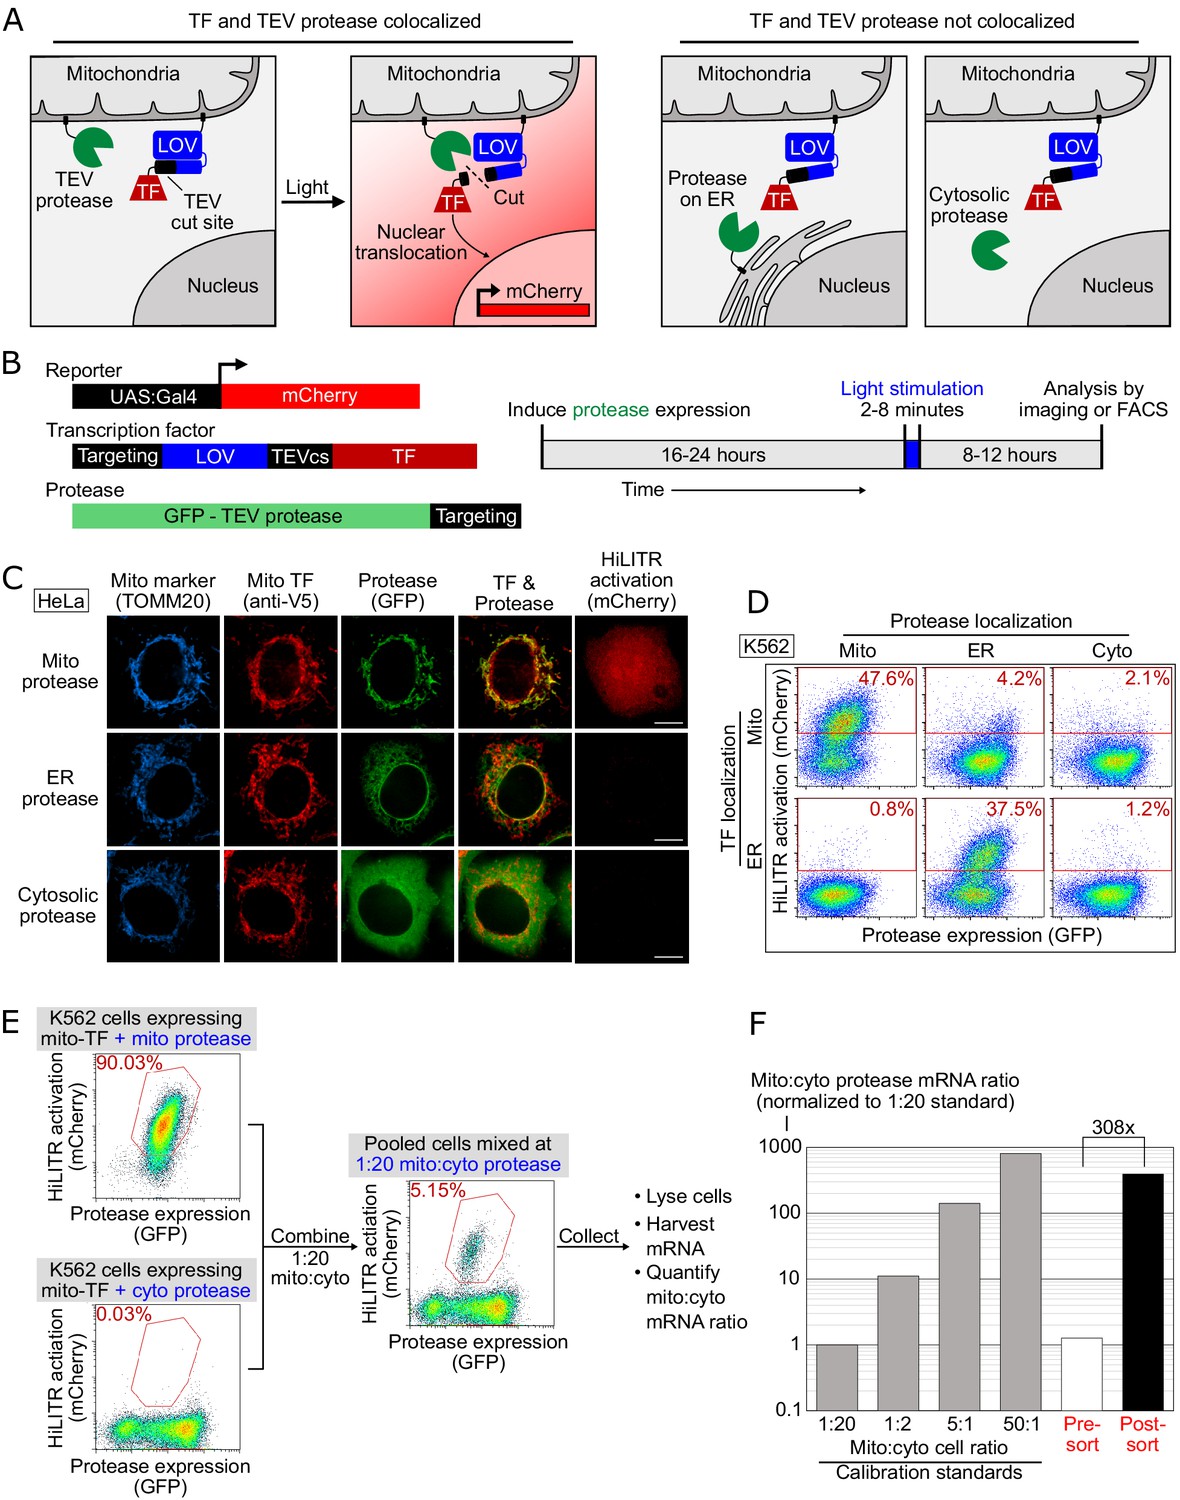
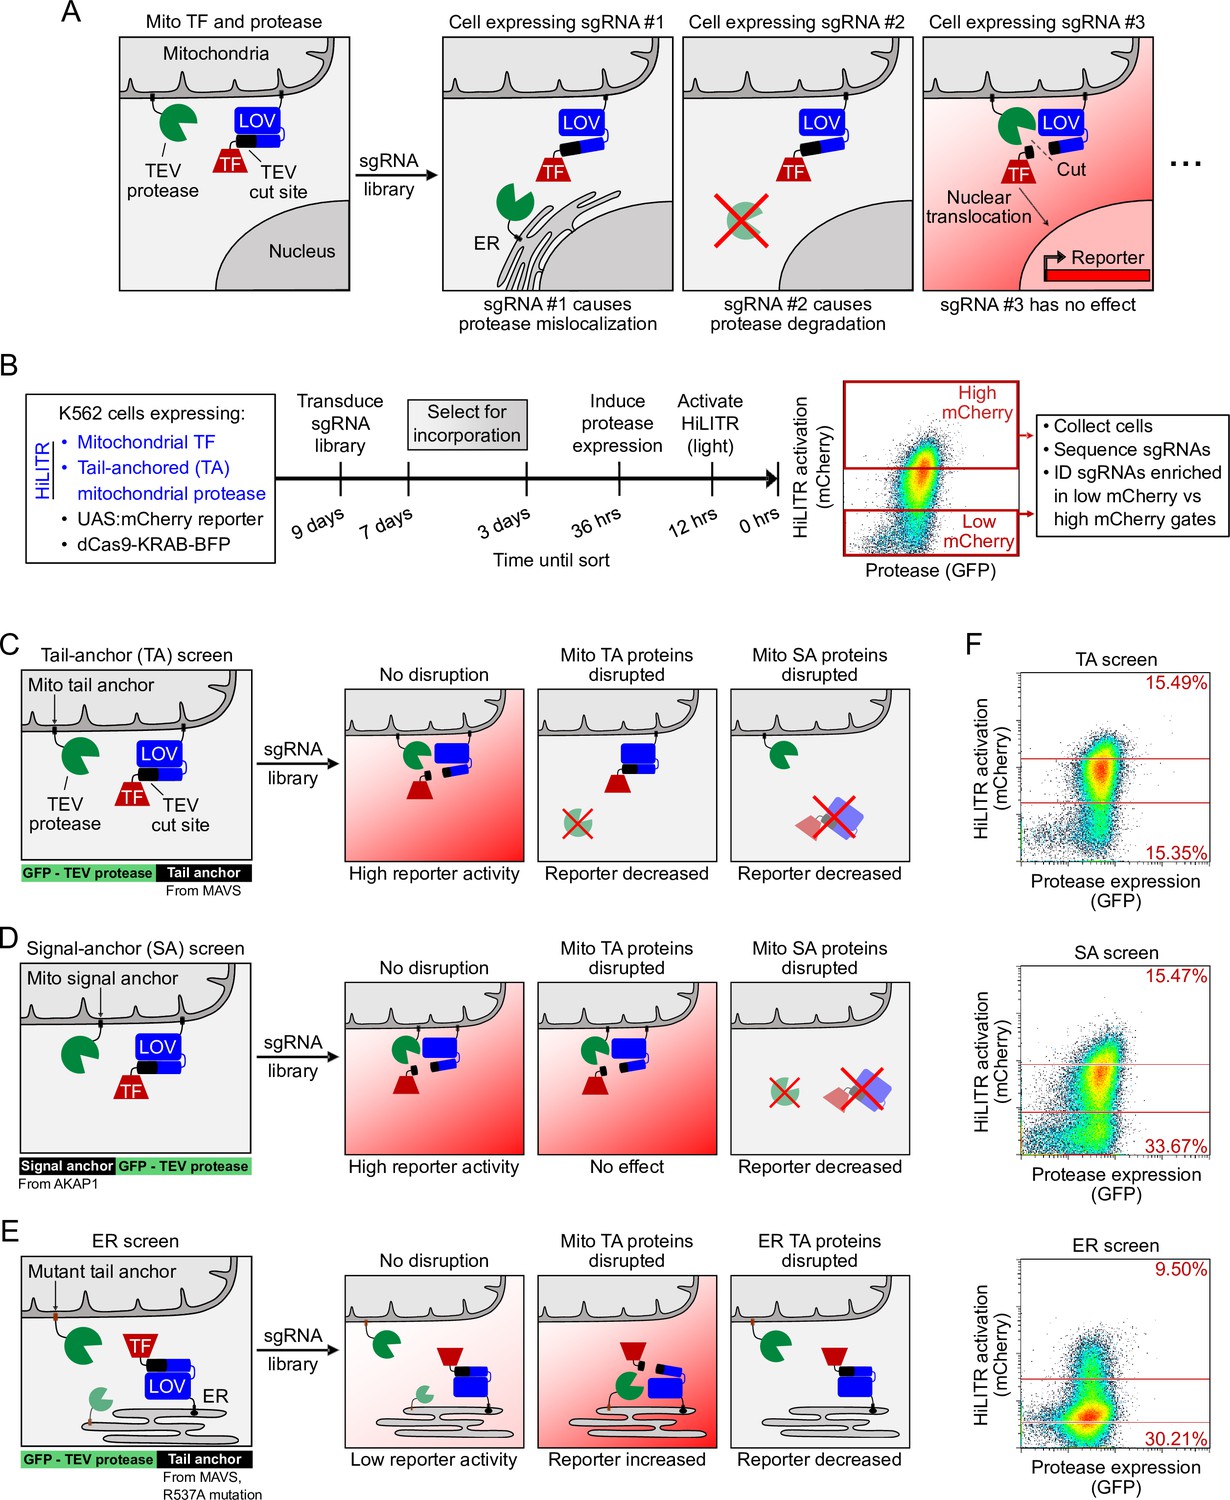
HiLITR gives transcriptional readout of protein localization in living cells.
(A) Schematic of HiLITR. HiLITR has two components: a low-affinity protease (green) and a membrane-anchored transcription factor (TF, red). Left: when protease and TF are colocalized on the same organelle, and 450 nm blue light is supplied, the TF is released by proximity-dependent cleavage and drives reporter gene expression. Right: when protease and TF are not colocalized, HiLITR is off. (B) Domain structures of HiLITR components and timeline for HiLITR usage. The targeting domain is a protein or localization peptide that directs the TF/protease to the desired subcellular region (such as the mitochondrion in A, left). (C) Fluorescence images of HiLITR in HeLa cells. TF is on the outer mitochondrial membrane (OMM), and protease is localized to the OMM (top row), ER membrane (middle), or cytosol (bottom). mCherry is the reporter gene and TOMM20 is a mitochondrial marker. Cells were stimulated with 450 nm light for 3 min, then fixed and stained 8 hr later. Scale bars, 10 µm. (D) Fluorescence-activated cell sorting (FACS) plots of K562 cells expressing HiLITR. TF is on the OMM (top row) or ER membrane (bottom row), while protease localization is varied as indicated. Light stimulation was 3 min. mCherry on the y-axis reports HiLITR activation, and GFP on the x-axis reports protease expression level. Percentage of cells above the red line is quantified in each plot. (E) Model selection on K562 cells expressing HiLITR TF on mitochondria. Cells with mitochondrial protease (colocalized with TF) versus cytosolic protease (not colocalized with TF) were combined in a 1:20 ratio. Cells were stimulated with light for 3.5 min and sorted for high mCherry expression 8 hr later. (F) qPCR analysis of mito- and cyto-protease transcript from predefined, pre-sort, and post-sort cell mixtures from (E). Mito-protease cells were enriched 308-fold over cyto-protease cells in one round of FACS sorting. Full data in Figure 1—source data 1.
-
Figure 1—source data 1
Source data for Figure 1F.
- https://cdn.elifesciences.org/articles/69142/elife-69142-fig1-data1-v2.xlsx
Figure 1—figure supplement 1
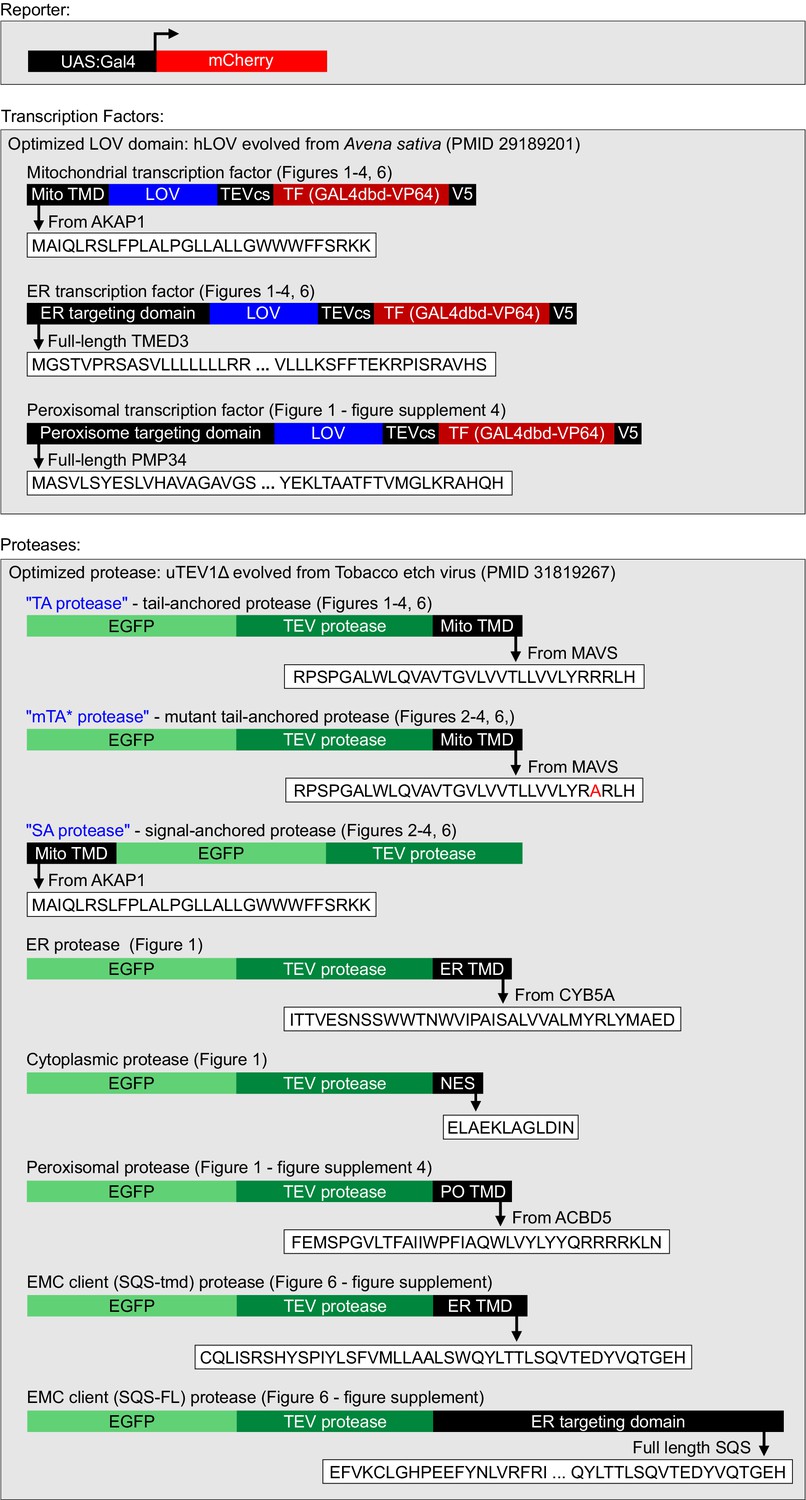
Details for HiLITR constructs used in this study.
LOV, TF, and TEV protease domains used in Figure 1—figure supplements 2 and 3 (HiLITR optimization) vary slightly. Any differences are shown and discussed in the text.
Figure 1—figure supplement 2
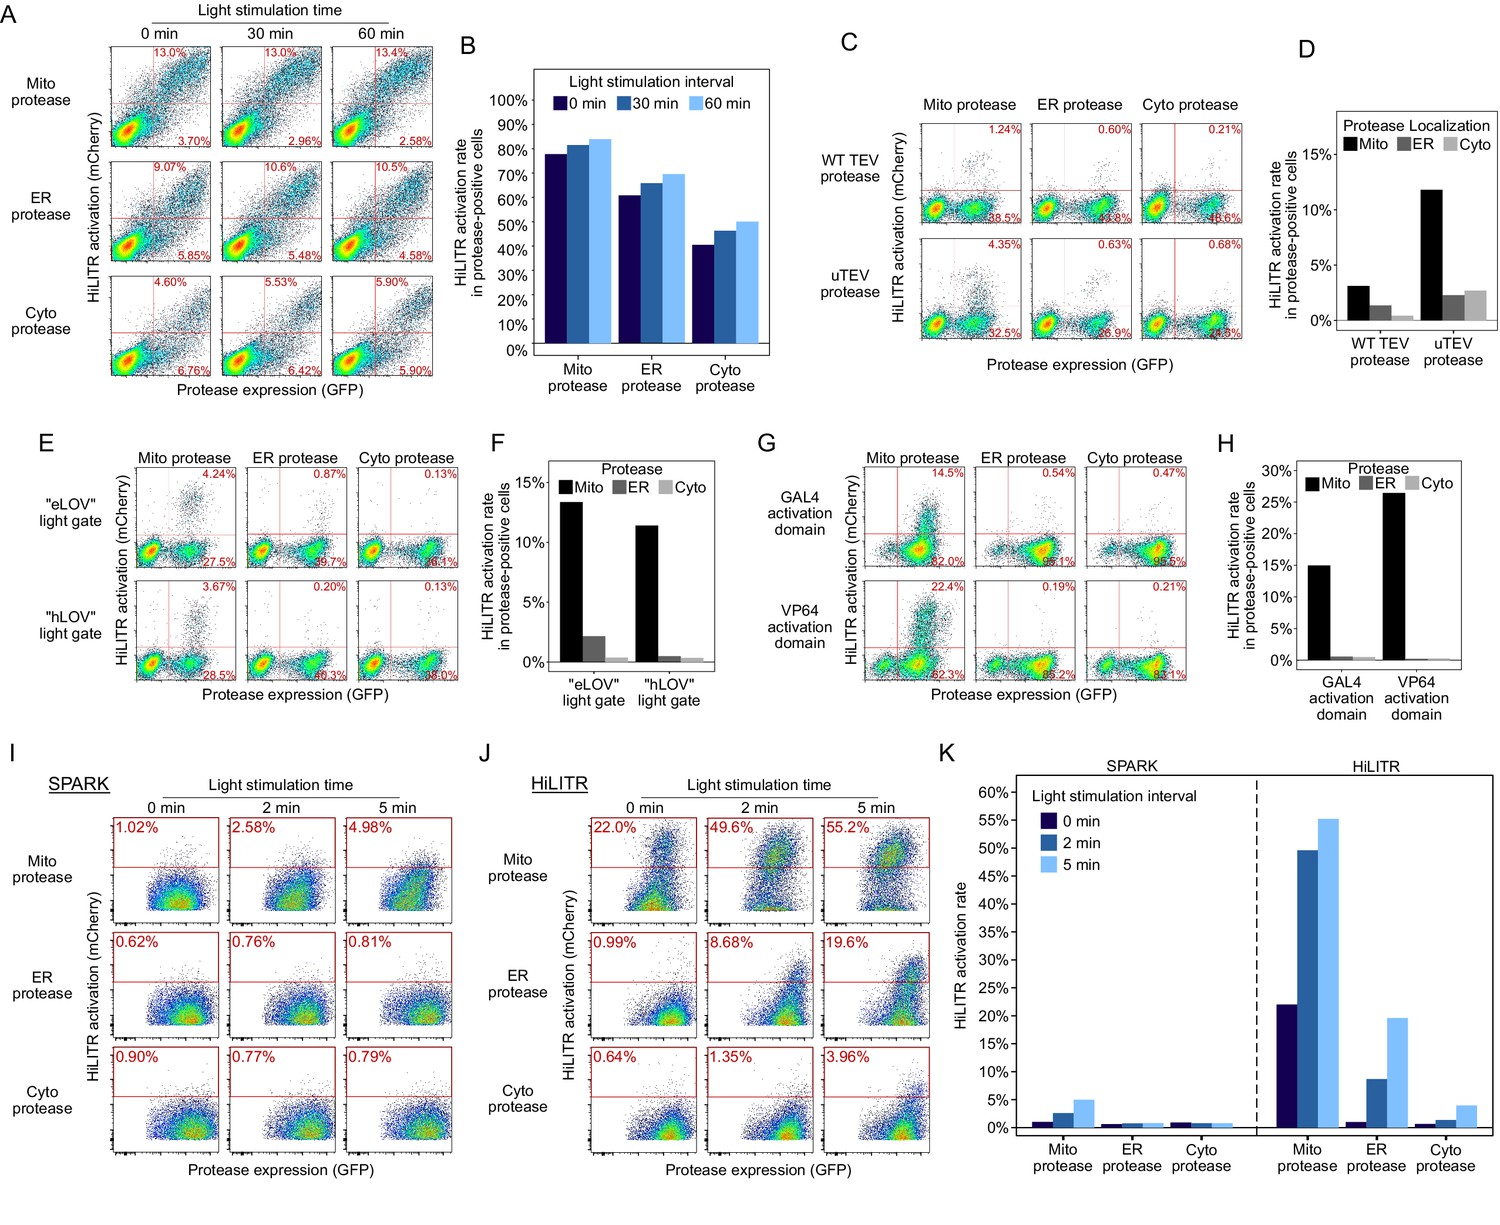
Sequential optimization of HiLITR components.
(A) Fluorescence-activated cell sorting (FACS) plots of HEK cells transiently transfected with unoptimized HiLITR components. Transcription factor (TF) is on the outer mitochondrial membrane (OMM), while protease is localized to the OMM (top row), ER membrane (middle), or cytosol (bottom). mCherry on the y-axis reports HiLITR turn-on, while GFP on the x-axis reports protease expression level. In (A), (C), (E), and (G), the percentage of cells in each of the two right quadrants is shown in red. The TF component contains ‘eLOV’ (Wang et al., 2017) and the GAL4 activation domain. The protease used here is wild-type TEV truncated at amino acid 219 (Wang et al., 2017). (B) Quantitation of the results in (A). The fraction of cells expressing both protease and reporter (top value in FACS plot) was divided by the total fraction of protease-positive cells (sum of top and bottom values). (C) FACS plots of K562 cells stably expressing HiLITR TF and mCherry reporter, and transduced with mitochondrial, ER, or cytosolic protease. Truncated wild-type TEV protease (top row) or ultraTEV (uTEV) protease (Sanchez and Ting, 2020; bottom row) were used. 2 min of light stimulation. (D) Quantitation of the results in (C). (E) FACS plots of K562 cells stably expressing mCherry reporter and TF containing ‘eLOV’ or improved ‘hLOV’ (Kim et al., 2017). Cells were transduced with uTEV protease targeted to the mitochondria, ER, or cytosol. No light stimulation was used. hLOV reduces background signal. (F) Quantitation of the results in (E). (G) FACS plots of K562 cells stably expressing mCherry reporter, protease, and GAL4 or VP64 TF activation domain variant. No light stimulation was used. (H) Quantitation of the results in (G). (I) FACS plots of K562 cells stably expressing mCherry reporter with our previously described SPARK tool (Kim et al., 2017). Protease was tested at the OMM, ERM, and cytosol, with 0, 2, or 5 min of light stimulation. (J) Same as (I), but with the optimized HiLITR components (mitochondrial TF, mitochondrial ‘TA protease,’ ER protease, and cytosolic protease shown in Figure 1—figure supplement 1). SPARK and optimized HiLITR differ in their TF and protease domains. (K) Quantitation of results in (I) and (J).
Figure 1—figure supplement 3
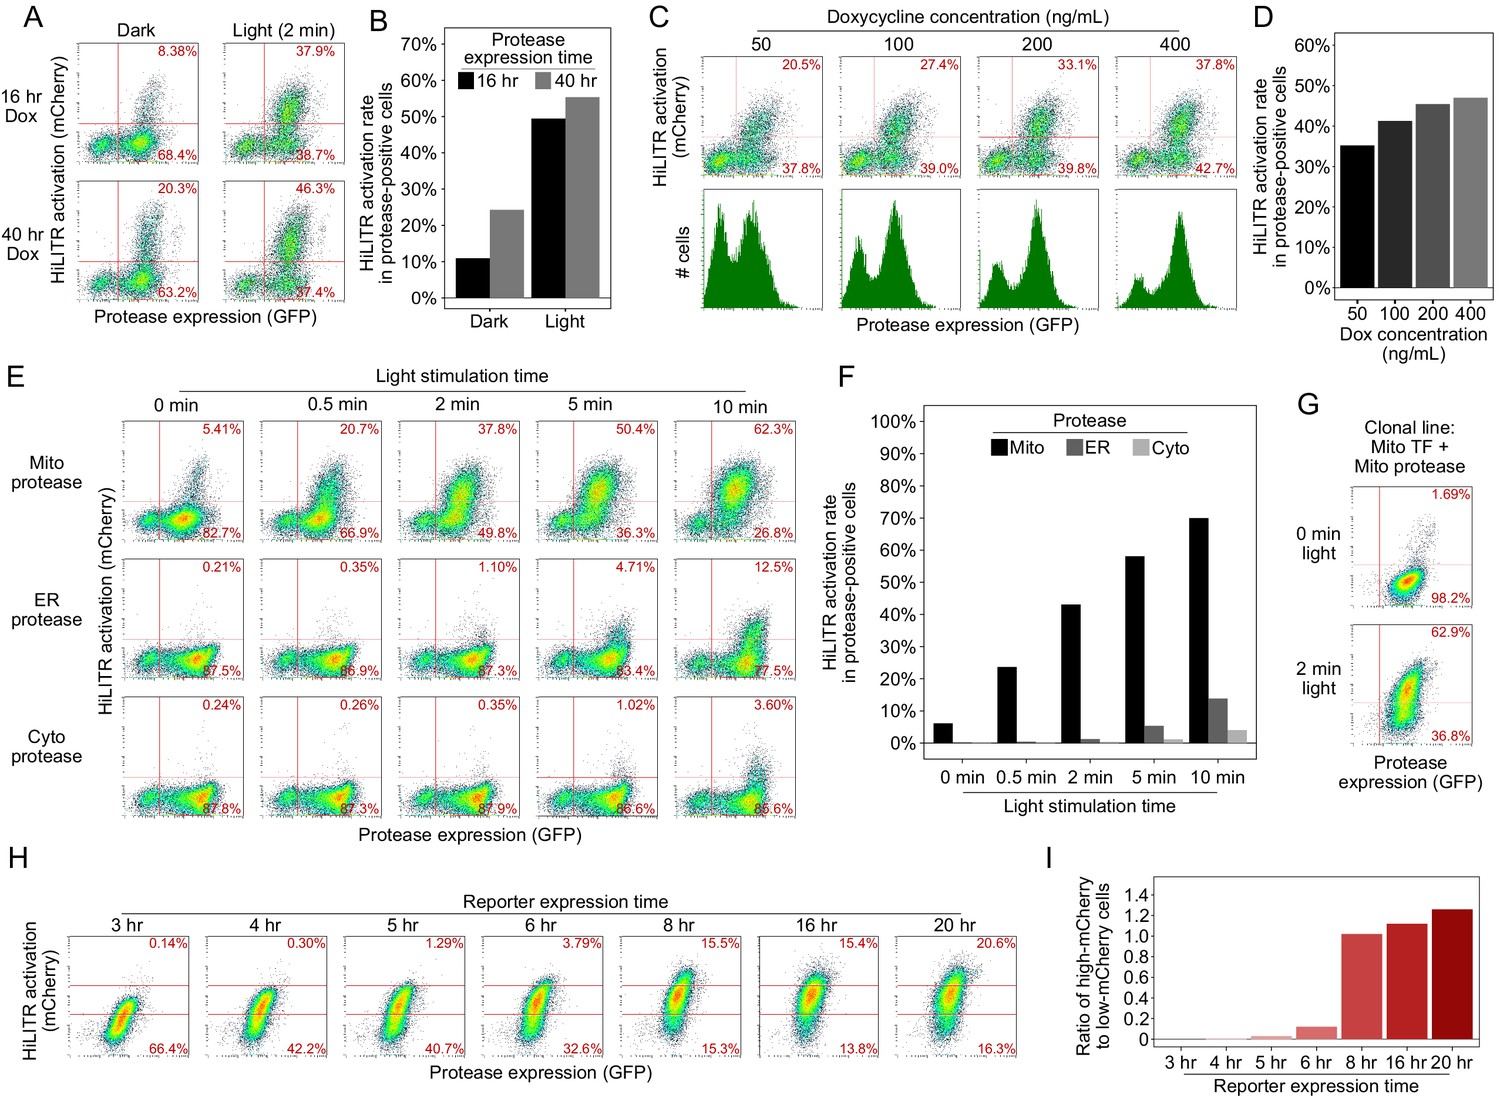
Optimization of HiLITR experimental parameters.
(A) Fluorescence-activated cell sorting (FACS) plots of K562 cells stably expressing optimized mitochondrial HiLITR components (outer mitochondrial membrane [OMM]-targeted protease and transcription factor [TF]). Protease expression was induced with doxycycline for either 16 hr or 40 hr, and cells were left in the dark or exposed to light for 2 min. In (A), (C), (E), and (H), the percentage of cells in each right quadrant is quantified and shown in red. (B) Quantitation of the results in (A). The fraction of cells expressing both protease and reporter was divided by the total fraction of protease-positive. (D), (F), and (I) are quantified in the same manner. (C) FACS plots of K562 cells stably expressing optimized mitochondrial HiLITR components. Protease expression was induced for 16 hr with 50–400 ng/mL doxycycline. Light stimulation was provided for 2 min. HiLITR activation (top row) and total protease expression (bottom row, green histogram; the 50 ng/mL doxycycline condition is overlayed in gray) were measured across conditions. (D) Quantitation of the results in (C). (E) FACS plots of K562 cells stably expressing mitochondrial HiLITR TF and the indicated proteases. Light stimulation was varied between 0 and 10 min. Quantitation of the results in (E). The best specificity was achieved with 2 min of light stimulation. (F) FACS plots of a clonal K562 cell line stably expressing mitochondrial TF, mitochondrial protease, and mCherry reporter (compare to mito protease in non-clonal stable K562s, top row of E). (G) The clonal cell line in (G) was stimulated with light for 3 min, then cultured for 3–20 hr before FACS analysis. The percentage of cells with high mCherry expression (above the top red line) or low mCherry expression (below the bottom red line) is shown in each plot. (H) Quantitation of the results in (G). We used 8 hr for mCherry expression in subsequent experiments.
Figure summary - Optimization of HiLITR experimental parameters. After optimization of HiLITR components to minimize background and maximize dynamic range, we investigated the modulation of experimental parameters in the HiLITR assay. First, we looked at expression of the protease. The HiLITR protease is under the expression of a doxycycline inducible promoter to avoid prolonged stable expression of both HiLITR components and to enable cell culturing in ambient light prior to induction of the protease. Reducing the protease expression time window from 40 hr to 16 hr prior to light stimulation improved the signal to noise ratio between the light and dark states from 2.3-fold to 4.9-fold with 2 min of light stimulation, with only ~10% reduction in activation in the light state (A, B). Varying the concentration of doxycycline used to induce protease expression had a modest impact on HiLITR activation, the proportion of protease-positive cells, and total protease expression (C, D). Next, we asked how HiLITR performance varied with light stimulation time. By varying light stimulation time from 0 to 10 min, we found that we could achieve robust HiLITR activation with the mitochondrial protease while maintaining low background with the ER and cytosolic proteases with just 2–5 min of light stimulation time (E, F). In this experiment, 2 min of light stimulation gave a ±light signal to noise ratio of 7× and a ±colocalization signal ratio of 35× (activation of HiLITR mito TF with mitochondrial vs. ER protease). To improve light vs. dark signal to noise, we considered that in the heterogenous population of cells, there were likely some cells that produced light-independent cleavage and other cells that never produced TF cleavage under even extended light stimulation. Reducing cell-to-cell variability is desirable in gene-perturbation studies, so we generated clonal cell lines for testing. We identified a clonal population that gave only 1.7% activation in the dark state but 63% activation with 2 min of light stimulation (G), a signal to noise ratio of 37×. Because this clone showed lower activation in the dark state and higher activation in the light state than the heterogeneous population, we reasoned that it must represent an intermediate level of HiLITR sensitivity. Finally, we tested the change in HiLITR readout with respect to time of reporter expression after light stimulation. In large screens, time of FACS sorting is non-negligible, so it is important to have a readout that is stable with time. With our clonal line, we found that a minimum of 8 hr is required for robust reporter expression, and reporter levels are stable between 8 and 20 hr post-stimulation (H, I). It is likely that keeping cell samples on ice after 8 hr of reporter expression further stabilized total reporter levels in our high-throughput screens.
Figure 1—figure supplement 4

Additional characterization of HiLITR constructs and cell lines.
(A) Immunofluorescence microscopy of stably-integrated HiLITR components used in fluorescence-activated cell sorting (FACS) experiment in Figure 1D. The localizations of the mitochondrial transcription factor (TF) (V5 tag, top row) and protease constructs (bottom three rows) were compared to nuclear (DAPI), mitochondrial (TOMM20), and ER (Calnexin) markers in K562 cells. Scale bars, 10 µm. (B) Immunofluorescence microscopy of the ER-localized HiLITR TF used in Figures 1D, 2D and E (‘ER transcription factor’ in Figure 1—figure supplement 1). In HeLa cells, the localization of the ER transcription factor (V5 tag) was compared to an ER marker (Calnexin). A fraction of the ER-TF localizes to a non-ER region, consistent with the dual localization of TMED3 (from which the targeting domain was derived) to ER and Golgi membranes (Emery et al., 2000; Jenne et al., 2002). Scale bar, 10 µm. (C) Immunofluorescence microscopy of the signal-anchored mitochondrial protease used in Figure 2C and E (‘Signal-anchored protease’ in Figure 1—figure supplement 1). In HeLa cells, the localization of the signal-anchored protease (GFP) was compared to a mitochondrial marker (TOMM20). Scale bar, 10 µm. (D) Immunofluorescence microscopy of the mutant mitochondrial tail-anchored protease (mutant 1, ‘mTA* protease’ in Figure 1—figure supplement 1) and variants (mutants 2–6; sequences in Materials and methods). HeLa were stained with anti-TOMM20 to visualize mitochondria. Scale bars, 10 µm. At right, mean and standard deviation for Pearson’s correlation coefficient between the protease and mito marker channels (n = 10–30 cells per condition). ***p<0.001, vs. TA protease, Wilcoxon rank-sum test. (E) Same as (D) (‘mTA* protease’, mutant 1) but with additional Golgi stain (anti-GRASP65). Scale bar, 10 µm. (F) HiLITR constructs for detection of protein colocalization at the peroxisome. Top: domain structures of peroxisome-targeted HiLITR TF and protease constructs. The TF and protease domains face the cytosol. Bottom: localization of HiLITR constructs in HeLa, using PEX14 peroxisomal marker. Note that despite testing numerous targeting signals, we were unable to generate a peroxisomal TF with clean localization. Scale bars, 10 µm. (G) FACS analysis of K562 cells expressing the indicated HiLITR combinations, 8 hr after 3 min light stimulation. Percentage of cells in the red gate is quantified in each plot. Mito-TF and ER-TF data was obtained as part of the experiment in Figure 1D. HiLITR at the peroxisomal membrane.
Figure summary - Generation of the mutant tail-anchored mitochondrial protease (mTA* protease). For the ER screen (Figure 2), we sought to generate a mutant tail-anchored mitochondrial protease with a greater propensity to mistarget to the ER. To do this, we considered the features of tail-anchored proteins which promote ER vs. mitochondrial targeting. Tail-anchor sequences of native ER proteins tend to be longer, more hydrophobic, and have fewer basic flanking residues than mitochondrial tail-anchor sequences (Beilharz et al., 2003; Costello et al., 2017; Horie et al., 2002). We found that neutralizing just one of three positive residues flanking the transmembrane domain in our MAVS-based mito TA protease produced detectable mislocalization to the ER and Golgi (mutant 1, D, E), while other mutations disrupted mitochondrial localization too severely (D). Note that localization of protease variants in (D) to the Golgi and plasma membrane is a consequence of further trafficking after initial insertion at the ER (Borgese et al., 2019). We selected mutant 1, a MAVS-R537A mutant of the mito TA construct (‘mTA* protease,’ D) for our ER screen. The additional mutant constructs are described in Supplementary file 1.
Figure summary - HiLITR at the peroxisomal membrane. As part of our HiLITR panel in Figure 1D, we also tested the mitochondrial TF and ER-TF against a peroxisomal protease (localization in F). As expected, there was no HiLITR activation with the ER-TF by the peroxisomal protease (G). Interestingly, the peroxisomal protease did induce mild HiLITR activation with the mitochondrial TF (G). This may be due to mitochondria-peroxisome contact sites (Chen et al., 2020), which could produce crosstalk between protease and TF constructs on neighboring membranes. We also attempted to generate a HiLITR TF for the peroxisomal membrane. Unfortunately, despite testing numerous fusion constructs incorporating both short targeting domains and full-length peroxisomal proteins, we observed leak to non-peroxisome locations in HeLa cells. Our most cleanly targeted peroxisomal TF fusion was based on full-length PMP34, but still showed obvious mistargeting to non-peroxisomal compartments (F). Peroxisomes are formed in a process that involves both the ER and the mitochondrial membranes (Sugiura et al., 2017), and many peroxisome membrane proteins insert at one or both locations, to be subsequently trafficked into newly derived peroxisomes. It is likely that overexpression of the peroxisomal TF construct produces pools of TF on the mitochondria and/or ER that are too abundant to be efficiently concentrated into nascent peroxisomal membranes. The phenomenon of peroxisomal fusion constructs mislocalizing to the mitochondria or ER has been previously observed (Kim et al., 2006; Sugiura et al., 2017). Consistent with the incomplete targeting of the peroxisomal TF to the peroxisome, we observed HiLITR activation when our peroxisomal TF was paired with the peroxisomal, mitochondrial, or ER proteases (G). HiLITR activation with the mitochondrial protease was slightly greater than with the peroxisomal protease, which is likely a result of higher expression of the mitochondrial protease relative to the peroxisomal protease, as well as the mislocalization of the peroxisomal TF. Importantly, cytosolic protease did not activate reporter expression with the peroxisomal TF (G), indicating that colocalization is still a requirement for TF release.
Figure 1—figure supplement 5
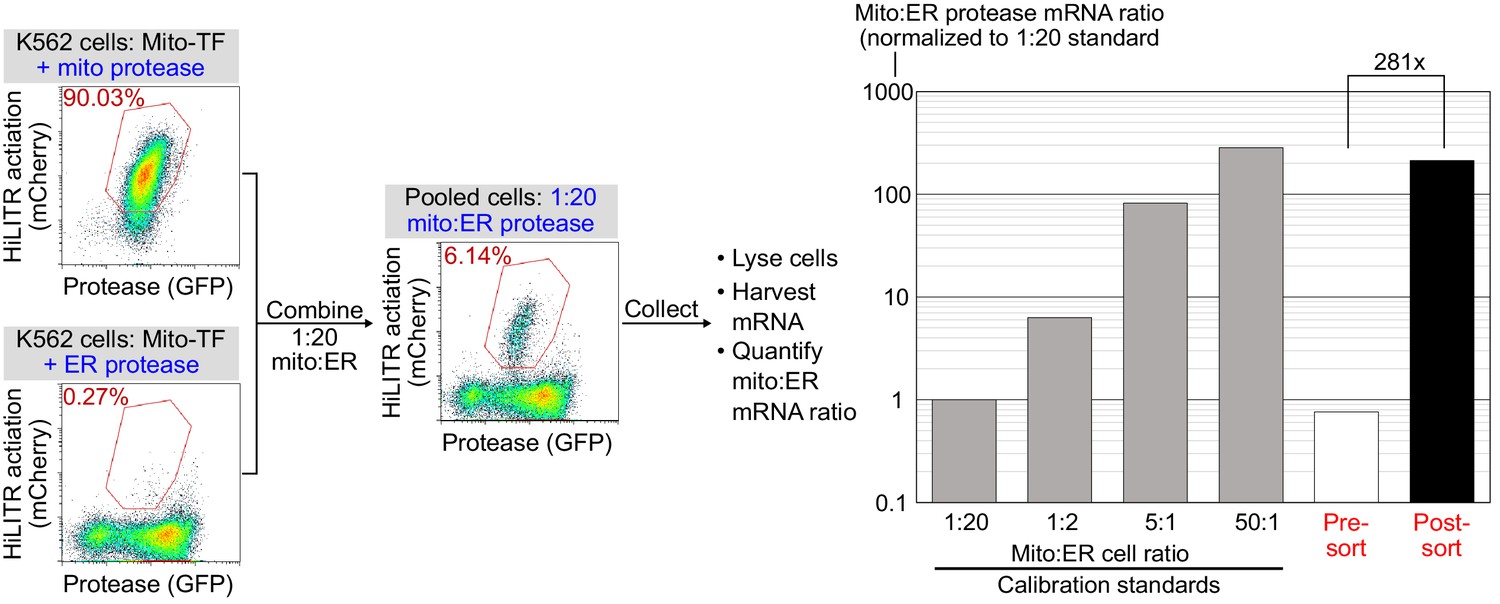
Model selection on K562 cells expressing mitochondrial transcription factor (TF) HiLITR.
Same as Figure 1E and F, except that cells expressing mitochondrial protease (colocalized with TF) are combined with cells expressing ER protease (rather than cytosolic protease as in Figure 1E). Cells were combined in a 1:20 ratio as indicated, stimulated with light for 3 min, and sorted for high mCherry expression 8 hr later. qPCR analysis of mito- and ER-protease transcript from predefined, pre-sort, and post-sort cell mixtures showed a 281-fold enrichment of mito-protease cells over ER-protease cells in one round of sorting. Full data in Figure 1—figure supplement 5—source data 1.
-
Figure 1—figure supplement 5—source data 1
- https://cdn.elifesciences.org/articles/69142/elife-69142-fig1-figsupp5-data1-v2.xlsx
Figure 2 with 1 supplement
HiLITR reads out protein mislocalization or loss in CRISPRi screens.
(A) Possible outcomes for sgRNA disruption of mitochondrial protease in cells expressing mitochondrial HiLITR transcription factor (TF) and protease. In the first example, sgRNA #1 disrupts protease localization while in the second example, sgRNA #2 reduces protease abundance. Both perturbations lead to decreased HiLITR-driven mCherry expression. (B) Format and timeline of CRISPRi screens. (C–E) Three HiLITR configurations used for CRISPRi screens. The first two (C, D) use mitochondria-localized TF and either tail-anchored (TA; C) or signal-anchored (SA; D) mitochondrial protease. The third cell line (E) uses ER-localized TF and a mutated tail-anchored mitochondrial protease that partitions between the outer mitochondrial membrane (OMM) and ER membrane. Examples of how HiLITR activation will be affected by various sgRNA-induced changes to protein localization are illustrated. (F) Fluorescence-activated cell sorting (FACS) plots showing cell populations collected and sequenced from the TA, SA, and ER CRISPRi screens from (C–E). Light stimulation times varied from 3.5 to 5 min.
Figure 2—figure supplement 1
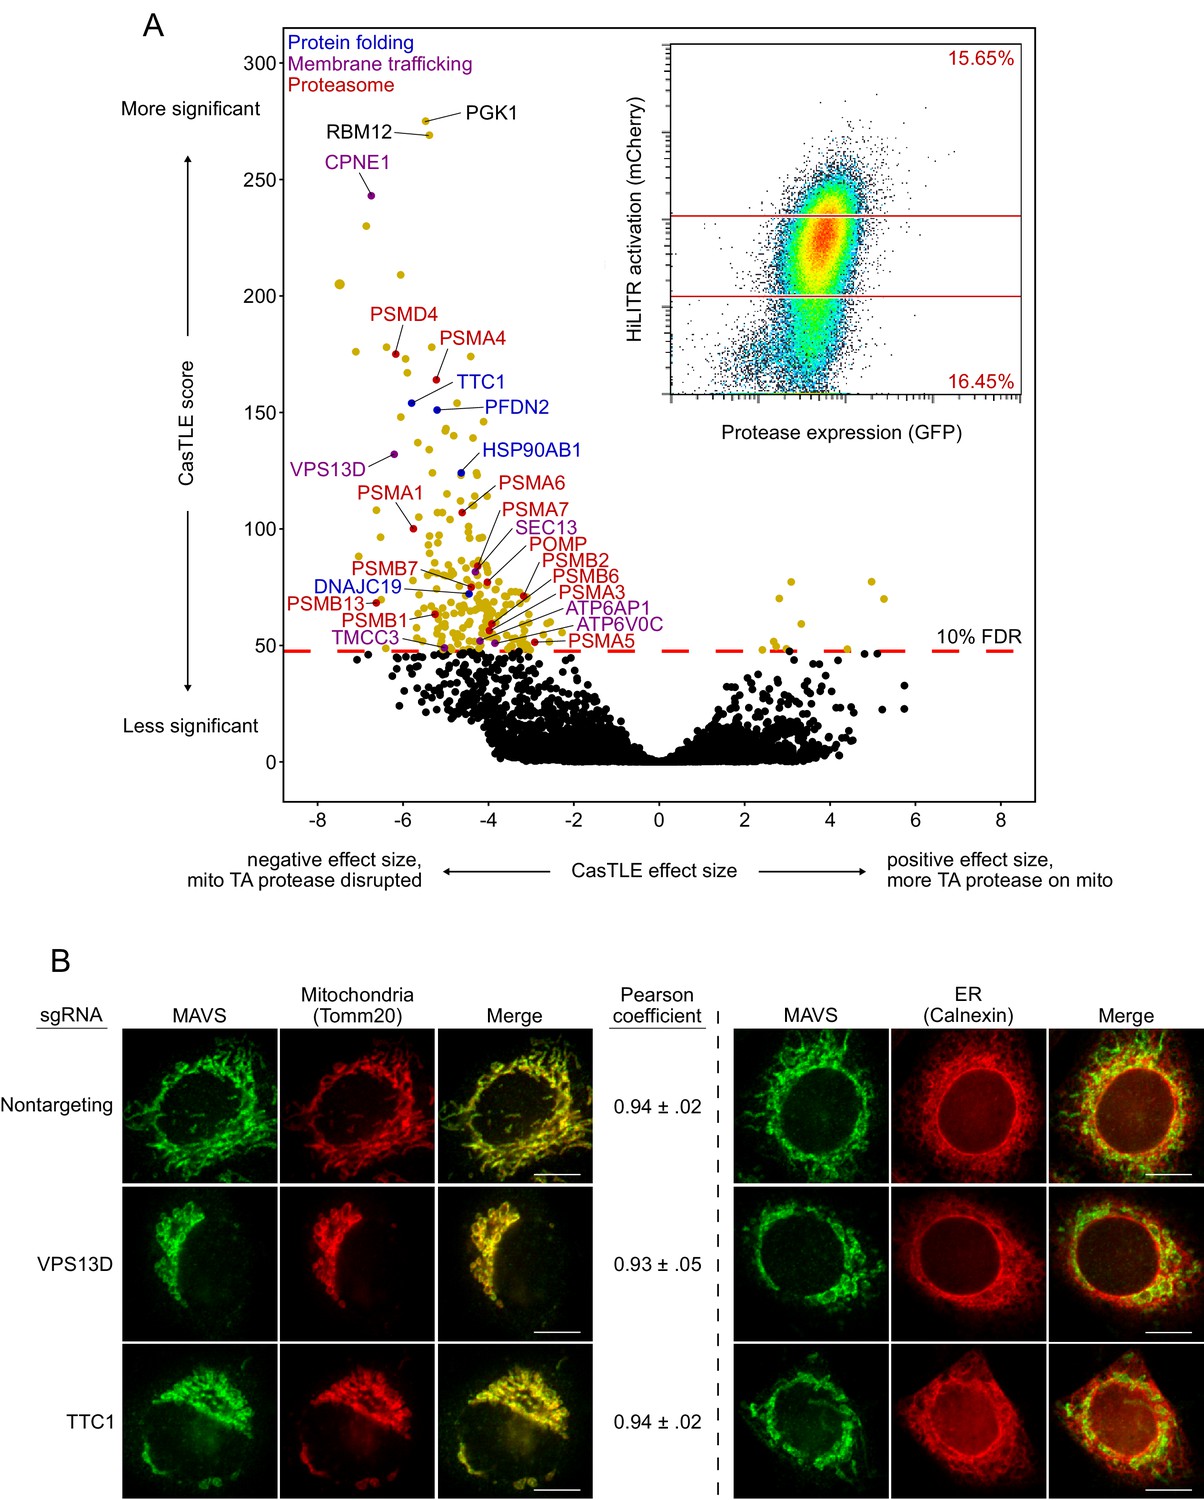
Whole-genome CRISPRi screen with HiLITR readout.
(A) CasTLE plot showing results of whole-genome CRISPRi screen, performed in two replicates in the clonal K562 mito transcription factor (TF)/mito protease HiLITR cell line (shown in Figure 2C, left). Fluorescence-activated cell sorting (FACS) data in inset. x-axis shows log2-scaled change in HiLITR activation (ratio of high mCherry cells to low mCherry cells) relative to nontargeting controls. y-axis shows the CasTLE score, a measure of significance. Labeled hits are annotated for function in protein folding (blue), membrane trafficking (purple), or proteasome function/biogenesis (red). (B) Immunofluorescence microscopy of MAVS, an endogenous mitochondrial tail-anchored protein, with or without knockdown of two CRISPRi hits (VPS13D and TTC1) in HeLa. TOMM20 and Calnexin are mitochondrial and ER markers, respectively. Scale bar, 10 µm. For MAVS vs. TOMM20 images, mean and standard deviation of Pearson’s correlation coefficient between the protease and mito marker channels were calculated (n = ~ 20 cells per condition).
Figure summary - Analysis of the whole-genome HiLITR screen. There are several interesting results to emerge from the whole-genome screen. First, our top hit, PGK1, is an artifact of using the PGK1 promoter upstream of HiLITR TF in the expression vector (the PGK1 promoter drives an antibiotic resistance gene, not the TF itself). Therefore, sgRNAs against PGK1 have off-target effects that silence the TF expression, giving a profound reduction in HiLITR activation. Interestingly, the second and third most significant hits, RBM12 and CPNE1, share a promoter (Yang et al., 2008). sgRNAs targeting RBM12 will knock down CPNE1, and vice versa, so it is encouraging that knockdown of RMB12 and CPNE1 produce very similar results. Before the three sublibrary screens (Figure 2C–E), we performed follow-up on a few hits from the whole-genome screen. Two of these hits, VPS13D and TTC1, showed profound defects in mitochondrial morphology when knocked down by CRISPRi (B). VPS13D plays a role in organelle-to-organelle contact and bulk lipid transfer (Gao and Yang, 2018), and the effect of its depletion on mitochondrial morphology has previously been observed (Anding et al., 2018). TTC1 is a tetratricopeptide repeat (TPR) domain-containing protein that binds to both HSP70 (Liu et al., 1999) and HSP90 (Liou and Wang, 2005). Despite the general mitochondrial defects we observed, however, knockdown of VPS13D or TTC1 did not produce measurable changes in the colocalization of an endogenous mitochondrial tail-anchored (TA) protein (MAVS) with a mitochondrial marker, TOMM20 (B). After we performed the three sublibrary screens, we checked the results for VPS13D and TTC1 (Supplementary file 2). While VPS13D has been observed to disrupt mitochondrial morphology (Anding et al., 2018), it has not been found to disrupt the ER (Seong et al., 2018). Consistent with this, VPS13D knockdown decreased HiLITR activation in the TA and signal-anchored (SA) screens, but not the ER screen. Likewise, TTC1 knockdown decreased HiLITR activation in only the TA and SA screens. We speculate that VPS13D and TTC1 may have some functional relationship to each other.
Figure 3 with 4 supplements
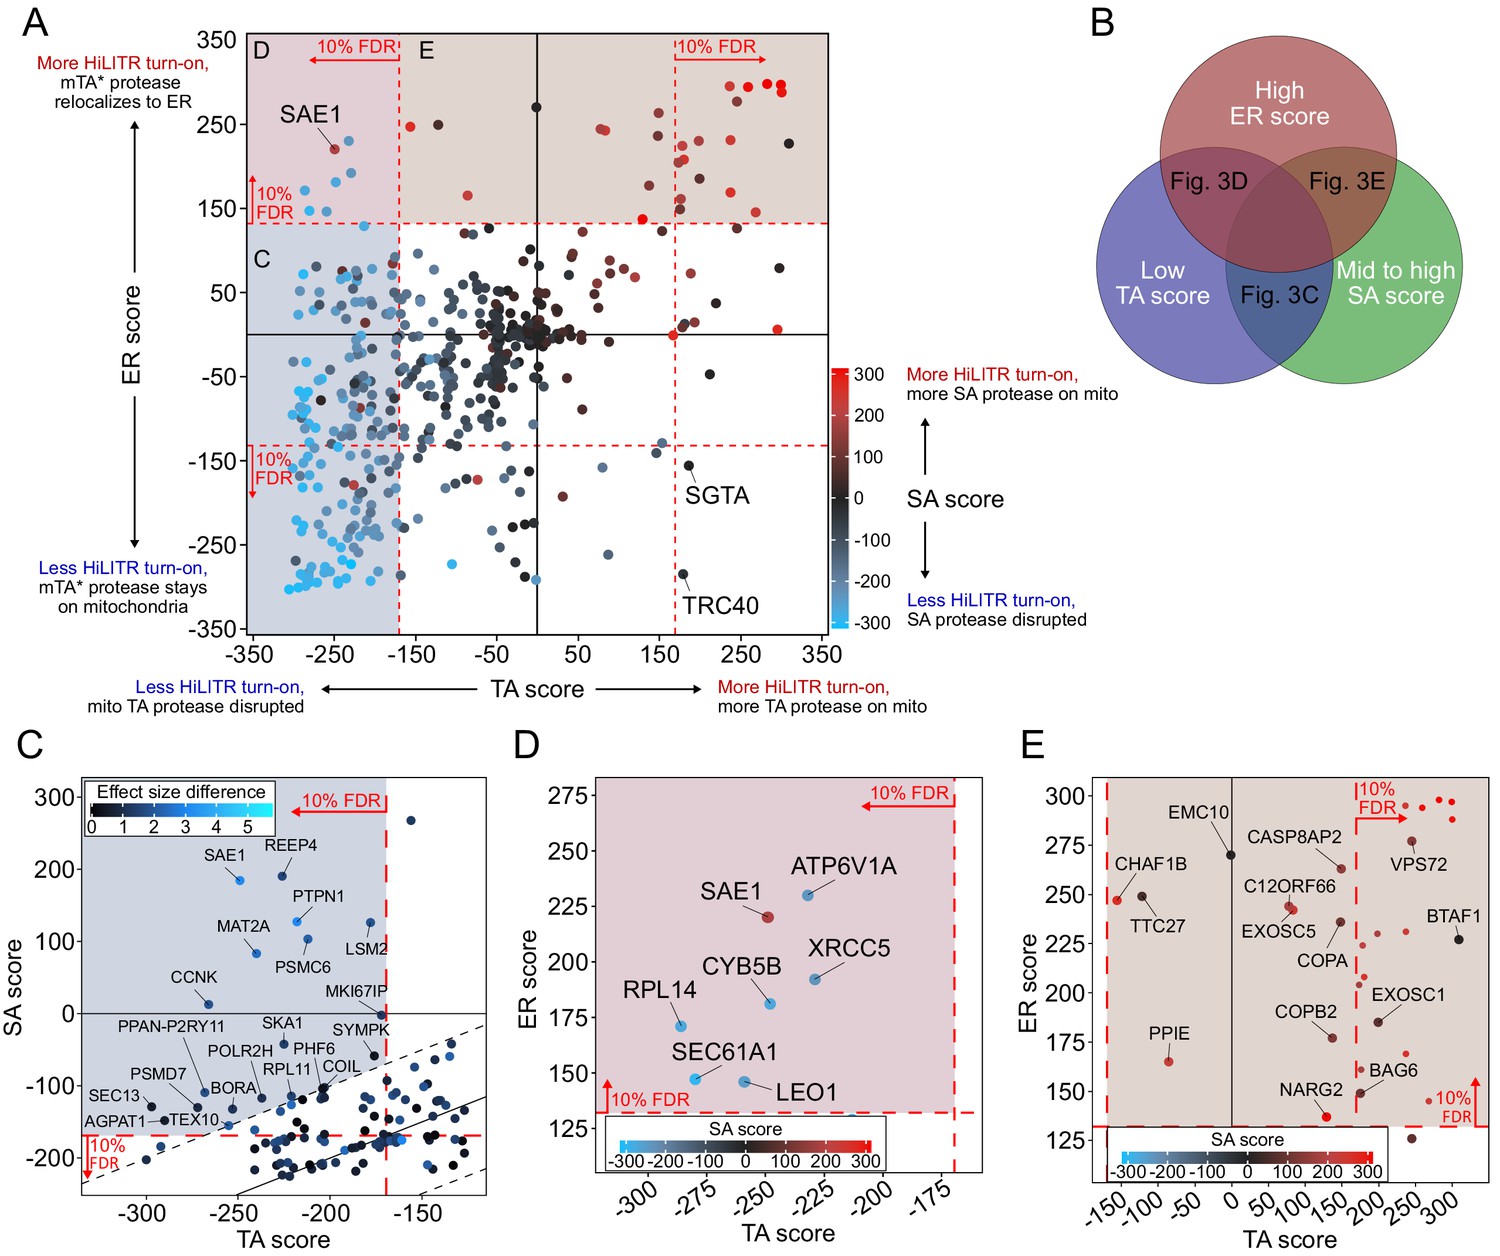
CRISPRi screen with HiLITR readout identifies proteins that influence the localization of mitochondrial membrane and ER membrane proteins.
(A) CasTLE plot showing combined results from tail-anchored (TA), signal-anchored (SA), and ER CRISPRi screens. x-axis plots the TA screen score (lower when the mito TA protease from Figure 2C is disrupted) and y-axis plots the ER screen score (higher when the mito mTA* protease from Figure 2D relocalizes to the ER membrane). Points are color-coded according to score in the SA screen, with red denoting less disruption of the mito SA protease from Figure 2C. (B) Venn diagram showing that proteins regulating the targeting of mitochondrial TA proteins may exhibit some combination of low TA score, mid to high SA score, and high ER score. (C) Zoom-in of proteins with low TA score and medium-high SA score (replotted from A). Points are colored according to absolute difference in effect size in TA vs. SA screen. Dashed black lines enclose the 90% interquantile range for difference between TA and SA score. (D) Zoom-in of proteins with low TA score and high ER score, corresponding to maroon shaded region in (A). (E) Zoom-in of proteins with high ER score and medium-high SA score, corresponding to brown shaded region in (A). Unlabeled points showed significant increases in HiLITR activation (at 10% FDR) in all three screens and are likely to be nonspecific hits.
Figure 3—figure supplement 1
Retesting of transmembrane recognition complex (TRC)/GET pathway genes with HiLITR.
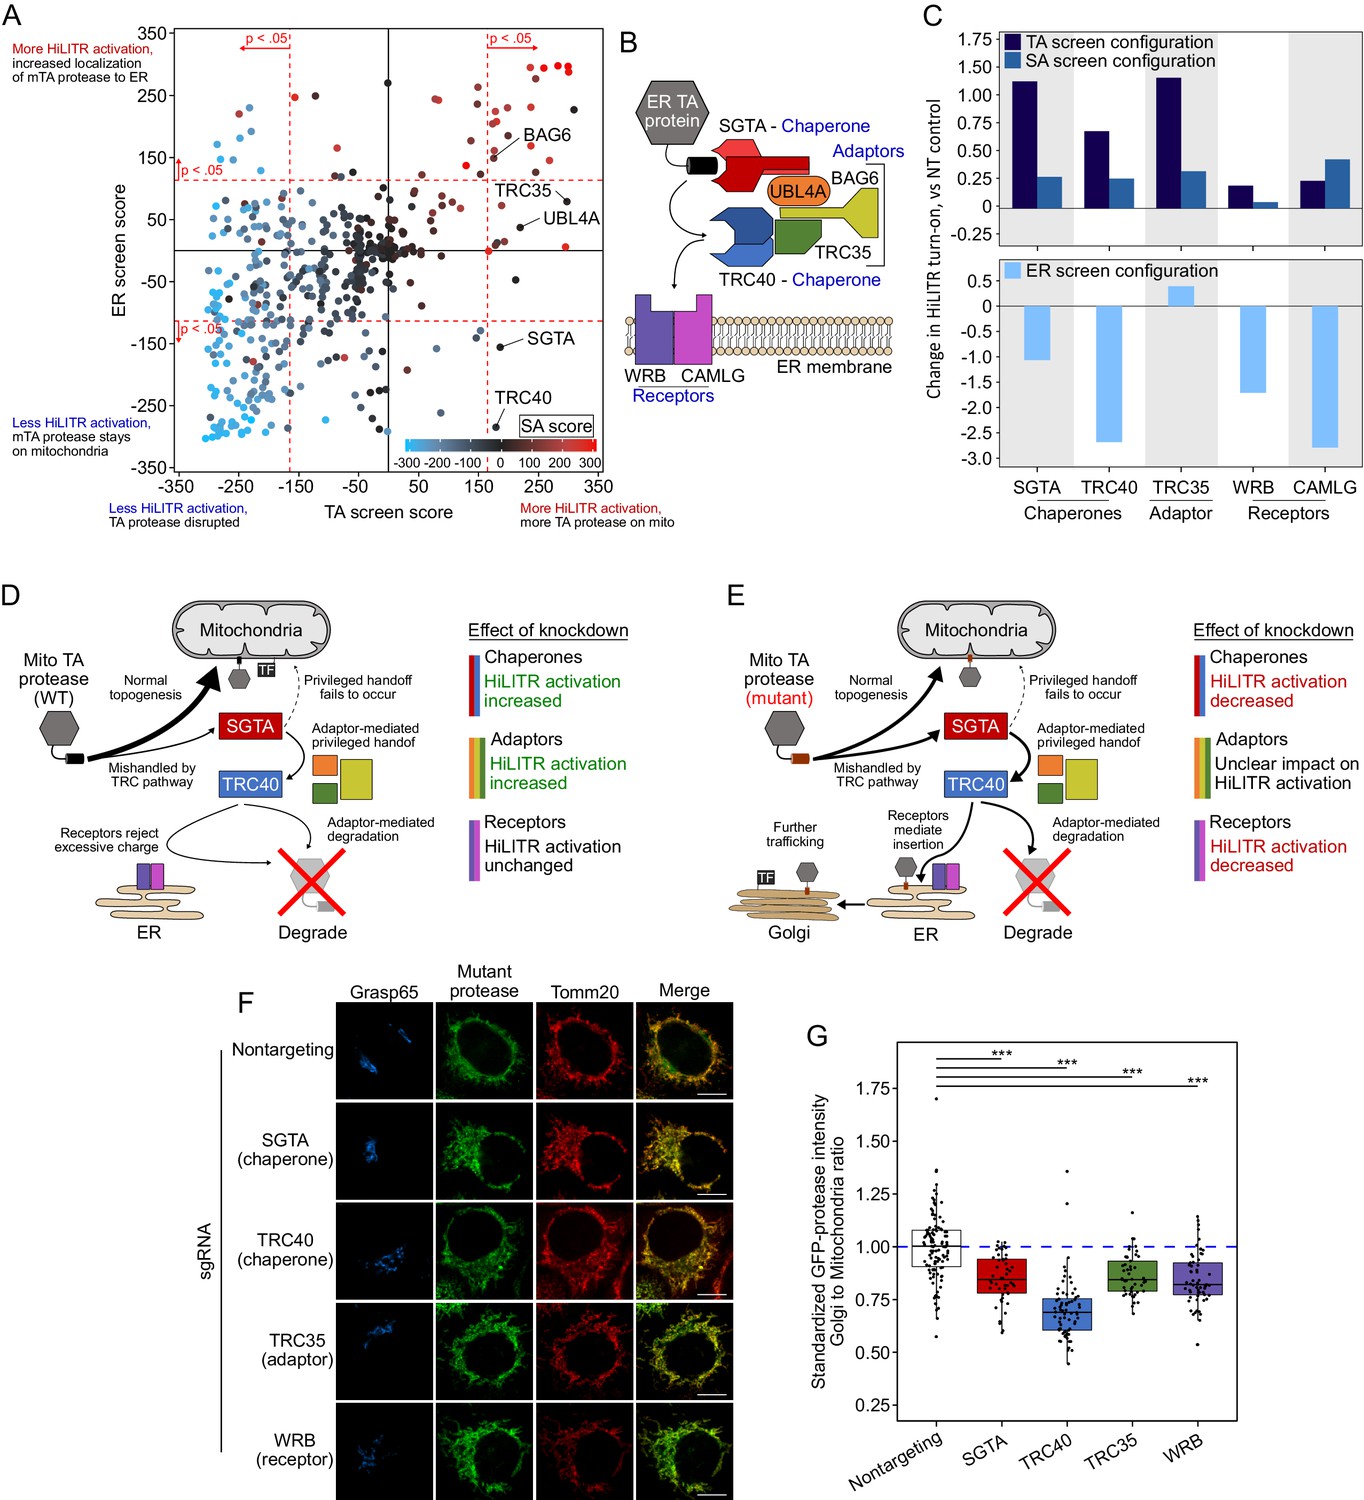
(A) The plot from Figure 3A, with genes in the TRC pathway (GET pathway in yeast) labeled. All five genes tested in the sublibrary screens (WRB and CAMLG were omitted) produced significant increases in HiLITR activity in the tail-anchored (TA) screen (p=1.7e-7, hypergeometric test). (B) Schematic of the TRC pathway. (C) Quantitation of individual fluorescence-activated cell sorting (FACS) analysis of gene knockdown in the TRC pathway. The K562 TA and signal-anchored (SA) (top) and ER (bottom) HiLiTR cell lines were transduced with individual sgRNAs against TRC pathway genes. Log2-transformed ratio of high mCherry to low mCherry cells was calculated for each plot and normalized to that of nontargeting (NT) control. (D) Schematic showing possible membrane insertion pathway of TA protease. Most protein traffics to the outer mitochondrial membrane (OMM), but a subpopulation may be nonproductively handled by TRC pathway chaperones, resulting in rejection from ER insertion by the receptors, adaptor-mediated recruitment of ubiquitination machinery, and subsequent degradation. (E) Schematic showing possible membrane insertion pathway of mTA* protease. (F) Immunofluorescence microscopy analysis of TRC pathway knockdown. In HeLa cells, the localization of mTA* protease was compared to Golgi (GRASP65) and mitochondrial (TOMM20) markers. Scale bar, 10 µm. Note: knockdown of CAMLG in HeLa cells impaired cell adherence, preventing immunofluorescence analysis. (G) Quantification of data in (F), along with ~20 additional fields of view per condition (total ~50 cells per sample). For each cell, the mean intensity of Golgi-colocalized GFP was divided by the mean intensity of mitochondria-colocalized GFP. ***p<0.001, Student’s t-test. Full data in Figure 3—figure supplement 1—source data 1.
Figure summary - Analysis of TRC pathway genes in the CRISPRi sublibrary screens. The TRC pathway is the first pathway discovered for the targeting of ER-destined TA proteins and is well-characterized (Borgese et al., 2019). (B) shows the key players in the TRC pathway. ER-targeted TA proteins that are TRC pathway clients are handled directly by two chaperones, SGTA and TRC40 (Chang et al., 2010; Schuldiner et al., 2008; Stefanovic and Hegde, 2007). Three adaptor proteins (UBL4A, TRC35, and BAG6) (Mariappan et al., 2010) coordinate handoff between SGTA and TRC40 (Shao et al., 2017; Wang et al., 2010), while BAG6 additionally recruits the E3 ubiquitin ligase RNF126 (not shown) to degrade nonproductively associated proteins (Rodrigo-Brenni et al., 2014). At the ER membrane, WRB and CAMLG act as receptors to assist with insertion of the client protein (Schuldiner et al., 2008; Vilardi et al., 2011; Yamamoto and Sakisaka, 2012), but proteins with significant positive charge flanking the transmembrane domain (such as mitochondrial TA proteins) are rejected, either by the receptors or due to the energetic barrier posed by the ER membrane (Rao et al., 2016). The chaperones (SGTA and TRC40) and adaptors (TRC35, BAG6, and UBL4A) were included in our CRISPRi sublibrary, while WRB and CAMLG were not. We further explored the TRC pathway with individual knockdown of the chaperones SGTA and TRC40, the adaptor TRC35, and the receptors WRB and CAMLG. Interestingly, the profiles of HiLITR performance across the three HiLITR configurations segregated based on the function of each protein in the TRC pathway (C). Notably, knockdown of none of the proteins affected the SA screen HiLITR configuration, consistent with the fact that the TRC pathway acts only on TA proteins. In the TA screen configuration, knockdown of the chaperones and adaptors both increased HiLITR activation (C). If the chaperones are knocked down, there will be decreased mishandling of mitochondrial TA protein, and therefore an increase in normal topogenesis, localization to the mitochondria, and release of mitochondrial TF (D). Similarly, upon loss of adaptors, handoff of TA protein between SGTA and TRC40 is less coordinated. Adaptor-mediated degradation of uninserted TA protein will also be reduced. Both effects promote increased targeting of the TA protein to the mitochondrial membrane, increasing HiLITR activation (D). Knockdown of receptors in the TA screen configuration did not impact HiLITR activation (C). Since mitochondrial TA proteins that reach the ER are rejected on the basis of charge, loss of the receptors will have no additional impact (D). In the ER screen configuration, we used the mutant TA protein (mTA*-protease) that partitions between the OMM and ER membrane. We observed that knockdown of the chaperones and receptors decreased HiLITR activation (A, C). Loss of chaperones will mean less mTA* protease is routed to the ER, meaning less ends up colocalized with the ER-targeted TF, leading to reduce HiLITR activation (E). Similarly, if the receptors are disrupted, the mTA* protease cannot be inserted into the ER, decreasing HiLITR activation (E). In contrast to the chaperones and receptors, the adaptors gave mixed results, with two of the three adaptors producing no significant result in the ER screen (A, C). Knockdown of the adaptors will decrease handoff of the mTA* protease between SGTA and TRC40, providing opportunity for escape to the mitochondrial membrane (and decreased HiLITR activation). However, this effect is opposed by the fact that loss of adaptors will reduce degradation of the mTA* protease, providing more time for its insertion into the ER membrane (increasing HiLITR activity). As such, the impact of knocking down the adaptors is harder to predict for the ER screen (E). Lastly, we tested the effect of TRC protein knockdown on the localization of the mutant TA protease. Knockdown of SGTA, TRC40, and WRB decreased activation of HiLITR in the ER screen configuration, indicating reduced ER targeting of the mTA* protease. As expected, knockdown of any of these components reduced the fraction of mTA* protease colocalizing with the Golgi (G). TRC35 also decreased the fraction of mTA* protease colocalized with the Golgi, despite a neutral effect in the ER screen HiLITR configuration. It is likely that loss of TRC35 increases the fraction of mTA* protease which is rescued from the TRC pathway, while also increasing the efficiency by which unrescued mTA* protease is inserted into the ER (E). This would result in an increase in mitochondrial mTA* protease and neutral effect on ER mTA* protease, which would decrease the ratio of Golgi-localized mTA* protease without affecting total Golgi-localized protease or subsequent HiLITR activation in the ER screen configuration.
-
Figure 3—figure supplement 1—source data 1
- https://cdn.elifesciences.org/articles/69142/elife-69142-fig3-figsupp1-data1-v2.xlsx
-
Figure 3—figure supplement 1—source data 2
- https://cdn.elifesciences.org/articles/69142/elife-69142-fig3-figsupp1-data2-v2.xlsx
Figure 3—figure supplement 2
Retesting individual sgRNAs from the three HiLITR configuration CRISPRi screen.
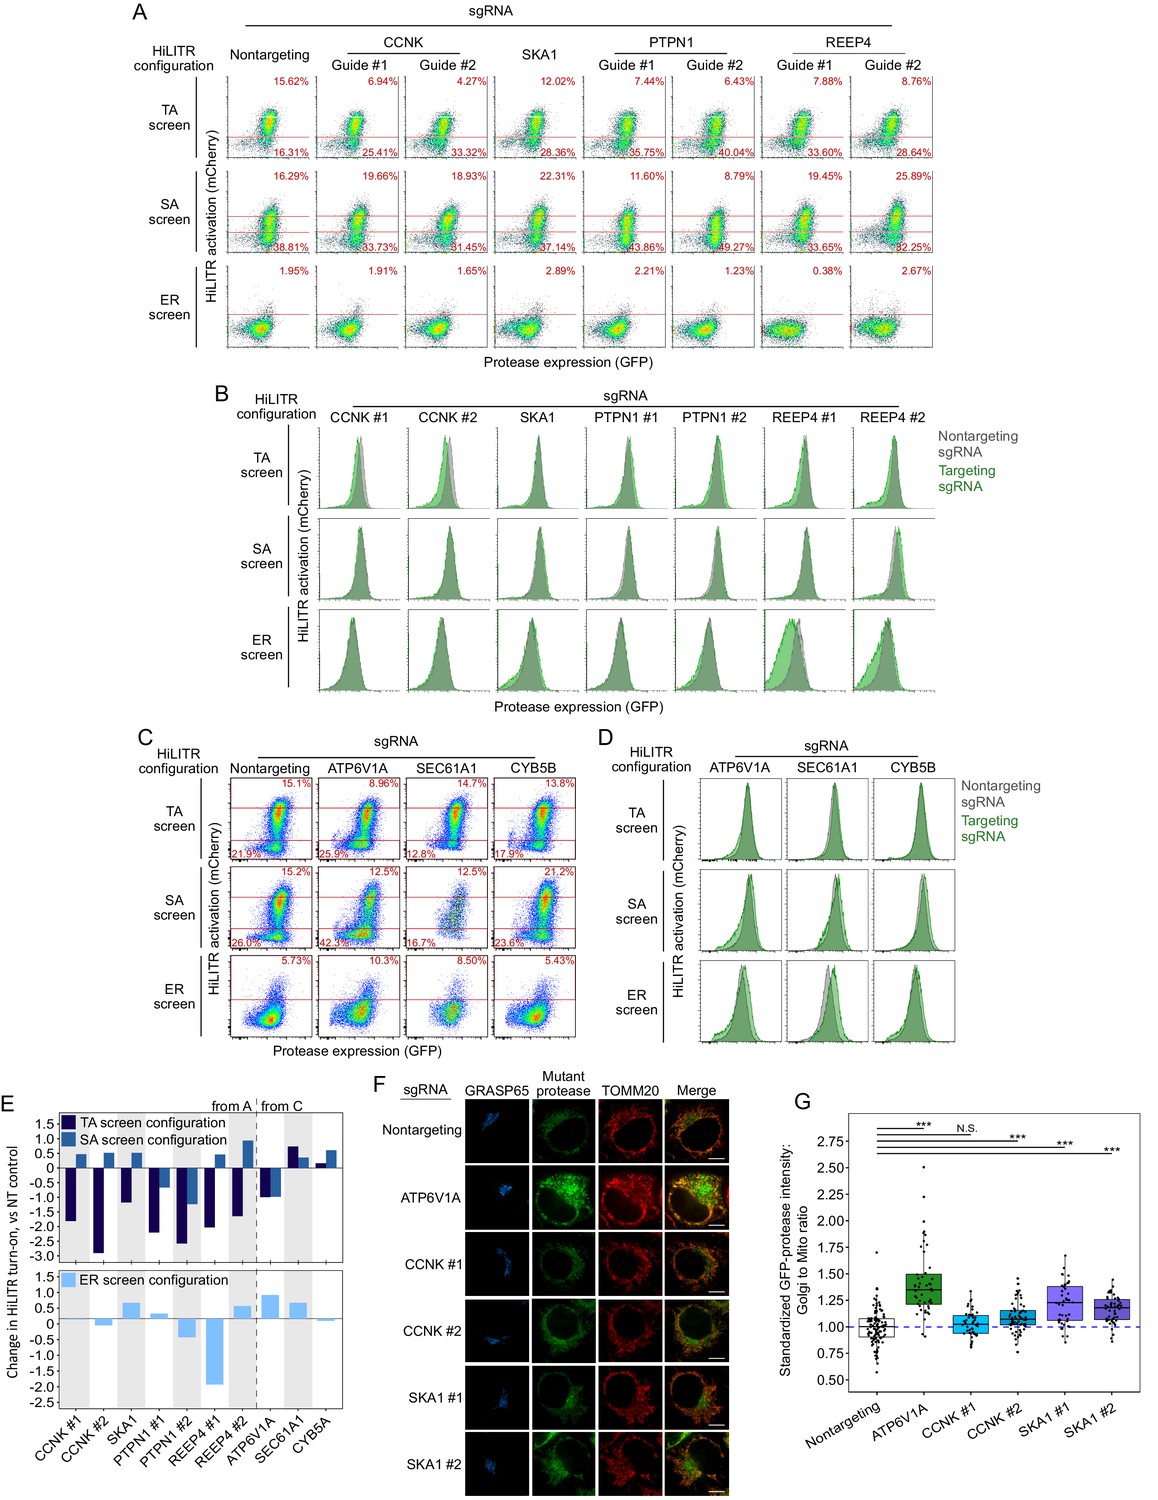
(A) Fluorescence-activated cell sorting (FACS) plots showing the effects of individual sgRNAs on HiLITR readout in three K562 HiLITR cell lines (tail-anchored [TA], signal-anchored [SA], and ER) from Figure 2C–E. Percentage of cells above and below the red lines is quantified in each plot. Genes in this group were hits with low TA score and mid to high SA score, labeled in Figure 3C. (B) FACS plots showing the effects of the guides tested in (A) on protease expression level. Protease expression level in cells with nontargeting control sgRNA is overlaid in gray. (C) Same as (A), for three additional genes that were hits with low TA score and high ER score, labeled in Figure 3D. (D) FACS plots showing the effects of the guides tested in (C) on protease expression level. Protease expression level in cells with nontargeting control sgRNA is overlaid in gray. (E) Quantitation of FACS data in (A) and (C). Log2-transformed ratio of high mCherry to low mCherry cells was calculated for each plot and normalized to that of nontargeting (NT) control plot. Top shows TA configuration and SA configuration HiLITR data, bottom shows ER configuration HiLITR data for each gene tested. (F) Fluorescence microscopy of mTA* protease in HeLa with knockdown of three different CRISPRi hits. GRASP65 and TOMM20 are Golgi and mitochondrial markers, respectively. Scale bars, 10 µm. (G) Quantification of data in (D), along with ~20 additional fields of view per condition (~50 cells per condition). For each cell, the mean intensity of Golgi-colocalized protease was divided by the mean intensity of mitochondria-colocalized protease. ***p<0.001, Student’s t-test. Full data in Figure 3—figure supplement 1—source data 2.
Figure summary - Description of additional hits from Figure 3 and discussion of potential artifacts. We performed individual validation experiments on a number of hits from sublibrary screens. Performance in individual validation experiments is compared to performance in the sublibrary screens in Supplementary file 2. PTPN1 is a TA protein known to localize to both the ER and mitochondria in an isoform-dependent manner (Brambillasca et al., 2006; Fueller et al., 2015). PTPN1 showed significant reduction in HiLITR activity in only the TA screen. We validated the strong negative effect of PTPN1 on HiLITR activation in the TA configuration with two guides (A, B, E). However, PTPN1 also decreased activation in the SA configuration, albeit to a more modest extent. REEP4 plays a role in ER membrane sequestration during metaphase (Schlaitz et al., 2013). It was found to decrease HiLITR activation in the TA and ER screens, while increasing HiLITR activation in the SA screen. Validation of REEP4 with two guides was consistent with screen results, with both guides showing decrease in activation in the TA configuration and one guide each showing either decreased activation in the ER configuration or increased activation in the SA configuration (B–E). REEP4 was observed to have a significant growth defect, and its annotation seemed to imply a nonspecific role, so we declined to analyze it further. SEC61A1 is a member of the ER translocon. It was observed to decrease HiLITR activation in the TA and SA screens and increase HiLITR activation in the ER screen. During individual validation, it was instead found to mildly increase HiLITR activation in all three configurations (C–E). Knockdown of SEC61A1 also produced a substantial growth defect. CYB5B is a second TA protein known to localize to both the ER and mitochondria (D’Arrigo et al., 1993). It was seen to decrease HiLITR activation in the TA and SA screens and increase HiLITR activation in the ER screen (C–E). These results did not replicate with the guide we used for individual validation. The proteins we validated with success were SKA1, CCNK, and ATP6V1A (A–E). CCNK and SKA1 have annotation related to mitosis, while ATP6V1A is a member of the vacuolar ATPase. For these guides and for SAE1, we assessed the possibility that clone-specific effects could account for their performance in the HiLITR screens as a consequence of either clone-specific sensitivity to certain biological pathways or off-target silencing if a HiLITR component was integrated next to a targeted gene. We therefore repeated HiLITR assays in the polyclonal cell lines from which the monoclonal screen cell lines were isolated and found that HiLITR performance in polyclonal cell lines generally agreed with screen results, though data were noisier due to the population heterogeneity (Figure 3—figure supplement 3). ATP6V1A showed no loss of HiLITR activation in the heterogeneous TA configuration, while CCNK and SKA1 showed greater activation in the ER configuration than was observed with the clonal population.
Figure 3—figure supplement 3
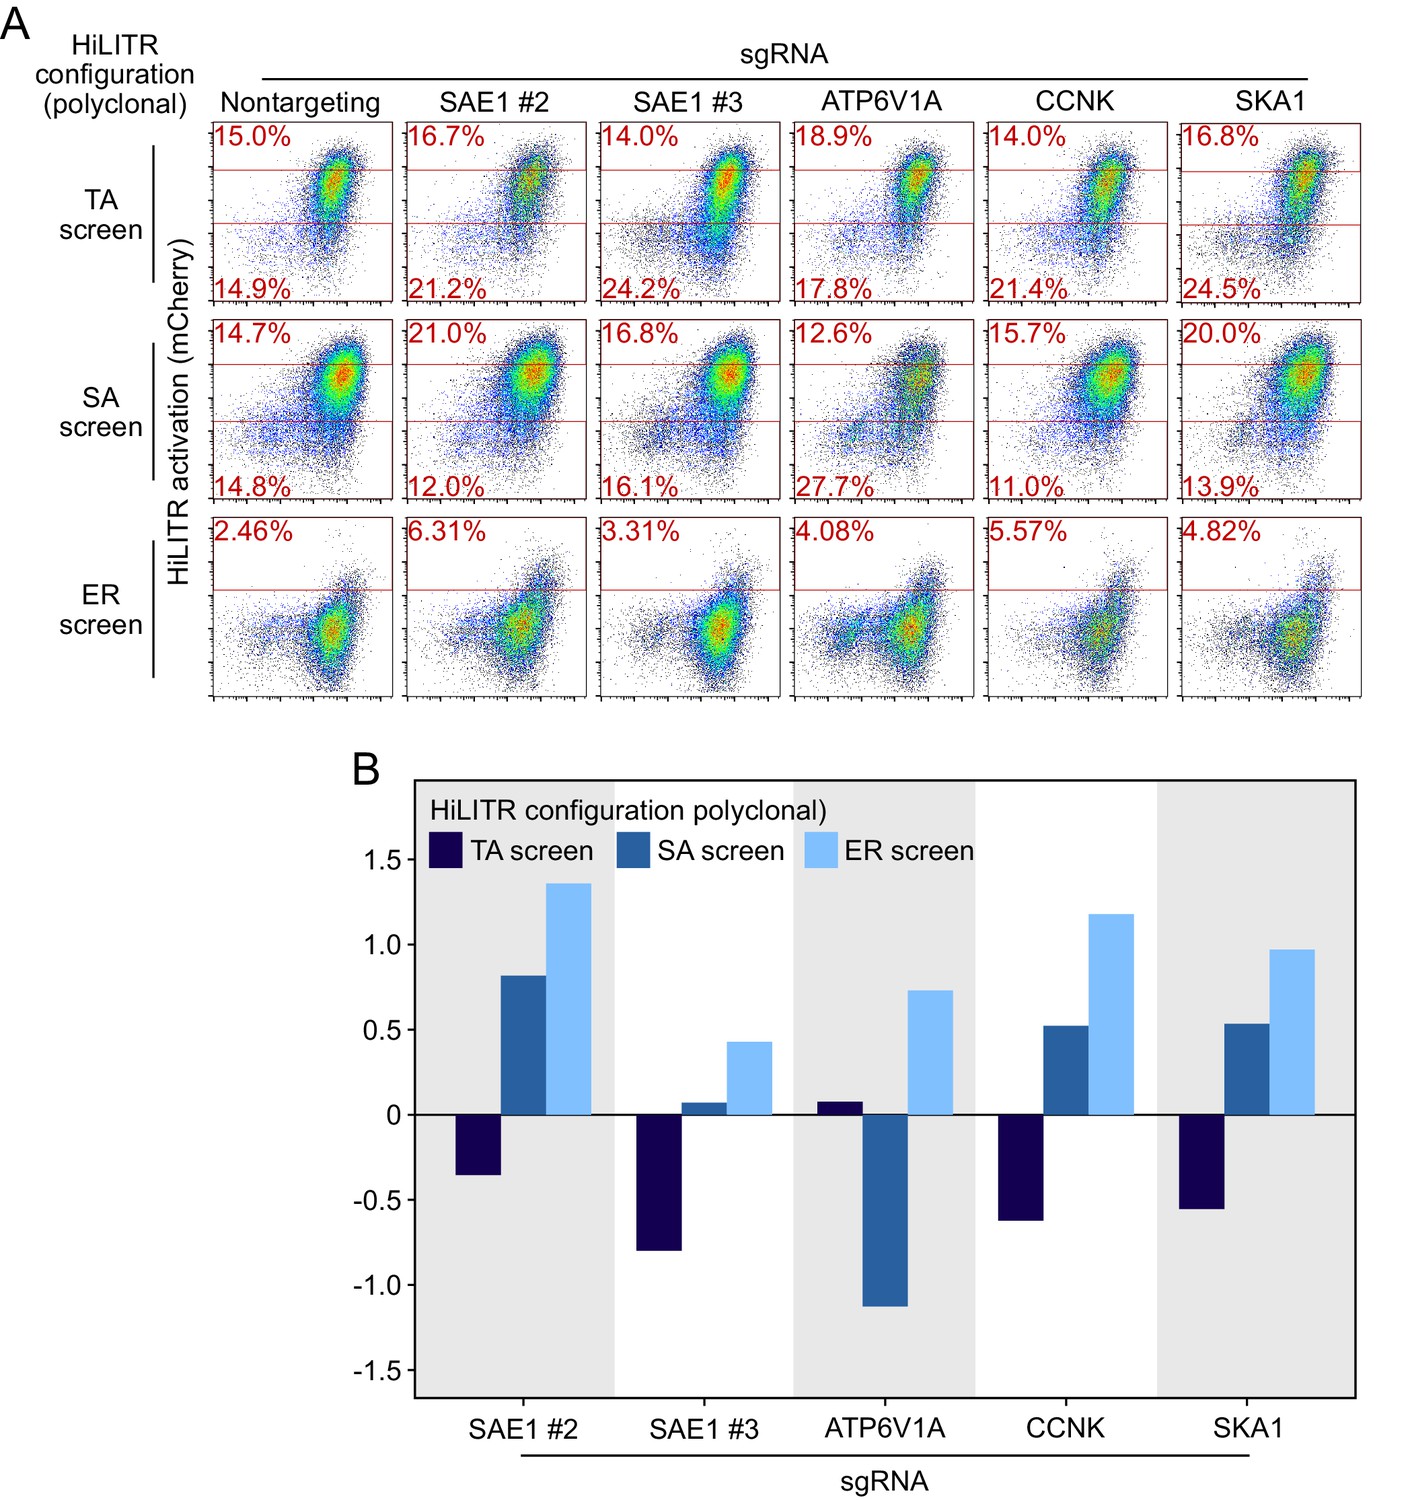
Retesting individual sgRNAs in polyclonal cell lines.
(A) Fluorescence-activated cell sorting (FACS) plots showing the effects of individual sgRNAs on HiLITR readout in polyclonal K562 HiLITR cell lines (corresponding to tail-anchored [TA], signal-anchored [SA], and ER screens from Figure 2C–E). Percentage of cells above and below the red lines shown in each plot. (B) Quantitation of FACS data in (A). Log2-transformed ratio of high mCherry to low mCherry cells was calculated for each plot and normalized to that of nontargeting (NT) control plot.
Figure 3—figure supplement 4
Analysis of other pathways in CRISPRi screening data.
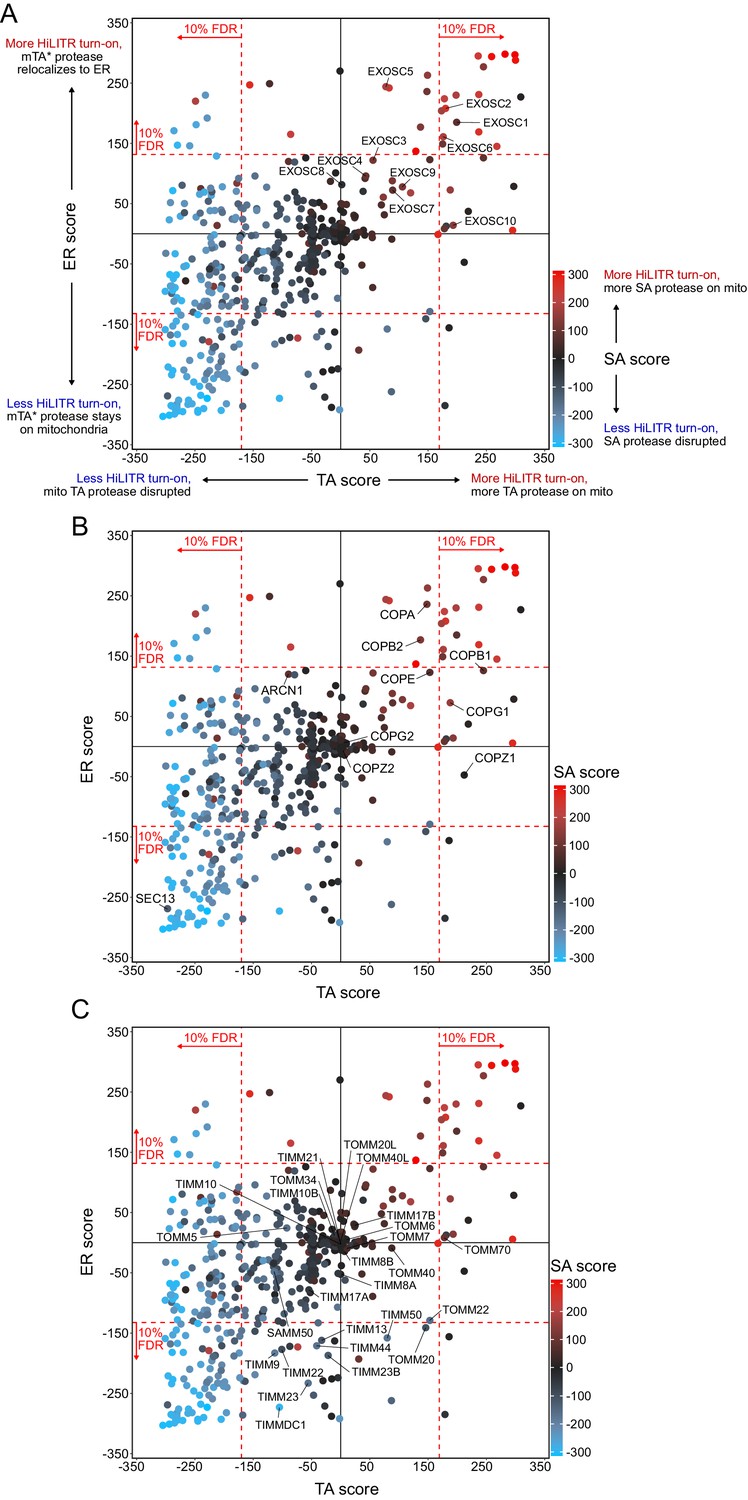
(A) Results from the exosome complex. The plot from Figure 3A, with genes in the exosome complex labeled. (B) Results from the COPI/COPII pathway. The plot from Figure 3A, with genes in the COPI pathway (Golgi to ER retrograde transport) and SEC13 from the COPII pathway (ER to Golgi anterograde transport) labeled. (C) Results from TIMM and TOMM complexes. The plot from Figure 3A, with the TIMM and TOMM complexes labeled.
Figure summary - Description of additional pathways in Figure 3. In addition to individual hits, we took note of three groups of functionally related genes that showed specific patterns of activation in the sublibrary screens. Several components of the exosome complex increased HiLITR activation in one or more screens (A). This complex is almost certainly a false positive, as it plays a role in RNA degradation (Kilchert et al., 2016), but it importantly indicates that in some cases false positives can increase – rather than decrease – HiLITR activation. We noticed that the set of generally activity-increasing hits included several members of the COPI complex, which mediates ER-to-Golgi anterograde transport (B). Interestingly, SEC13, a member of the Golgi-to-ER retrograde COPII complex, decreased HiLITR activation in the tail-anchored (TA) and ER screen. While the mechanistic connection of COPI/II to trafficking of the HiLITR components is not readily apparent – and quite possibly indirect – the recapitulation of the opposing roles of COPI and COPII in the HiLITR data is intriguing. Finally, we looked at all proteins in the TOMM and TIMM complexes (C). Surprisingly, knockdown of a large number of TIMM components, as well as TOMM20, decreased HiLITR activation in the ER screen. Several components also decreased HiLITR activation in the signal-anchored (SA) screen. We speculate that the knockdown of key TIMM and TOMM members might produce systems-level protein trafficking defects with far-ranging effects. It is interesting to consider how organelles in general, or different classes of proteins specifically, relate to global patterns in protein trafficking.
Figure 4 with 1 supplement
SAE1 knockdown disrupts localization and abundance of mitochondrial tail-anchored (TA) proteins.
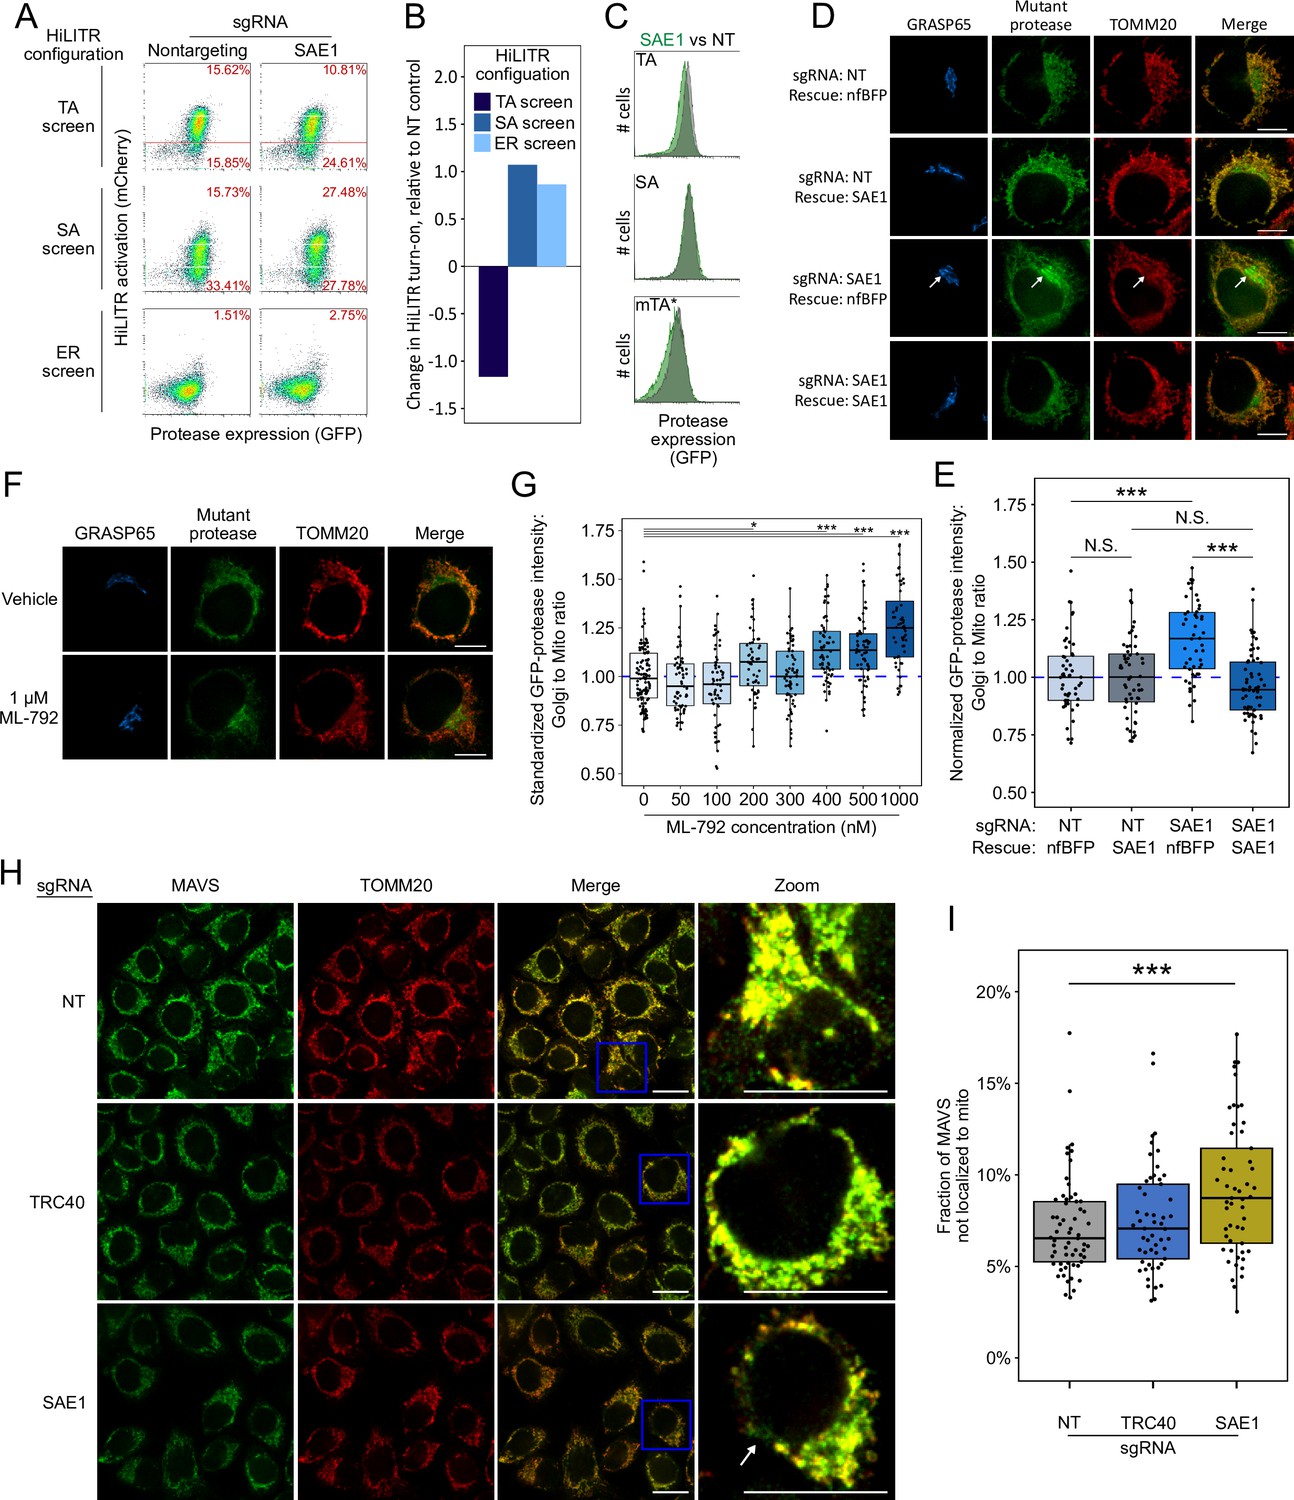
(A) SAE1 knockdown by CRISPRi reduces HiLITR activation in TA screen configuration, while increasing HiLITR activation in SA and ER screen configurations. (B) Quantitation of data in (A). Log2-transformed ratio of high mCherry to low mCherry cells was calculated for each plot and normalized to that of nontargeting (NT) sgRNA control. (C) Expression levels of GFP-tagged mitochondrial proteases from samples in (A). Green: SAE1 knockdown cells; gray: control cells with NT guide. (D) SAE1 knockdown increases mislocalization of the GFP-tagged mutant TA (mTA*) protease from mitochondria to Golgi. HeLa cells expressing mTA* protease and dCas9-KRAB were infected with SAE1 sgRNA or NT control for 9 days. In rows 2 and 4, SAE1 knockdown was rescued by overexpression of sgRNA-resistant SAE1. nfBFP: non-fluorescent BFP. Mitochondria and Golgi are visualized with anti-TOMM20 and anti-GRASP65 antibodies, respectively. In SAE1 knockdown without rescue (third row), mutant GFP-protease accumulates in Golgi (white arrow). Scale bars, 10 µm. (E) Quantitation of data in (D) along with ~20 additional fields of view (n = ~50 cells per condition). The value plotted is the mean intensity of GFP-protease signal colocalized with Golgi divided by mean signal colocalized with mitochondria. N.S.: not significant, ***p<0.001, Student’s t-test. Full data in Figure 4—source data 1. (F) Chemical inhibition of SAE1’s SUMOylation activity increases mislocalization of the GFP-tagged mTA* protease to the Golgi. HeLa cells were treated with SUMO E1-ligase inhibitor ML-792 for 6 days before expression of mTA* protease for 1 day. Localization of the GFP-tagged mutant protease was compared with respect to mitochondrial and Golgi markers. Scale bars, 10 µm. (G) Quantitation of the data in (F), with six additional concentrations of ML-792 inhibitor. ~20 fields of view (n = ~50 cells) were imaged per condition. *p<0.05, ***p<0.001, Student’s t-test. Full data in Figure 4—source data 2. (H) SAE1 knockdown increases the fraction of endogenous mitochondrial TA protein MAVS that is mislocalized. HeLa cells were infected with nontargeting control or sgRNA against TRC40 or SAE1 for 9 days. Endogenous MAVS and the mitochondrial marker TOMM20 were visualized by immunostaining. Zooms are contrast-enhanced. White arrow points to MAVS signal in a non-mitochondrial region. Scale bars, 20 µm. (I) Quantitation of data in (I) along with approximately five additional fields of view (n = ~ 60 cells per condition). ***p<0.001, Student’s t-test. Full data in Figure 4—source data 3.
-
Figure 4—source data 1
Source data for Figure 4E.
- https://cdn.elifesciences.org/articles/69142/elife-69142-fig4-data1-v2.xlsx
-
Figure 4—source data 2
Source data for Figure 4G.
- https://cdn.elifesciences.org/articles/69142/elife-69142-fig4-data2-v2.xlsx
-
Figure 4—source data 3
Source data for Figure 4I.
- https://cdn.elifesciences.org/articles/69142/elife-69142-fig4-data3-v2.xlsx
Figure 4—figure supplement 1
Additional data on SAE1.
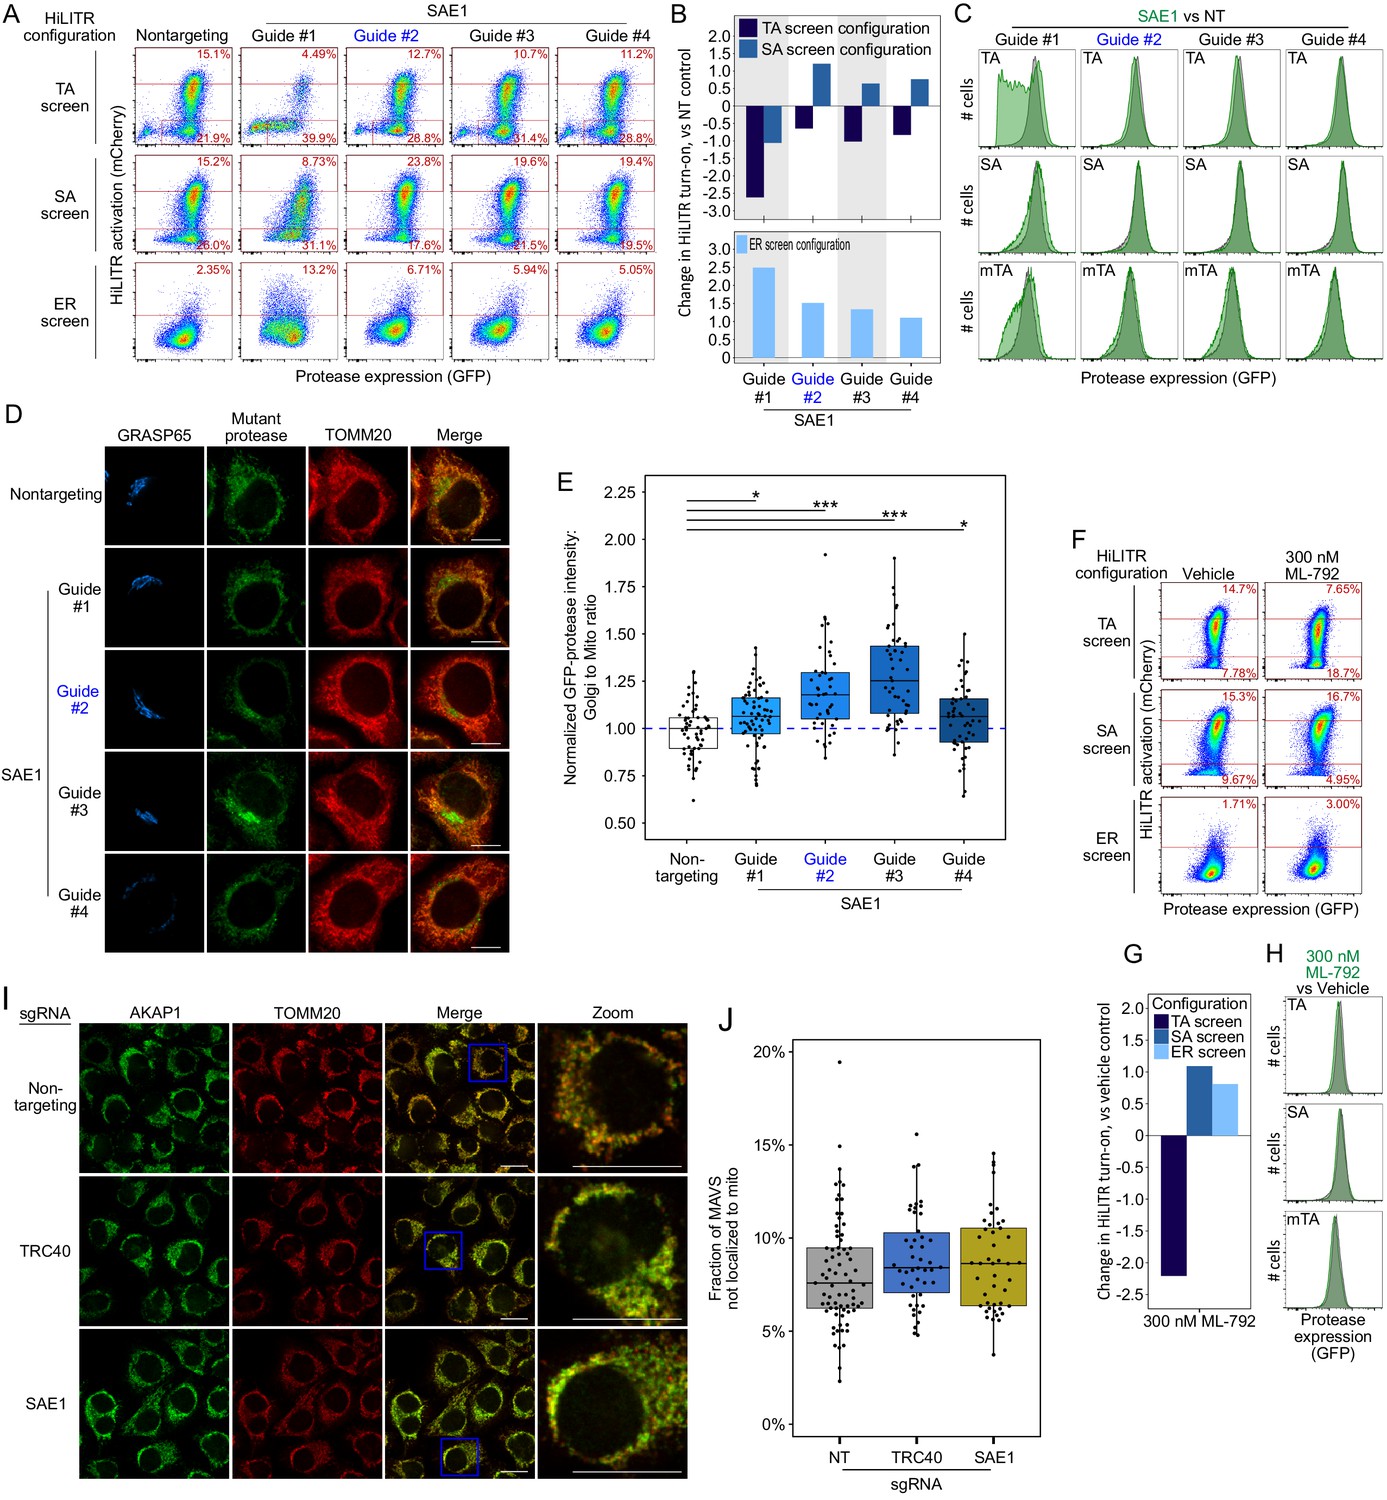
(A) Same as Figure 4A, but showing data for three additional sgRNAs against SAE1. Guide #2 (blue) is the same guide used in Figure 4A, but with new data here. Note: guide #1 produced a severe growth defect in the cells, potentially contributing to the discrepant HiLITR activation. (B) Quantitation of fluorescence-activated cell sorting (FACS) data in (A). Log2-transformed ratio of high mCherry to low mCherry cells was calculated for each plot and normalized to that of nontargeting (NT) control plot. Top shows tail-anchored (TA) configuration and signal-anchored (SA) configuration HiLITR data, bottom shows ER configuration HiLITR data for each gene tested. (C) FACS analysis of GFP expression levels for the samples in (A). Green plot shows SAE1 knockdown cells; gray plot shows control cells (NT guide). (D) Same as Figure 4D, but with three additional sgRNAs against SAE1, and without expression of rescue constructs. Guide #2 (blue) is the same guide used in Figure 4D. HeLa cells expressing mTA* protease and dCas9-KRAB were infected with SAE1 sgRNA or NT control for 8 days before expression of protease for 1 day, fixation, and imaging. Mitochondria and Golgi are visualized with anti-TOMM20 and anti-GRASP65 antibodies, respectively. Scale bars, 10 µm. (E) Quantitation of data in (E) along with ~20 additional fields of view (n = ~50 cells per condition). For each cell, the mean intensity of Golgi-colocalized protease was divided by the mean intensity of mitochondria-colocalized protease. *p<0.05, ***p<0.001, Student’s t-test. Full data in Figure 4—figure supplement 1—source data 1. (F) FACS analysis of HiLITR activity upon chemical inhibition of SUMOylation. Three HiLITR configurations (as in Figure 2C–E) in K562 cells treated with either vehicle control (DMSO) or SUMO E1 ligase inhibitor ML-792 for 2 days prior to analysis. (G) Quantitation of FACS data in (F). Log2-transformed ratio of high mCherry to low mCherry cells was calculated for each plot and normalized to that of vehicle control. (H) FACS analysis of GFP-protease expression levels from the samples in (F) Green plot shows ML-792-treated cells, gray plot shows vehicle-treated control cells. (I) Control for Figure 4H. SAE1 knockdown does not affect mitochondrial localization of the endogenous SA protein AKAP1. Endogenous AKAP1 and the mitochondrial marker TOMM20 were visualized by immunostaining. Zooms are contrast-enhanced. Scale bar, 20 µm. (J) Quantitation of data in (I) along with approximately five additional fields of view (n = ~ 60 cells per condition). No results were significant by Student’s t-test. Full data in Figure 4—figure supplement 1—source data 2.
-
Figure 4—figure supplement 1—source data 1
Source data for Figure 4 - figure supplement 1E.
- https://cdn.elifesciences.org/articles/69142/elife-69142-fig4-figsupp1-data1-v2.xlsx
-
Figure 4—figure supplement 1—source data 2
Source data for Figure 4 - figure supplement 1J.
- https://cdn.elifesciences.org/articles/69142/elife-69142-fig4-figsupp1-data2-v2.xlsx
Figure 5 with 5 supplements
SAE1 knockdown reduces the abundance of many endogenous mitochondrial tail-anchored (TA) proteins.
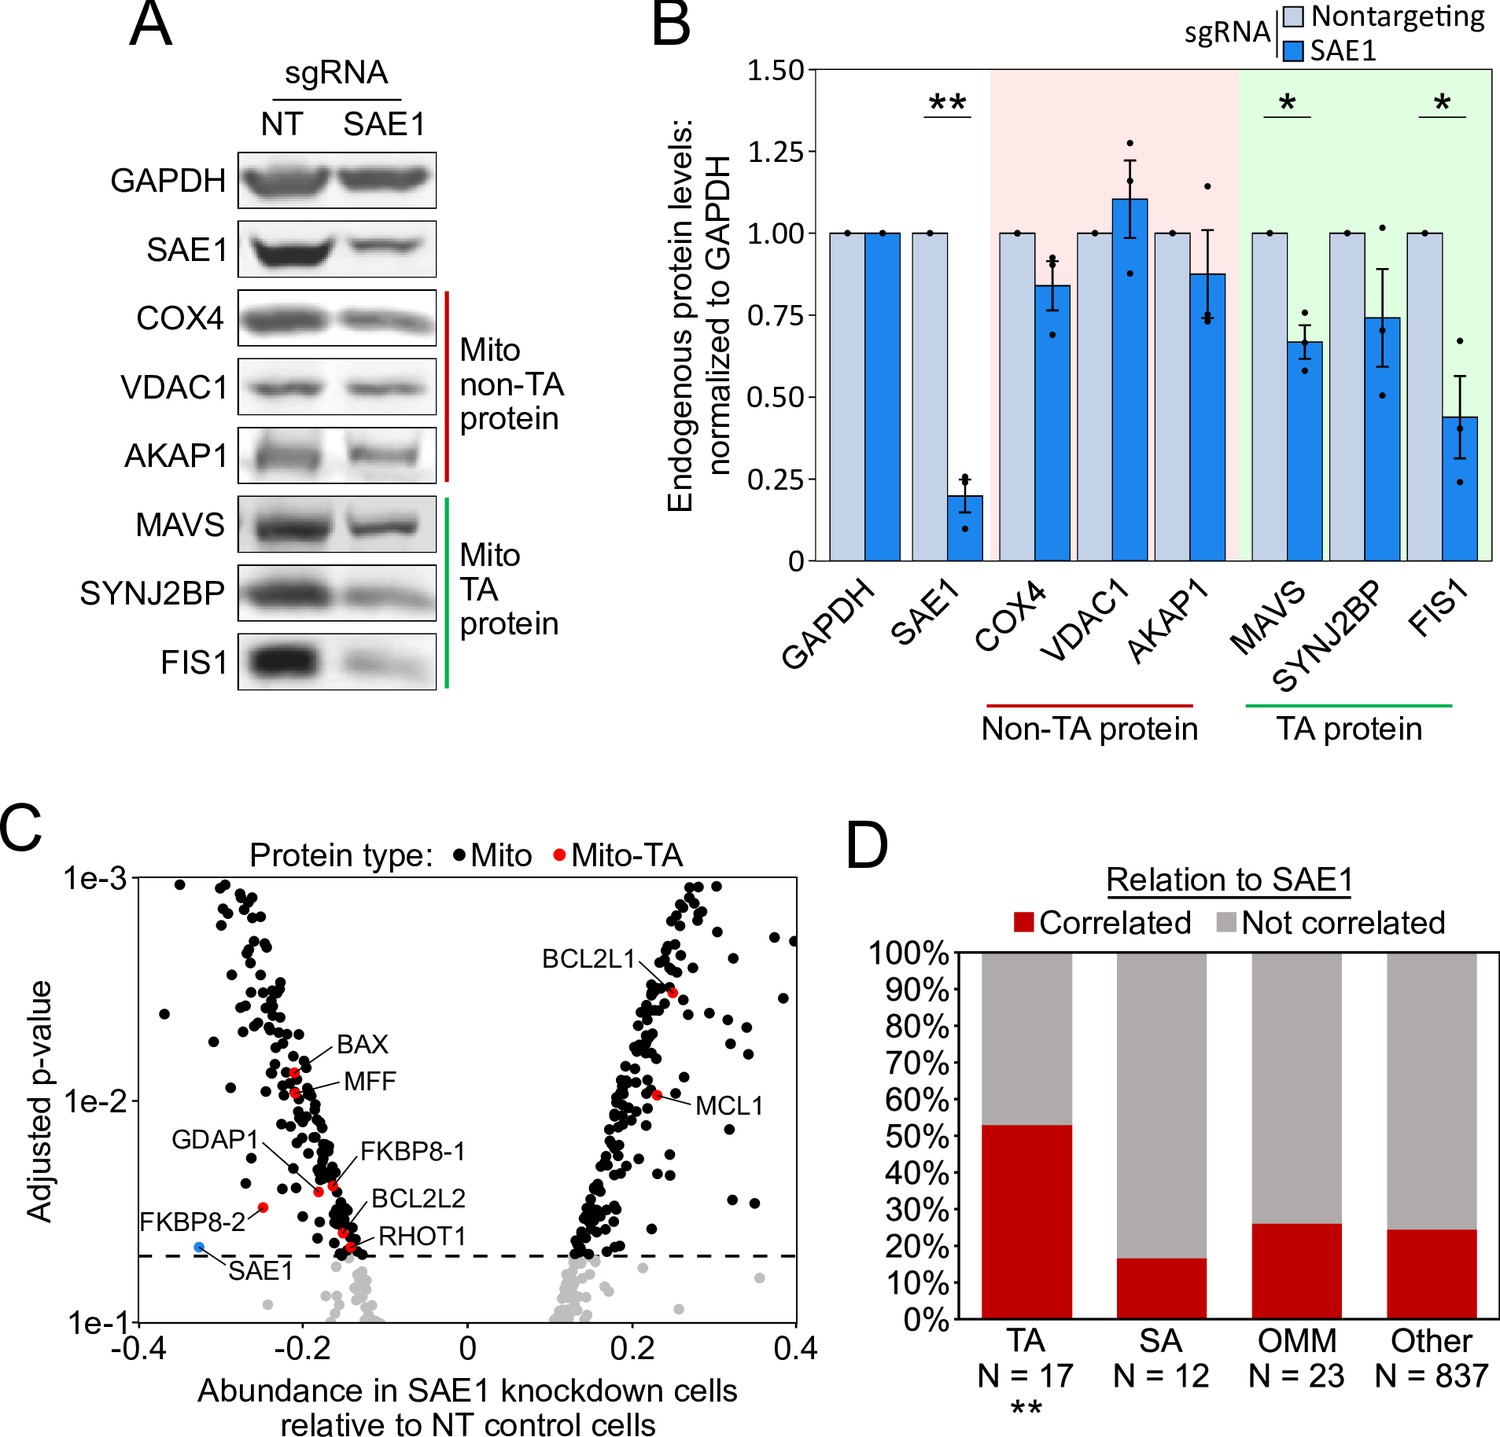
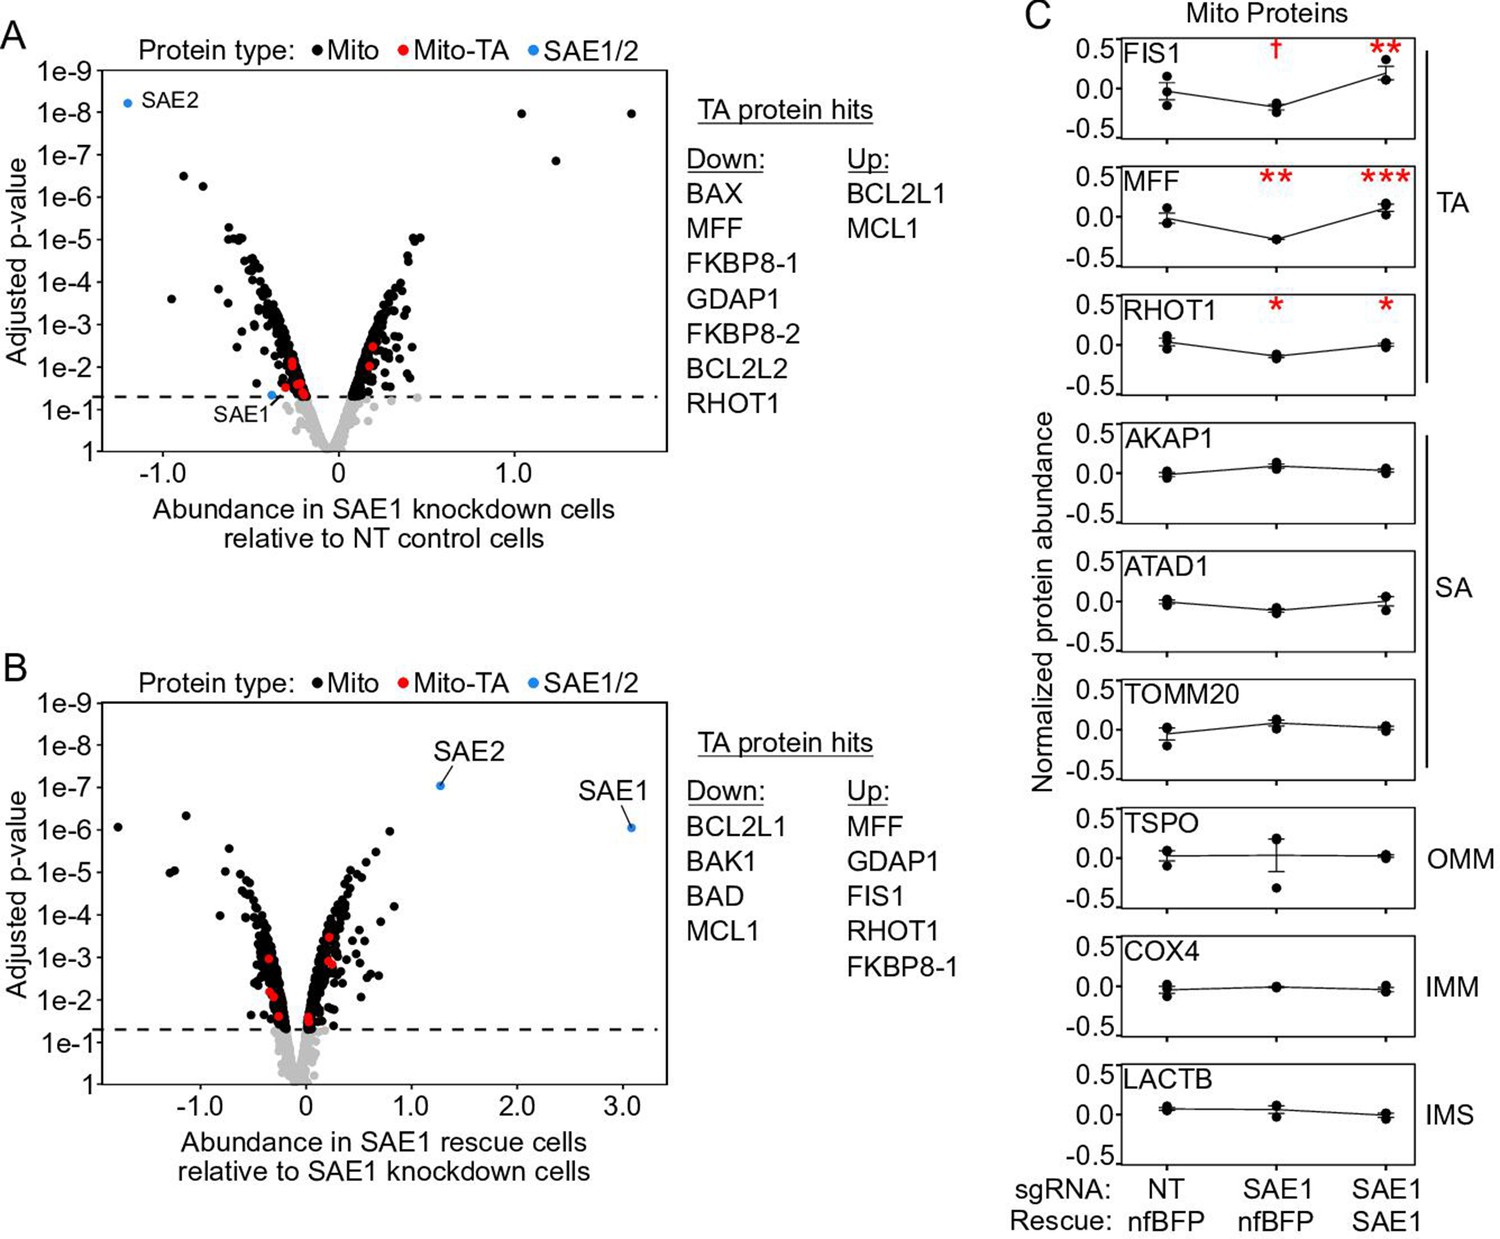
(A) HeLa cells infected with SAE1 sgRNA or nontargeting control for 9 days were analyzed by western blot. Three TA mitochondrial proteins (MAVS, SYNJ2BP, FIS1) were analyzed in addition to three non-TA mitochondrial proteins (COX4, VDAC1, AKAP1). Uncropped blots in Figure 5—figure supplement 1. (B) Quantification of data in (A) along with two additional biological replicates per condition. Error bars = SEM. *p<0.05, **p<0.01, Student’s t-test. Full data in Figure 5—source data 1. (C) Proteomic analysis of endogenous mitochondrial protein abundance in whole-cell lysate from SAE1 knockdown HeLa cells. Enrichment scores (abundance in SAE1 knockdown samples relative to abundance in nontargeting control samples; same samples as in Figure 5—figure supplement 3) were normalized to the mean mitochondrial protein abundance. Dashed line, p=0.05. Full volcano plot in Figure 5—figure supplement 4. (D) Percentage of different protein classes whose abundance positively correlates with that of SAE1 (red). TA: mitochondrial tail-anchored proteins; SA: mitochondrial signal-anchored proteins; OMM: other transmembrane outer mitochondrial membrane proteins; other: all other mitochondrial proteins. **p<0.01, chi-square test against ‘other’ mitochondrial proteins.
-
Figure 5—source data 1
Source data for Figure 5B.
- https://cdn.elifesciences.org/articles/69142/elife-69142-fig5-data1-v2.xlsx
Figure 5—figure supplement 1
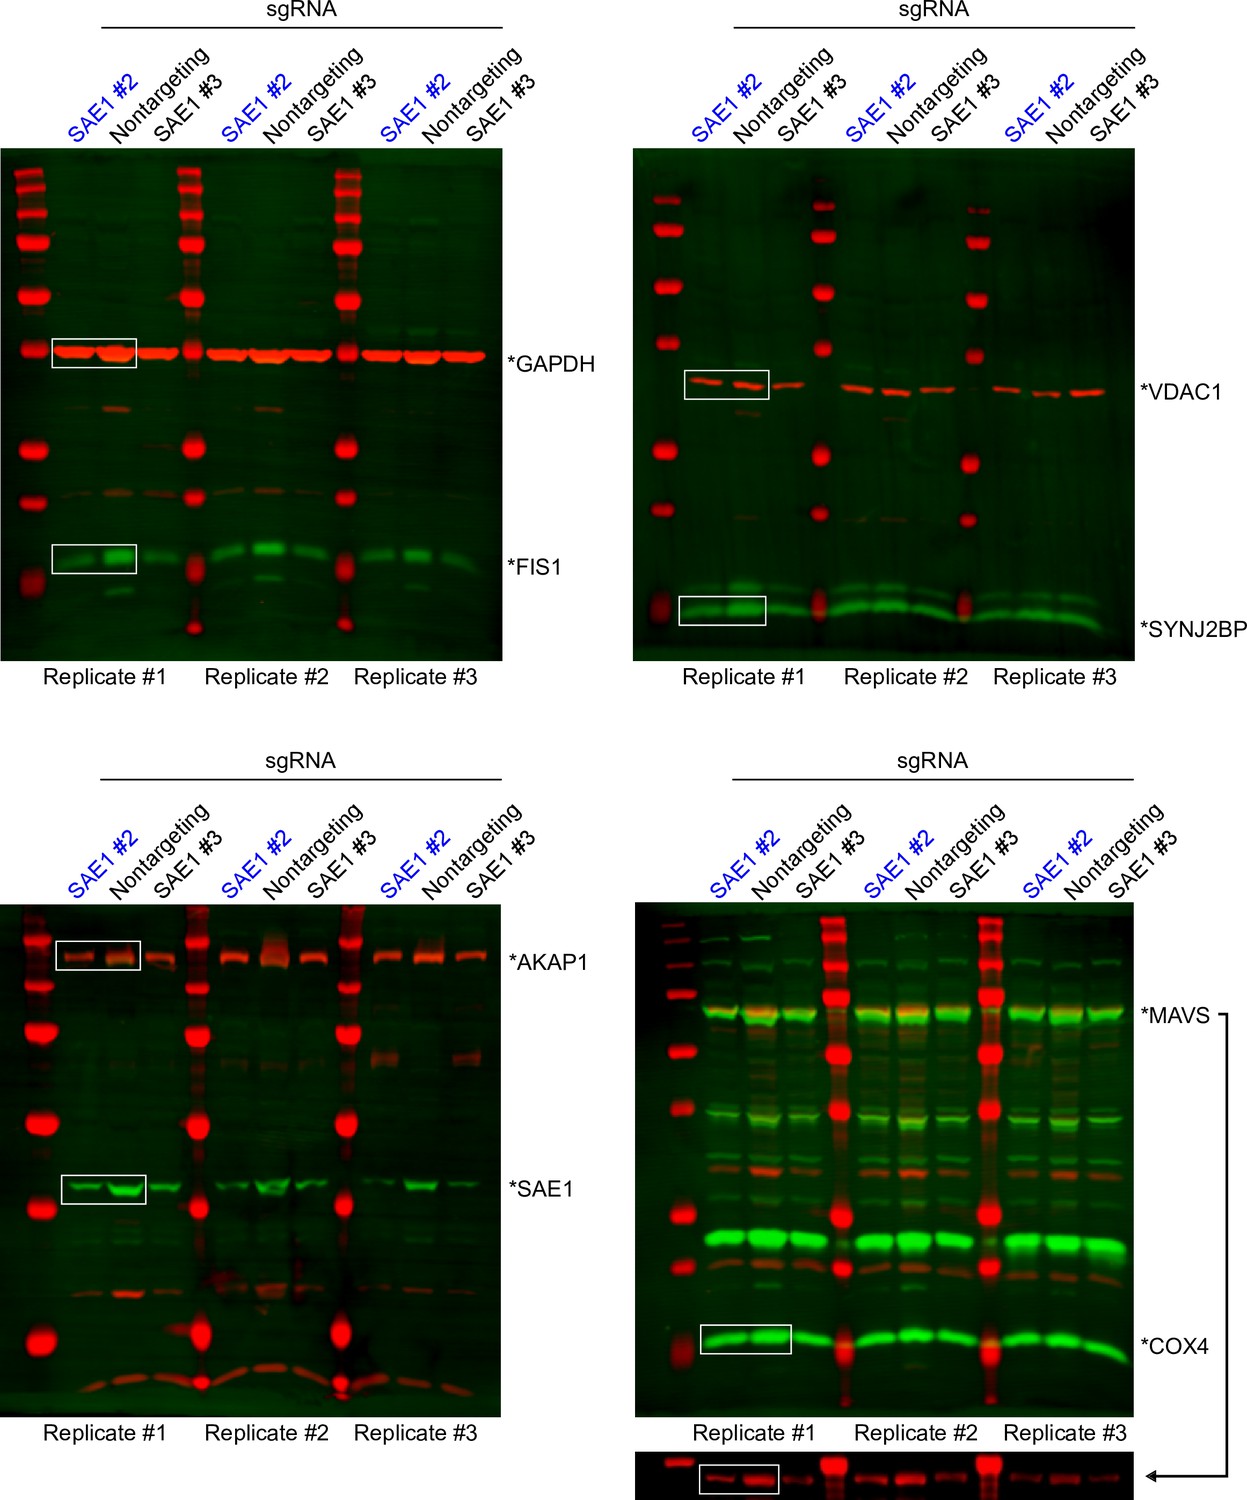
Uncropped western blots used to make Figure 5A and B.
Data from sgRNA #2 (blue) was used to generate Figure 4A (boxed regions).
Figure 5—figure supplement 2
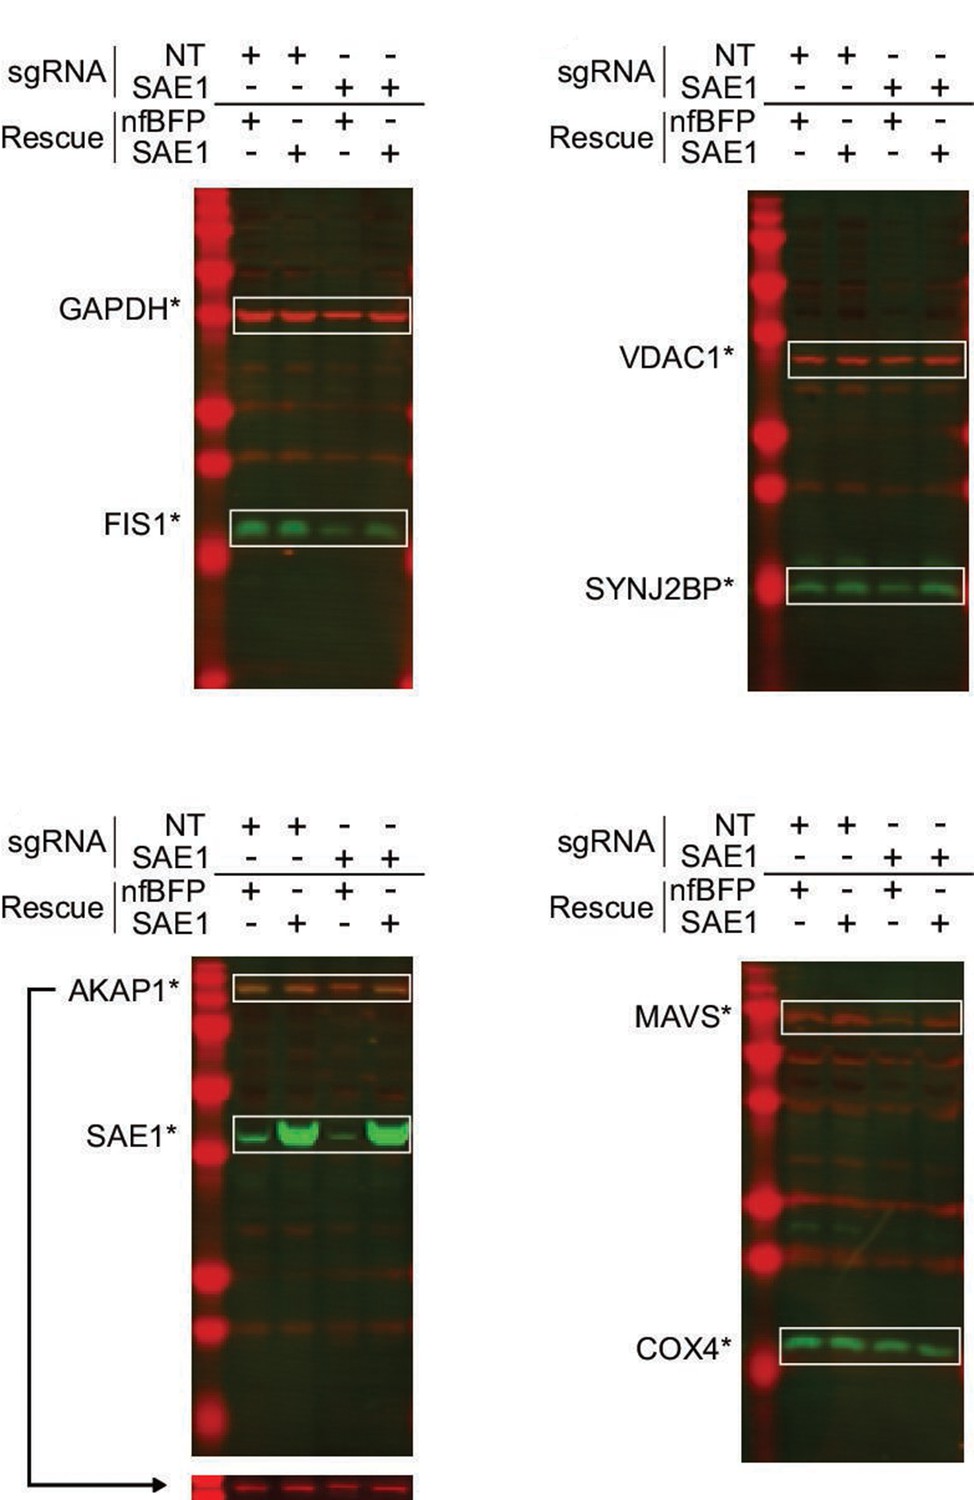
Western blots of SAE1 knockdown and rescue.
HeLa cells expressing dCas9-KRAB were infected for 9 days with either nontargeting control (NT) or sgRNA against SAE1. Each sample was further transduced with either sgRNA-resistant SAE1 or nonfluorescent BFP control (nfBFP). The abundance of endogenous mitochondrial proteins, SAE1, and GAPDH loading control was measured for each sample.
Figure 5—figure supplement 3

Whole-proteome profiling data.
(A) Overview of proteomic experiment. HeLa cells expressing either sgRNA-resistant SAE1 or nonfluorescent BFP (nfBFP) were infected with either nontargeting control sgRNA or sgRNA against SAE1 for 9 days. Whole-cell lysate in triplicate samples was analyzed by mass spectrometry. (B) Overexpression of SAE1 does not alter proteome stability. Samples with nontargeting sgRNA and SAE1 rescue (‘overexpression’) were compared to samples with nontargeting sgRNA and nfBFP rescue (‘control’). Within each sample, data were normalized to median protein abundance prior to statistical analysis. Overexpression of SAE1 only significantly alters the abundance of SAE1. Dashed line, p=0.05. (C) Knockdown of SAE1 differentially alters the stability of the mitochondrial proteome. Samples with SAE1 sgRNA and nfBFP rescue (‘knockdown’) were compared to samples with nontargeting sgRNA and nfBFP rescue (‘control’). When data are normalized to median protein abundance, we observe that SAE1 knockdown significantly alters the abundance of about half the proteome (1830 down, 2195 up, 5587 unaltered). Interestingly, SAE2 is one of the most significantly depleted proteins, suggesting coregulation of the SAE1/SAE2 heterodimer. In contrast to the overall proteome, the mitochondrial proteome abundance is specifically increased upon SAE1 knockdown (100 mitochondrial proteins down in abundance, 378 up, 411 unaltered). Note that the knockdown of SAE1 is surprisingly not classified as significant when data are normalized to median protein abundance.
Figure 5—figure supplement 4
Mitochondrial proteome data normalized to mean mitochondrial protein abundance.
(A) Same as Figure 5C, but zoomed out to show the entire volcano plot. HeLa cells expressing nonfluorescent BFP (nfBFP) were infected with sgRNA against SAE1 (‘SAE1 knockdown’) or with nontargeting control (‘NT control’; same samples as Figure 5C and Figure 5—figure supplement 3C). Data were normalized to the mean of the mitochondrial proteome, rather than to that of the cellular proteome. The depletion of SAE1 is significant when data are normalized in this way. Upon knockdown of SAE1, seven tail-anchored proteins are significantly depleted while two are enriched (compared to 202 depleted and 197 enriched for the mitochondrial proteome overall). Note that FKBP8-1/2 are different isoforms of FKBP8 that were separately detected in the proteomic analysis. In western blot experiments, the largest isoform of the tail-anchored protein MAVS was depleted (Figure 5A and B and Figure 5—figure supplements 1 and 2, MW 57 kDa). The proteomics data does not distinguish between large isoform MAVS and its five smaller isoforms, four of which lack the C-terminal transmembrane domain. This may be why the proteomics data does not show a change in endogenous MAVS abundance when SAE1 is knocked down, whereas our western blot data in Figure 5A and B does. (B) Overexpression of SAE1 rescues the effects of SAE1 knockdown. HeLa cells expressing sgRNA-resistant SAE1 and sgRNA against endogenous SAE1 (‘SAE1 rescue’) were compared to the SAE1 knockdown cells from (A). Proteins that were significantly depleted upon SAE1 knockdown vs. nontargeting control are generally enriched upon SAE1 vs. nfBFP overexpression, and vice versa. (C) Representative traces of protein abundance in basal (left), SAE1 knockdown (middle), or SAE1 rescue (right) conditions. Data shown for three tail-anchored, three signal-anchored, one outer mitochondrial membrane, one inner mitochondrial membrane, and one intermembrane space protein. The three tail-anchored proteins track with the abundance of SAE1 itself. †p<0.10, *p<0.05, **p<0.01, ***p<0.001, moderated t-test.
Figure 5—figure supplement 5
ER proteome data normalized to mean ER protein abundance.
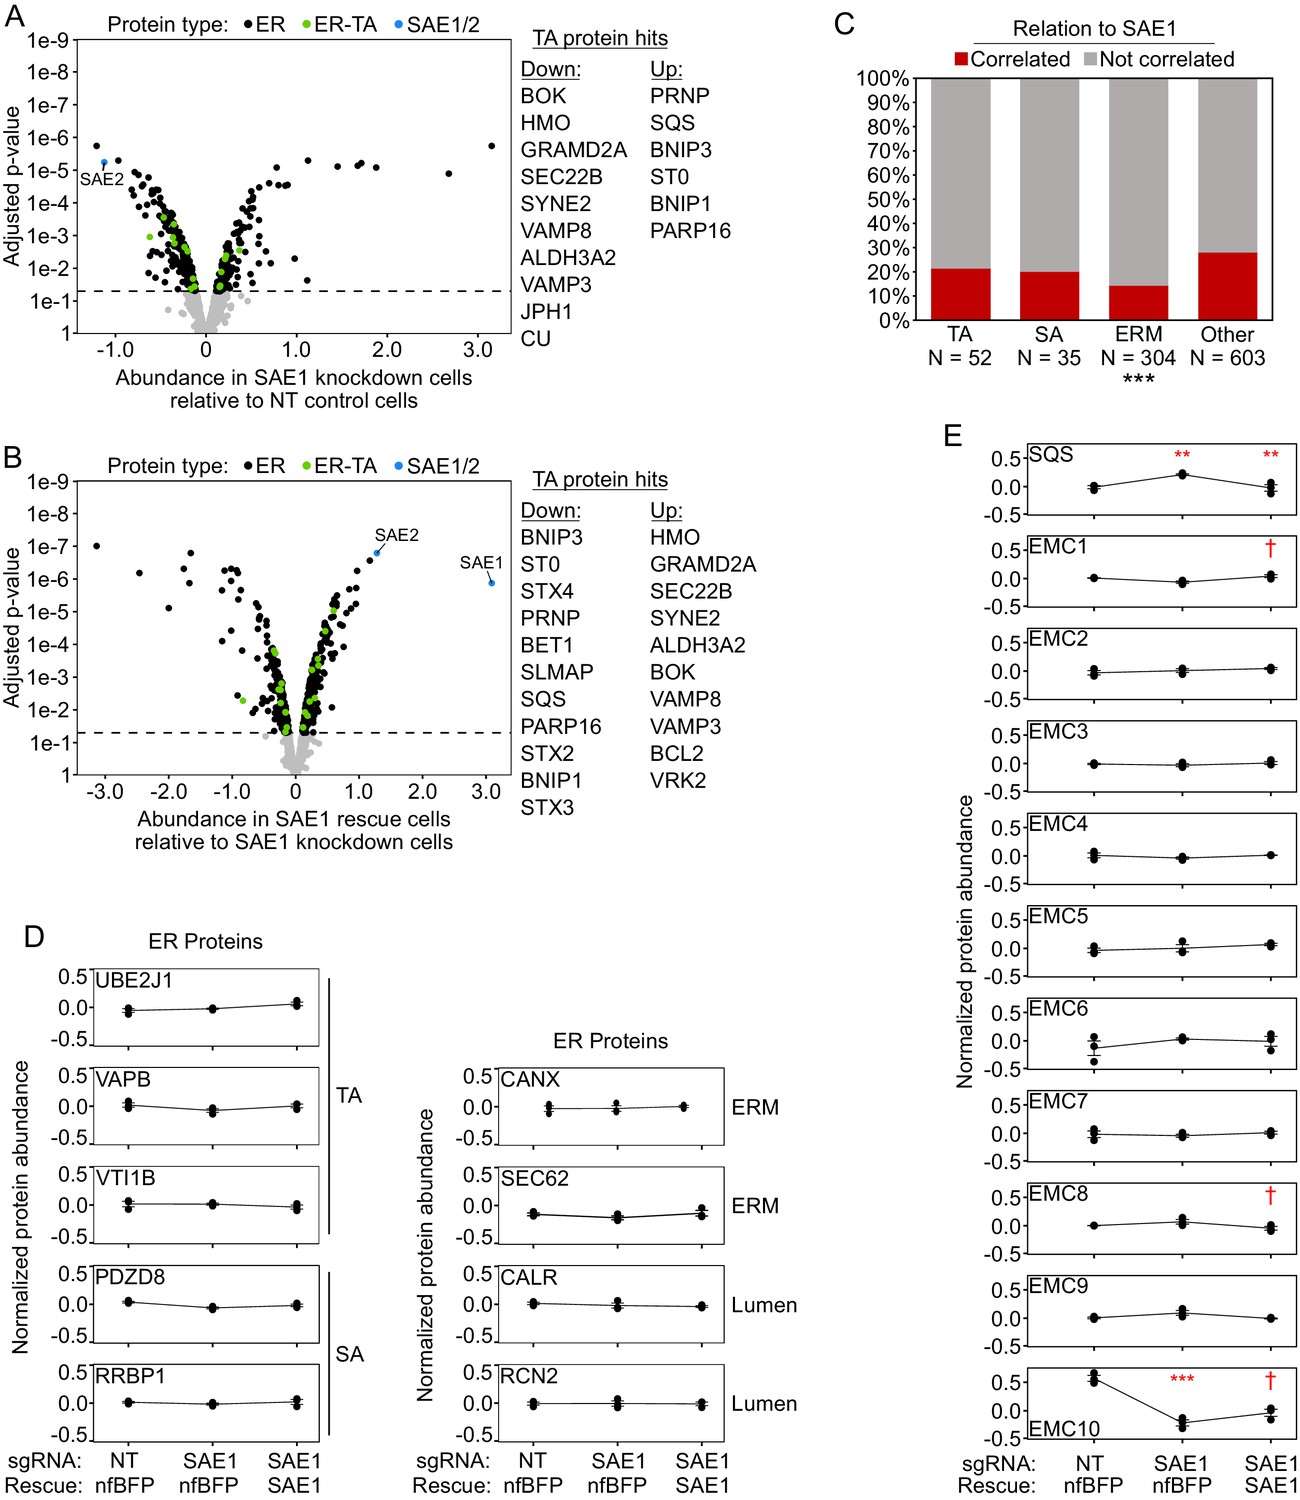
(A) Knockdown of SAE1 does not significantly affect ER tail-anchored protein abundance relative to other ER proteins. HeLa cells expressing nonfluorescent BFP and sgRNA against SAE1 (‘SAE1 knockdown’) or nontargeting control (‘NT control’; same samples as Figure 5C and Figure 5—figure supplement 3C) were analyzed by filtering the mass spectrometry data for ER proteins and normalizing abundance to the mean abundance of the ER proteome. When data were processed this way, 10 tail-anchored proteins were significantly depleted and 6 were significantly enriched (compared to 203 depleted and 156 enriched for the ER overall). (B) Overexpression of SAE1 rescues the effects of SAE1 knockdown. HeLa cells expressing sgRNA-resistant SAE1 and sgRNA against endogenous SAE1 (‘SAE1 rescue’) were compared to the SAE1 knockdown cells from (A). Proteins that were significantly depleted upon SAE1 knockdown vs. nontargeting control are generally enriched upon SAE1 vs. nfBFP overexpression, and vice versa. (C) Percentage of various protein classes whose abundance positively correlates with that of SAE1. TA: ER tail-anchored proteins; SA: ER signal-anchored proteins; ERM: other ER transmembrane proteins; other: all other ER proteins. ***p<0.001, chi-square test against ‘other‘ ER proteins. Note that compared to the mitochondria a significant number of ER transmembrane proteins are oriented into the lumen, with minimal cytosolic exposure. These proteins may be more insulated from the effects of reduced SUMOylation compared to cytosol-oriented transmembrane or peripheral proteins. (D) Representative traces of protein abundance in basal (left), SAE1 knockdown (middle), or SAE1 rescue (right) conditions. Data shown for three ER tail-anchored, two ER signal-anchored, two ER transmembrane, and two ER lumen proteins. (E) Same as (D), but for the tail-anchored ER protein SQS and the 10 members of the ER membrane complex (EMC). Related to Figure 6. †p<0.10, **p<0.01, ***p<0.001, moderated t-test.
Figure 6 with 2 supplements
EMC10 has opposite regulatory effect on ER tail-anchored (TA) proteins as other ER membrane complex (EMC) subunits.
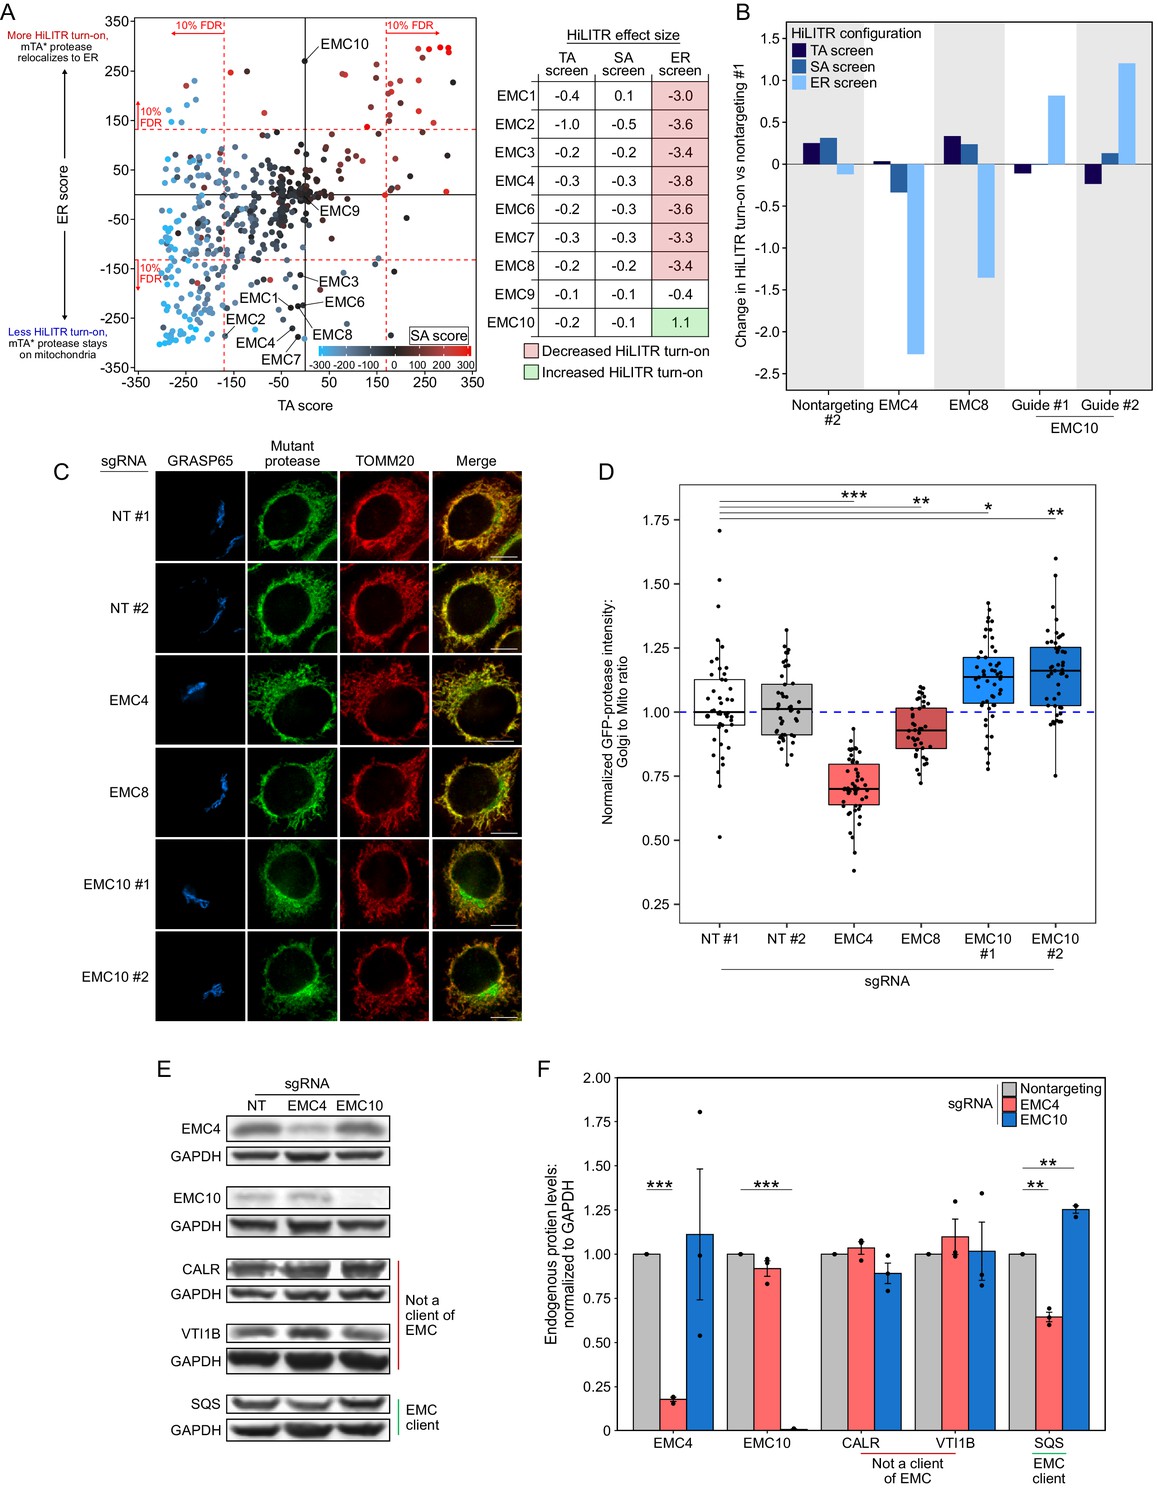
(A) Locations of 9 of 10 EMC components in the 3-CRISPRi screen CasTLE plot from Figure 3A. EMC5 was not included in the screen. In the table at right, corresponding effect sizes from each screen are shown. (B) Quantitation of the effect of individual EMC subunit (4, 8, and 10) knockdown in the TA, signal-anchored (SA), and ER HiLITR cell lines. Fluorescence-activated cell sorting (FACS) data shown in Figure 6—figure supplement 1. (C) Knockdown of EMC10 increases, while knockdown of EMC4 or EMC8 decreases, the mislocalization of GFP-tagged mTA* protease from mitochondria to Golgi in HeLa cells. Golgi and mitochondria are detected with anti-GRASP65 and anti-TOMM20 antibodies. Scale bar, 10 µm. (D) Quantification of data in (C) along with ~20 additional fields of view per condition (~50 cells per sample). *p<0.05, **p<0.01, ***p<0.001, Student’s t-test. Full data in Figure 6—source data 1. (E) Knockdown of EMC subunits has different effects on endogenous EMC client protein SQS. HeLa cells expressing the indicated sgRNAs (EMC10 sgRNA #2) for 9 days were analyzed by western blot to detect the endogenous TA EMC client protein SQS as well as two non-client proteins (ER lumen protein CALR and ER TA protein VTI1B). Uncropped blots in Figure 6—figure supplement 2. (F) Quantification of data in (E) along with two additional biological replicates per condition. Error bars = SEM. **p<0.01, ***p<0.001, Student’s t-test. Full data in Figure 6—source data 2.
-
Figure 6—source data 1
Source data for Figure 6D.
- https://cdn.elifesciences.org/articles/69142/elife-69142-fig6-data1-v2.xlsx
-
Figure 6—source data 2
Source data for Figure 6F.
- https://cdn.elifesciences.org/articles/69142/elife-69142-fig6-data2-v2.xlsx
Figure 6—figure supplement 1
Additional HiLITR analysis related to the ER membrane complex (EMC).
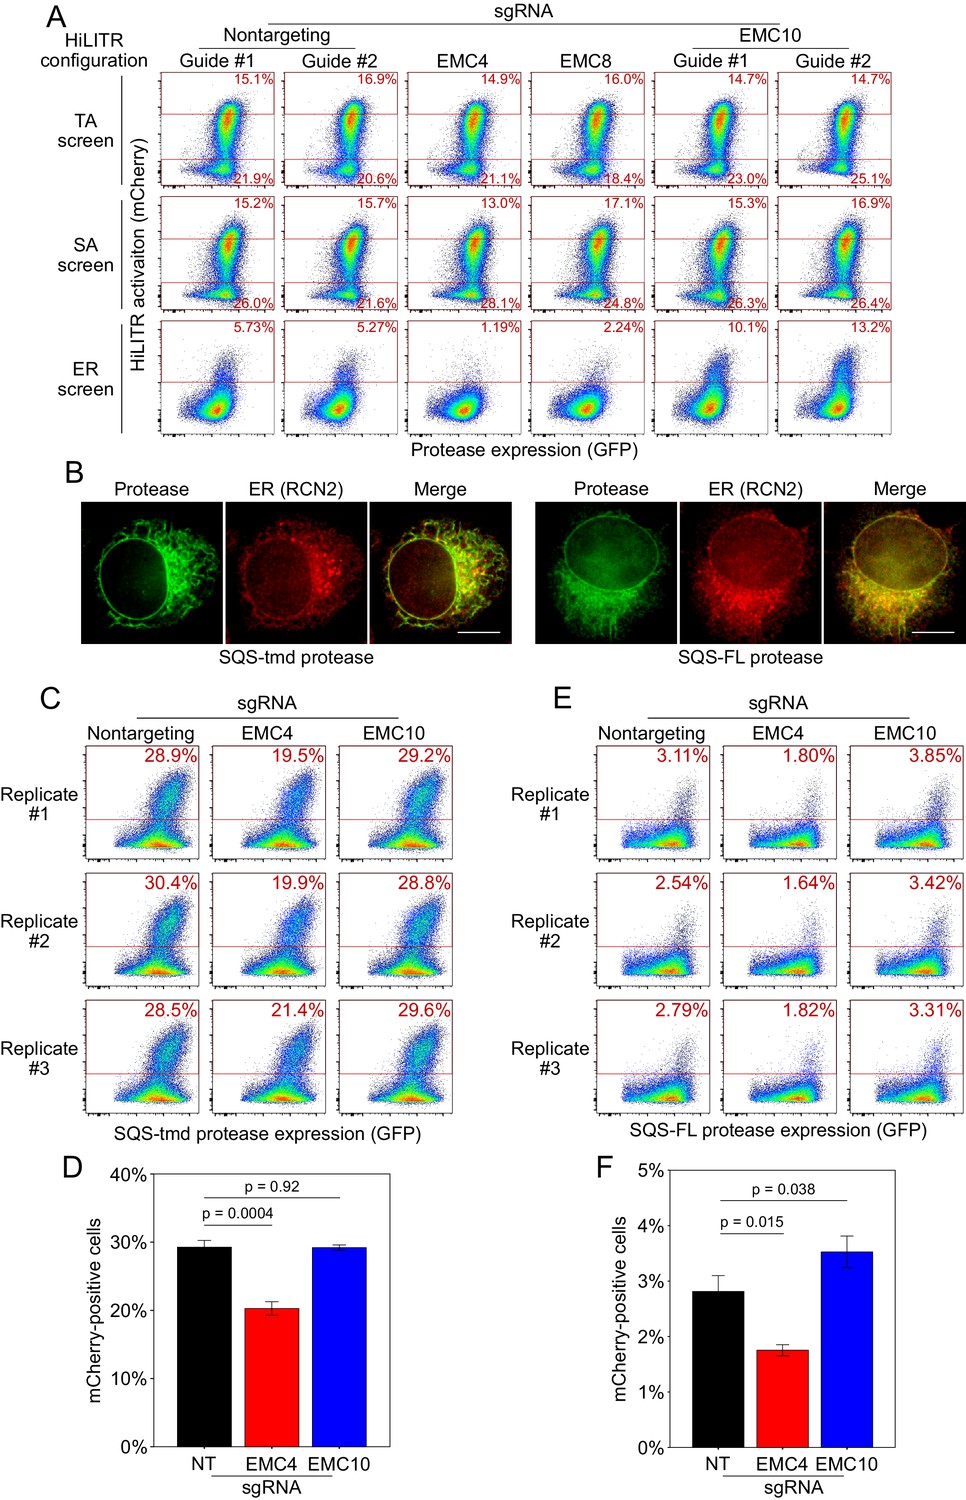
(A) Fluorescence-activated cell sorting (FACS) analysis related to Figure 6B. Three HiLITR configurations (as in Figure 2C–E) in K562 cells with sgRNAs against EMC subunits and two nontargeting control guides. (B) Immunofluorescence microscopy of the EMC client tail-anchored proteases. In HeLa cells, the localization of the SQS-tmd and SQS-FL proteases (GFP) was compared to an ER marker (RCN2). Scale bar, 10 µm. (C) FACS analysis of HiLITR for ER-targeted tail-anchored (TA) protease. Protease was targeted to the ER with the transmembrane domain of TA protein SQS. HiLITR transcription factor (TF) was also targeted to the ER. Three biological replicates were performed in polyclonal cell lines, and the percentage of cells above the red line is shown in each plot. (D) Quantitation of the replicates in (C). Error bars = SEM. Significance calculated by Student’s t-test. (E) Same as (C), but the protease was targeted to the ER with full-length SQS. (F) Quantitation of the replicates in (E). Error bars = SEM. Significance calculated by Student’s t-test.
Figure 6—figure supplement 2
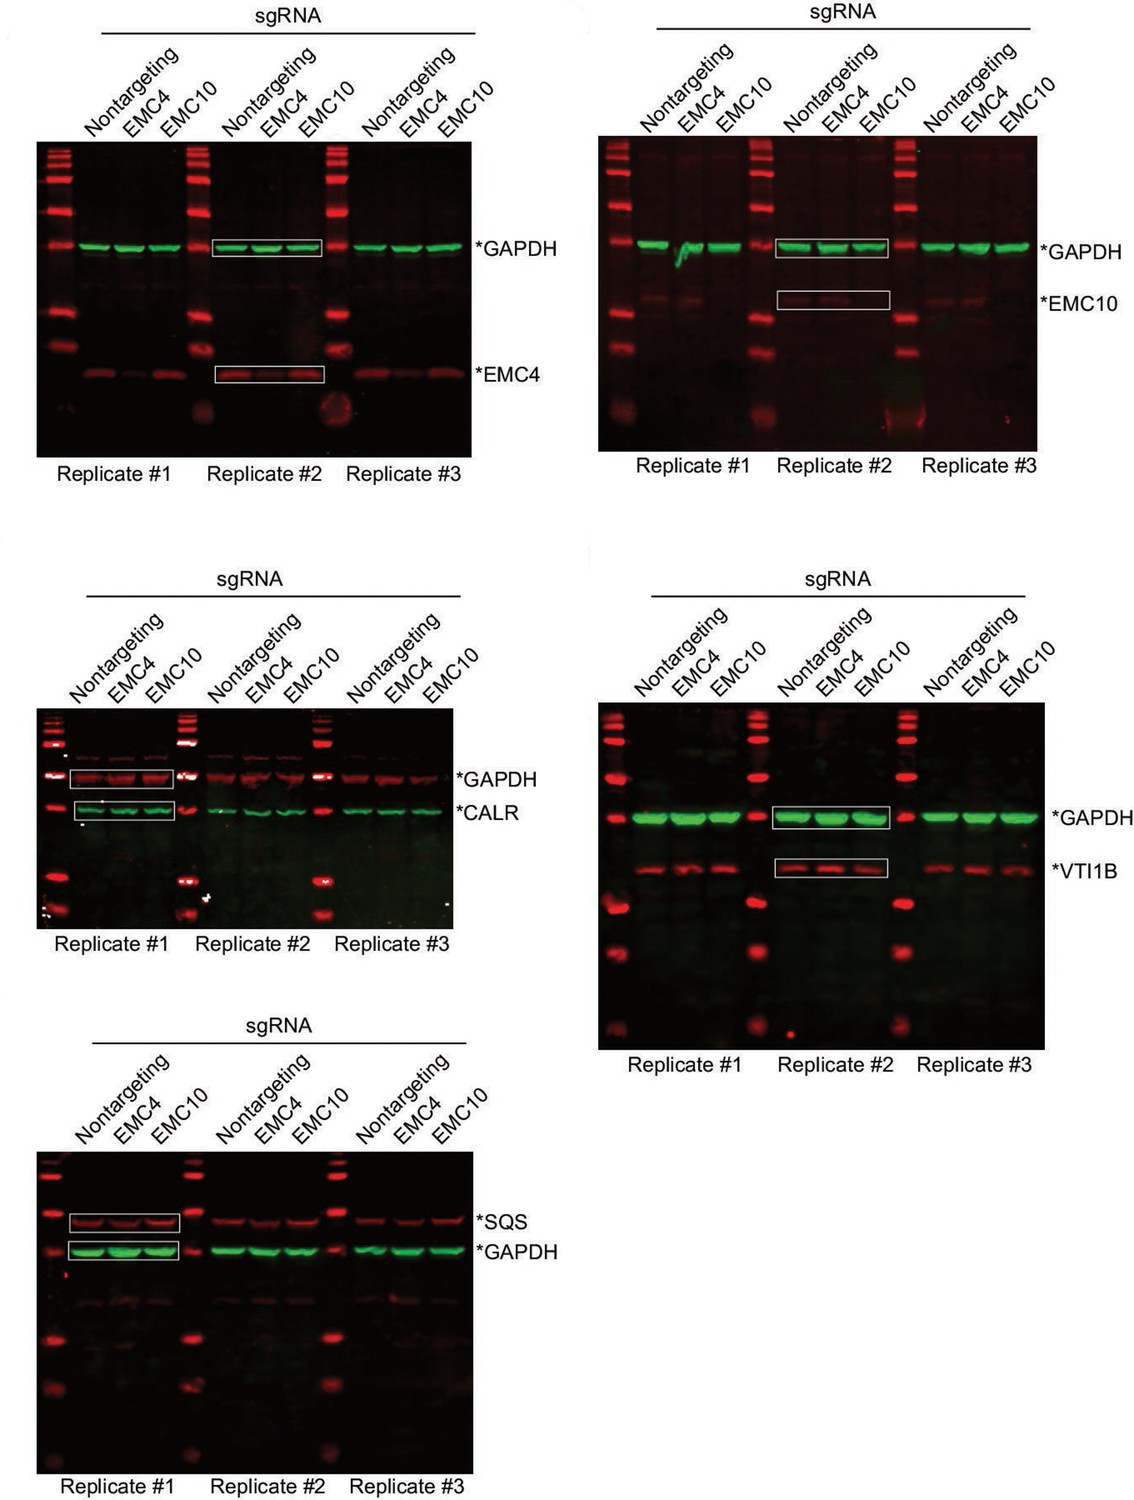
Uncropped western blots used to make Figure 6E and F.
Tables
Key resources table
| Reagent type (species) or resource | Designation | Source or reference | Identifiers | Additional information |
|---|---|---|---|---|
| Cell line (human) | HEK293T | ATCC | Cat# CRL-3216; RRID:CVCL_0063 | |
| Cell line (human) | K562 | ATCC | Cat# CCL-243; RRID:CVCL_0004 | |
| Cell line (human) | HeLa | Hein et al., 2015 | RRID:CVCL_1922 | |
| Antibody | Anti-V5 (Mouse monoclonal) | Invitrogen | Cat# R960; RRID:AB_2556564 | Immunofluorescence (1:1000) |
| Antibody | Anti-TOMM20 (Rabbit monoclonal) | Abcam | Cat# ab186735; RRID:AB_2889972 | Immunofluorescence (1:500) |
| Antibody | Anti-GRASP65 (Mouse monoclonal) | Santa Cruz | Cat# sc-374423; RRID:AB_10991322 | Immunofluorescence (1:500) |
| Antibody | Anti-CANX (Rabbit polyclonal) | Thermo Fisher | Cat# PA5-34754; RRID:AB_2552106 | Immunofluorescence (1:500) |
| Antibody | Anti-PEX14 (Rabbit polyclonal) | Proteintech | Cat# 10594-1-AP; RRID:AB_2252194 | Immunofluorescence (1:500) |
| Antibody | Anti-RCN2 (Rabbit polyclonal) | Thermo Fisher | Cat# PA5-56542; RRID:AB_2646431 | Immunofluorescence (1:500) |
| Antibody | Anti-GAPDH (Mouse monoclonal) | Santa Cruz | Cat# sc-32233; RRID:AB_627679 | Western blot (1:4500) |
| Antibody | Anti-SAE1 (Rabbit polyclonal) | Sigma | Cat# SAB4500028; RRID:AB_10742679 | Western blot (1:500) |
| Antibody | Anti-COX4 (Rabbit polyclonal) | Abcam | Cat# ab16056; RRID:AB_443304 | Western blot (1:1000) |
| Antibody | Anti-VDAC1 (Mouse monoclonal) | Abcam | Cat# ab14734; RRID:AB_443084 | Western blot (1:500) |
| Antibody | Anti-AKAP1 (Mouse monoclonal) | Santa Cruz | Cat# sc-135824; RRID:AB_2225573 | Immunofluorescence (1:200); western blot (1:500) |
| Antibody | Anti-MAVS (Mouse monoclonal) | Santa Cruz | Cat# sc-166583; RRID:AB_2012300 | Immunofluorescence (1:200); western blot (1:250) |
| Antibody | Anti-SYNJ2BP (Rabbit polyclonal) | Sigma | Cat# HPA000866; RRID:AB_2276678 | Western blot (1:500) |
| Antibody | Anti-FIS1 (Rabbit polyclonal) | Thermo Fisher | Cat# 10956–1-AP; RRID:AB_2102532 | Western blot (1:1000) |
| Antibody | Anti-EMC4 (Rabbit monoclonal) | Abcam | Cat# ab184162; RRID:AB_2801471 | Western blot (1:1000) |
| Antibody | Anti-EMC10 (Rabbit monoclonal) | Abcam | Cat# ab180148; RRID:AB_2889936 | Western blot (1:500) |
| Antibody | Anti-CALR (Rabbit polyclonal) | Thermo Fisher | Cat# PA3900; RRID:AB_325990 | Western blot (1:500) |
| Antibody | Anti-VTI1B (Rabbit monoclonal) | Abcam | Cat# ab184170; RRID:AB_2889935 | Western blot (1:250) |
| Antibody | Anti-SQS (Rabbit monoclonal) | Abcam | Cat# ab195046; RRID:AB_2860018 | Western blot (1:500) |
| Antibody | Anti-Mouse Alexa Fluor 488 (Goat polyclonal) | Invitrogen | Cat#: A11029; RRID:AB_138404 | Immunofluorescence (1:1000) |
| Antibody | Anti-Mouse Alexa Fluor 568 (Goat polyclonal) | Invitrogen | Cat# A11031; RRID:AB_144696 | Immunofluorescence (1:1000) |
| Antibody | Anti-Mouse Alexa Fluor 647 (Goat polyclonal) | Invitrogen | Cat#: A21236; RRID:AB_2535805 | Immunofluorescence (1:1000) |
| Antibody | Anti-Rabbit Alexa Fluor 568 (Goat polyclonal) | Invitrogen | Cat#: A11036; RRID:AB_10563566 | Immunofluorescence (1:1000) |
| Antibody | Anti-Rabbit Alexa Fluor 405 (Goat polyclonal) | Invitrogen | Cat# A31556; RRID:AB_221605 | Immunofluorescence (1:1000) |
| Antibody | Anti-Mouse IgG IRDye 680RD (Goat polyclonal) | Licor | Cat# 926-68070; RRID:AB_10956588 | Western blot (1:20,000) |
| Antibody | Anti-Mouse IgG IRDye 800CW (Goat polyclonal) | Licor | Cat# 926-32210; RRID:AB_621842 | Western blot (1:20,000) |
| Antibody | Anti-Rabbit IgG IRDye 680RD (Goat polyclonal) | Licor | Cat# 926-68071; RRID:AB_10956166 | Western blot (1:20,000) |
| Antibody | Anti-Rabbit IgG IRDye 800CW (Goat polyclonal) | Licor | Cat# 926-32211; RRID:AB_621843 | Western blot (1:20,000) |
| Recombinant DNA reagent | Plasmids used | This paper | N/A | Supplementary file 1 |
| Sequence-based reagent | HiLITR TEV-protease QPCR primers | This paper | N/A | Materials and methods: ‘Model selection’ |
| Sequence-based reagent | Random hexamer primer | Invitrogen | Cat# N8080127 | |
| Sequence-based reagent | Individual sgRNA sequences used | This paper | N/A | Supplementary file 1 |
| Sequence-based reagent | sgRNA libraries derived from hCRISPRi-v2 | Horlbeck et al., 2016 | RRID:Addgene_83969 | Supplementary file 2 |
| Peptide, recombinant protein | Fibronectin | Millipore | Cat# FC010 | |
| Peptide, recombinant protein | Bovine serum albumin | Fisher BioReagents | Cat# BP1600 | |
| Peptide, recombinant protein | Aprotinin | Sigma | Cat# A1153 | |
| Peptide, recombinant protein | Leupeptin | Roche | Cat# 11017101001 | |
| Peptide, recombinant protein | Endoproteinase LysC | Wako Laboratories | Cat# 12505061 | |
| Peptide, recombinant protein | Sequencing-grade trypsin | Promega | Cat# V5111 | |
| Commercial assay or kit | RNeasy Plus Mini Kit | Qiagen | Cat# 74134 | |
| Commercial assay or kit | QIAamp DNA Blood Maxi Kit | Qiagen | Cat# 51194 | |
| Commercial assay or kit | BCA Assay Kit | Pierce | Cat# 23225 | |
| Commercial assay or kit | MycoAlert Mycoplasma detection kit | Lonza | Cat# LT07-118 | |
| Chemical compound, drug | 1% penicillin-streptomycin | Corning | Cat# 30-002CI | |
| Chemical compound, drug | GlutaMAX | Gibco | Cat# 35050061 | |
| Chemical compound, drug | Puromycin | Sigma | Cat# P8833 | |
| Chemical compound, drug | Blasticidin | Corning | Cat# 30-100-RB | |
| Chemical compound, drug | Hygromycin | Corning | Cat# 30-240-CR | |
| Chemical compound, drug | Geneticin G418 | Thermo Fisher | Cat# 10131035 | |
| Chemical compound, drug | Polyethyleneimine (PEI) | Polysciences | Cat# 24765-1 | |
| Chemical compound, drug | Polybrene | Millipore | Cat# TR-1003-G | |
| Chemical compound, drug | Doxycycline | Sigma | Cat# C9891 | |
| Chemical compound, drug | MitoTracker Deep Red FM | Invitrogen | Cat# M22426 | |
| Chemical compound, drug | Paraformaldehyde | RICCA | Cat# 3180 | |
| Chemical compound, drug | Triton X-100 | Sigma | Cat# T9284 | |
| Chemical compound, drug | TMTpro isobaric mass tagging reagent | Thermo | Cat# A44520 | |
| Software, algorithm | CasTLE | Morgens et al., 2016 | https://bitbucket.org/dmorgens/castle/src | |
| Software, algorithm | Bowtie 2 | Langmead and Salzberg, 2012 | RRID::SCR_016368 | |
| Software, algorithm | SH800S Cell Sorter Software (versions 2.1.2, 2.1.5) | SONY | N/A | |
| Software, algorithm | Everest (version 2.3) | BioRad | N/A | |
| Software, algorithm | FlowJo (version 10.7.1) | FlowJo | N/A | |
| Software, algorithm | SlideBook 5.0 software | Intelligent Imaging Innovations | N/A | |
| Software, algorithm | StepOne Software (version 2.2.2) | Applied Biosystems | N/A | |
| Software, algorithm | Limma (version 3.42.2) | Smyth, 2004 | RRID:SCR_010943 | |
| Other | Fetal bovine serum | Avantor | Cat# 97068-085 | |
| Other | SuperScript III Reverse Transcriptase | Invitrogen | Cat# 18080093 | |
| Other | RiboLock RNAse inhibitor | Thermo Scientific | Cat# EO0382 | |
| Other | Maxima SYBR Green/ROX qPCR Master Mix | Thermo Scientific | Cat# K0221 | |
| Other | Herculase II Fusion | Agilent | Cat# 600679 | |
| Other | Protease Inhibitor Cocktail | Sigma | Cat# P8849 | |
| Other | Precision Plus Protein All Blue Prestained Standards | BioRad | Cat# 1610373 |
Additional files
-
Supplementary file 1
Plasmids used in the study and individual sgRNA sequences used.
Plasmids_Used: plasmid table for this study. sgRNAs_Used: sgRNA sequences used for individual sgRNA sequences.
- https://cdn.elifesciences.org/articles/69142/elife-69142-supp1-v2.xlsx
-
Supplementary file 2
Information about sgRNA libraries related to Figure 2—figure supplement 1 and to Figure 3.
Sequencing and CasTLE analysis results from the whole-genome screen and sublibrary screens. Comparison of individual validation data to sublibrary screen data. WGS_sgRNAs: sgRNA sequences and target genes in the whole-genome screen. TA_WGS: CasTLE analysis of the whole-genome screen (TA screen HiLITR configuration). Sublibrary_sgRNAs: sgRNA sequences and target genes in the sublibrary screens. TA/SA/ER_Sublibrary: CasTLE analysis of the sublibrary screens (TA/SA/ER screen HiLITR configurations). Sublibrary_Comparison: comparison of combined-replicate CasTLE analysis across the TA/SA/ER sublibrary screens. Hits&Validation: sublibrary screen data for genes mentioned in main and supplementary figures, with independent validation data appended where applicable.
- https://cdn.elifesciences.org/articles/69142/elife-69142-supp2-v2.xlsx
-
Supplementary file 3
Data from the proteomic analysis related to Figure 5 and Figure 5—figure supplements 3–5.
Results_MedNormed: abundance values and statistical analysis of experimental replicates, normalized to median abundance value in the replicate/column. Results_MitoNormed: abundance values and statistical analysis of experimental replicates, normalized to mean abundance value across mitochondrial proteins in the replicate/column. Results_ER-Normed: abundance values and statistical analysis of experimental replicates, normalized to mean abundance value across ER proteins in the replicate/column.
- https://cdn.elifesciences.org/articles/69142/elife-69142-supp3-v2.xlsx
-
Transparent reporting form
- https://cdn.elifesciences.org/articles/69142/elife-69142-transrepform1-v2.docx
Download links
A two-part list of links to download the article, or parts of the article, in various formats.
Downloads (link to download the article as PDF)
Open citations (links to open the citations from this article in various online reference manager services)
Cite this article (links to download the citations from this article in formats compatible with various reference manager tools)
An engineered transcriptional reporter of protein localization identifies regulators of mitochondrial and ER membrane protein trafficking in high-throughput CRISPRi screens
eLife 10:e69142.
https://doi.org/10.7554/eLife.69142


