Evolutionary dynamics of circular RNAs in primates
- EMBL Australia, Garvan Institute of Medical Research, Australia
- St. Vincent Clinical School, University of New South Wales, Australia
- School of Biotechnology and Biomolecular Sciences, University of New South Wales, Australia
Figures
Figure 1 with 3 supplements
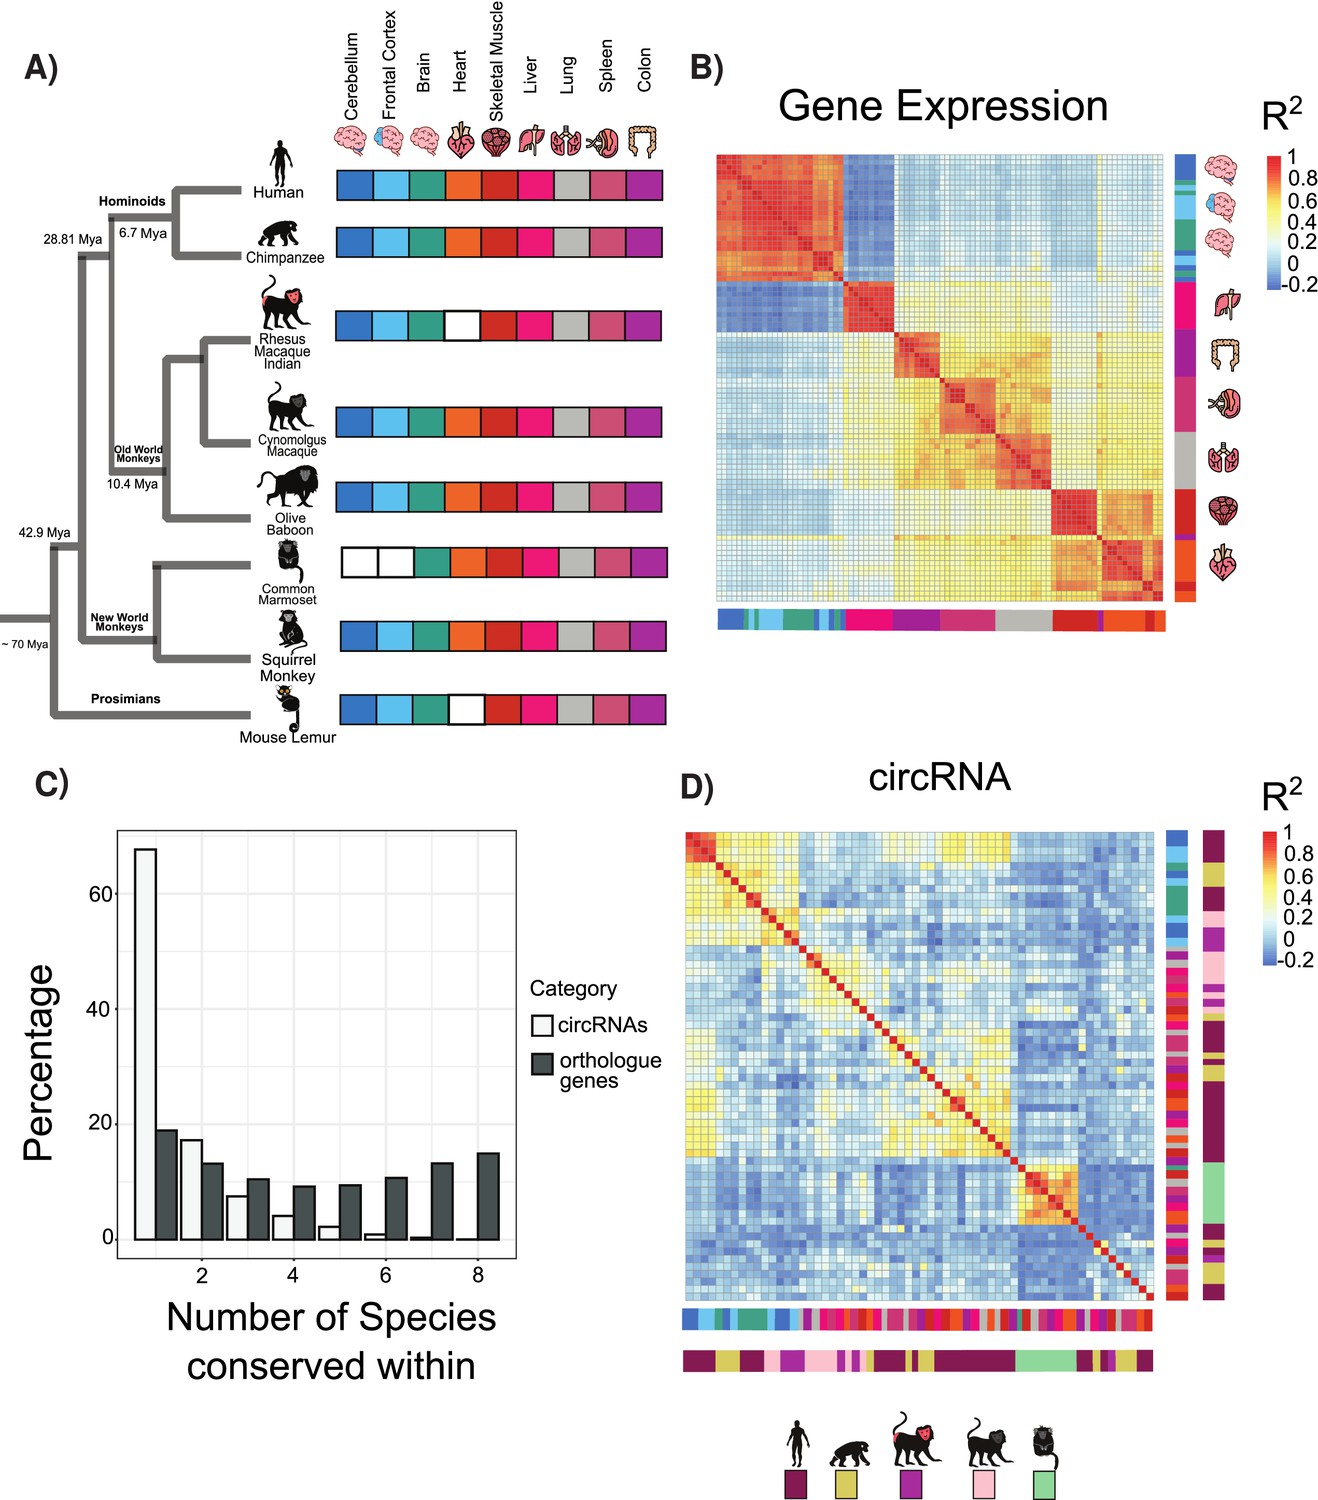
Circular RNA (circRNA) expression signatures are conserved in some tissues.
(A) Phylogenetic tree of analyzed species with distance from human in millions of years (MYA) (divergence time according to TimeTree http://www.timetree.org/). Tissue datasets used in analysis identified on right with white squares denoting lack of dataset. (B) Clustering of samples based on expression values (transcripts per million). The variance of expression values was calculated, and the top 1000 most variable genes were used to calculate Pearson’s correlation (n = 1000 genes in 88 samples). Red colors indicate high correlation between samples, and blue describes low correlation. Vertical and horizontal adjacent heatmaps describe tissues (see A for key). (C) Barplot showing conservation of circRNAs based on back-spliced junction and based on occurrence within orthologous genes. (D) Clustering of conserved circRNAs based on percent spliced in (PSI) values. Clustered using Pearson’s correlation as in (B) (n = 149). Vertical and horizontal adjacent heatmaps describe tissues (inner heatmap; see A for key) and species (outer heatmap).
Figure 1—figure supplement 1
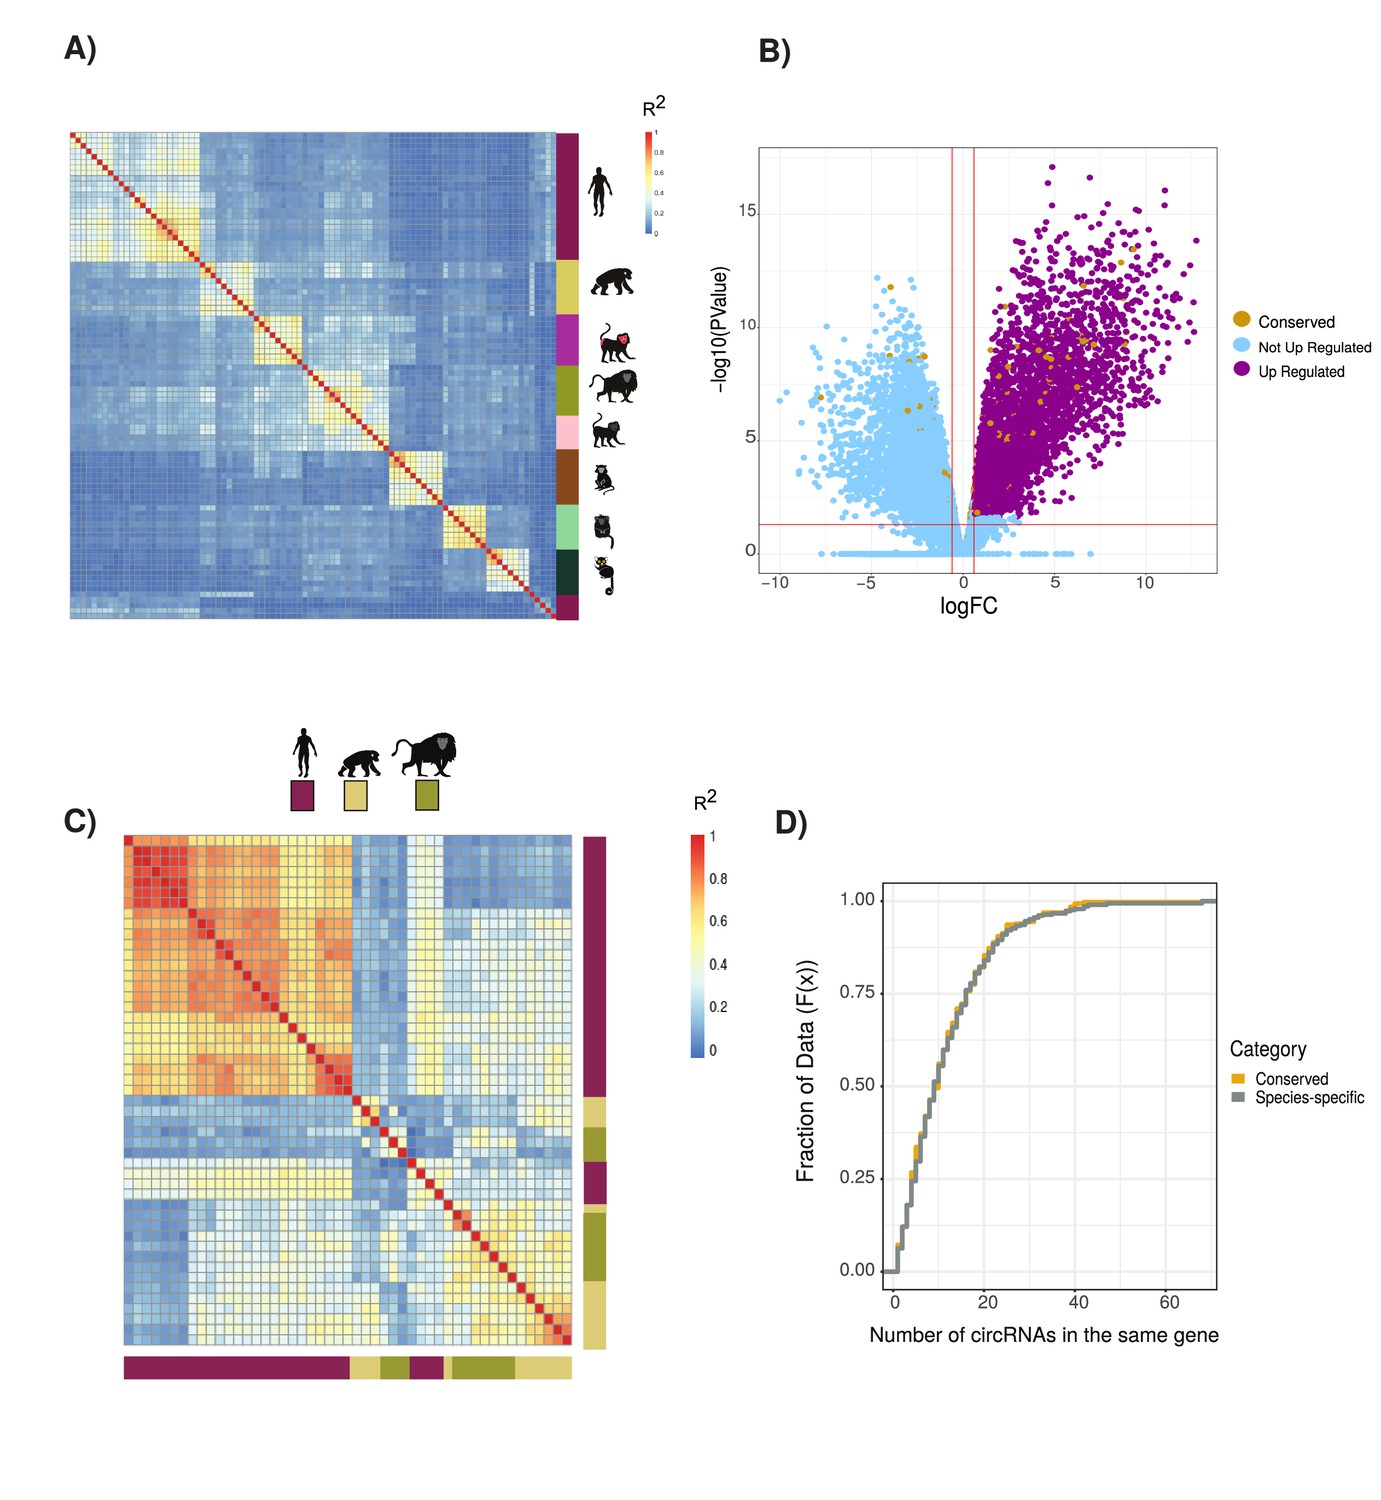
circRNAs expression and exons splicing patterns across primates species and in neuronal tissues.
(A) Clustering of circular RNAs (circRNAs) based on percent spliced in (PSI) values. Clustered using Pearson’s correlation as in Figure 1B (n = 19,005). Vertical heatmap indicates primate species. See Figure 1B for details of heatmap and Supplementary file 4 for data used. (B) Volcano plot of differential gene expression analysis between neuronal samples and non-neuronal samples. In blue are ‘not upregulated genes’ (n = 15,661), in purple are ‘upregulated genes’ (n = 4434), and in yellow the ‘genes with conserved circRNAs’ (n = 442). Likelihood of circRNA genes being enriched in differentially expression genes (p=0.036, hypergeometric test). FC: fold value. p-Value in figures calculated by quasi-likelihood-negative binomial test and corrected for multitesting (Bonferroni). (C) Clustering of alternative splicing events based on PSI of exons within conserved circRNAs shows no clustering by tissue (n = 1256). Vertical and horizontal adjacent heatmaps represent species. See Figure 1B for details of heatmap. (D) Cumulative distribution plot displaying the number of circRNAs found within same gene (see Figure 2D for description of cumulative distribution plots).
Figure 1—figure supplement 2
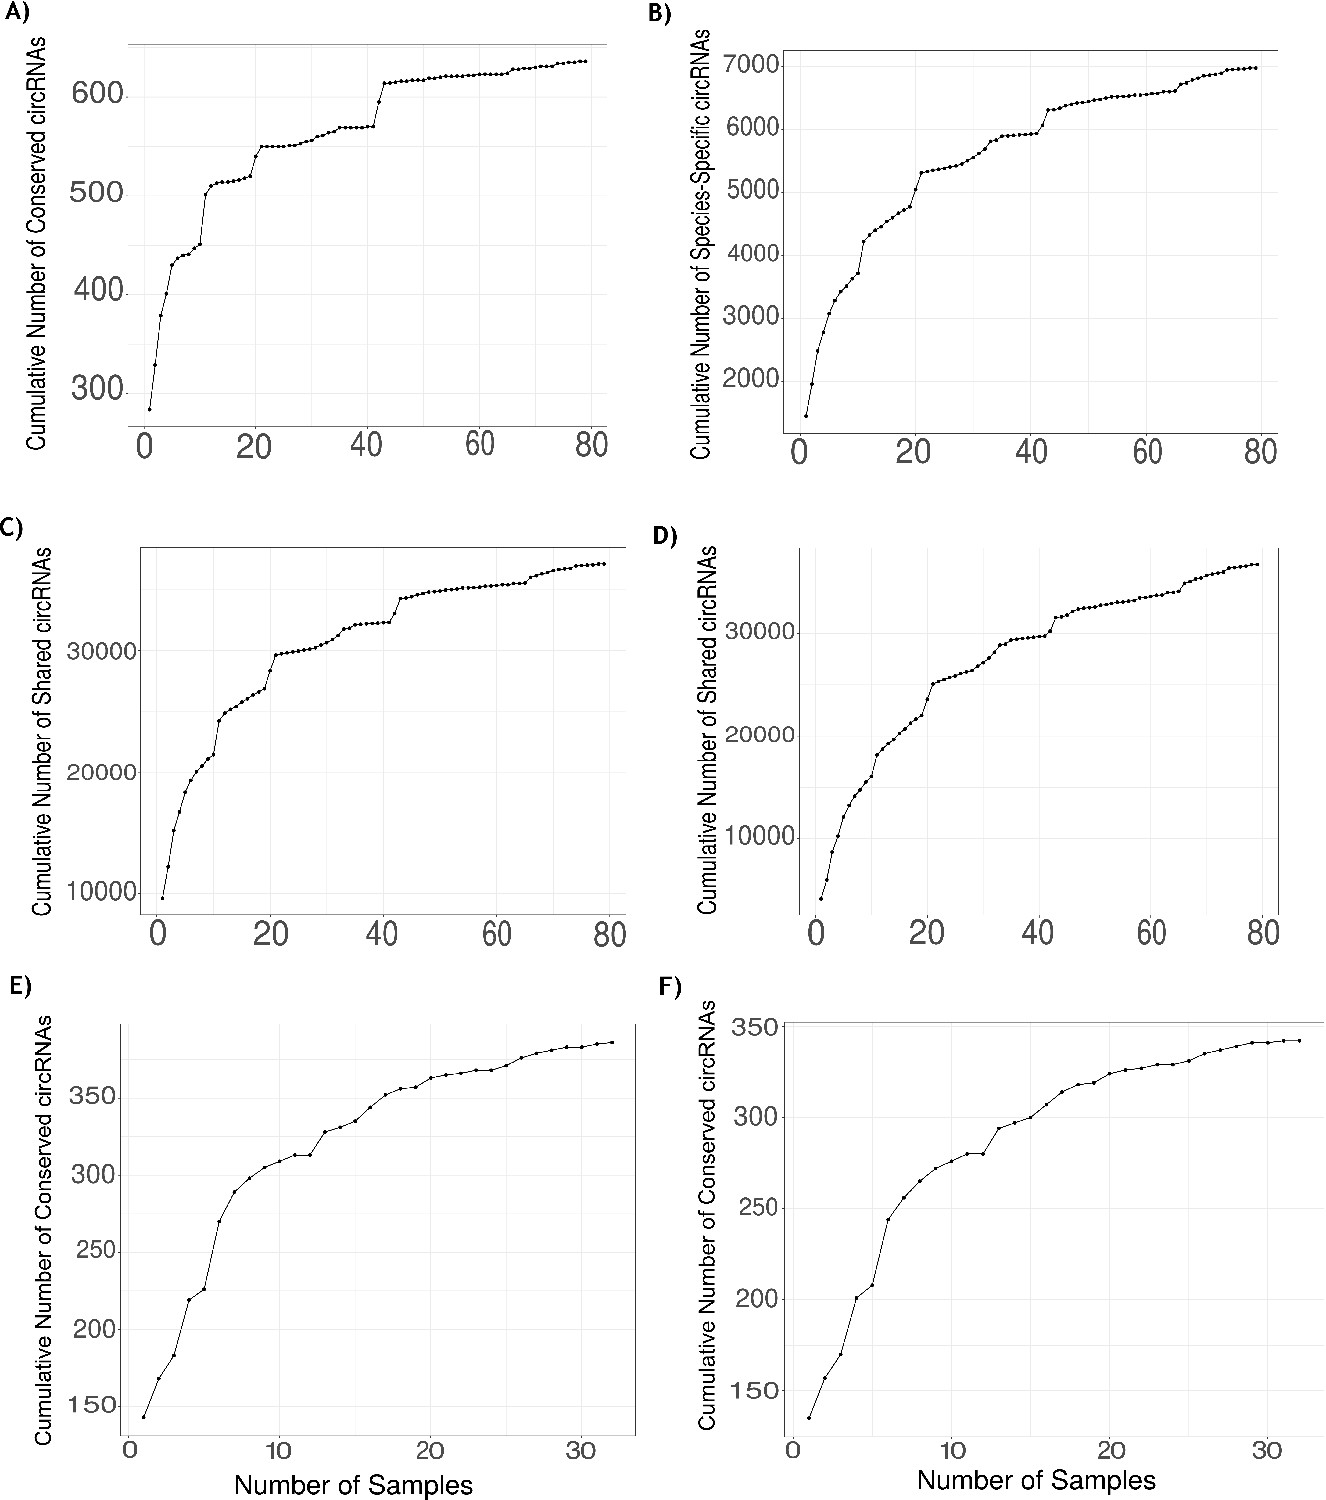
Validation of identified circRNAs using RNase R data.
(A) Plot showing the number of human RNase R samples analyzed (x-axis) and the sum of unique conserved circular RNAs (circRNAs) found across analyzed samples (y-axis). At the 74th sample, the highest number of conserved circRNAs is quantified (648 conserved circRNAs, 82.7%). (B) Plot showing the number of human RNase R samples analyzed (x-axis) and the sum of unique species-specific circRNAs found across analyzed samples (y-axis). At the 78th sample, the highest number of species-specific circRNA is quantified (7499 species-specific circRNAs, 62.3%). (C) A plot showing the comparison of the total number of human circRNAs found in the Rnase R dataset expressing at least five reads and with a percent spliced in (PSI) value ≥5 (57,037 circRNAs). Plot shows the number of human RNase R samples analyzed (x-axis) and the sum of unique circRNAs found in human dataset found across analyzed samples (y-axis). At the 78th sample, the highest number of human circRNAs is quantified (39,864 circRNAs, 69.9%). (D) A plot showing the comparison of the total number of human circRNAs found in the RNase R dataset with support of less than five reads and <5 PSI (71,820 circRNAs). Plot shows the number of human RNase R samples analyzed (x-axis) and the sum of unique circRNAs found in human dataset found across analyzed samples (y-axis). At the 78th sample, the highest number of human circRNAs is quantified (39,269 circRNAs, 54.7%). (E) Plot showing the number of macaque RNase R samples (x-axis) and the sum of unique conserved circRNAs in macaque quantified across samples (y-axis). At the 32nd sample, the highest number of conserved circRNAs is quantified (386 conserved circRNAs, 84.65%). (F) Plot showing the number of macaque RNase R samples (x-axis) and the sum of unique neuronal conserved circRNAs in macaque quantified across samples (y-axis). At the 31st sample, the highest number of neuronal conserved circRNAs is quantified (342 neuronal conserved circRNAs, 88.83%).
Figure 1—figure supplement 3
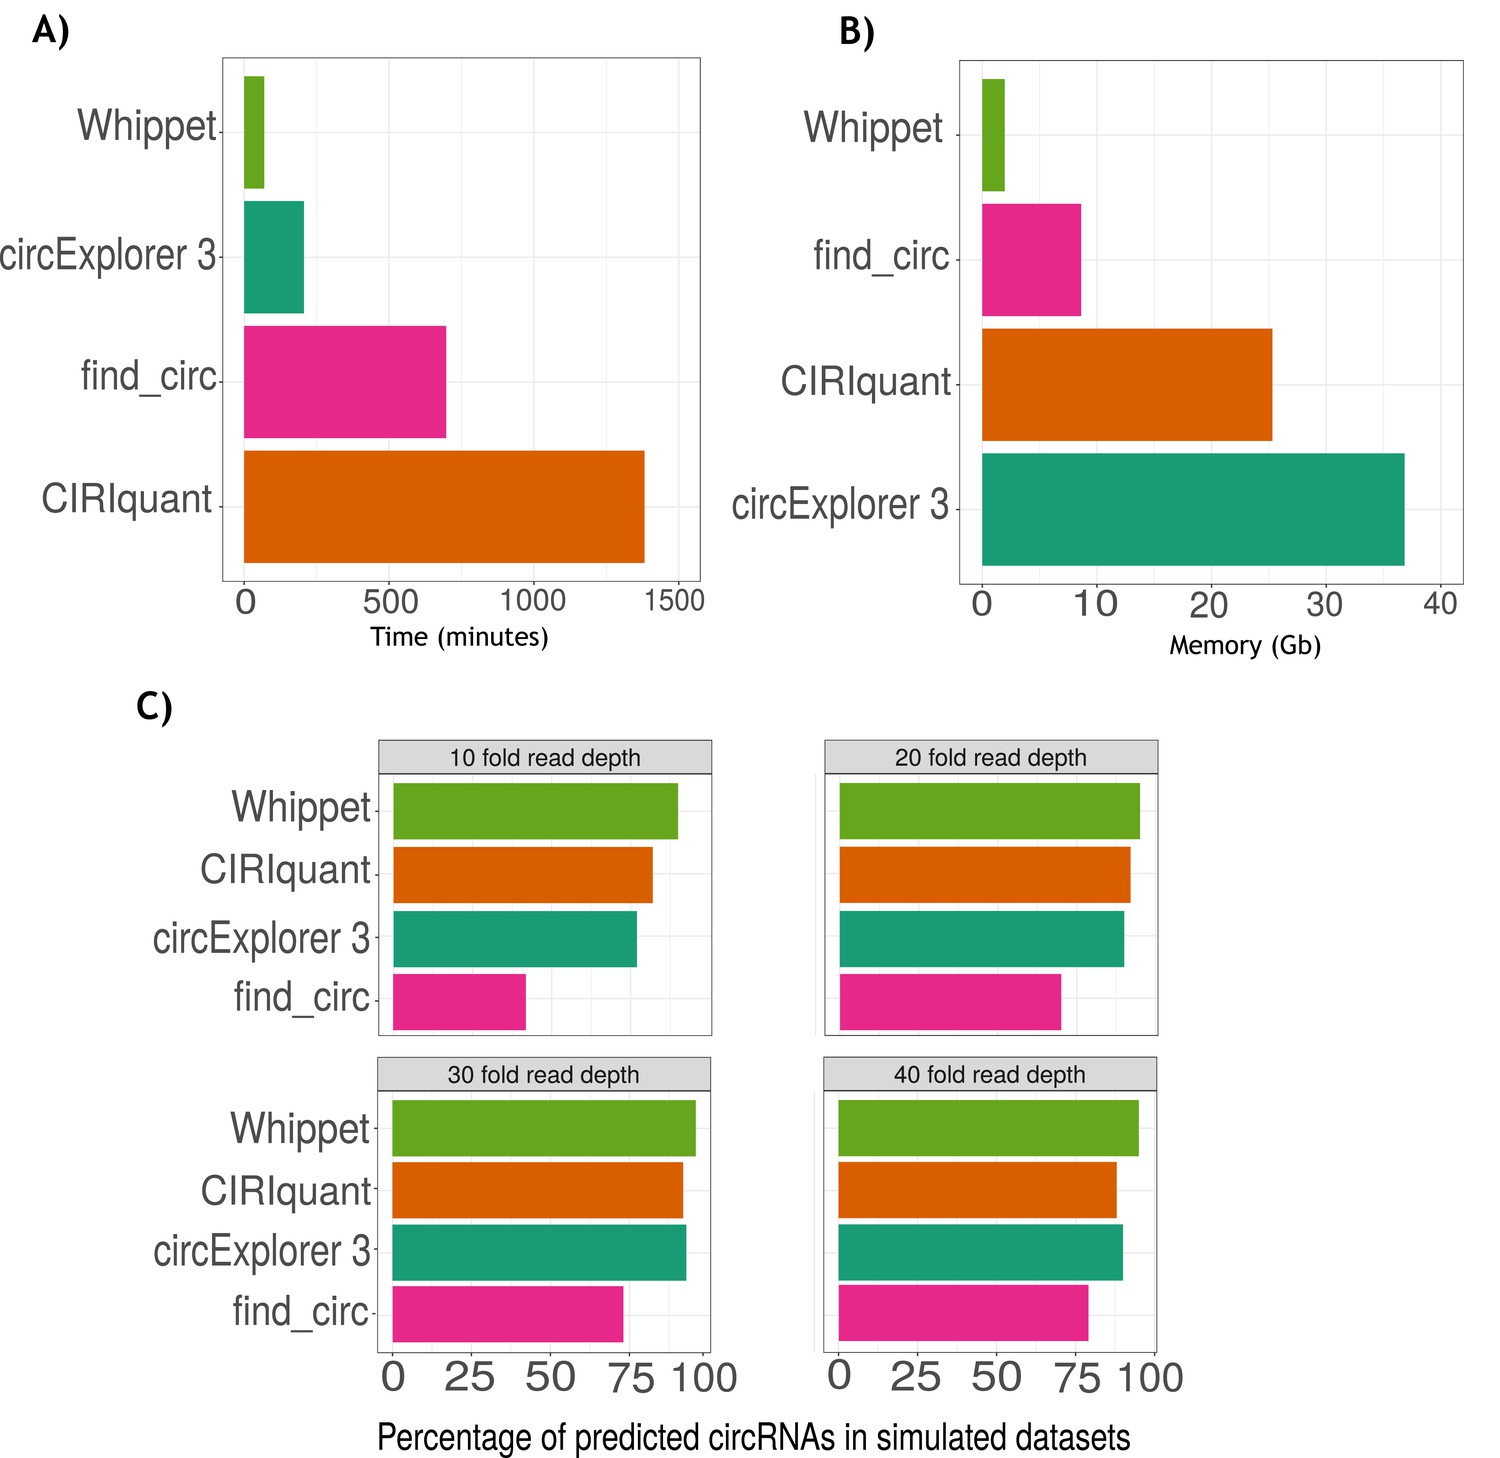
Benchmarking of Whippet for circRNA quantification.
(A) Barplot of computing time (measured in minutes) across circular RNA (circRNA) quantification programs (Whippet:1 hr 9 min and 20 s; CIRCexplorer3: 3 hr 26 min and 32 s; find_circ: 11 hr 31 min and 19 s; and CIRIquant: 23 hr 1 min and 36 s). (B) Barplot of computing memory(measured in Gbytes, Gb) across circRNA quantification programs (Whippet: 1.96 Gb; find_circ: 8.62 Gb; CIRIquant: 25.31 Gb; and CIRCexplorer3: 36.83 Gb). (C) Simulated dataset analysis. Barplots of percentages of circRNAs predicted by circRNA quantification programs (Whippet, CIRIquant, CIRCexplorer3, and find_circ) across different levels of sequencing depth in simulated datasets (10-, 20-, 30-, and 40-fold read depth). The x-axis is the percentage of predicted circRNAs and the y-axis is the names of the programs. At high depths, CIRCexplorer3 and CIRIquant had a similar rate of identification of circRNAs than Whippet. In contrast, at lower read depths circExoplorer 3 detection rate lowers to 77% and CIRIquant detection rate lowers to 82%. Find_circ detection rate was the most affected by the sequencing depth with a detection rate of 42% in the low read depth sample and 79% in the highest sequencing depth sample.
Figure 2 with 4 supplements
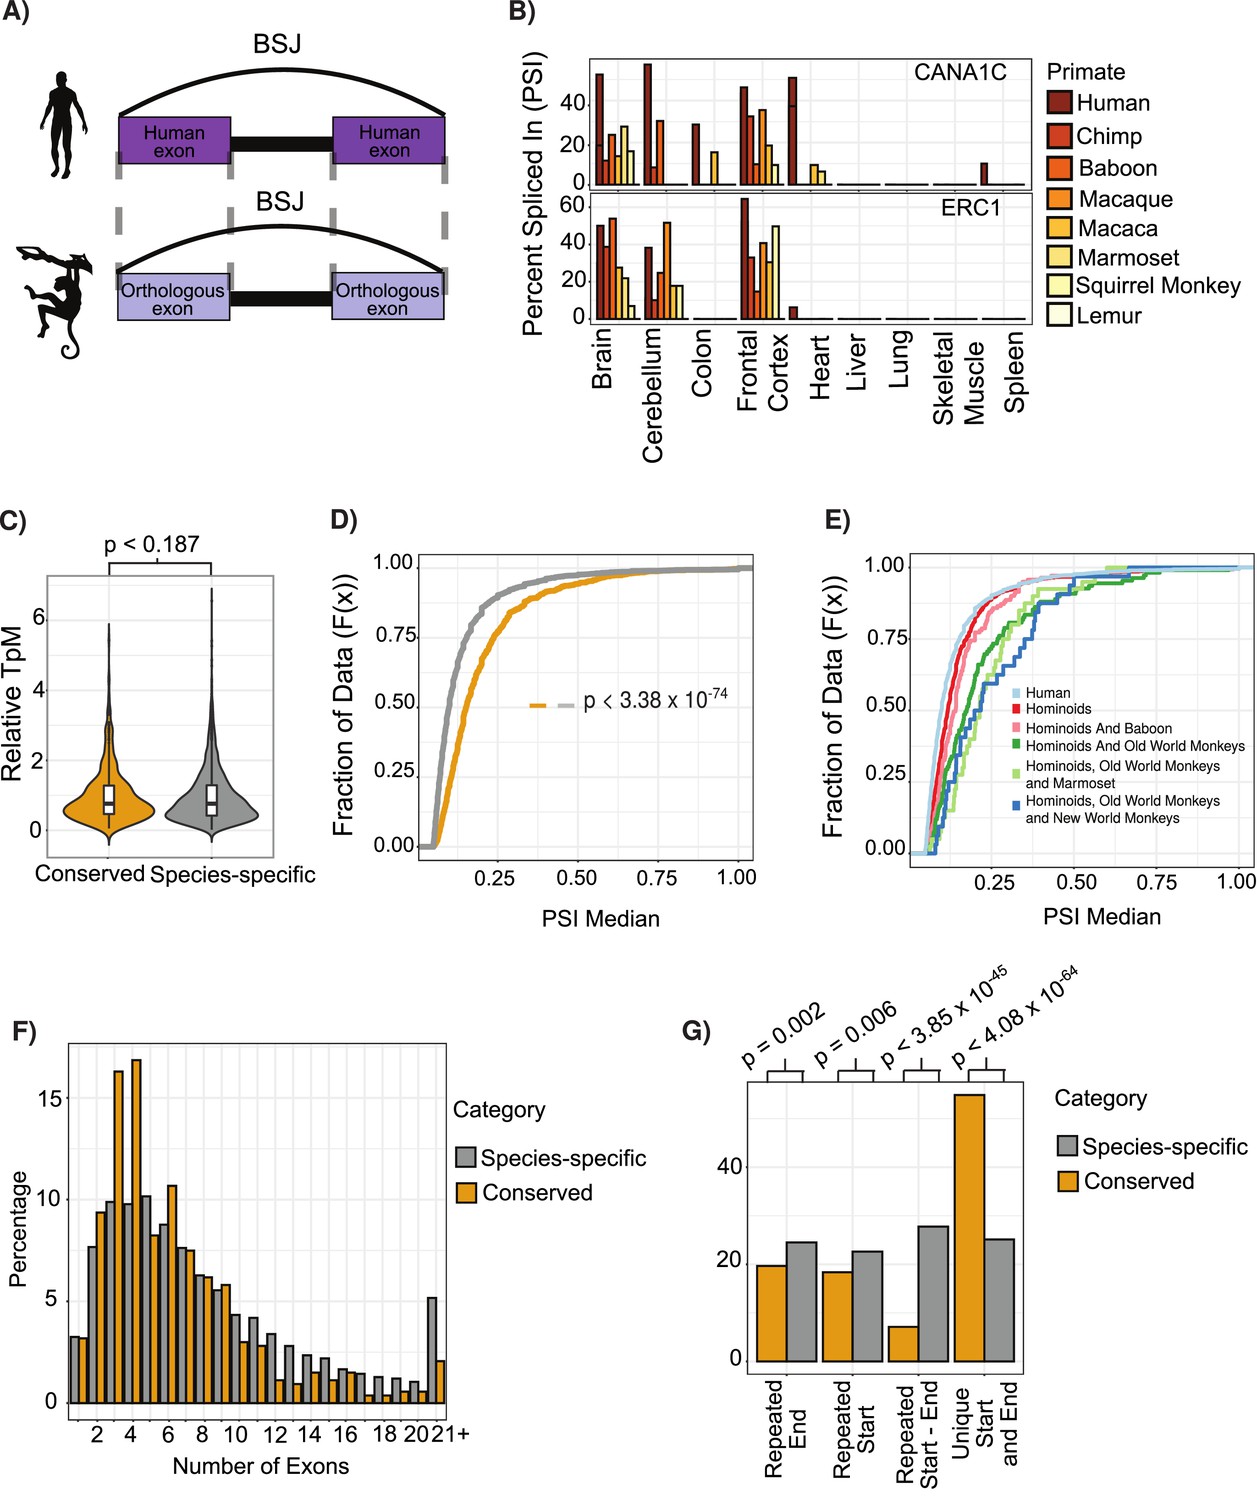
Features of conserved circular RNAs (circRNAs).
(A) Schematic overview of identification of back-spliced junctions (BSJ) between species. (B) Percent spliced in (PSI) values for conserved circRNAs (top) CACNA1C_chr12:2504436–2512984 and (bottom) ERC1_chr12:1180540–1204512 across tissues and species analyzed. PSI values only calculated for circRNAs with more than five reads support. Gene name is indicated in top right-hand corner. (C) Violin plot describing relative expression levels of conserved and species-specific circRNAs. Violin plots show probability densities of the data with internal boxplot. Boxplot displays the interquartile range as a solid box, 1.5 times the interquartile range as vertical thin lines and the median as a horizontal line. p-Value calculated using Wilcoxon rank-sum test (p<0.187). TpM: transcripts per million. (D) Cumulative distribution plot of change in PSI values across all conserved (yellow) and species-specific (gray) circRNAs. A cumulative distribution plot describes the proportion of data (y-axis) less than or equal to a specified value (x-axis). Cumulative distribution F(x), cumulative distribution function. p-Value calculated using Wilcoxon rank-sum test (p<3.38 × 10–74). (E) Cumulative distribution plots of circRNAs with different levels of conservation, as defined by consistent observation of BSJ across species indicated. See (D) for description of cumulative distribution plot. (F) Barplot describing number of exons per circRNA for conserved and species-specific circRNAs. Exons are defined by Ensembl and must show evidence of expression (PSI >5 and > 5 reads support) in tissue analyzed. (G) Barplot describing uniqueness of start (5′-splice site) and end (3′-splice site) for conserved and species-specific circRNAs. p-Values calculated from Fisher’s exact test (p<4.08 × 10-64;; unique start and end – also see Figure 2—figure supplement 3).
Figure 2—figure supplement 1
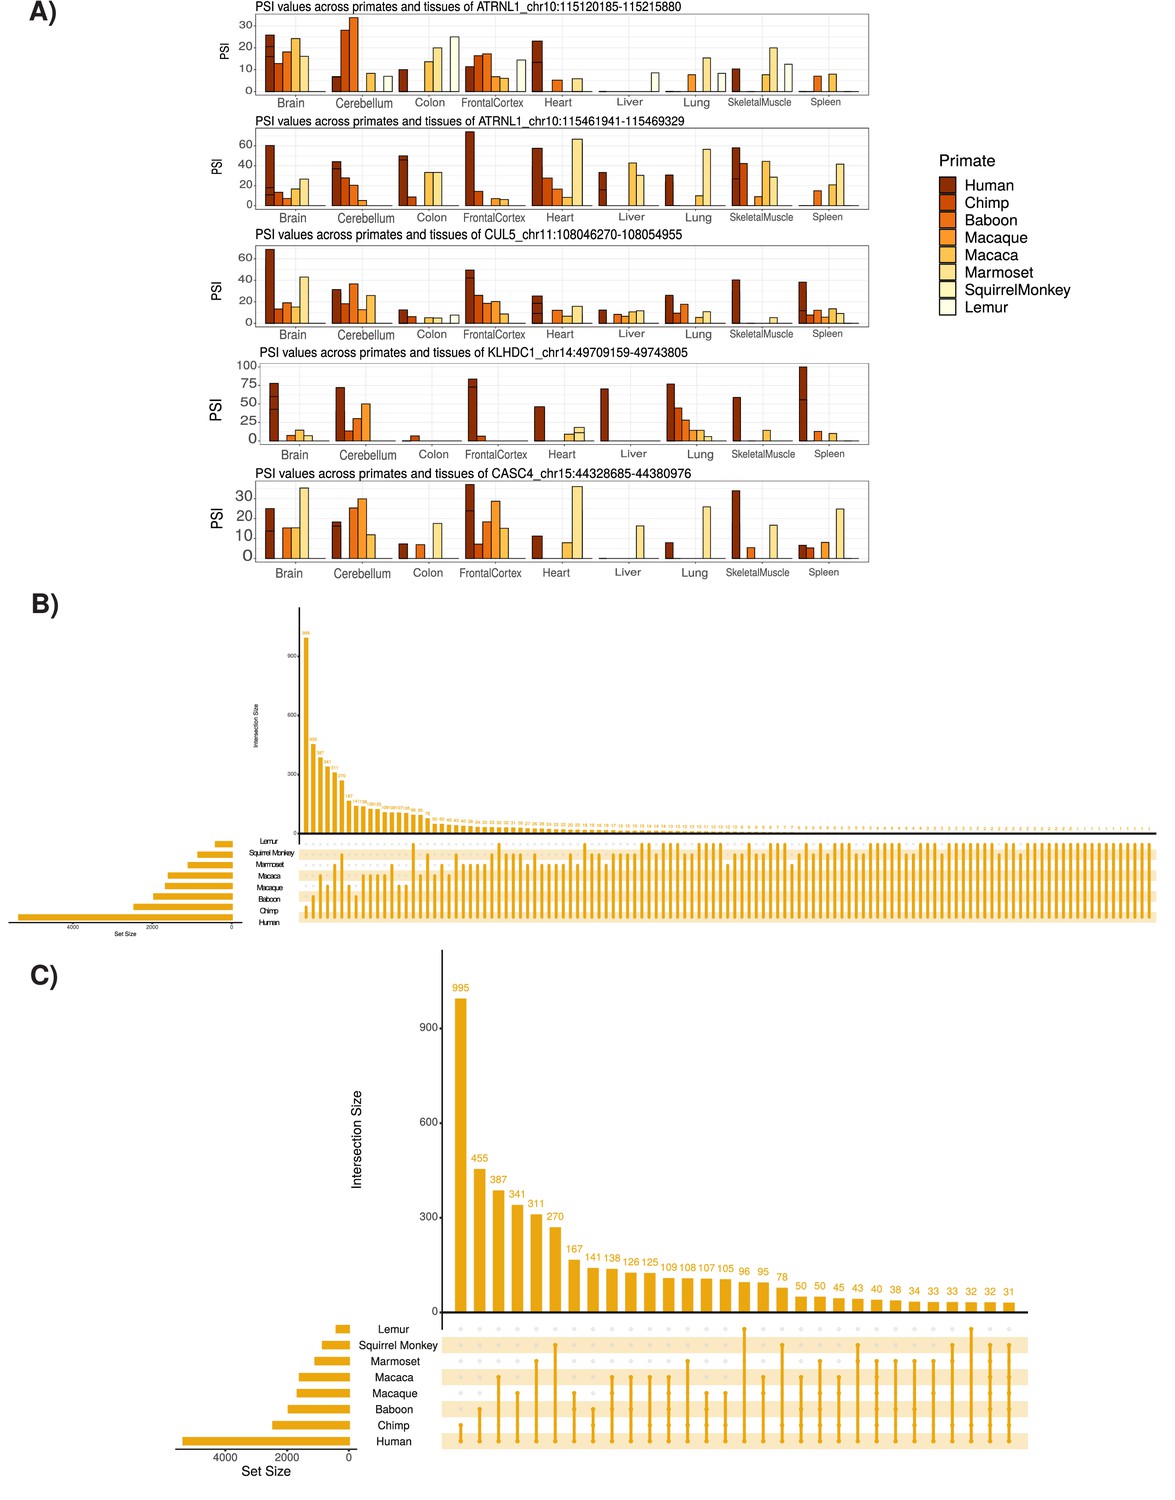
Tissue-specific expression and conservation of circRNAs across primates species.
(A) Extension of Figure 2B showing examples of identified circular RNAs (circRNAs). Coordinates for each circRNA are shown. PSI: percent spliced in. (B) UpSet plot of conserved circRNAs across primate species analyzed. An UpSet plot displays the intersections of a set. Each column corresponds to a set, and each row corresponds to one segment in a Venn diagram. Number of top of bars represents number in each overlap. The limited conservation of circRNAs to lemur may be influenced by low read depth of these samples (see Supplementary file 1). (C) UpSet plot of conserved circRNAs across primate species studied with at least 30 overlap (see B for description of UpSet plot).
Figure 2—figure supplement 2
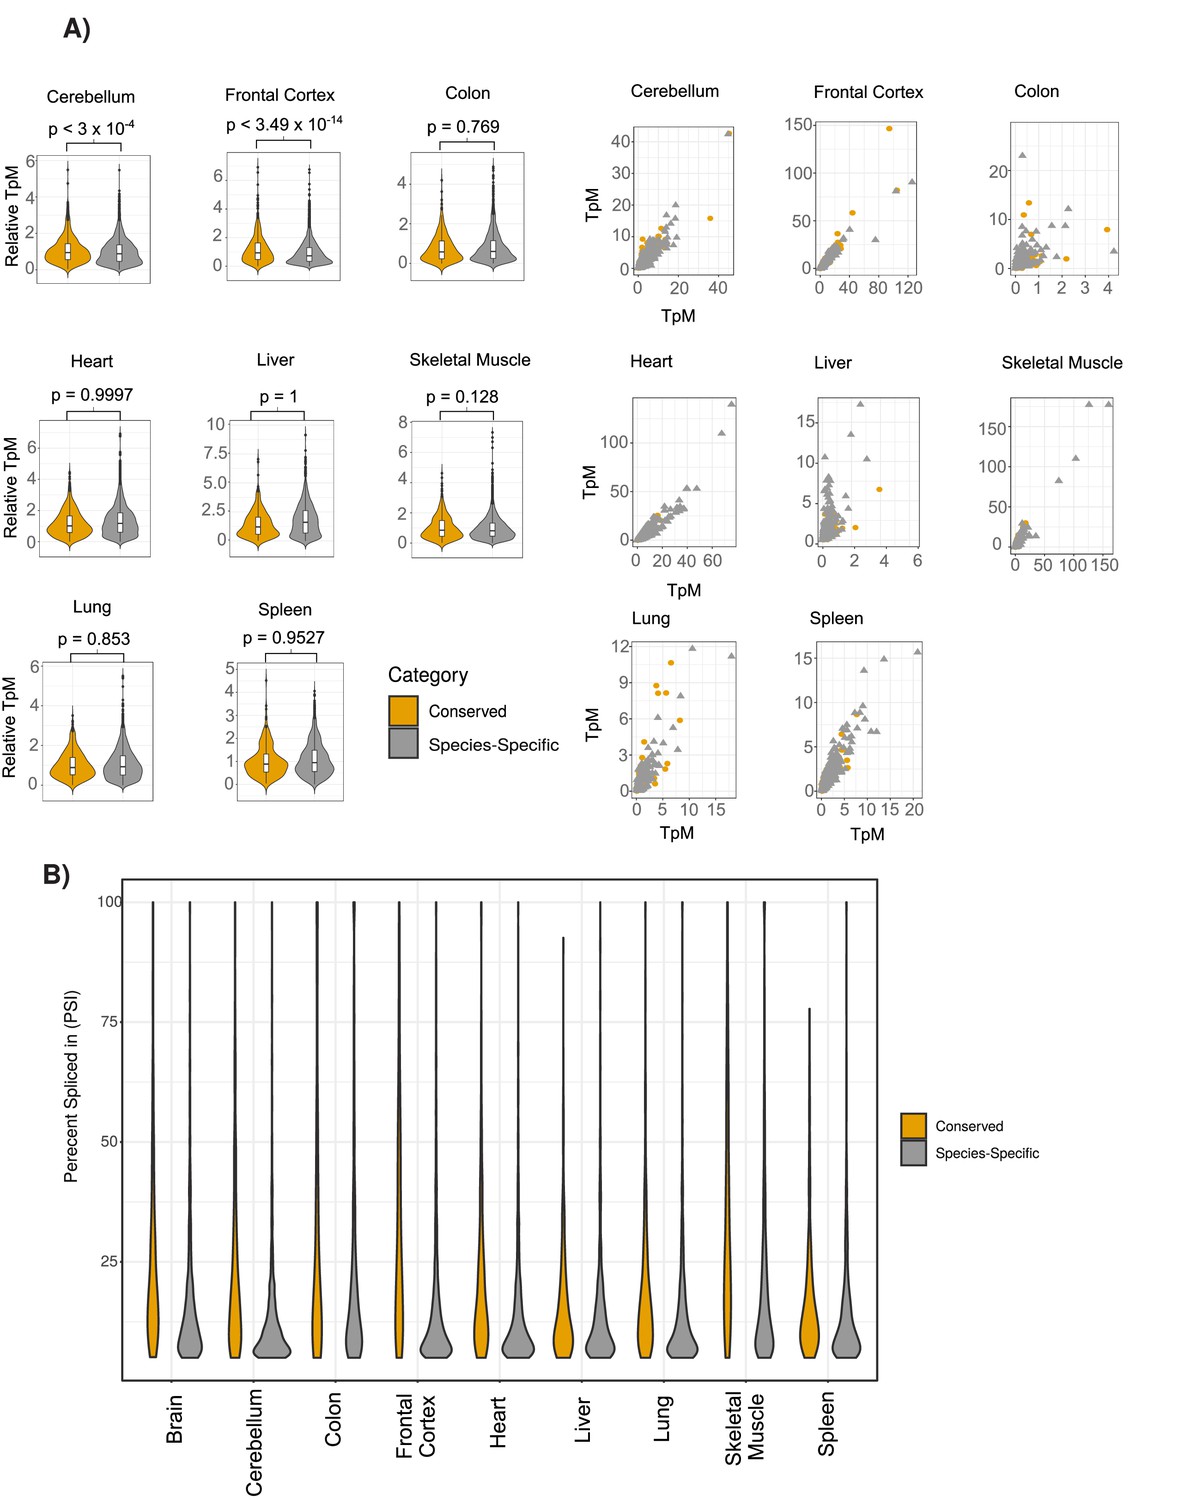
Comparison of the expression of conserved and species-specific circRNAs across tissues samples.
(A) Extension of Figure 2C showing violin plots (left) and scatterplots (right) across all human tissues. Axes on scatterplots are relative transcripts per million (TpM) values. (see Materials and methods). p-Value is calculated using Wilcoxon rank-sum test. (see Figure 2C for description of violin plots). (B) Extension of Figure 2D showing violin plots of percent spliced in (PSI) value differences across all individual tissues (see Figure 2C for description of violin plots).
Figure 2—figure supplement 3
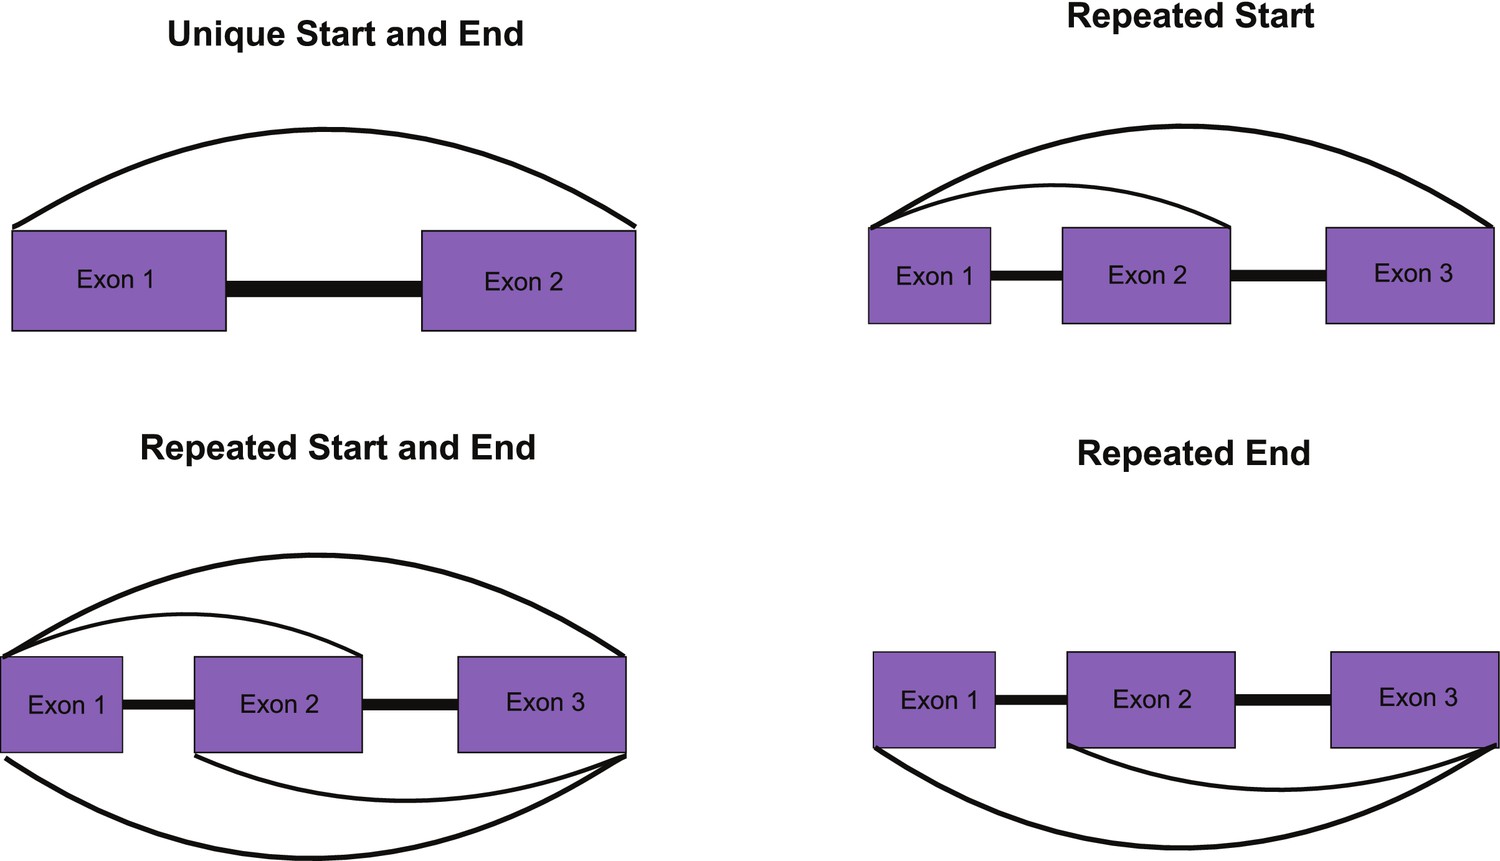
Overview of approach to identifying unique circular RNAs (circRNAs) for Figure 2G (see Materials and methods for details).
Figure 2—figure supplement 4
Comparison of gene expression distribution of genes containing conserved and species-specific circRNAs across tissues samples.
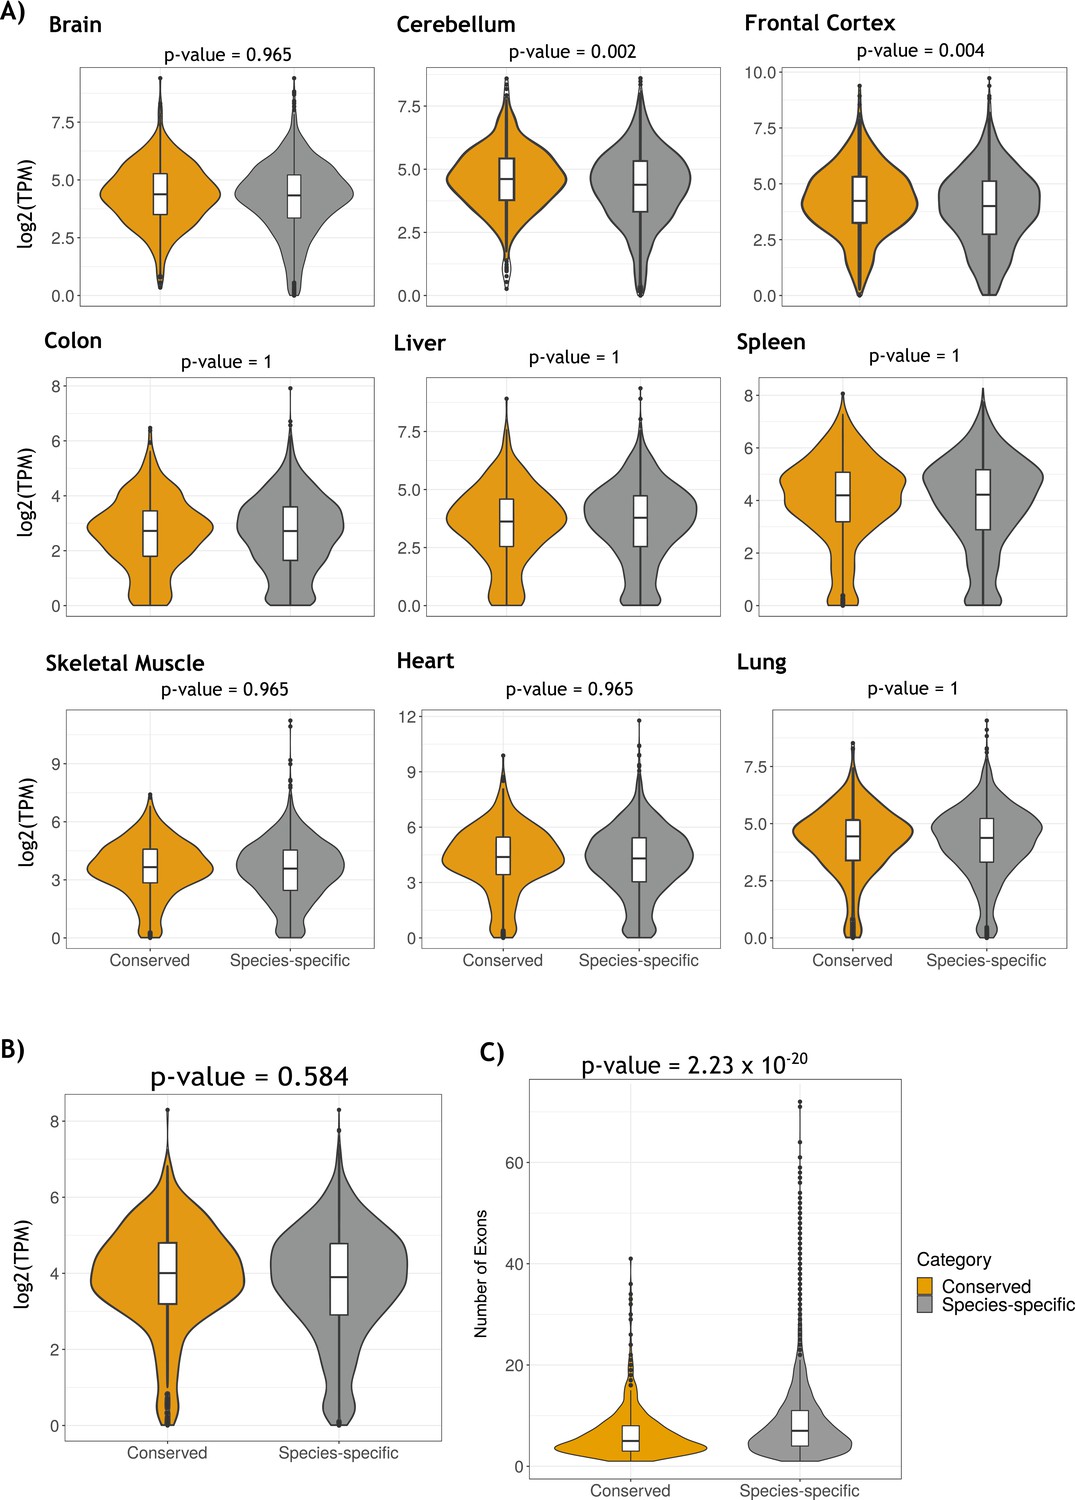
(A) Violin plots showing the distributions of gene expression of genes with conserved (yellow) and species-specific (gray) circular RNAs (circRNAs) across tissue samples. Gene expression is measured in log2(TPM). Differences in gene expression were statistically tested using the Wilcoxon rank-sum test for each tissue comparison. (B) Violin plots showing the distributions of median gene expression of tissue samples of genes with conserved (yellow) and species-specific (gray) circRNAs. Gene expression is measured in log2(TPM). The difference in gene expression was statistically tested using the Wilcoxon rank-sum test. (C) Violin plots describing the number of exons of conserved and species-specific circRNAs. Comparison of number of exons distributions was done using the Wilcoxon rank-sum test.
Figure 3 with 1 supplement
Characterization of cis- and trans-regulatory features of conserved circular RNAs (circRNAs).
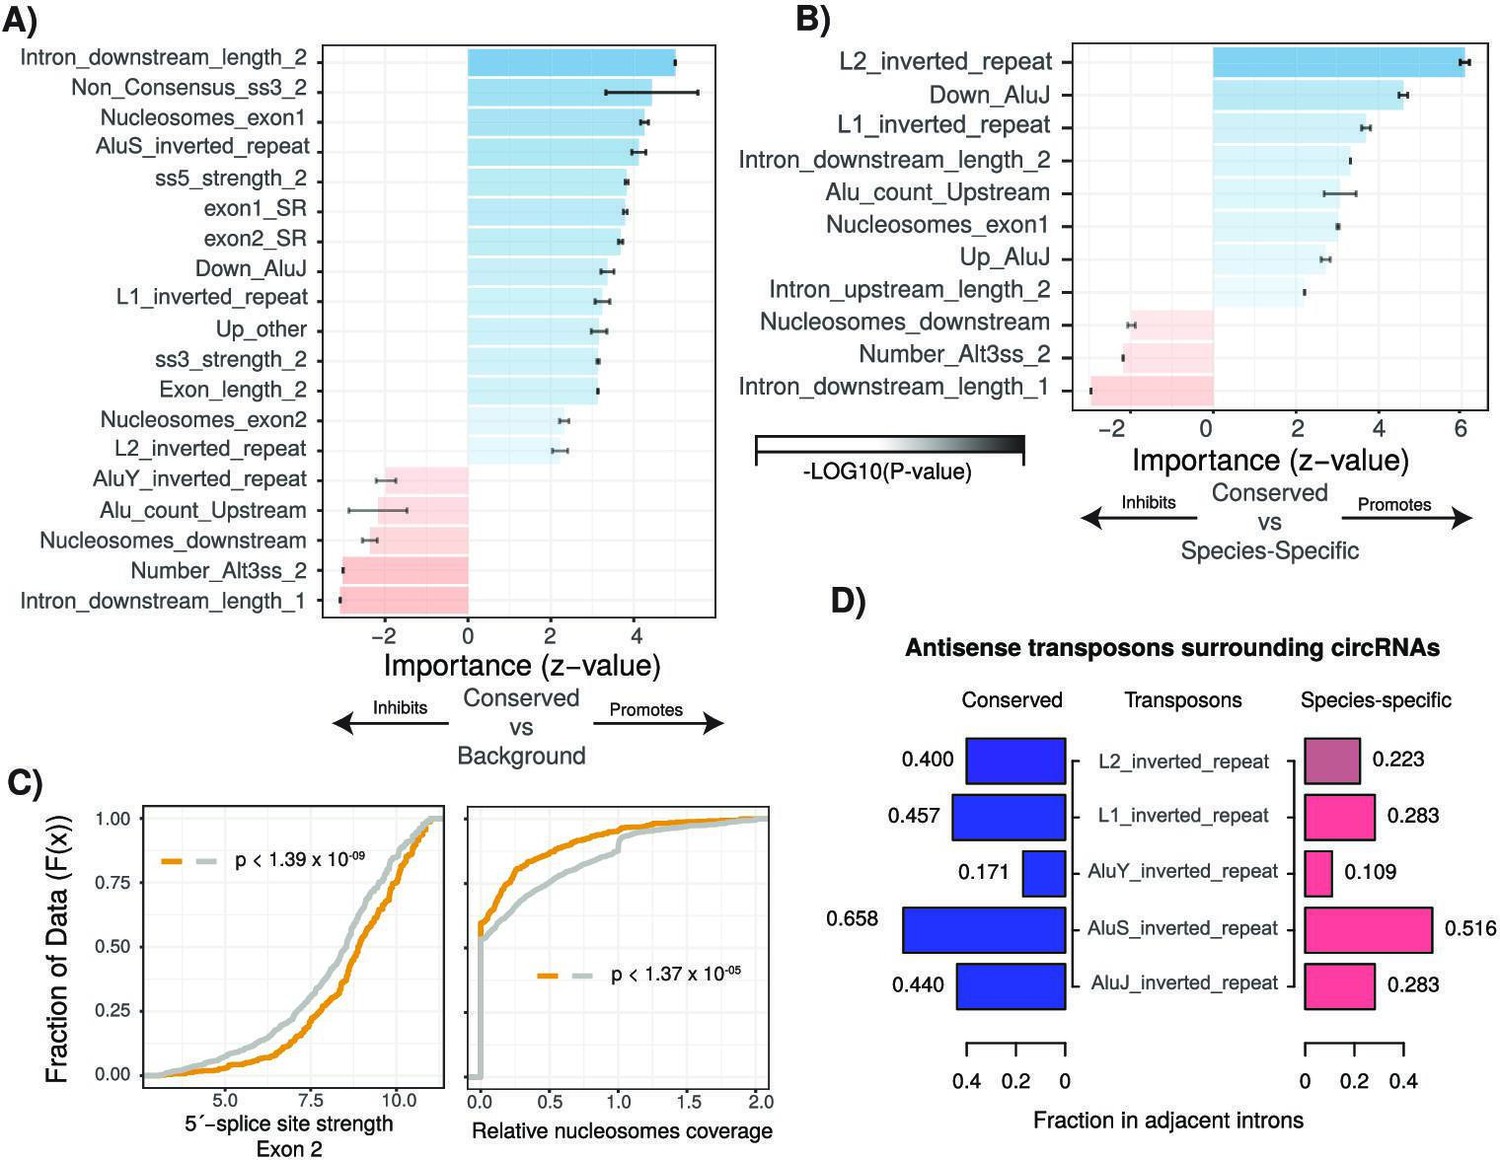
(A) Barplot describing feature importance for logistic regression model of conserved circRNAs compared to background. Colors represent positive or negative influence. Transparency reflects log10(p-value of z-statistic). Error bars represent standard error. ‘_1’ is relative to first exon of circRNA and ‘_2’ is relative to final exon of circRNA. ss3: 3´-splice site; ss5: 5´-splice site; Alt3ss: alternative 3´-splice sites. Inverted repeats are repetitive elements on opposite strands in introns adjacent to circRNAs. See Supplementary file 3 for details of features. (B) Barplot describing feature importance for logistic regression model of conserved circRNAs compared to species-specific circRNAs. See (A) for plot interpretation and descriptions. (C) Cumulative distribution plots describing (left; p<1.39 × 10–09) 5´-splice site strength at final exon of circRNAs and (right; p<1.37 × 10–05) distribution of nucleosomes on intron downstream of circRNA. p-Values calculated by Wilcoxon rank-sum test and corrected for multitesting (Bonferroni). See Figure 2D for interpretation of cumulative distribution plot. (D) Pyramid plot showing the mean fraction of circRNAs with selected inverted repeat retrotransposon elements in adjacent introns.
Figure 3—figure supplement 1
Performance assessment of logistic regression model.
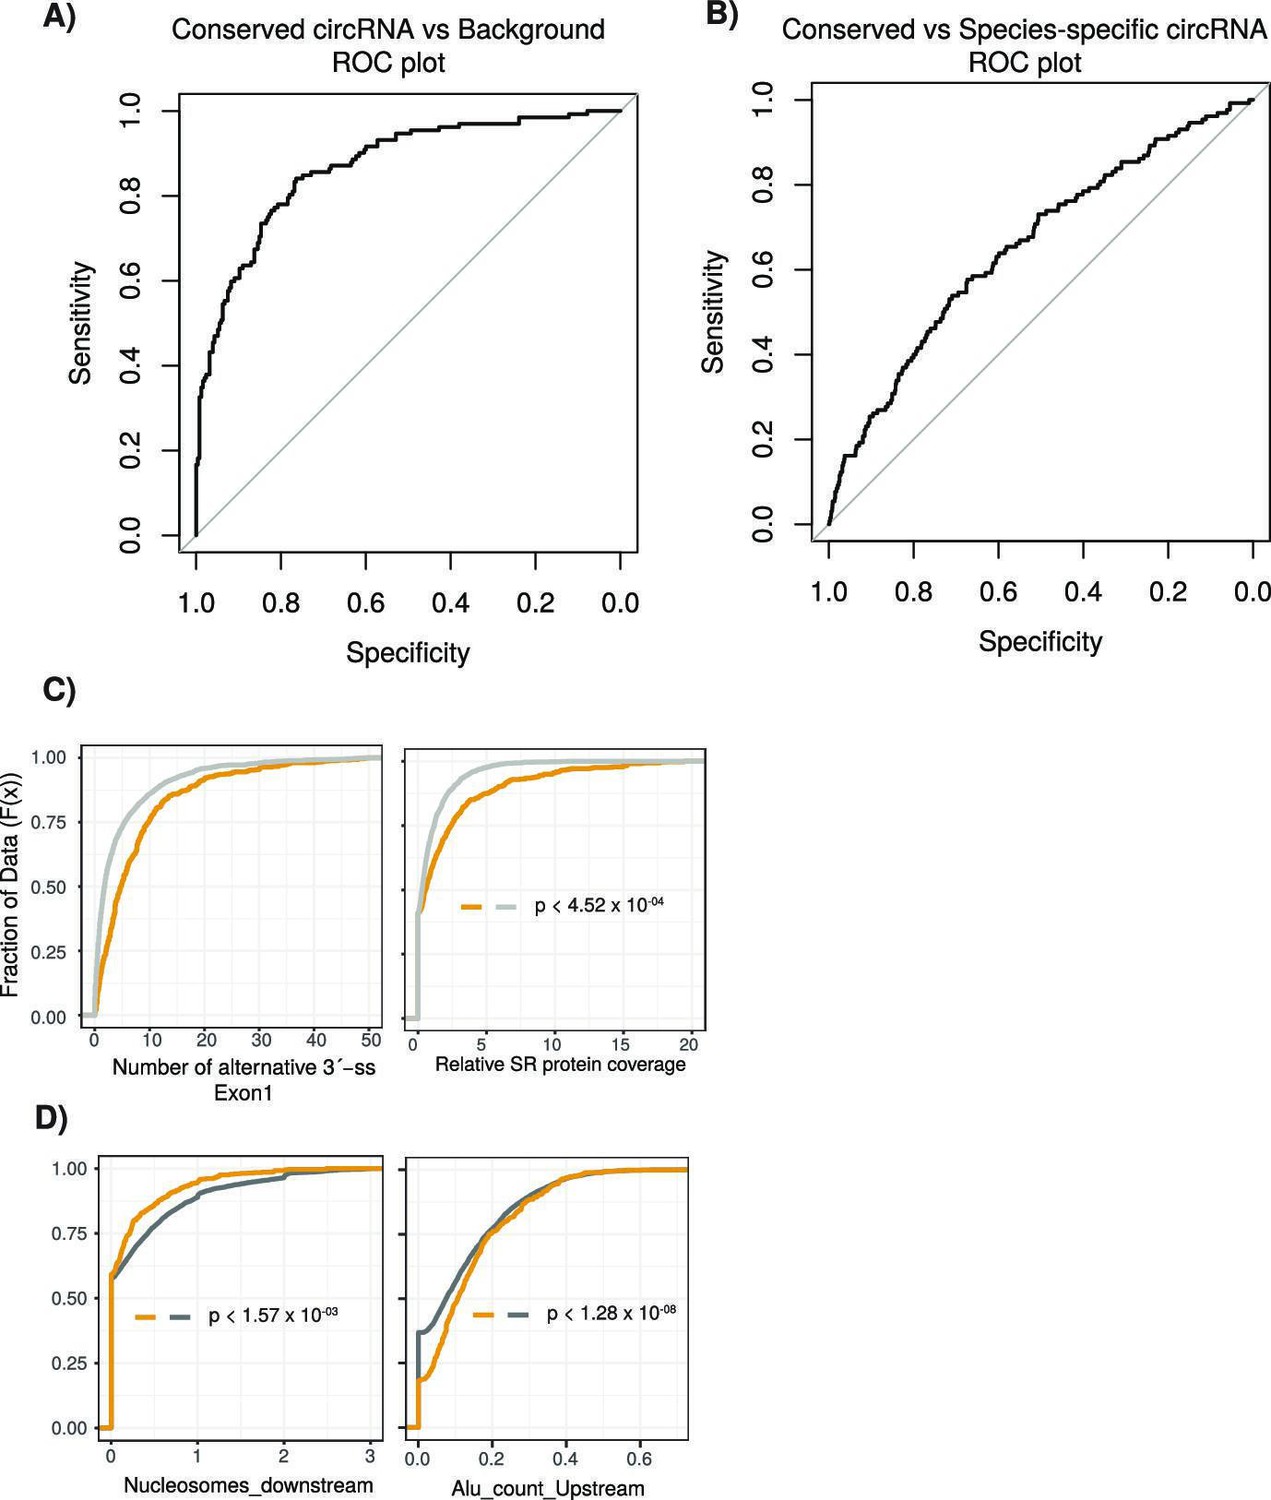
(A) A receiving operating characteristic curve (ROC) plot displaying the sensitivity (true-positive rate) compared to the selectivity (false-positive rate) for the logistic regression model (conserved vs. background circular RNA [circRNA]). (B) An ROC plot for logistic regression model (conserved vs. species-specific circRNA). (C) Cumulative distribution plots comparing conserved versus background circRNAs of (left) alternative 3´-splice sites (ss) within first exon of the circRNA and (right) of serine/arginine (SR) RNA-binding peaks from CLiP data. p-Values calculated by Wilcoxon rank-sum test and corrected for multitesting (Bonferroni) (see Figure 2D for description of cumulative distribution plots). (D) Cumulative distribution plots comparing conserved versus species-specific circRNAs of (left) nucleosome peaks in downstream intron adjacent to circRNA and (right) of Alu element content in upstream intron adjacent to circRNA (see Figure 2D for description of cumulative distribution plots). p-Values calculated by Wilcoxon rank-sum test and corrected for multitesting (Bonferroni).
Figure 4 with 1 supplement
Conserved circular RNA (circRNA) downstream intron expanded during primate evolution.
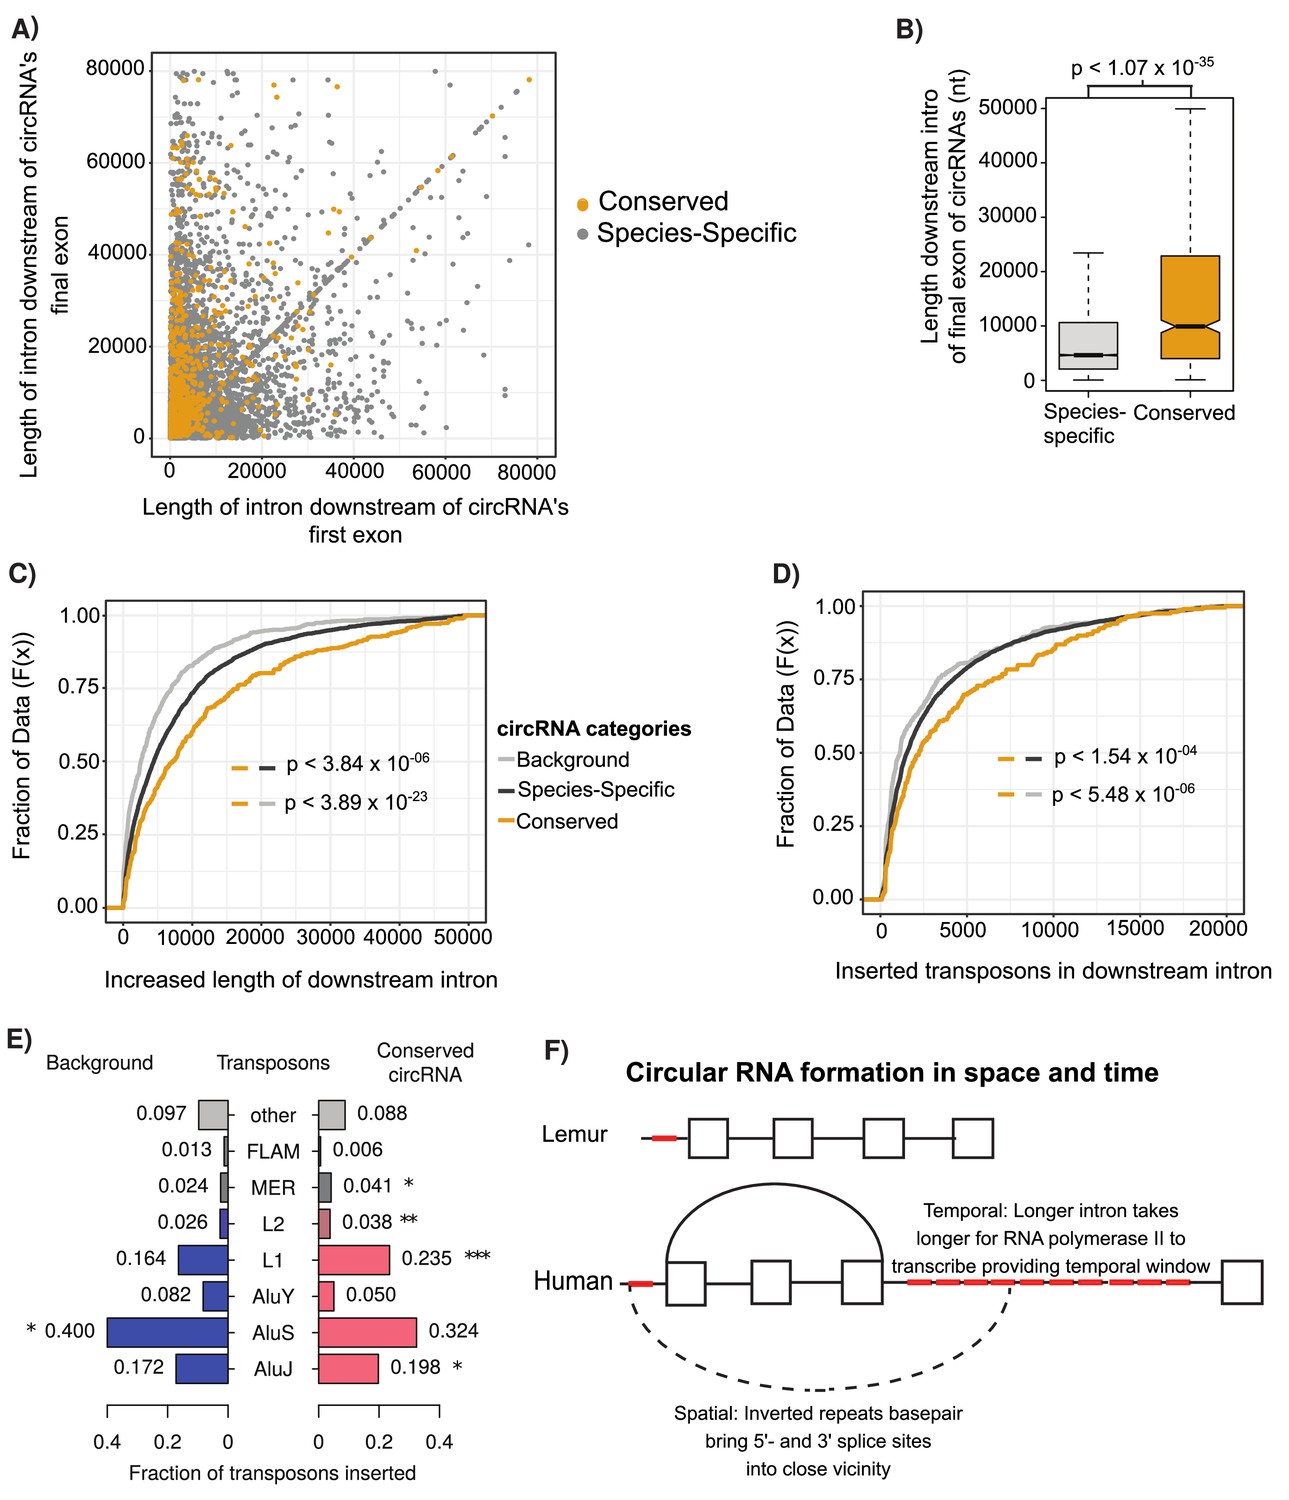
(A) Scatterplot of downstream intron length for conserved and species-specific circRNAs. (B) Boxplot describing lengths of intron immediately downstream of circRNA for conserved and species-specific circRNAs (see Figure 2C for description of boxplots). p-Values calculated by Wilcoxon rank-sum test and corrected for multitesting (Bonferroni). nt: nucleotide (C) Cumulative distribution plot of change of length of orthologous downstream introns of conserved, species-specific and background circRNAs from lemur to human (see Figure 2D for description of cumulative distribution plots). p-Values calculated by Wilcoxon rank-sum test and corrected for multitesting (Bonferroni). (D) Cumulative distribution plot of length of novel repeat elements within the orthologous downstream introns of conserved, species-specific and background circRNAs from lemur to human (see Figure 2D for description of cumulative distribution plots). p-Values calculated by Wilcoxon rank-sum test and corrected for multitesting (Bonferroni). (E) Pyramid plot of the proportion of repeat elements inserted into the downstream introns of conserved, species-specific and background circRNAs from lemur to human. *p<0.05; **p<0.005, ***p<1 × 10⁻⁵. p-Values calculated by Wilcoxon rank-sum test and corrected for multitesting (Bonferroni). (F) A schematic model of the results describing impact of our observations on circRNA formation. Boxes represent exons, straight lines are introns, repeat elements are red, arced lines represent back-spliced junction, and dashed lines represent RNA-RNA duplex.
Figure 4—figure supplement 1
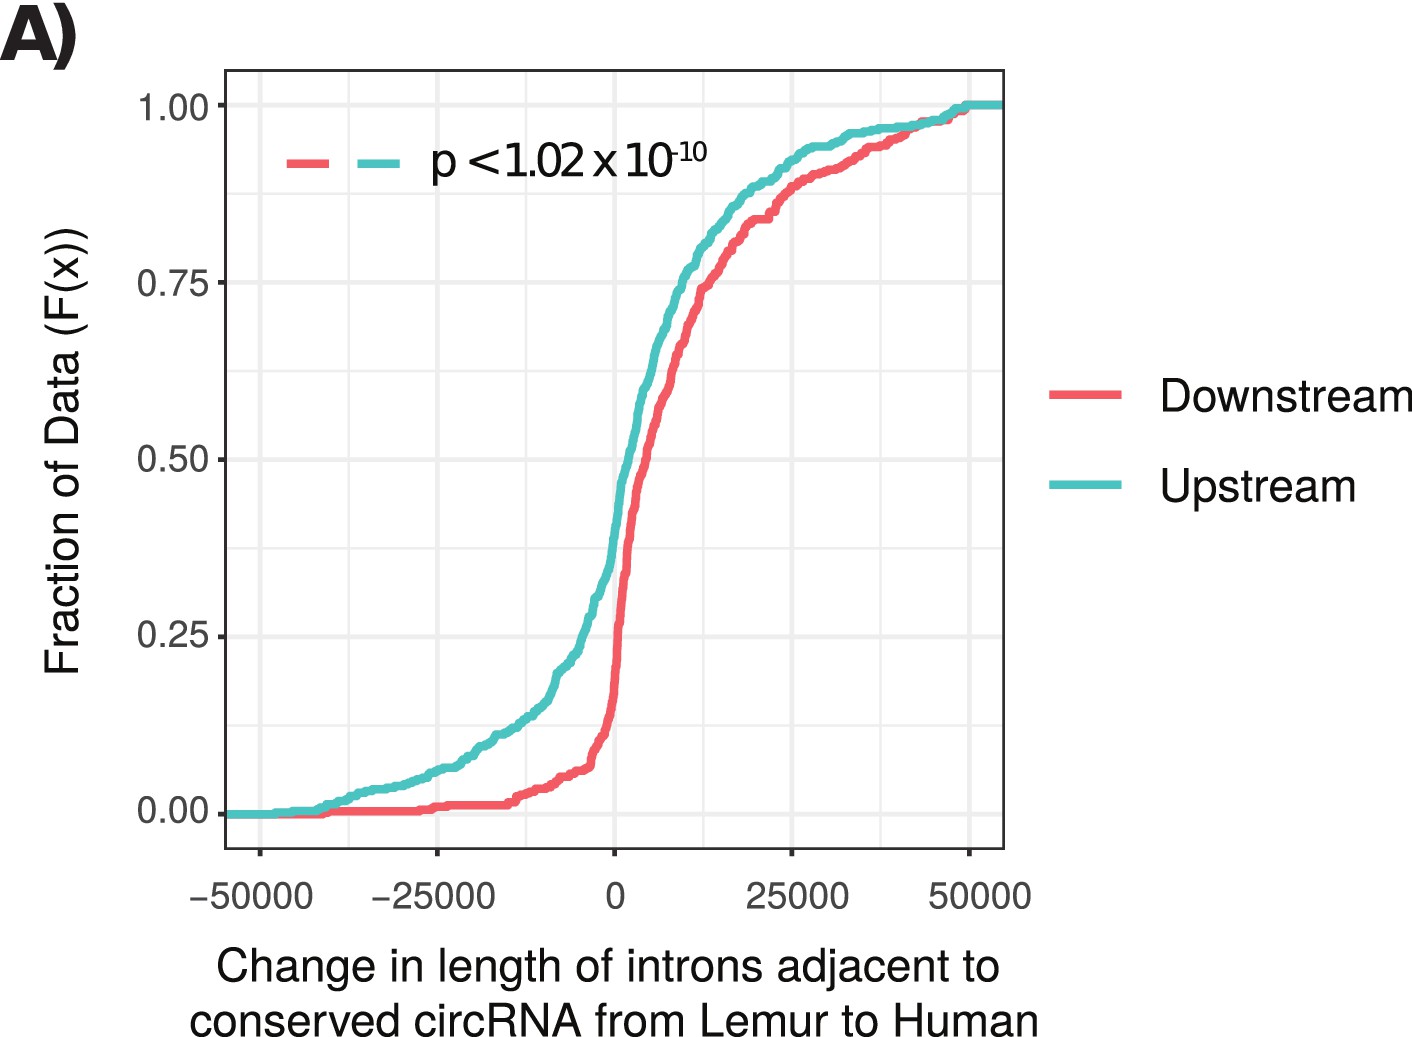
Cumulative distribution plot of length of introns adjacent to conserved circRNAs.
(A) Cumulative distribution of length of introns adjacent to conserved circular RNAs (circRNAs) from lemur to human. Cumulative distribution of length of downstream (red) and upstream (cyan) introns from conserved circRNAs. p-Values calculated by Wilcoxon rank-sum test.
Author response image 1

Conserved and species-specific circRNAs expression distributions.
Violin plots describing relative expression levels of conserved and species-specific circRNAs. circRNA expression is measured in Relative TpM values. The difference in circRNA expression was statistically tested using the Wilcoxon rank-sum test.
Author response image 2

Feature selection linear regression analysis according to circRNAs expression binsPlot showing the ranking of significance assigned by the linear regression model to features analyzed (y-axis) across the different groups of circRNA expression (high, medium and, low; x-axis).
Additional files
-
Supplementary file 1
Dataset IDs and sequencing depth information.
- https://cdn.elifesciences.org/articles/69148/elife-69148-supp1-v2.csv
-
Supplementary file 2
Non-conserved (human-specific) and background circular RNAs.
- https://cdn.elifesciences.org/articles/69148/elife-69148-supp2-v2.csv
-
Supplementary file 3
Associated with circular RNA formation (trans- and cis-regulatory factors and all major groups of transposons).
- https://cdn.elifesciences.org/articles/69148/elife-69148-supp3-v2.tsv
-
Supplementary file 4
Specific circular RNAs.
- https://cdn.elifesciences.org/articles/69148/elife-69148-supp4-v2.csv
-
Supplementary file 5
About merged samples to acquire higher sequencing depth.
- https://cdn.elifesciences.org/articles/69148/elife-69148-supp5-v2.csv
-
Supplementary file 6
Version, GTF, and chain file information.
- https://cdn.elifesciences.org/articles/69148/elife-69148-supp6-v2.csv
-
Supplementary file 7
Output.
- https://cdn.elifesciences.org/articles/69148/elife-69148-supp7-v2.tsv
-
Transparent reporting form
- https://cdn.elifesciences.org/articles/69148/elife-69148-transrepform1-v2.pdf
Download links
A two-part list of links to download the article, or parts of the article, in various formats.
Downloads (link to download the article as PDF)
Open citations (links to open the citations from this article in various online reference manager services)
Cite this article (links to download the citations from this article in formats compatible with various reference manager tools)
Evolutionary dynamics of circular RNAs in primates
eLife 10:e69148.
https://doi.org/10.7554/eLife.69148


