GIV/Girdin, a non-receptor modulator for Gαi/s, regulates spatiotemporal signaling during sperm capacitation and is required for male fertility
- Department of Pathology, School of Medicine, University of California San Diego, United States
- Department of Cellular and Molecular Medicine, School of Medicine, University of California San Diego, United States
- Department of Medicine, School of Medicine, University of California San Diego, United States
- Department of Computer Science and Engineering, Jacob’s School of Engineering, University of California San Diego, United States
- Moore’s Comprehensive Cancer Center, University of California San Diego, United States
- Department of Pediatrics, School of Medicine, University of California San Diego, United States
- Veterans Affairs Medical Center, United States
Figures
Figure 1 with 2 supplements
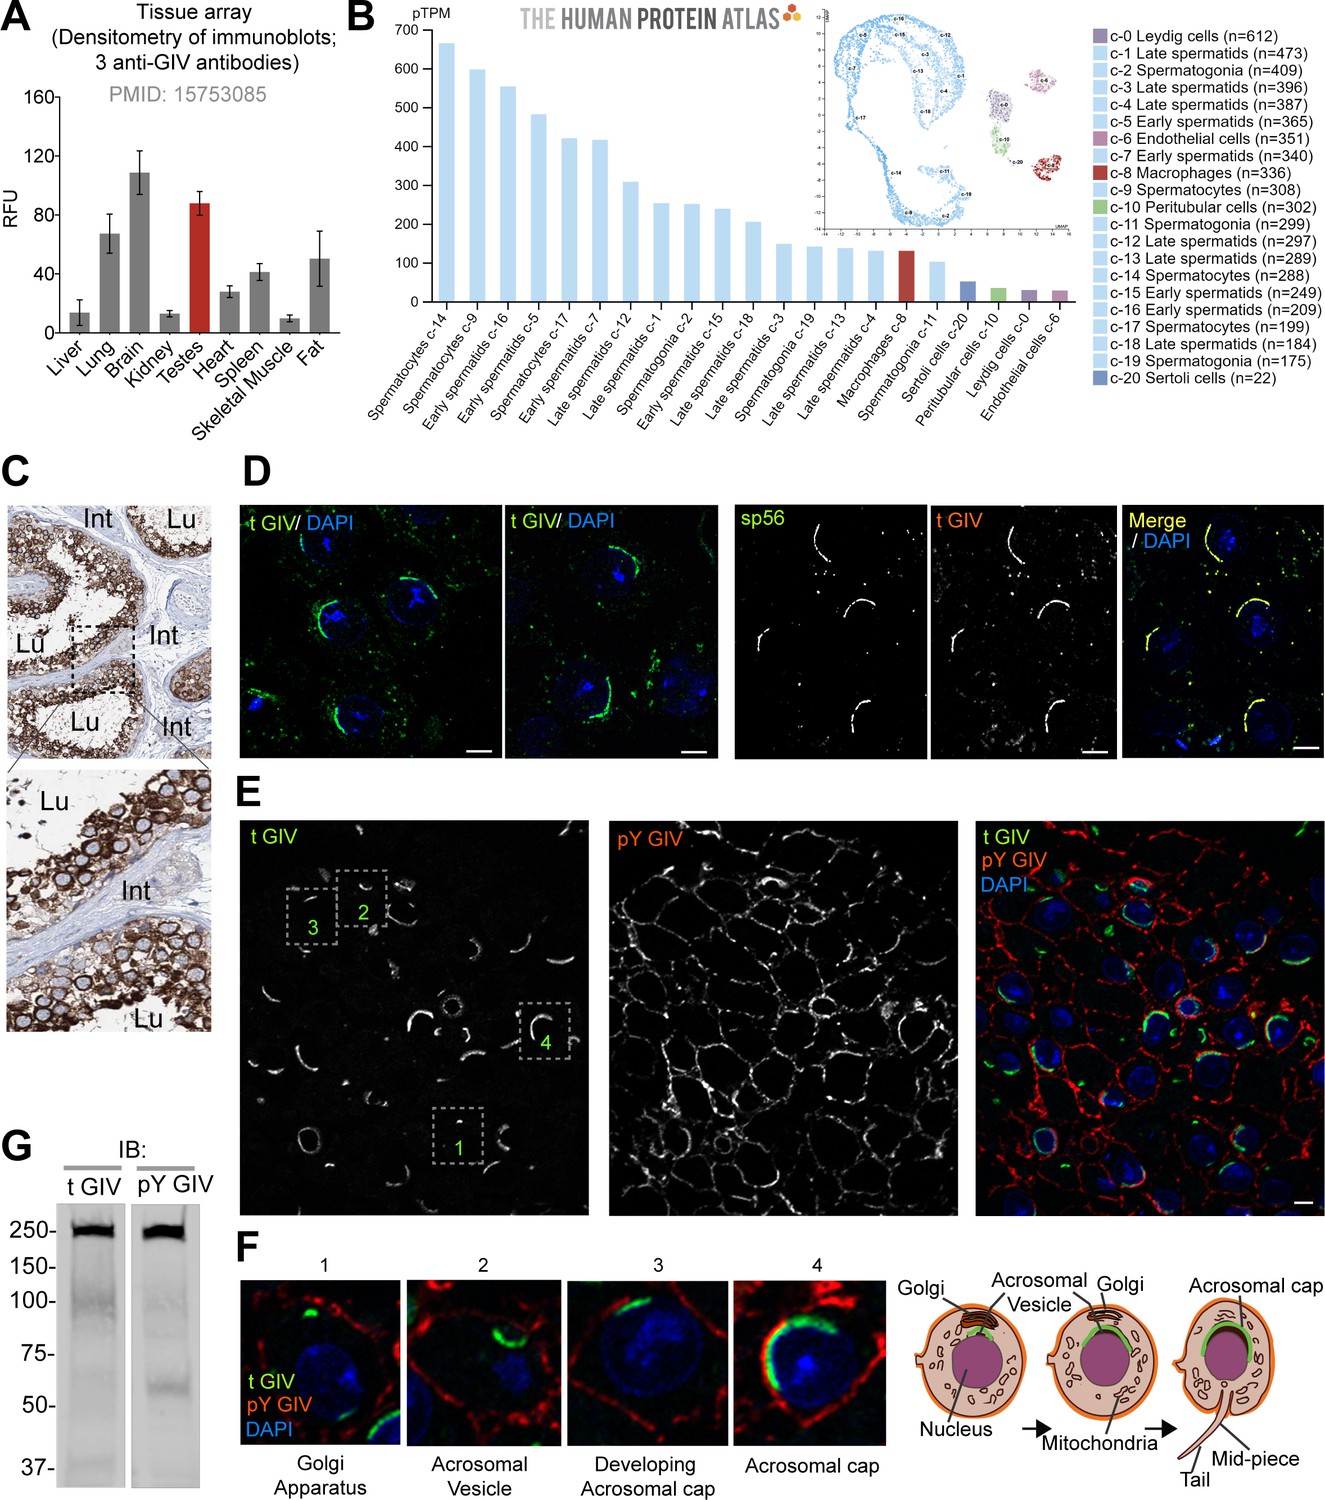
GIV (CCDC88A) is highly expressed in spermatocytes in testis and localizes to the acrosomal cap.
(A) Bar graph displays the relative fluorescence unit (RFU) of endogenous full-length GIV protein in immunoblots of organ lysates published previously using three independent anti-GIV antibodies raised against different epitopes of GIV (Anai et al., 2005). (Figure 1—source data 1)(B) RNA expression in the single-cell-type clusters identified in the human testis visualized by a UMAP plot (inset) and a bar plot. The bar plot shows RNA expression (pTPM) in each cell-type cluster. UMAP plot visualizes the cells in each cluster, where each dot corresponds to a cell. (C) Representative images from human testis immunistochemistry studies curated in the Human Protein Atlas. Int: interstitium; Lu: lumen of seminiferous tubules. (D) Cryosections of mouse testis (8 weeks old, C57BL/6) were stained for either total GIV (tGIV; green) and DAPI (blue, nucleus) alone, or co-stained with tGIV and the sperm acrosomal matrix protein zona pellucida 3 receptor (ZP3R, formerly called sp56; red) and analyzed by confocal immunofluorescence. Representative images from two independent analyses are displayed. Scale bar = 10 µm. (E, F) Cryosections of mouse testis tissue analyzed for total (t) GIV (green), pY GIV (red), and DAPI (blue, nucleus). Representative images from two independent analyses are shown in panel (E); scale bar = 10 µm. Insets in panel (E) are magnified and displayed in panel (F, left). Schematics in panel (F, right) display various localization of GIV observed during the process of maturation of the Golgi into acrosomal cap. (G) Immunoblots on mouse testis lysates with the same tGIV and pY GIV antibodies. (Figure 1—source data 2).
-
Figure 1—source data 1
Quantitative immunoblotting of GIV in tissues.
Excel sheet with band densitometry values of immunoblots for endogenous GIV in various tissue lysates using three different anti-GIV/Girdin antibodies, as determined by ImageJ (corresponds to Figure 1A).
- https://cdn.elifesciences.org/articles/69160/elife-69160-fig1-data1-v1.xlsx
-
Figure 1—source data 2
Full-length, uncropped immunoblots on mouse testis lysates with tGIV and pY GIV antibodies (corresponds to Figure 1G).
- https://cdn.elifesciences.org/articles/69160/elife-69160-fig1-data2-v1.pptx
Figure 1—figure supplement 1

Schematic summarizing the known localization (A) and role of G proteins/AC proteins and their impact on cAMP signaling (B) during sperm processes.
(A) The localization of G protein subunits and membrane and soluble adenylyl cyclases (mAC/sAC) and the calcium channel, Catsper, is shown. The intensity of the bar denotes the relative concentrations of the molecules. (B) Summary of experimental evidence and key citations and unknown (?) aspects in spatiotemporally separated signaling cascades that regulate sperm processes.
Figure 1—figure supplement 2
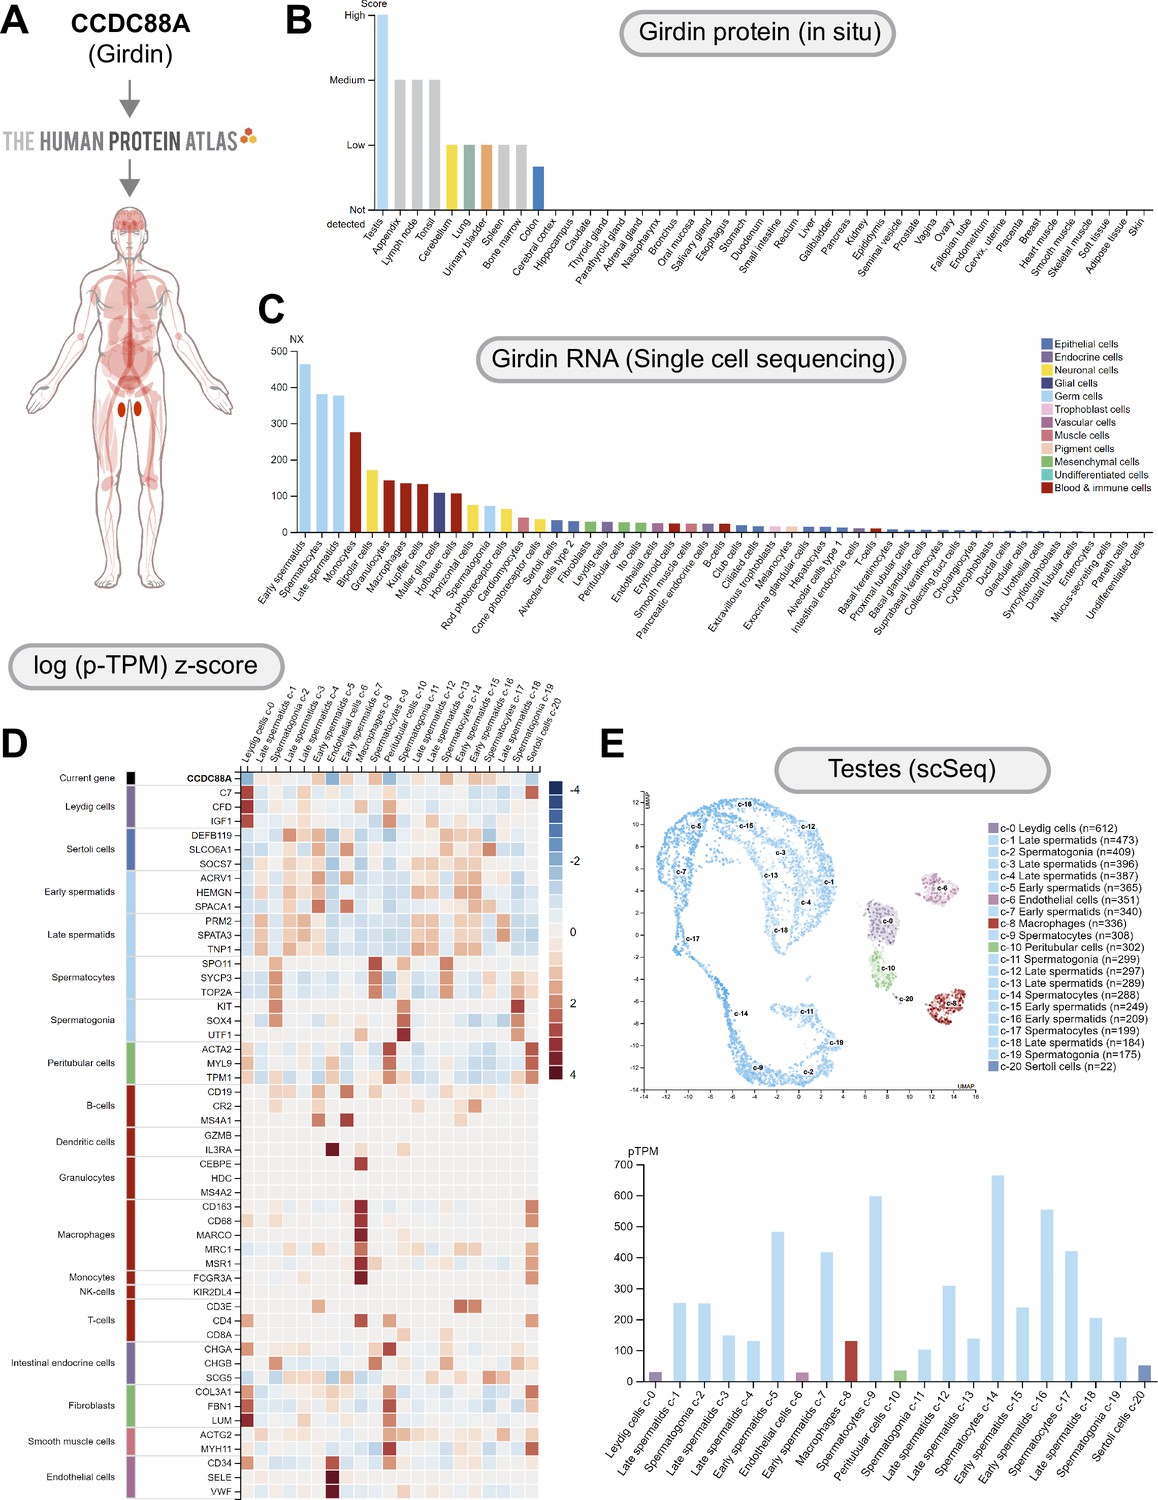
CCDC88A (GIV/Girdin) is highly expressed in the testes, most specifically the spermatocytes.
(A) CCDC88A expression profile was queried in the Human Protein Atlas. (B) GIV protein expression data is shown for each of the 44 tissues. (C) A summary of single-cell RNA (NX) from all single-cell types. Color coding is based on cell-type groups, each consisting of cell types with functional features in common. (D) The heatmap in this section shows expression of CCDC88A and well-known cell-type markers in the different single-cell-type clusters of human testes. Normalized data is presented as log (p-TPM) Z-score. (E) UMAP plot (top) for single-cell expression of CCDC88A in human testes. A bar chart (bottom) shows RNA expression (pTPM) in each cell-type cluster.
Figure 2
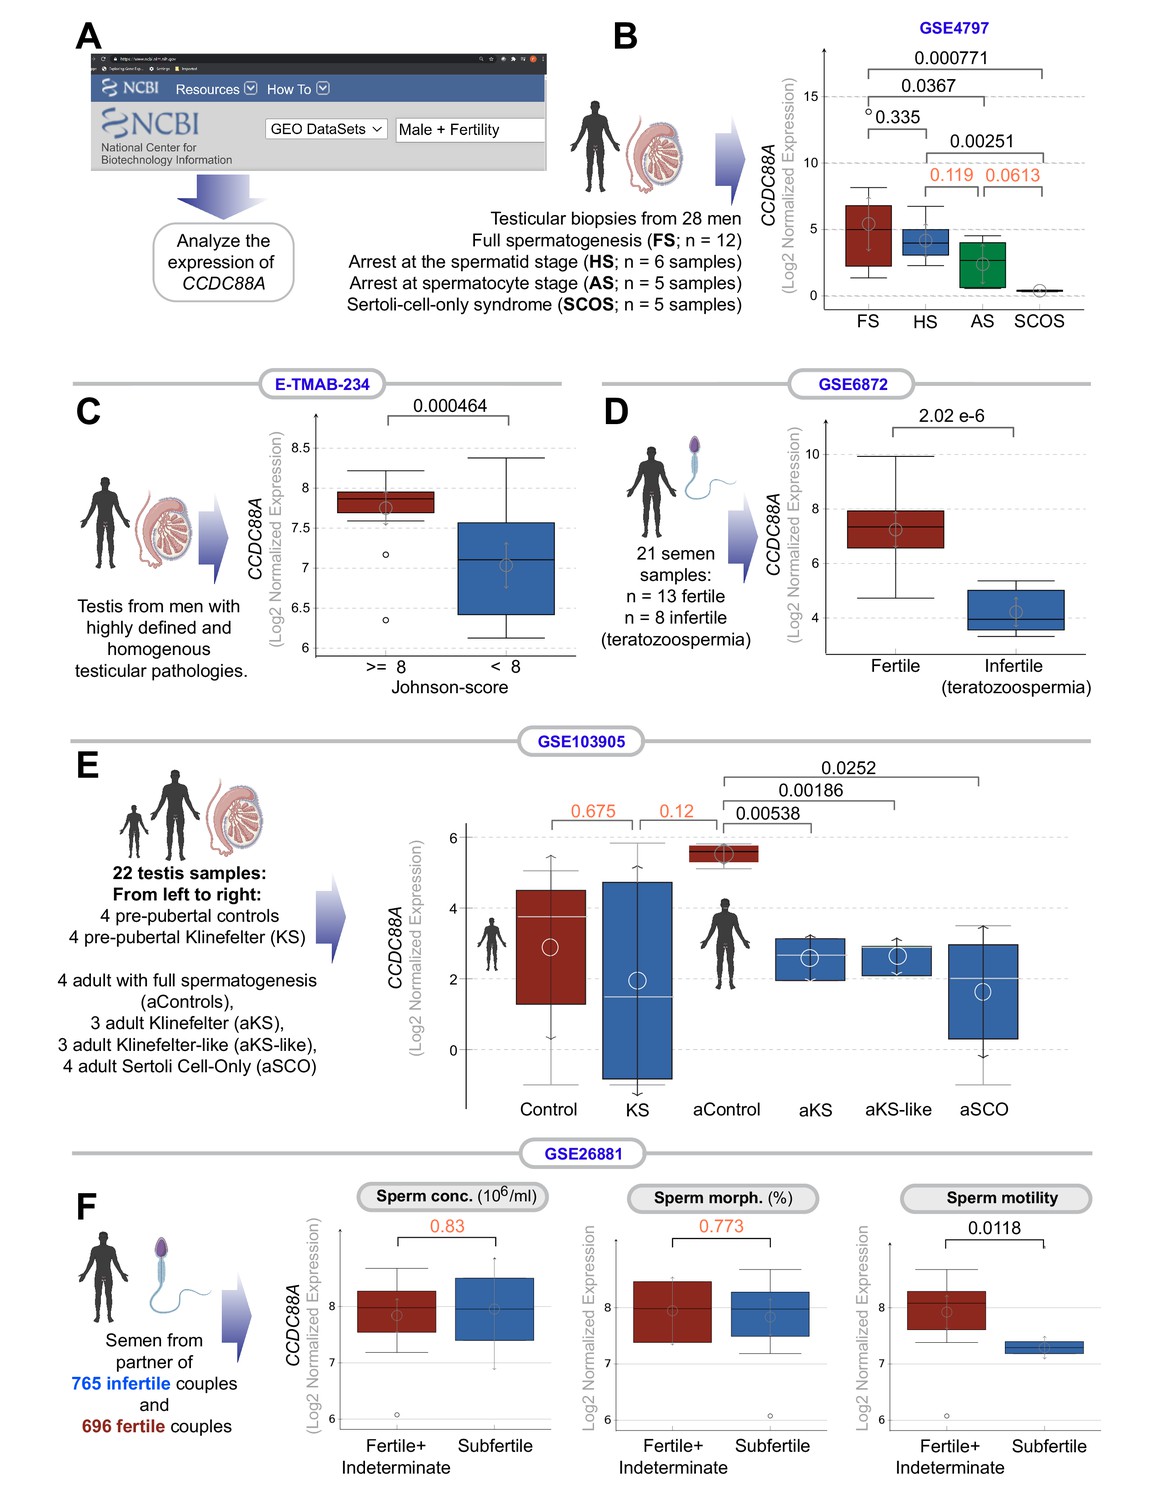
Transcripts of CCDC88A (GIV) are downregulated in infertile male testis and semen.
(A) Schematic displays the approach used to search NCBI GEO database for testis and sperm transcriptomic datasets suitable to study correlations between the abundance of CCDC88A transcripts and male fertility. (B–E) Whisker plots show the relative abundance of CCDC88A (expressed as Log2 normalized expression; see Materials and methods for different normalization approaches used for microarray and RNA-seq datasets) in sperm or testis samples (as annotated using schematics) in samples annotated with fertility status, or syndromes associated with infertility. (F) Whisker plots show the relative abundance of CCDC88A transcripts in sperms classified as subfertile or not based on three properties of sperm assessed using a modified WHO criterion published by Guzick et al., 2001 (see Materials and methods). Distribution of gene expression values is illustrated using boxplots and mean as circle with 95% confidence intervals (CIs) as arrows. Numbers on top indicate the p values, which were derived from Welch’s t-test. A significance level of <0.05, corresponding to 95% CIs are indicated in black font. Insignificant p values are indicated in red font.
Figure 3
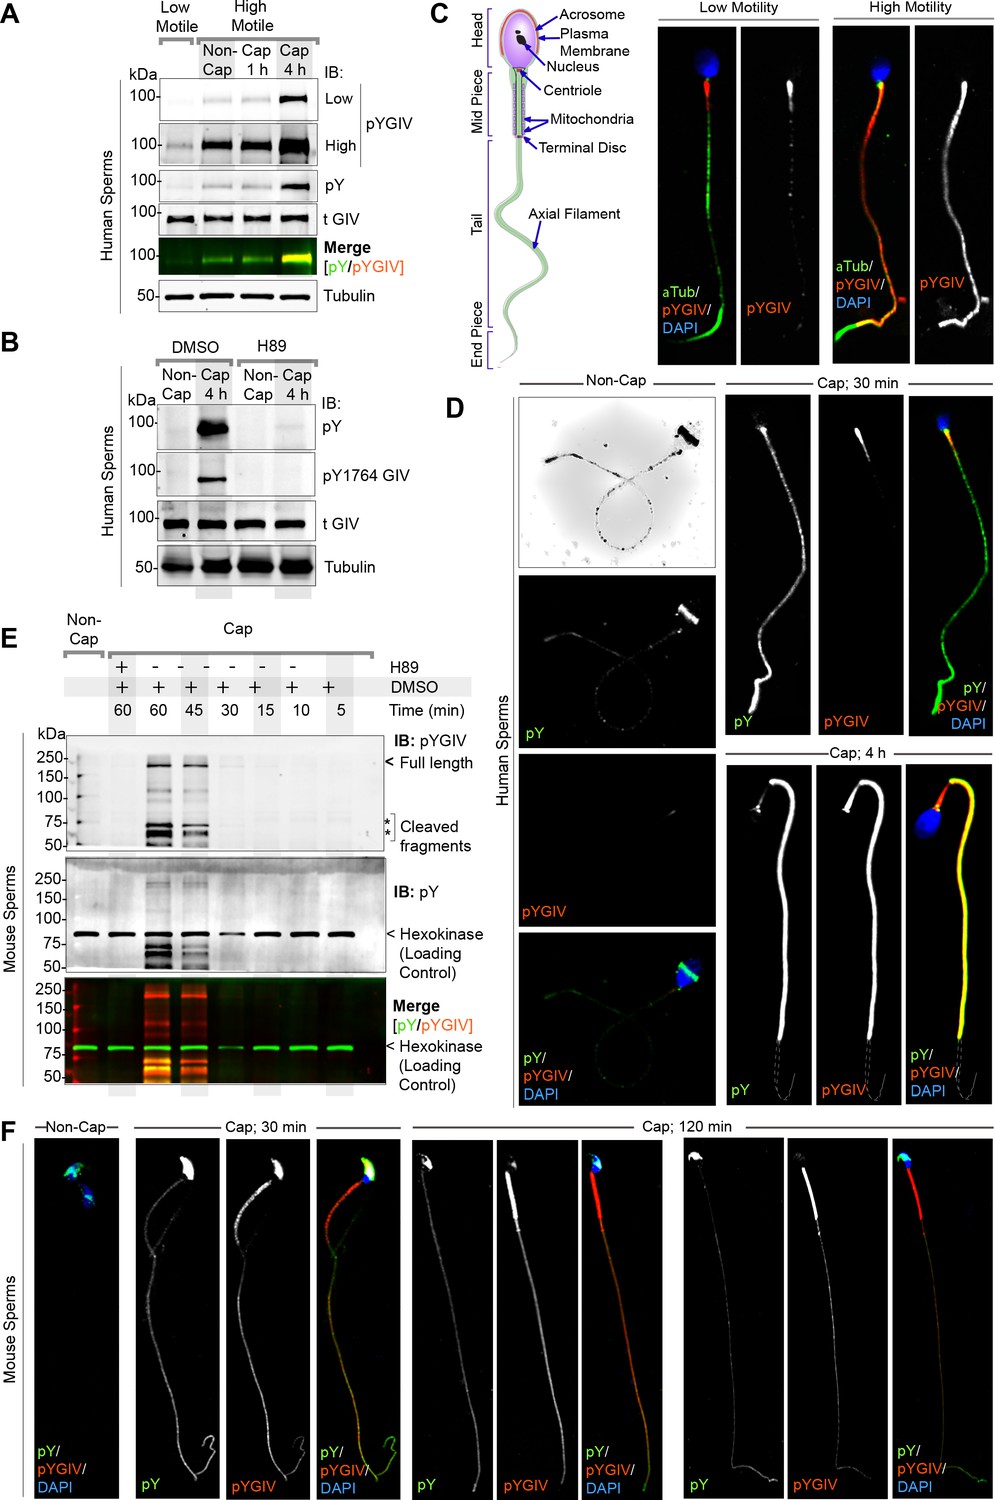
GIV localizes to the head and tail of human and murine sperms and is rapidly tyrosine phosphorylated during capacitation.
(A) Freshly ejaculated human sperm were segregated into low-motile and high-motile populations using ‘swim-up’ technique (see Materials and methods) and subsequently capacitated in vitro for 1 or 4 hr prior to whole cell lysis. Equal aliquots of lysates were analyzed by immunoblotting for total (t) GIV, pan pY, pY1764 GIV (pYGIV), and β-tubulin (loading control) using LI-COR Odyssey (Figure 3—source data 1). (B) Whole-cell lysates of human sperms capacitated with or without preincubation with H89 (protein kinase A [PKA] inhibitor) or DMSO control were analyzed as in (A) (Figure 3—source data 2). (C, D) Human sperm with low vs. high motility (C), were capacitated or not (D), fixed and co-stained for total and pY GIV (tGIV; pY GIV), tubulin and DAPI. Representative images that capture the most frequently observed staining patterns (at >80% frequency) among ~100–150 sperms/sample, in three independent samples, derived from three unique subjects are shown. Scale bar = 10 µm. (E) Immunoblots of equal aliquots of whole-cell lysates of mouse sperm capacitated with (+) or without (-) pretreatment with PKA inhibitor (H89) or vehicle (DMSO) control. Hexokinase is used as a loading control (Figure 3—source data 3). (F) Non-capacitated (non-cap) or capacitated mouse sperm were fixed and stained as in (D) and analyzed by confocal microscopy. Representative images that capture the most frequently observed staining patterns (at >80% frequency) among ~50–100 sperms/sample, in three independent samples, derived from three mice are shown. Scale bar = 10 µm.
-
Figure 3—source data 1
Full-length, uncropped immunoblots on human sperm lysates with tGIV and pY GIV antibodies (corresponds to Figure 3A).
- https://cdn.elifesciences.org/articles/69160/elife-69160-fig3-data1-v1.pptx
-
Figure 3—source data 2
Uncropped immunoblots on human sperm lysates with tGIV and pY GIV antibodies (corresponds to Figure 3B).
- https://cdn.elifesciences.org/articles/69160/elife-69160-fig3-data2-v1.pptx
-
Figure 3—source data 3
Full-length, uncropped immunoblots on sperm lysates with pan-pY and pY GIV antibodies (corresponds to Figure 3E).
- https://cdn.elifesciences.org/articles/69160/elife-69160-fig3-data3-v1.pptx
Figure 4
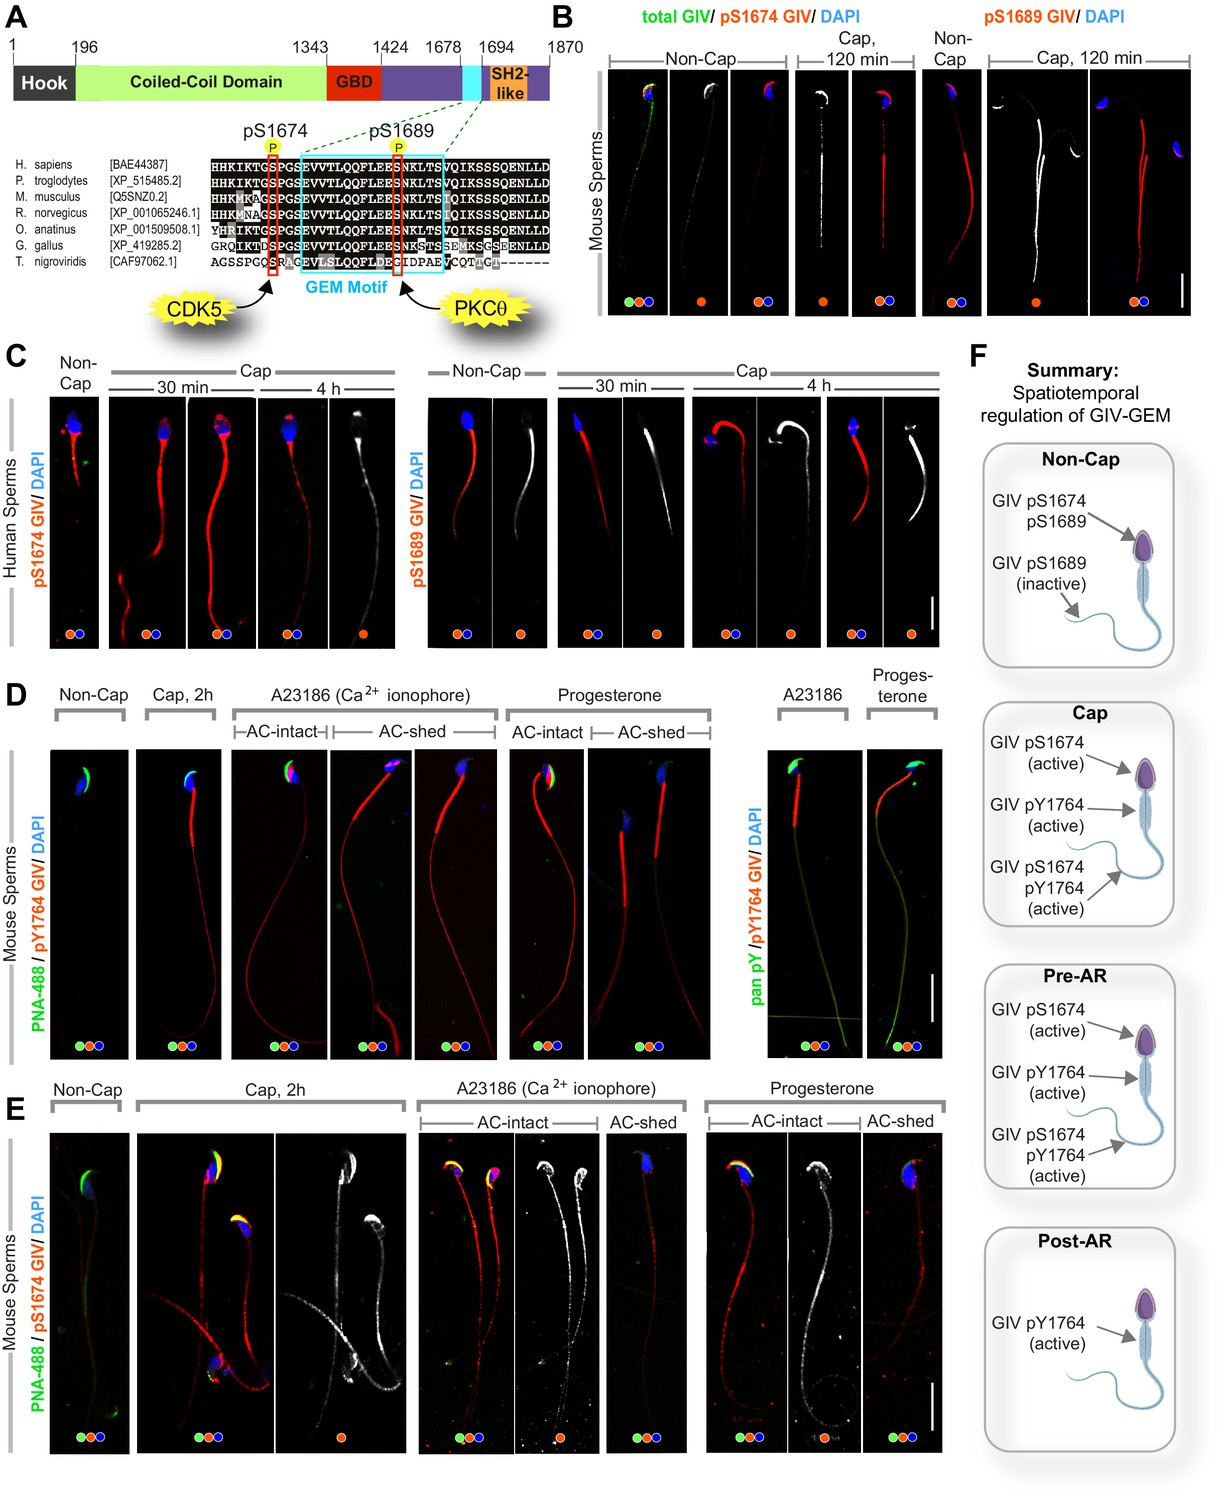
GIV’s guanine nucleotide-exchange modulator (GEM) function is dynamically phosphoregulated during capacitation and acrosomal reaction (AR) in a spatiotemporally segregated manner.
(A) Schematic shows the domain map of GIV (top) and the evolutionarily conserved GEM motif within its C terminus. A functional GEM motif is required for GIV to bind and activate Gαi as well as bind and inhibit Gαs (Gupta et al., 2016). Important phosphoserine modifications that regulate GIV’s GEM motif and the corresponding target kinases are highlighted. (B, C) Non-capacitated and capacitated mouse (B) and human (C) sperm were fixed and analyzed for the phosphoserine modifications highlighted in (A). (D, E) Mouse sperm with/without capacitation followed by treatment with either Ca2+ ionophore or progesterone to trigger AR were fixed and co-stained for peanut agglutinin (PNA-488; green, an acrosomal marker) and either pYGIV (D) or pSerGIV (E) and DAPI. Representative images are shown. Scale bar = 10 µm. (F) Schematic summarizes the spatially segregated phosphomodifications on GIV before and after capacitation and AR in various parts of the sperm. (i) Inhibitory phosphorylation at pS1689 on GIV is seen in both head and tail prior to capacitation (F, top); (ii) activating phosphorylation at S1674 on GIV is seen in the sperm head and tail, whereas pYGIV is predominantly seen in the mid-piece and the tail regions upon capacitation (post-cap; F) as well as during AR before the acrosome is shed (pre-AR; F); and (iii) after the acrosome is shed, pYGIV is the only phospho-GIV that is detected, and predominantly in the mid-piece (post-AR; F). Representative images that capture the most frequently observed staining pattern(s) (at >80% frequency), among ~50–150 sperms/sample, three independent samples, derived either from human subjects (n = 3) or mice (n = 3) are shown.
Figure 5 with 1 supplement
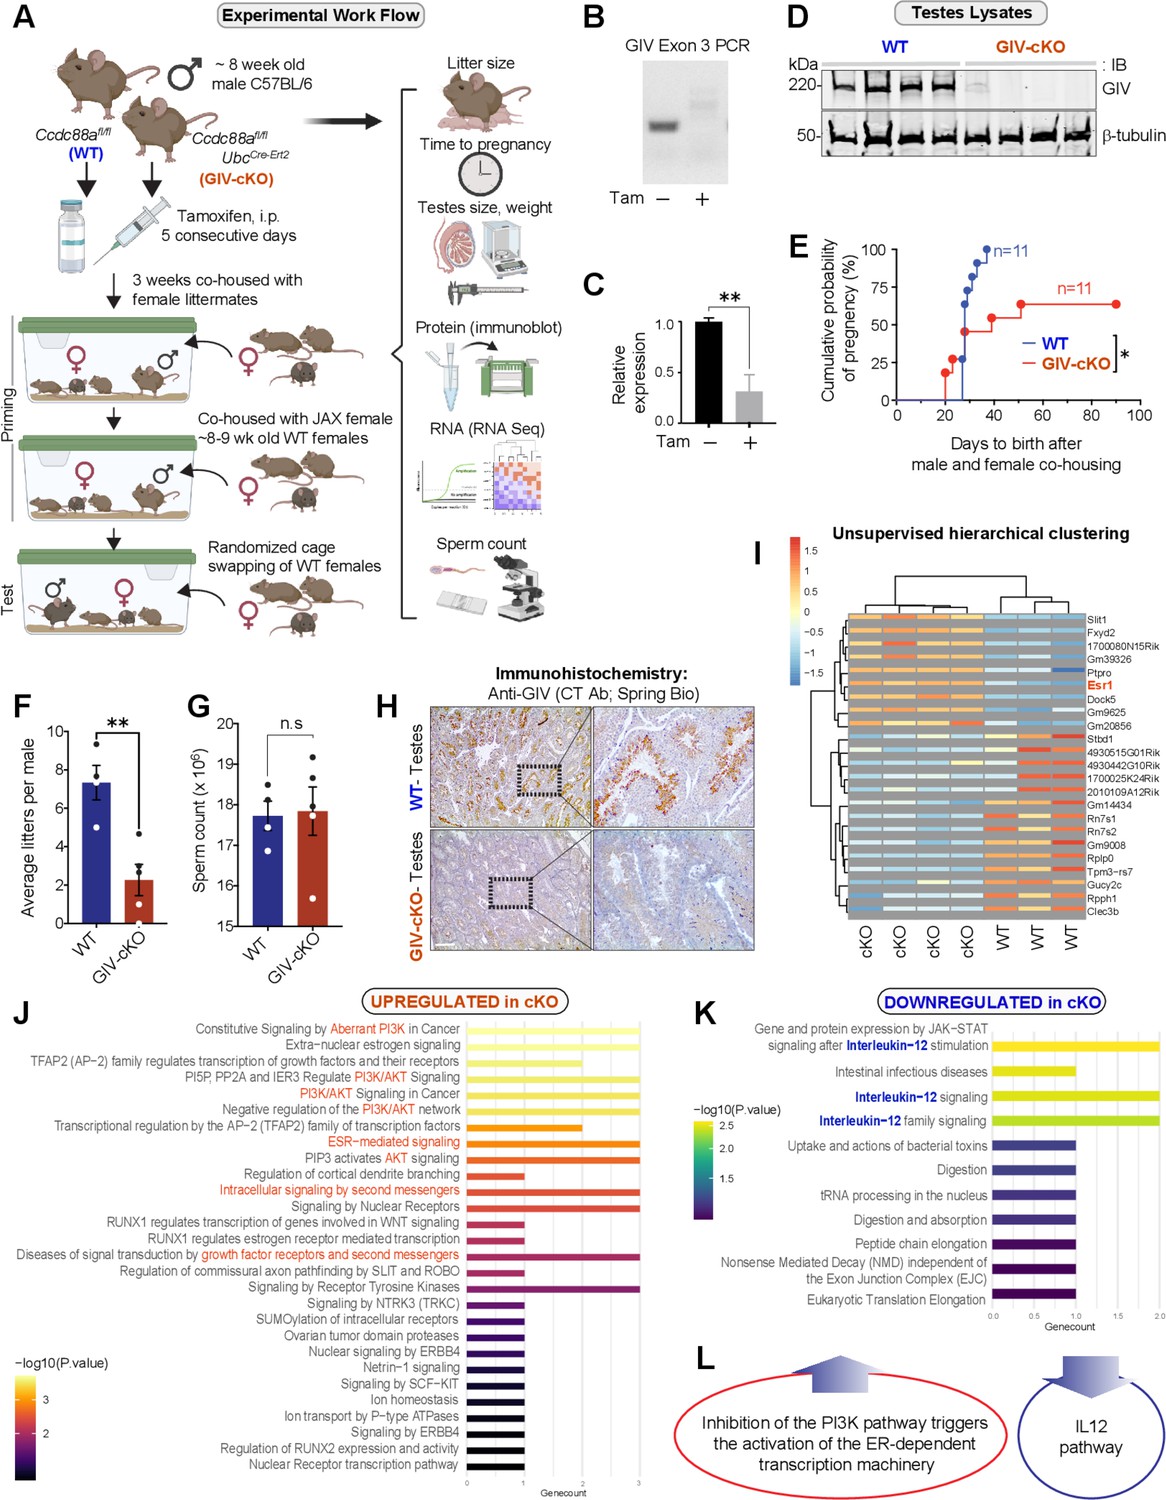
GIV is required for fertility in male mice.
(A) Schematic showing the workflow for fertility studies in conditional GIV-cKO mice. After intraperitoneal injection of tamoxifen, male mice were first primed in two phases—first by co-housing with female littermates × 3 weeks, and subsequently by co-housing with female mice from Jackson laboratory (JAX) while the females acclimatized to the animal facility. The final ‘test’ group consisted of tamoxifen-injected WT and GIV-cKO male mice randomly assigned to and co-housed with three female mice from JAX, each with proven ability to get pregnant. (B–D) Confirmation of GIV-cKO in the mice after tamoxifen injection by genotyping (B), qPCR of testis tissues (C), and immunoblotting of testis lysates (D) (Figure 5—source data 1). (E) Kaplan–Meier plot showing the cumulative probability of pregnancy (expressed as %) in the females co-housed with either WT or GIV-cKO males. Statistical significance was assessed using log-rank analysis. *p<0.05 (Figure 5—source data 2). (F, G) Bar graphs showing the average litter size (F; Figure 5—source data 3) and sperm count (G; Figure 5—source data 4) in WT and GIV-cKO males. See also Figure 5—figure supplement 1 for quantifications of tested weight and length. (H) Immunohistochemistry staining on mouse testis. Scale bar = 200 µm. (I) Unsupervised clustering of WT and KO testis samples based on gene expression. Differentially expressed genes (DEGs) that were up- or downregulated in KO are annotated on the right side (Figure 5—source data 5). (J, K) Reactome pathway analyses showing the pathways that are up or downregulated in KO testis. (L) Summary of the most prominent conclusions from RNA-seq dataset.
-
Figure 5—source data 1
Full-length, uncropped immunoblots on testes lysates with GIV and tubulin antibodies (corresponds to Figure 5D).
- https://cdn.elifesciences.org/articles/69160/elife-69160-fig5-data1-v1.pptx
-
Figure 5—source data 2
Excel sheet with time to live birth values observed in females co-housed with WT and GIV-cKO mice (corresponds to graphs in Figure 5E).
- https://cdn.elifesciences.org/articles/69160/elife-69160-fig5-data2-v1.xlsx
-
Figure 5—source data 3
Excel sheet with litter size values from WT and GIV-cKO mice (corresponds to graphs in Figure 5F).
- https://cdn.elifesciences.org/articles/69160/elife-69160-fig5-data3-v1.xlsx
-
Figure 5—source data 4
Excel sheet with sperm count values from WT and GIV-cKO mice (corresponds to graphs in Figure 5G).
- https://cdn.elifesciences.org/articles/69160/elife-69160-fig5-data4-v1.xlsx
-
Figure 5—source data 5
Excel sheet with differential expression analysis-derived reactome pathway analyses of the most significantly up- and downregulated genes in GIV-cKO mice (corresponds to graphs in Figure 5I).
- https://cdn.elifesciences.org/articles/69160/elife-69160-fig5-data5-v1.xlsx
Figure 5—figure supplement 1
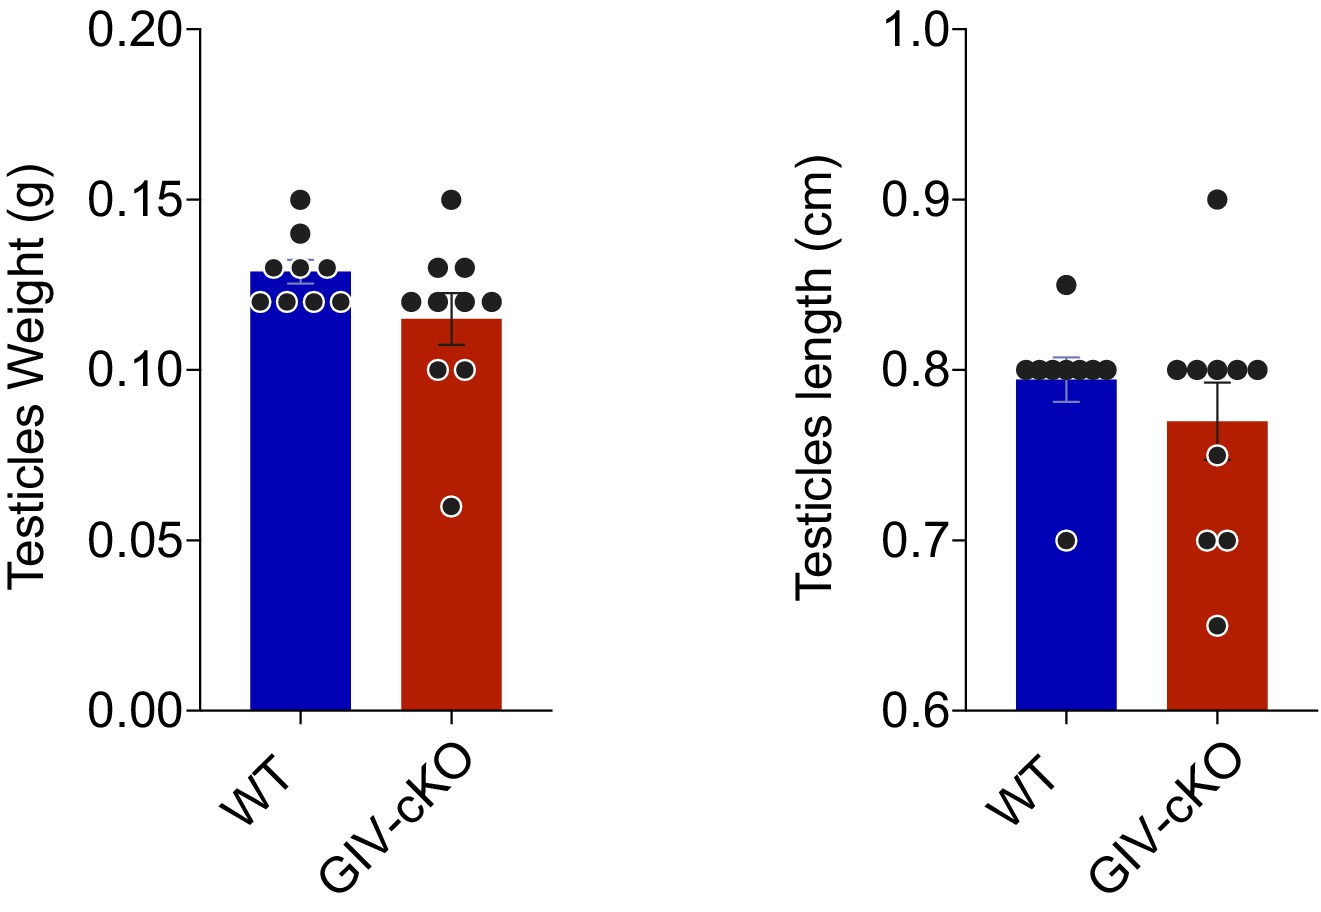
GIV is required for male fertility, but its depletion does not impact testes weight or length.
GIV was depleted in male mice by intraperitoneal injection of tamoxifen (see Figure 5A). Bar graphs show the testes weight (left; Figure 5—figure supplement 1—source data 1) and length (right; Figure 5—figure supplement 1—source data 2) in WT and GIV-cKO males. All results are presented as average ± SEM. Statistical significance was assessed using unpaired t-test, non-significant p-values>0.05.
-
Figure 5—figure supplement 1—source data 1
Excel sheet with testes weight values from WT and GIV-cKO mice (corresponds to the left-side graph in Figure 5—figure supplement 1).
- https://cdn.elifesciences.org/articles/69160/elife-69160-fig5-figsupp1-data1-v1.xlsx
-
Figure 5—figure supplement 1—source data 2
Excel sheet with testes length values from WT and GIV-cKO mice (corresponds to the left-side graph in Figure 5—figure supplement 1).
- https://cdn.elifesciences.org/articles/69160/elife-69160-fig5-figsupp1-data2-v1.xlsx
Figure 6

GIV’s GEM function is required for sperm motility and survival during capacitation.
(A, B) Schematic (A, top) of cell-permeant His-TAT-GIV-CT wildtype (WT) and GEM-deficient mutant (F1685A; FA) peptides used in this work. Immunofluorescence images (B) representative of sperms after treatment with cell-permeant TAT-GIV-CT peptides and stained with anti-His antibody and DAPI. Scale bar = 15 µm. Histograms (A, bottom) from flow cytometry studies conducted with or without permeabilization confirm the uptake of His-TAT peptides in sperm. (C) Immunoblots of GST pulldown assays testing the ability of GDP-loaded GST-Gαi3 to bind TAT-GIVCT peptides from lysates of sperms at 1 hr (B1) and 6 hr (B2) after transduction (Figure 6—source data 1). (D, E) Immunoblots of lysates of TAT-GIVCT-transduced sperms at the indicated time points after capacitation analyzed for phospho-PKA substrates (D), phospho(p) and total (t) Akt (D; Figure 6—source data 2), pYGIV (E, left), pan-pY (E, right) (Figure 6—source data 3), and hexokinase (loading control, D). (F–I) Schematic in (F) summarizes workflow in assessing motility and survival of sperms during capacitation. Bar graphs in (G; Figure 6—source data 4) display the relative % of motile and progressively motile population of sperms. Line graphs in (H) show survival of sperms as determined by methy thiazolyl tetrazolium (MTT) assay; bar graphs in (I) show the area under the curve (AUC) of the line graphs in (H) (Figure 6—source data 5). All results are presented as average ± SEM of three independent studies conducted on sperm isolated from three mice. Statistical significance was assessed using one-way analysis of variance (ANOVA) followed by Tukey’s test for multiple comparisons. *p<0.05, ***p<0.001, ****p<0.0001, ns p>0.05. (J) Schematic summarizes the conclusions of how GIV’s GEM function impacts sperm phenotypes during capacitation.
-
Figure 6—source data 1
Full-length, uncropped immunoblots on GST pulldown assays (corresponds to Figure 6C).
- https://cdn.elifesciences.org/articles/69160/elife-69160-fig6-data1-v1.pptx
-
Figure 6—source data 2
Full-length, uncropped immunoblots on TAT-peptide-transduced sperm lysates with His, hexokinase, phospho-PKA substrate, phospho-Akt, and total Akt antibodies (corresponds to Figure 6D).
- https://cdn.elifesciences.org/articles/69160/elife-69160-fig6-data2-v1.pptx
-
Figure 6—source data 3
Full-length, uncropped immunoblots on TAT-peptide-transduced sperm lysates with pan-pY and pYGIV antibodies (corresponds to Figure 6E).
- https://cdn.elifesciences.org/articles/69160/elife-69160-fig6-data3-v1.pptx
-
Figure 6—source data 4
Excel sheet with sperm motility values (corresponds to graph in Figure 6G).
- https://cdn.elifesciences.org/articles/69160/elife-69160-fig6-data4-v1.xlsx
-
Figure 6—source data 5
Excel sheet with sperm viability values (corresponds to graph in Figure 6H,I).
- https://cdn.elifesciences.org/articles/69160/elife-69160-fig6-data5-v1.xlsx
Figure 7 with 1 supplement
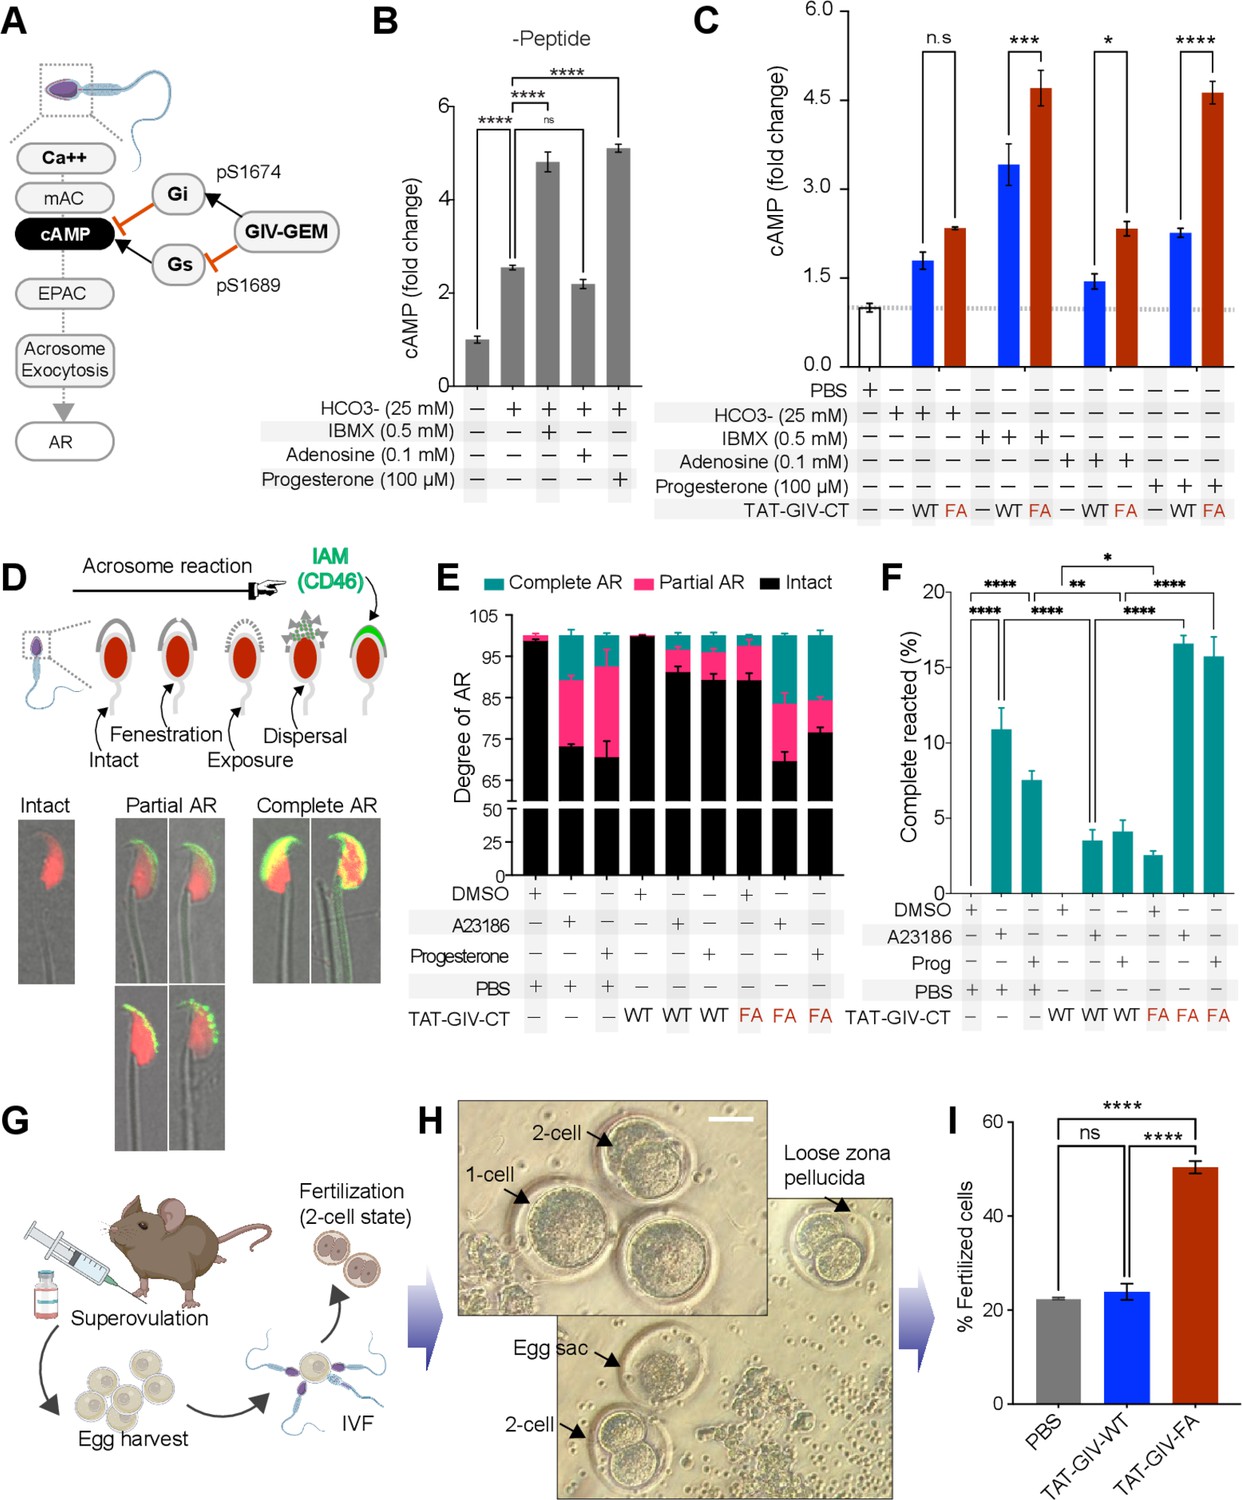
GIV’s GEM function inhibits acrosomal reaction (AR).
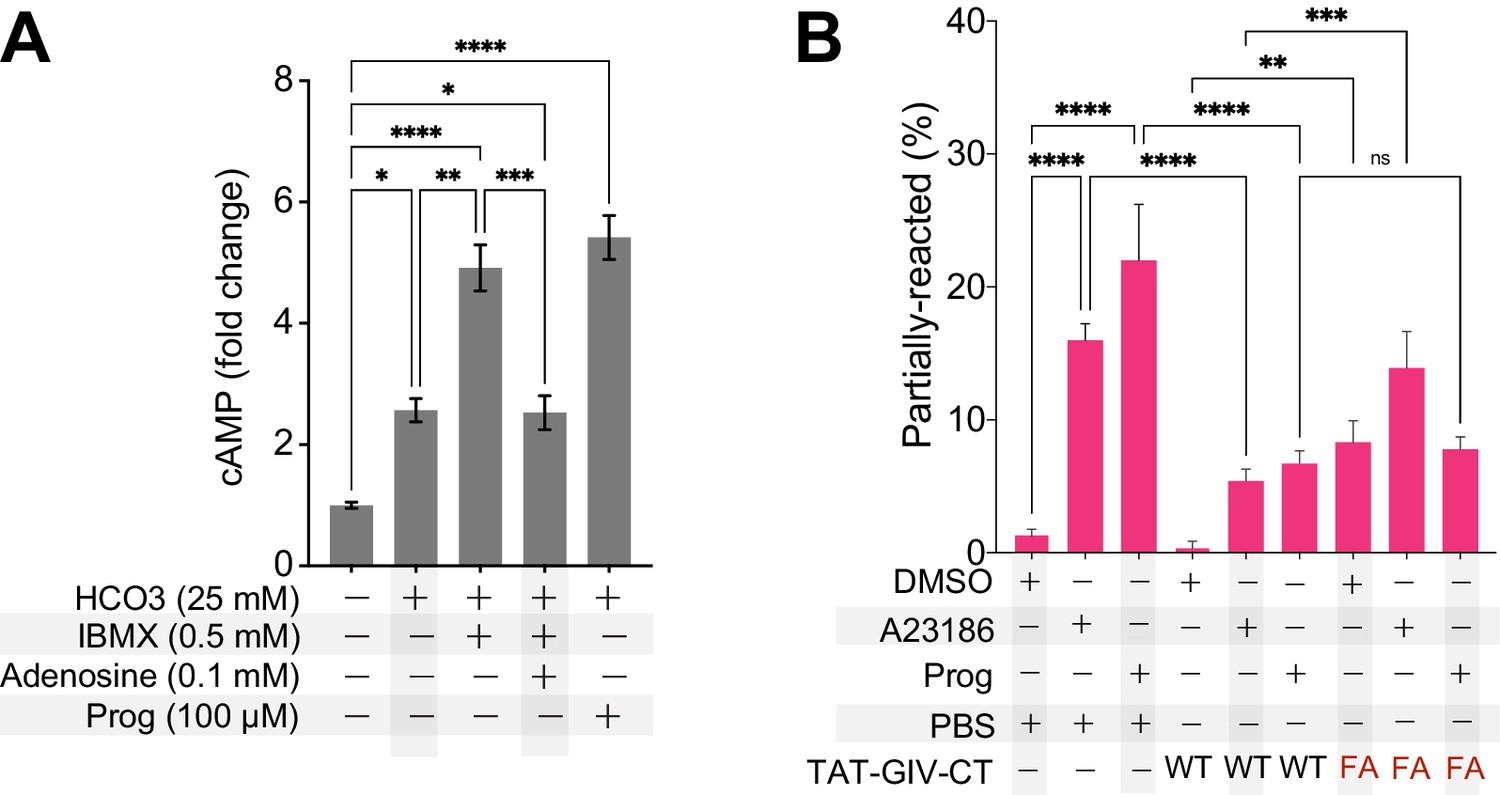
(A) Schematic summarizes the current knowledge of how Ca2+ and cAMP signaling regulates acrosome exocytosis during AR and how GIV’s ability to modulate cAMP via both Gαi/s is hypothesized to impact AR. (B) Bar graphs display the fold change in cAMP in mouse sperms treated with various stimuli in the presence of DMSO. All results are presented as average ± SEM of three independent studies conducted on sperm isolated from three mice. Statistical significance was assessed using one-way analysis of variance (ANOVA) followed by Tukey’s test for multiple comparisons. nsp>0.05, ****p<0.0001. (C) Bar graphs display the fold change in cAMP in TAT-GIVCT-transduced mouse sperms exposed to various stimuli. Dotted horizontal line represents cAMP concentration in PBS-treated samples, to which all other values were normalized. See also Figure 7—figure supplement 1 for comparison of PBS vs. all other treatments and conditions with (+) or without (-) peptides. All results are presented as average ± SEM of three independent studies conducted on sperm isolated from three mice. Statistical significance was assessed using two-way ANOVA followed by Sidak’s test for multiple comparisons. *p<0.05, ***p<0.001, ****p<0.0001, nsp>0.05 (Figure 7—source data 1). (D) Schematic on top summarizes the assay used to quantify progressive changes in acrosome membrane during AR that was induced in vitro by exposing capacitated sperms to 10 µM A23186 or 100 µM progesterone. Images in the bottom panel are representative of acrosome-intact, partial AR and complete AR stages. (E, F) Stacked bar graphs in (E) display the proportion of sperms in each indicated condition that are either in partial or complete AR or with intact acrosomes. Bar graphs in (F) display just the relative proportion of sperms in (E) that have complete AR. All results are presented as average ± SEM of three independent studies conducted on sperm isolated from three mice. Statistical significance was assessed using one-way ANOVA followed by Tukey’s test for multiple comparisons. *p<0.05, **p<0.01, ****p<0.0001 (Figure 7—source data 2). (G–I) Schematic in (G) displays the workflow used for in vitro fertilization (IVF) assays in (H, I). Representative images in (H) display the two-cell stage, which is quantified as % of total eggs in the assay and displayed as bar graphs in (I) as an indication of successful fertilization. Results are presented as average ± SEM of three independent studies conducted on sperm isolated from three mice. Statistical significance was assessed using one-way ANOVA including a Tukey’s test for multiple comparisons. ****p<0.0001, nsp>0.05 (Figure 7—source data 3).
-
Figure 7—source data 1
Excel sheet with cAMP concentrations (corresponds to graph in Figure 7B,C).
- https://cdn.elifesciences.org/articles/69160/elife-69160-fig7-data1-v1.xlsx
-
Figure 7—source data 2
Excel sheet with % cells with various stages of acrosomal reaction (AR) (corresponds to graph in Figure 7D–F).
- https://cdn.elifesciences.org/articles/69160/elife-69160-fig7-data2-v1.xlsx
-
Figure 7—source data 3
Excel sheet with % fertilized cells (corresponds to graph in Figure 7G–I).
- https://cdn.elifesciences.org/articles/69160/elife-69160-fig7-data3-v1.xlsx
Figure 7—figure supplement 1
An intact GEM motif in GIV is required for inhibiting cAMP surge and acrosomal reaction.
(A) Bar graphs display the fold change in cAMP in mouse sperms in the presence (+) or absence (-) of various treatments (Figure 7—figure supplement 1—source data 1). (B) Acrosomal reaction was analyzed in TAT-GIVCT-transduced mouse sperms exposed to either DMSO control or the calcium ionophore A23186 or progesterone using CD46 as a marker of inner acrosomal membrane (IAM) as outlined in Figure 7D. Bar graph presented here shows the proportion of partially reacted sperms in each treatment group. All results are presented as average ± SEM. Statistical significance was assessed using one-way analysis of variance (ANOVA) followed by Tukey’s test for multiple comparisons. *p<0.05, **p<0.01, ***p<0.001, ****p<0.0001 (Figure 7—source data 2).
-
Figure 7—figure supplement 1—source data 1
Excel sheet with cAMP concentrations (corresponds to graph in Figure 7—figure supplement 1).
- https://cdn.elifesciences.org/articles/69160/elife-69160-fig7-figsupp1-data1-v1.xlsx
Figure 8
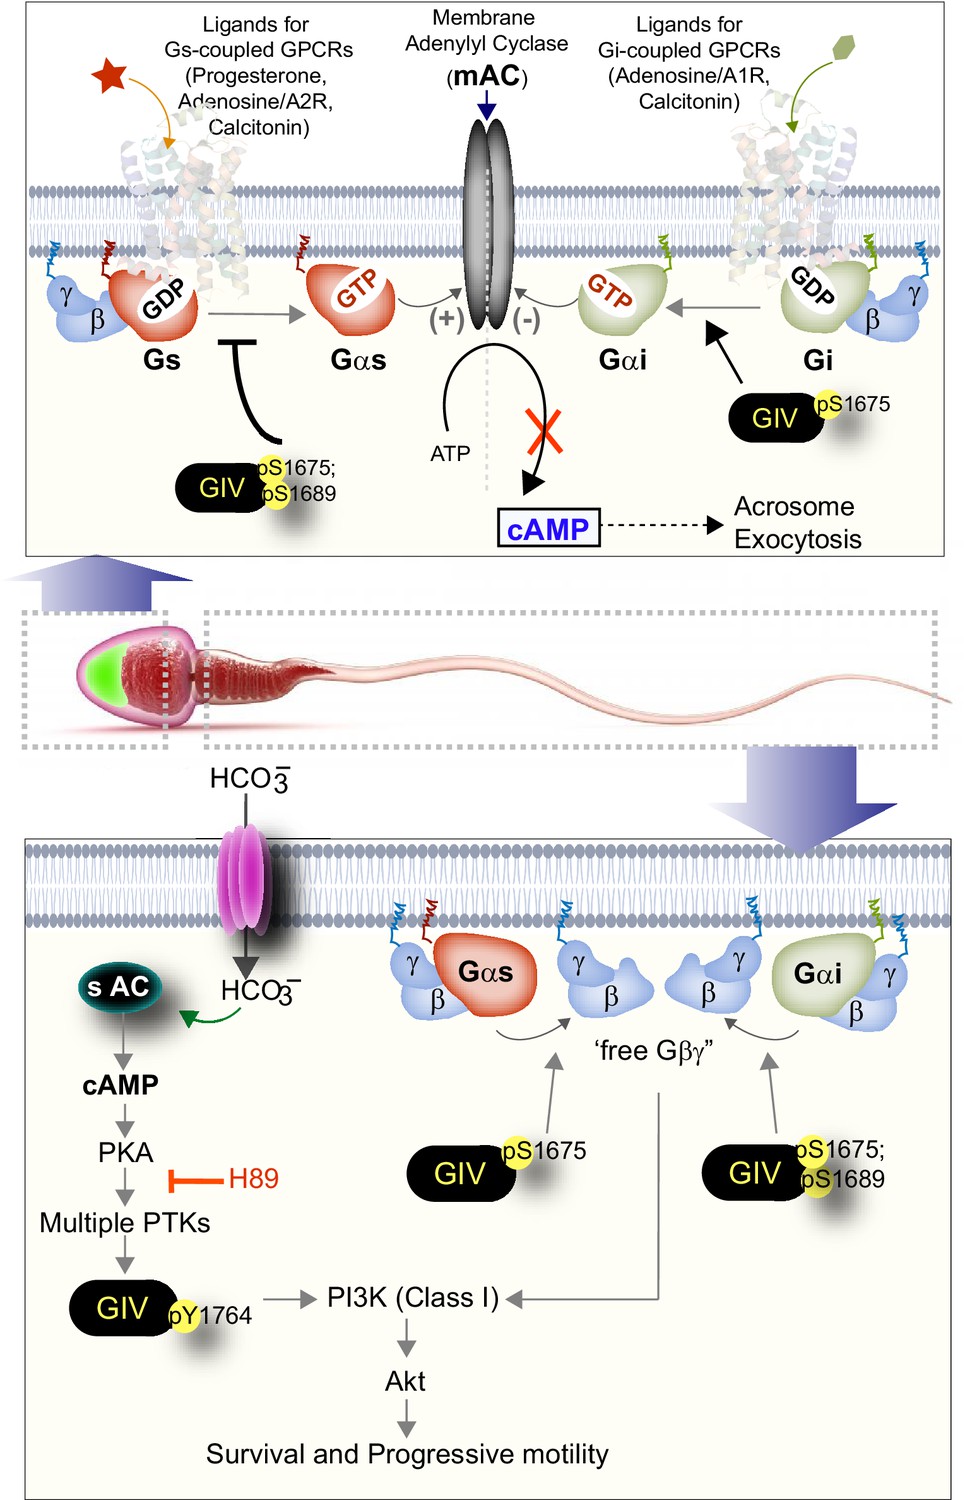
Summary and working model: spatiotemporally segregated roles of GIV/Girdin during sperm capacitation.
Schematic summarizes the key findings in this work and places them in the context of existing literature. GIV is likely to primarily function during capacitation of sperm, during which it fulfills two key roles as a signal transducer in a spatiotemporally segregated manner. The first role (right, top) is in the head of the sperm, where GIV’s GEM motif inhibits the AC→cAMP pathway and prevents acrosomal reaction. The second role (right, bottom) is in the mid-piece and tail region of the sperm, which involves tyrosine phosphorylation of GIV, which happens downstream of PKA activation. Such phosphorylation is rapidly induced during capacitation. In addition, GIV’s GEM motif is activated and is required for the enhancement of PI3K/Akt signals, enhanced motility, and survival of sperms during capacitation.
Tables
Key resources table
| Reagent type (species) or resource | Designation | Source or reference | Identifiers | Additional information |
|---|---|---|---|---|
| Antibody | Rabbit polyclonal anti-GIV (Girdin) (T-13) | Santa Cruz Biotechnology | sc-133371 | |
| Antibody | Rabbit monoclonal diagnostic grade anti-Girdin/GIV antibody | Custom; Sprint Bioscience | SP173 | Validated in prior publication Ghosh et al., 2016 |
| Antibody | Rabbit polyclonal anti-GIV (Girdin) (CC-Ab) | Millipore Sigma | ABT80 | |
| Antibody | Rabbit polyclonal anti-GIV pS1675 Ab | Custom, from 21t Century Biosciences | n/a | Validated in prior publication Bhandari et al., 2015 |
| Antibody | Rabbit polyclonal anti-GIV pS1689 Ab | Custom, from 21st Century Biosciences | n/a | Validated in prior publication López-Sánchez et al., 2013 |
| Antibody | Rabbit monoclonal anti-GIV pY1764 Ab | Custom, Spring Biosciences Inc | n/a | Validated in prior publications Midde et al., 2015; Lin et al., 2011; Midde et al., 2018; Dunkel et al., 2016 |
| Antibody | Rabbit monoclonal anti-pT308 AKT | Cell Signaling Technology | D9E | |
| Antibody | Mouse monoclonal anti-total AKT | Cell Signaling Technology | 40D4 | |
| Antibody | Mouse anti-sp56 | Thermo Fisher Scientific (Waltham, MA) | MA1-10866 | |
| Antibody | Mouse anti- human hexokinase 1/2 monoclonal antibody | R&D Systems, (Minneapolis, MN) | MAB8179 | |
| Antibody | Rabbit anti-phospho-PKA substrate (RRXS*/T*)100G7E | Cell Signaling Technology | 9624 | |
| Antibody | Goat anti-rabbit IgG, Alexa Fluor 594 conjugated | ThermoFisher Scientific | A11072 | For immunofluorescence (IF) |
| Antibody | Goat anti-mouse IgG, Alexa Fluor 488 conjugated | ThermoFisher Scientific | A11017 | For immunofluorescence (IF) |
| Antibody | IRDye 800CW goat anti-mouse IgG secondary (1:10,000) | LI-COR Biosciences | 926-32210 | For immunoblotting |
| Antibody | IRDye 680RD goat anti-rabbit IgG secondary (1:10,000) | LI-COR Biosciences | 926-68071 | For immunoblotting |
| Strain, strain background (Mus musculus) | UbcCre-Ert2/+ xCcdc88afl/fl andCcdc88afl/fl mice | Masahide Takahashi (Nagoya University Graduate School of Medicine, Nagoya, Japan) | n/a | |
| Strain, strain background (Mus musculus) | WT and GIV-cKO (conditional KO) mice | This work | UbcCre-Ert2/+ xCcdc88afl/fl (experimental group), and UbcCre-Ert2/ Cre-Ert2 x Ccdc88afl/fl (control group) | This work; male |
| Strain, strain background (Mus musculus) | C57BL/6J mice (male and female) | The Jackson Laboratory | Stock number: 000664; Bar Harbor, ME | Male: source of sperm for biochemical, immunohistochemical, peptide transduction, and functional assaysFemale: for co-housing studies; source for eggs for IVF assays |
| Chemical compound | Paraformaldehyde 16% | Electron Microscopy Biosciences | 15710 | |
| Chemical compound | MTT | Millipore Sigma | 475989-1GM | |
| Other | DAPI (4',6-Diamidino-2-Phenylindole, Dilactate) | Thermo Fisher Scientific | D3571 | Used in IF studies for staining DNA/nucleus |
| Kit/reagent | HisPurä Cobalt Resin | Thermo Scientific | 89964 | |
| Kit/reagent | Glutathione Sepharoseâ 4B | Sigma-Aldrich | GE17-0756-04 | |
| Chemical compound | Protease inhibitor cocktail | Roche | 11873580001 | |
| Chemical compound | Tyr phosphatase inhibitor cocktail | Sigma-Aldrich | P5726 | |
| Chemical compound | Ser/Thr phosphatase inhibitor cocktail | Sigma-Aldrich | P0044 | |
| Other | PVDF Transfer Membrane, 0.45 mM | Thermo Scientific | 88518 | Used for transfer in immunoblots |
| Commercial assay or kit | Countess II Automated Cell Counter | Thermo Fisher Scientific | AMQAX1000 | |
| Commercial assay or kit | Leica TCS SPE Confocal | Leica Microsystems | TCS SPE | |
| Commercial assay or kit | Light Microscope (brightfield images) | Carl Zeiss LLC | Axio Observer, Inverted; 491917-0001-000 | |
| Software | ImageJ | National Institute of Health | https://imagej.net/Welcome | |
| Software | Prism | GraphPad | https://www.graphpad.com/scientific-software/prism/ | |
| Software | LAS-X | Leica | https://www.leica-microsystems.com/products/microscope-software/p/leica-las-x-ls | |
| Software | Illustrator | Adobe | https://www.adobe.com/products/illustrator.html | |
| Software | ImageStudio Lite | LI-COR | https://www.licor.com/bio/image-studio-lite/ |
Additional files
Download links
A two-part list of links to download the article, or parts of the article, in various formats.
Downloads (link to download the article as PDF)
Open citations (links to open the citations from this article in various online reference manager services)
Cite this article (links to download the citations from this article in formats compatible with various reference manager tools)
GIV/Girdin, a non-receptor modulator for Gαi/s, regulates spatiotemporal signaling during sperm capacitation and is required for male fertility
eLife 10:e69160.
https://doi.org/10.7554/eLife.69160


