Long non-coding RNA Neat1 and paraspeckle components are translational regulators in hypoxia
- UMR 1297-I2MC, Inserm, Université de Toulouse, France
- UMR 1301-RESTORE, Inserm, CNRS 5070, Etablissement Français du Sang-Occitanie (EFS), National Veterinary School of Toulouse (ENVT), Université de Toulouse, France
- UMR5535 CNRS-IGMM, Université de Montpellier, France
- Institut de Pharmacologie et Biologie Structurale (IPBS), Université de Toulouse, CNRS, France
- Molecular, Cellular and Developmental Biology Unit (MCD), Centre de Biologie Intégrative (CBI), Université de Toulouse, France
Figures
Figure 1 with 3 supplements
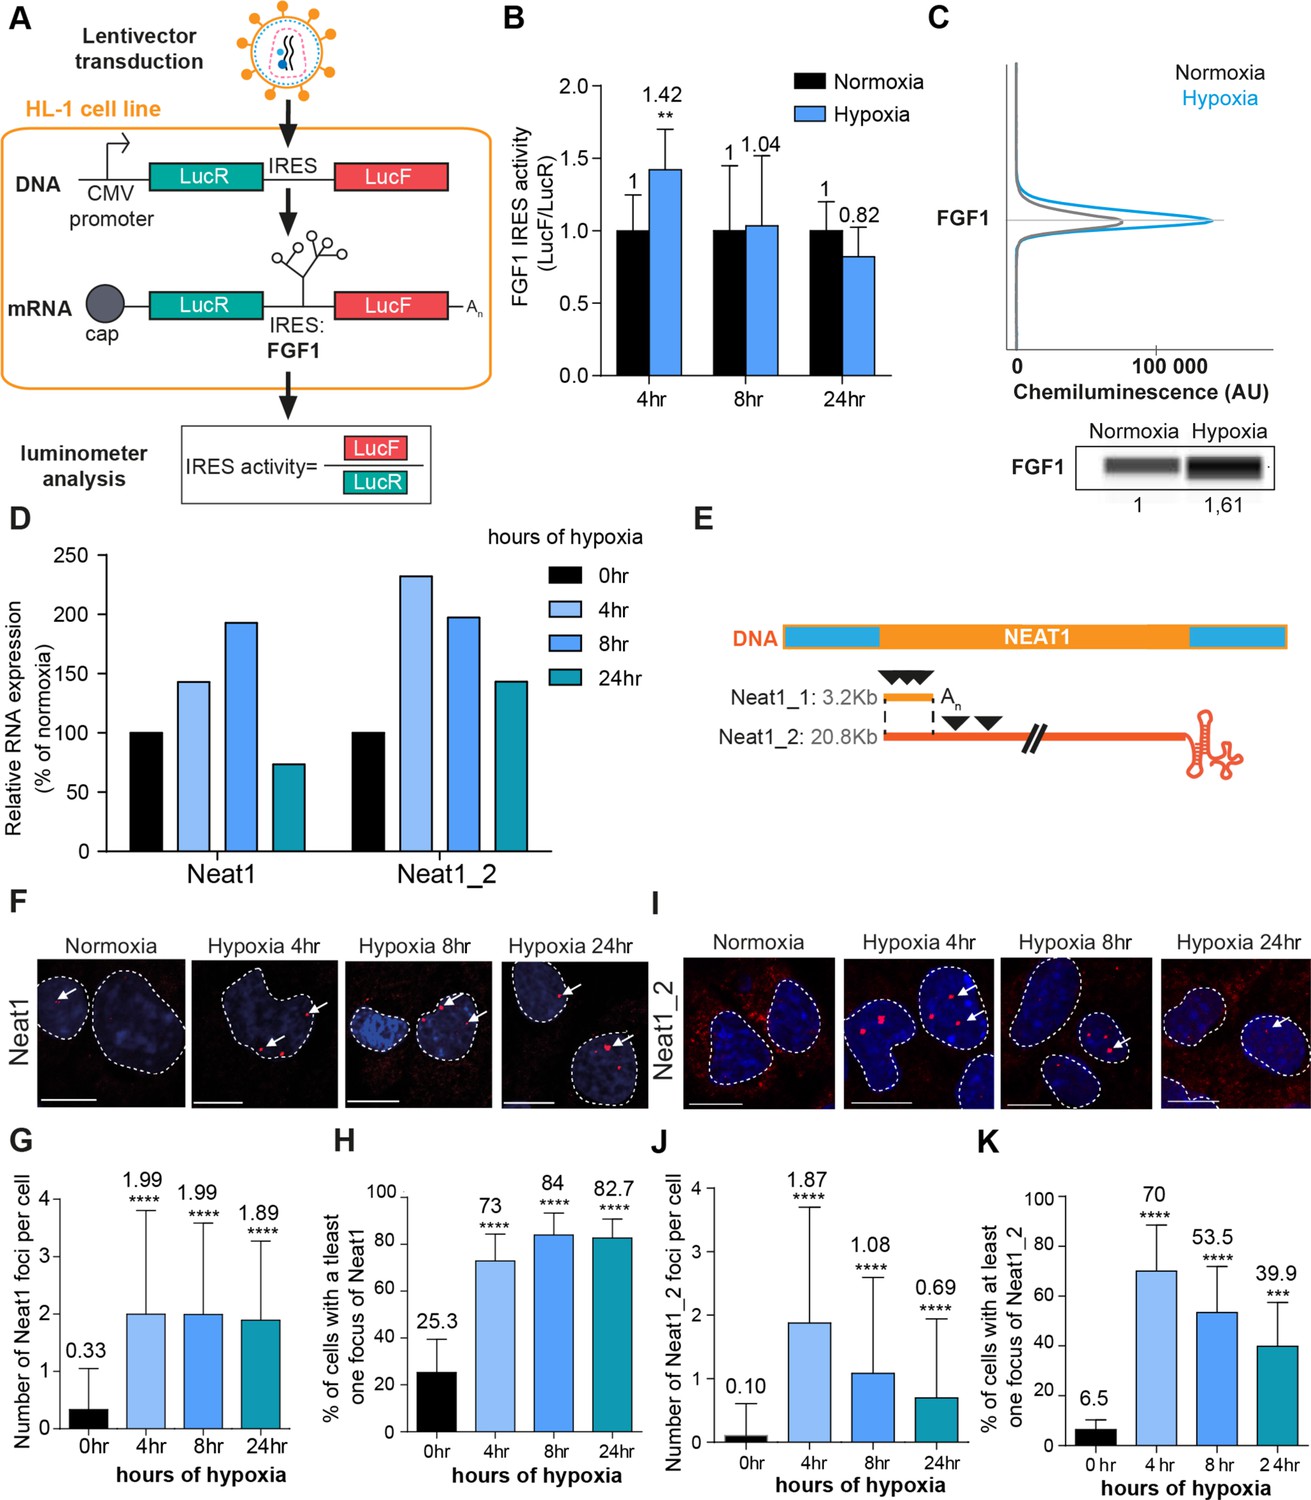
FGF1 IRES activation during hypoxia correlates with Neat1 induction and paraspeckle formation.
(A) Schema depicting the Lucky Luke bicistronic construct and HL-1 cells transduced by a lentivector carrying the transgene. The LucF/LucR ratio indicates the IRES activity. (B) Activity of the human FGF1 IRES in HL-1 cardiomyocytes at 4 hr, 8 hr, or 24 hr of hypoxia normalized to normoxia. The corresponding luciferase values are presented in Figure 1—figure supplement 1, Supplementary file 1. (C) Detection of endogenous mouse FGF1 by capillary Simple Western in normoxic and hypoxic (2 hr) cardiomyocytes. The curve corresponds to the chemiluminescence signal detected with FGF1 antibody. A numerical blot is represented. Below the blot is shown the quantification of FGF1 normalized to total proteins and to control gapmer. Total proteins are detected by a dedicated channel in capillary Simple Western. The full raw unedited gel is provided in Figure 1—figure supplement 1 (Figure 1—figure supplement 1—source data 1). (D) HL-1 cells were subjected to normoxia (0 hr) or to hypoxia during 4 hr, 8 hr, and 24 hr. Neat1 and Neat1_2 expression was analyzed by droplet digital PCR (Primer sequences in Supplementary file 2). RNA expression is normalized to the normoxia time point. (E) Schema depicting the Neat1 mouse gene and the Neat1_1 and Neat1_2 RNA isoform carrying a poly(A) tail or a triple helix, respectively. Black arrowheads represent FISH probes against Neat1 and Neat1_2 (sequences in Supplementary file 2). (F–K) Neat1 (F) or Neat1_2 (I) FISH labeling in HL-1 cardiomyocytes in normoxia or at 4 hr, 8 hr, and 24 hr of 1% O2. DAPI staining is represented in blue and Neat1 or Neat1_2 cy3 labeling in red. Nuclei are delimited by dotted lines. Scale bar = 10 µm. Larger fields are presented in Figure 1—figure supplement 2. (G and J) Quantification of Neat1 (G) or Neat1_2 (J) foci per cell by automated counting (ImageJ). (H and K) Percentage of cell harboring at least one focus of Neat1 (H) or Neat1_2 (K); Histograms correspond to means ± standard deviation, with Mann-Whitney (n=12) (B) or one-way ANOVA (G-H, n=269–453) and (J-K, n=342–499); **p<0.01, ***<0.001, ****p<0.0001.
Figure 1—figure supplement 1
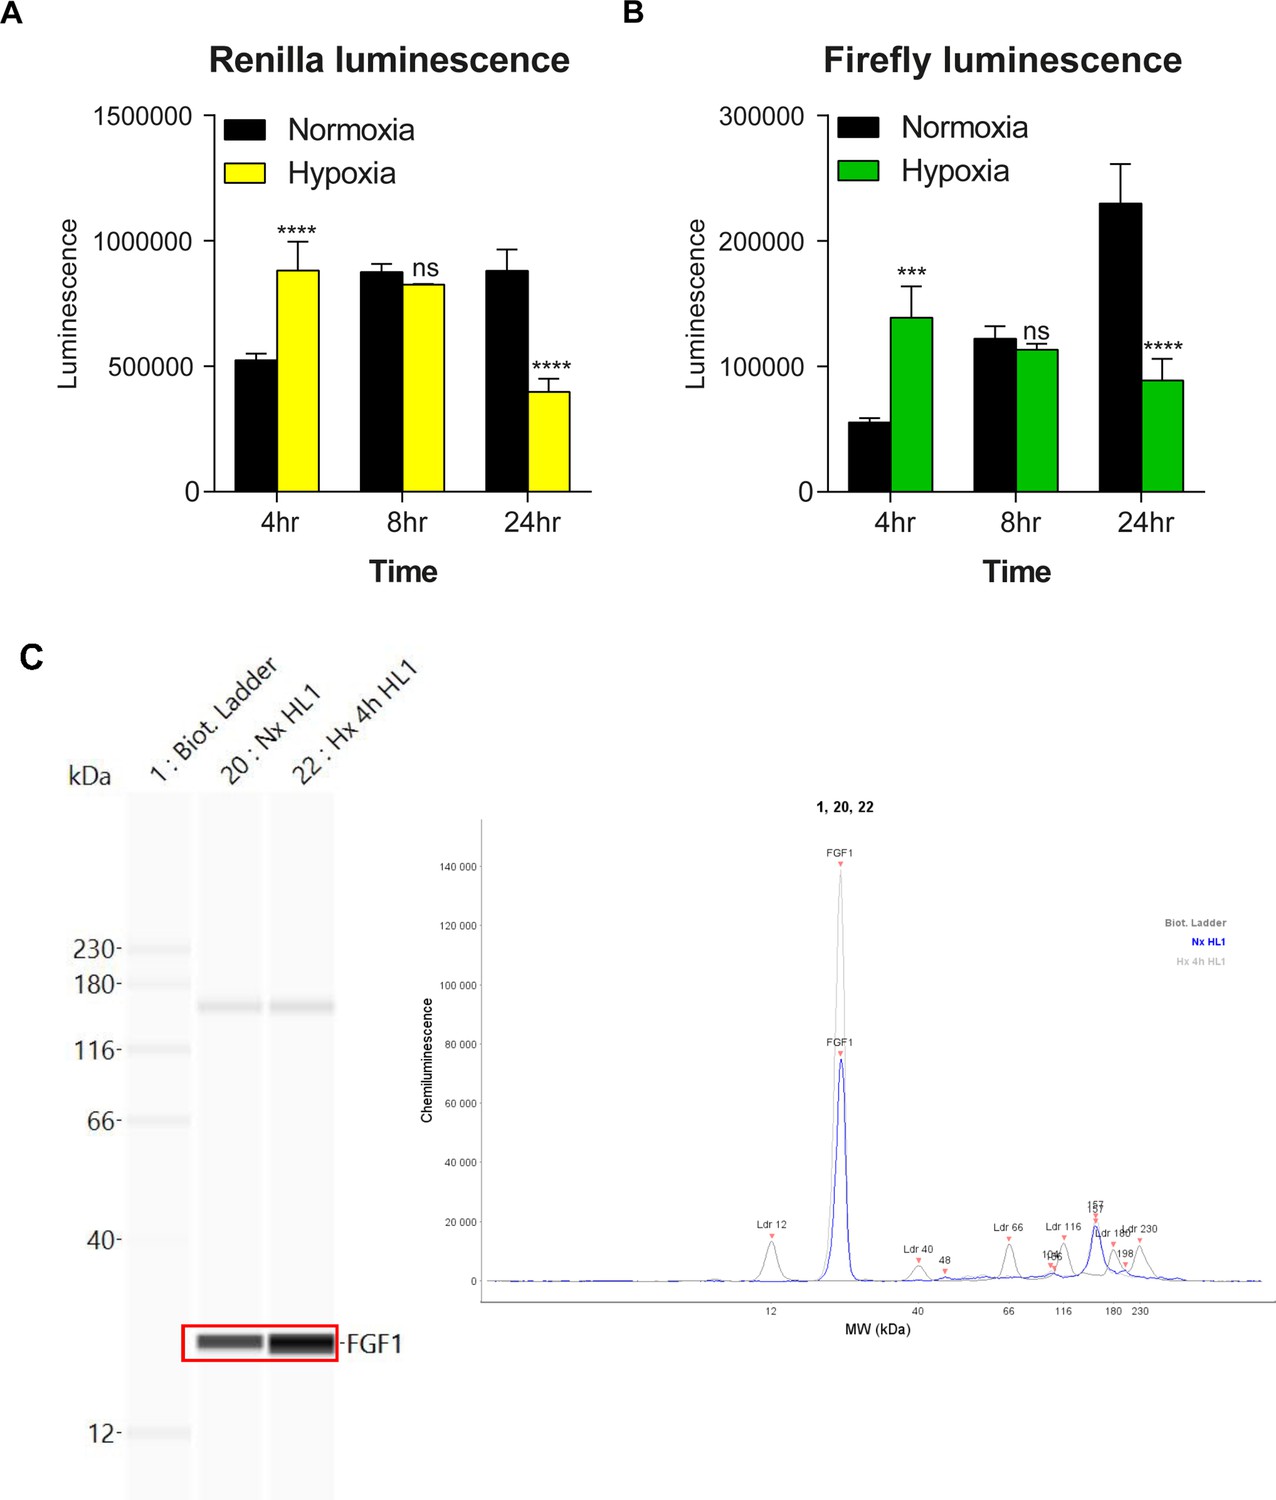
Bicistronic vector LucR and LucF expression and endogenous FGF1 protein expression in hypoxic HL-1 cells.
Renilla (A) and firefly (B) luciferase activities were measured in HL-1 cardiomyocytes transduced by the bicistronic vector with the FGF1 IRES, after 4 hr, 8 hr, or 24 hr of hypoxia or normoxia. The experiments were performed with triplicates from four distinct transduced cell samples (Supplementary file 1). The graphs show a representative triplicate experiment. (C) Raw gel and chemiluminescence curve of endogenous FGF1 expression analyzed by capillary Simple Western. Source data of the capillary Simple Western are provided (Figure 1—figure supplement 1—source data 1).
-
Figure 1—figure supplement 1—source data 1
- https://cdn.elifesciences.org/articles/69162/elife-69162-fig1-figsupp1-data1-v2.zip
Figure 1—figure supplement 2
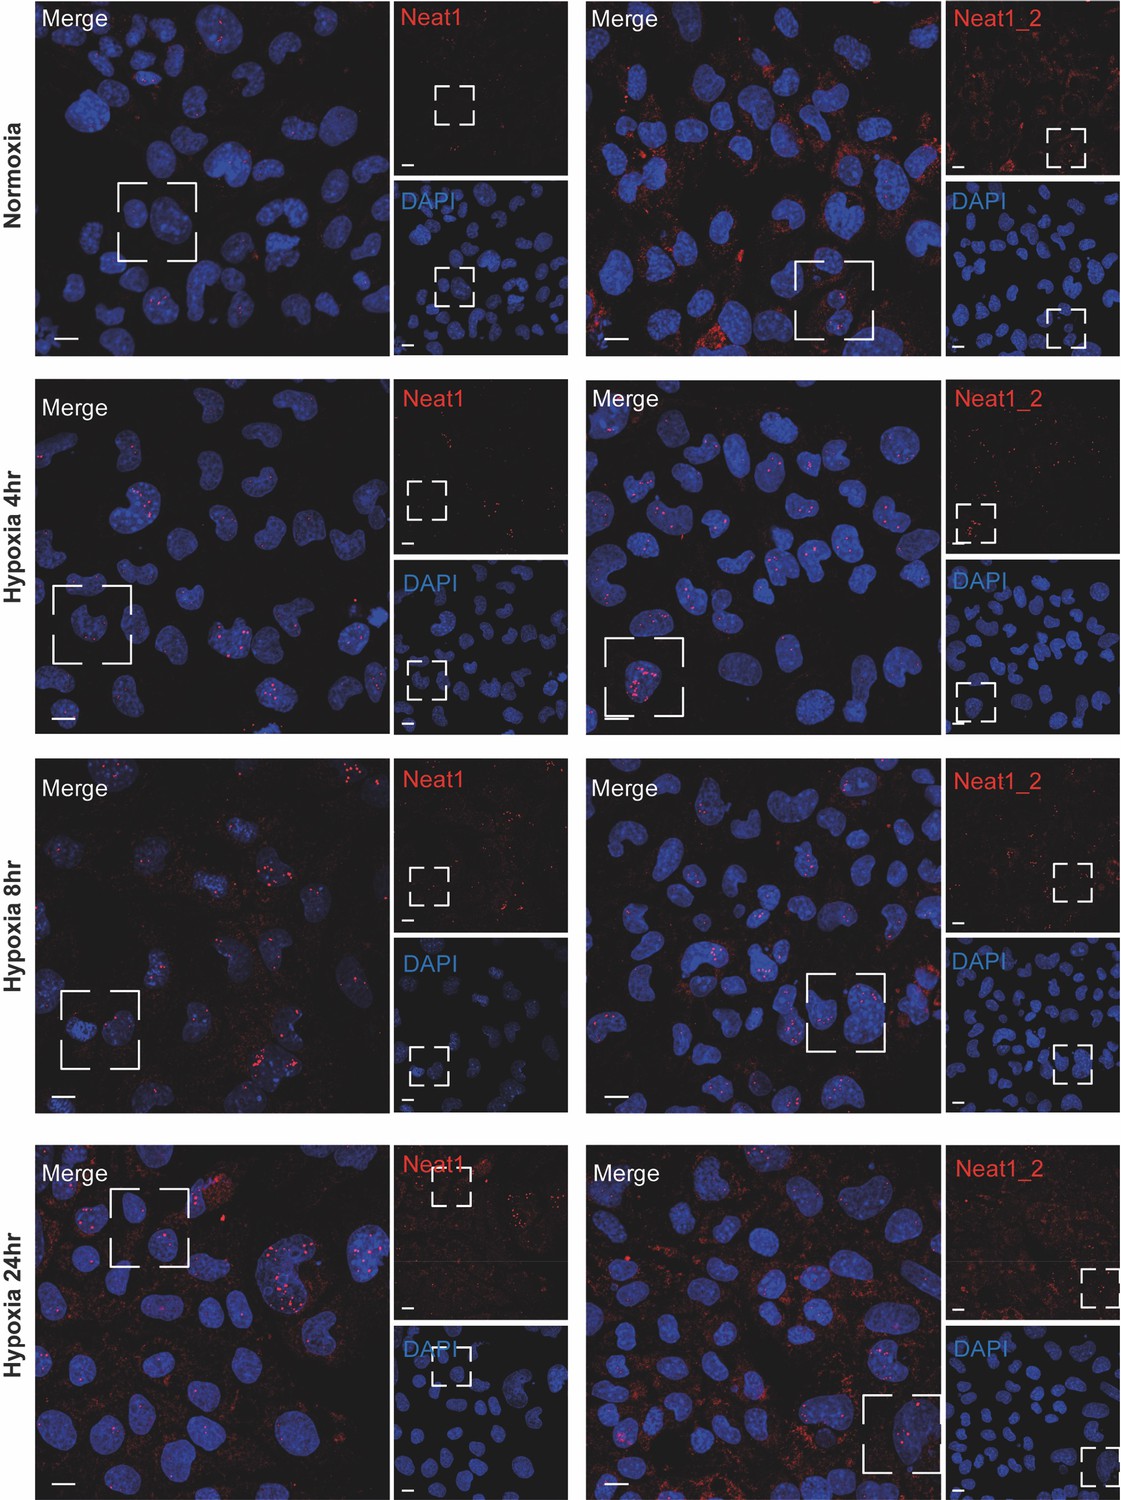
Detection of Neat1 and Neat1_2 in hypoxic HL-1 by FISH.
FISH experiment with representative images of Neat1 (both isoforms)(left panels) or Neat1_2 isoform (right panels) in normoxia and hypoxia at 4 hr, 8 hr, 24 hr in HL-1 cardiomyocytes. DAPI, Neat1 cy3 or Neat1_2 cy3 labelling and merge. The open square represents magnified zones presented in Figure 1F and I. Scale bar: 10µm.
Figure 1—figure supplement 3
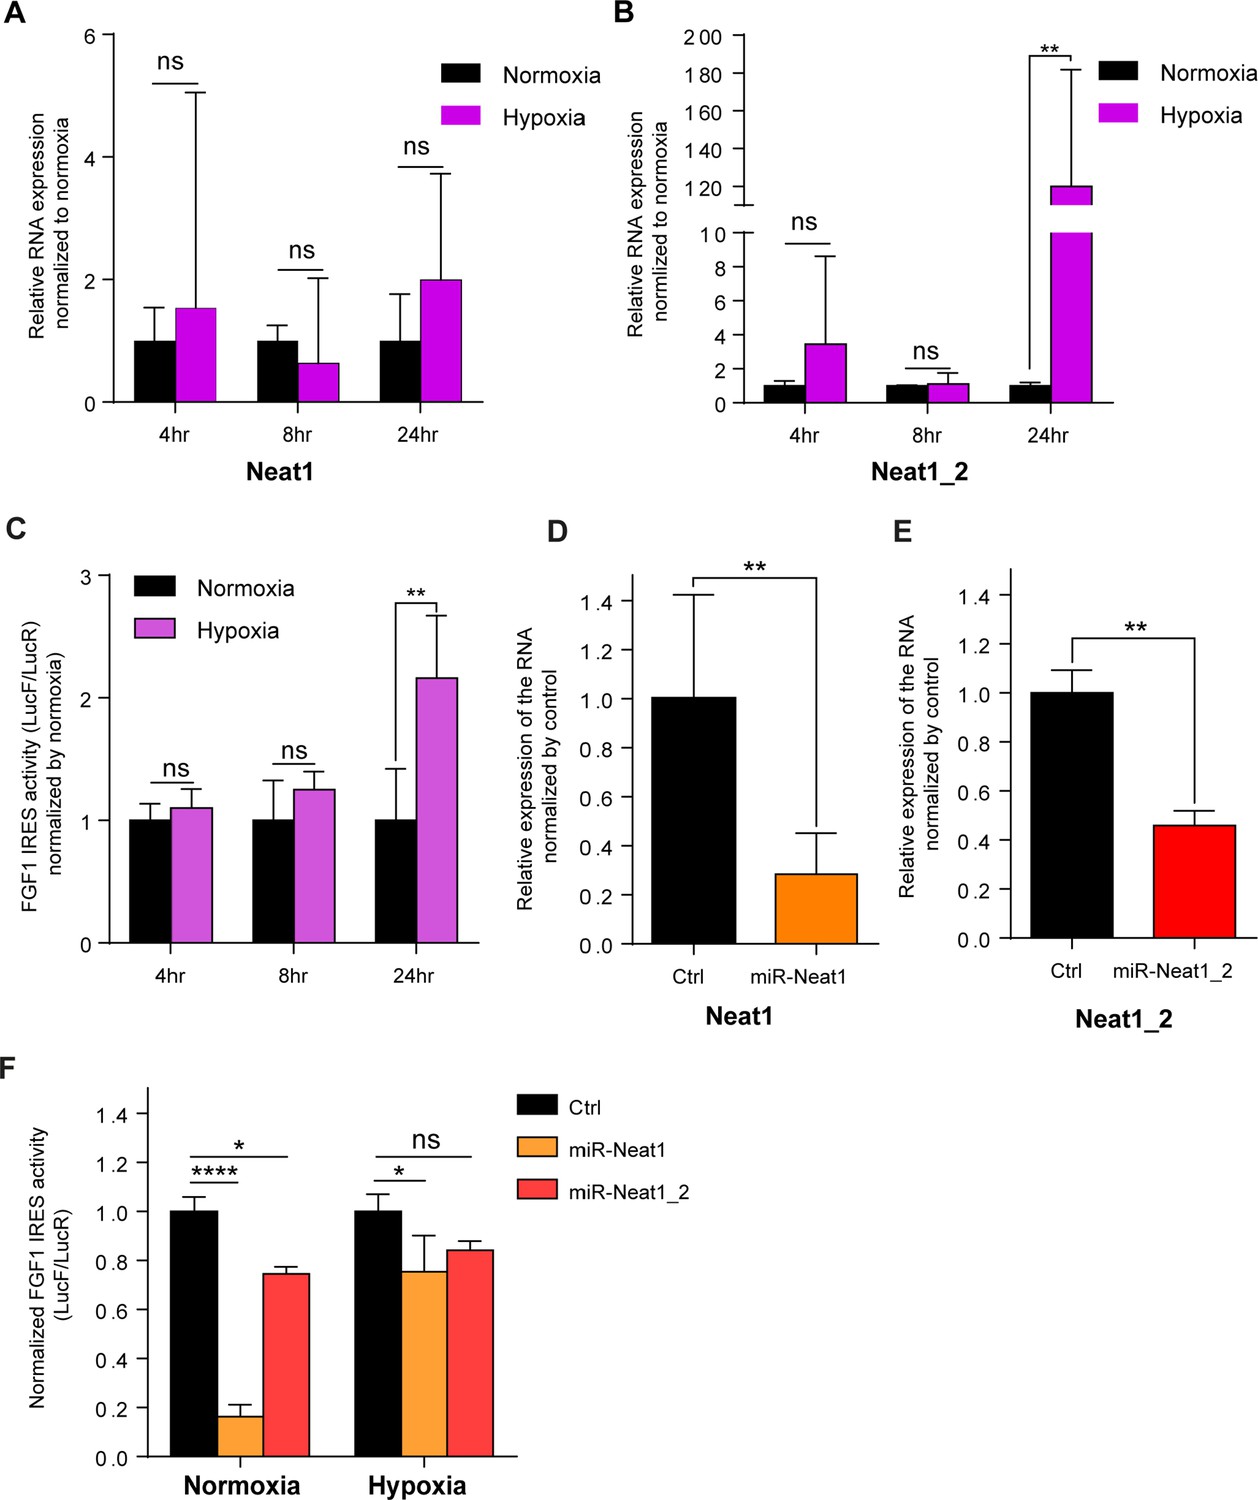
FGF1 IRES is activated by hypoxia in correlation with Neat1 induction in 67NR cells and inactivated after Neat1 knock-down.
(A–B) 67NR cells (mouse breast cancer) were subjected to normoxia (0 hr) or to hypoxia (1% 02) during 4 hr, 8 hr and 24 hr. Neat1 (A) or Neat1_2 (B) expression was analyzed by RT qPCR (Primer sequences in Supplementary file 2). RNA expression is normalized to normoxia time point. (C) Activity of the human FGF1 IRES in 67NR cells at 4 hr, 8 hr, or 24 hr of hypoxia normalized to normoxia. (D–E) Neat1 or Neat1_2 knock-down obtained by transduction of 67NR cells with lentivectors expressing an artificial miRNA targeting Neat1 (miR-Neat1, D) or Neat1_2 (miR-Neat1_2, E). To knock down Neat1_2, a pool of two lentivectors coding two different miRNAs was used (sequences in Supplementary file 2). (C) Activity of the human FGF1 IRES in 67NR cells transduced with lentivector miR-Neat1 or miR-Neat1_2 and submitted to normoxia or 24 hr of hypoxia 1% O2. Statistics were performed by two-way ANOVA with multiple comparison Dunnet test. Normoxia versus hypoxia for each time. *p<0.05, **p<0.005, ***p<0.0005, ****p<0.0001.
Figure 2 with 6 supplements
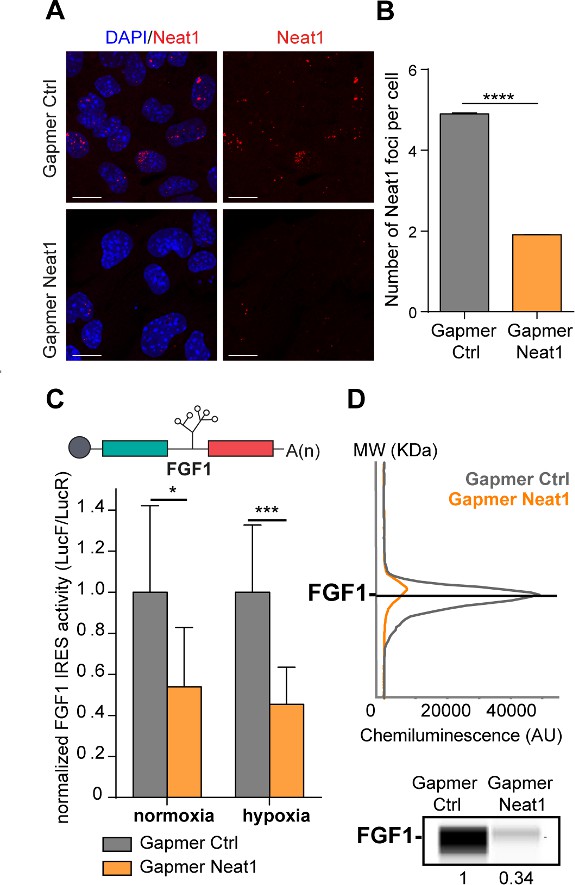
LncRNA Neat1 knock-down drastically affects the FGF1 IRES activity and endogenous FGF1 expression.
(A) SmiFISH imaging of Neat1 knock-down by a pool of LNA gapmers targeting both isoforms (Sequences in Supplementary file 2C). Cells were treated during 48 hr with the gapmers. Scale bar = 10 µm. (B) Neat1 foci counting per cell for the control gapmer and Neat1 LNA gapmer pool, using unpaired two-tailed student t-test with n=249 for control and 187 for Neat1 LNA gapmer. (C) FGF1 IRES activities in HL-1 cells transduced with Lucky Luke bicistronic reporter and treated with gapmer Neat1 or control during normoxia or hypoxia (1% O2). Histograms correspond to means ± standard deviation of the mean. Non-parametric Mann-Whitney test was performed with n=9. *p<0.05, ***<0.001, ****p<0.0001. The mean has been calculated with nine cell culture biological replicates, each of them being already the mean of three technical replicates (27 technical replicates in total). Detailed values of biological replicates are presented in Supplementary file 3. (D) Detection of endogenous mouse FGF1 by capillary Simple Western. The curve corresponds to the chemiluminescence signal detected with FGF1 antibody. A numerical blot is represented. Below the blot is shown the quantification of FGF1 normalized to total proteins and to control gapmer. The source data of the capillary Simple Western are provided in Figure 2—figure supplement 2. Total proteins are detected by a dedicated channel in capillary Simple Western.
Figure 2—figure supplement 1
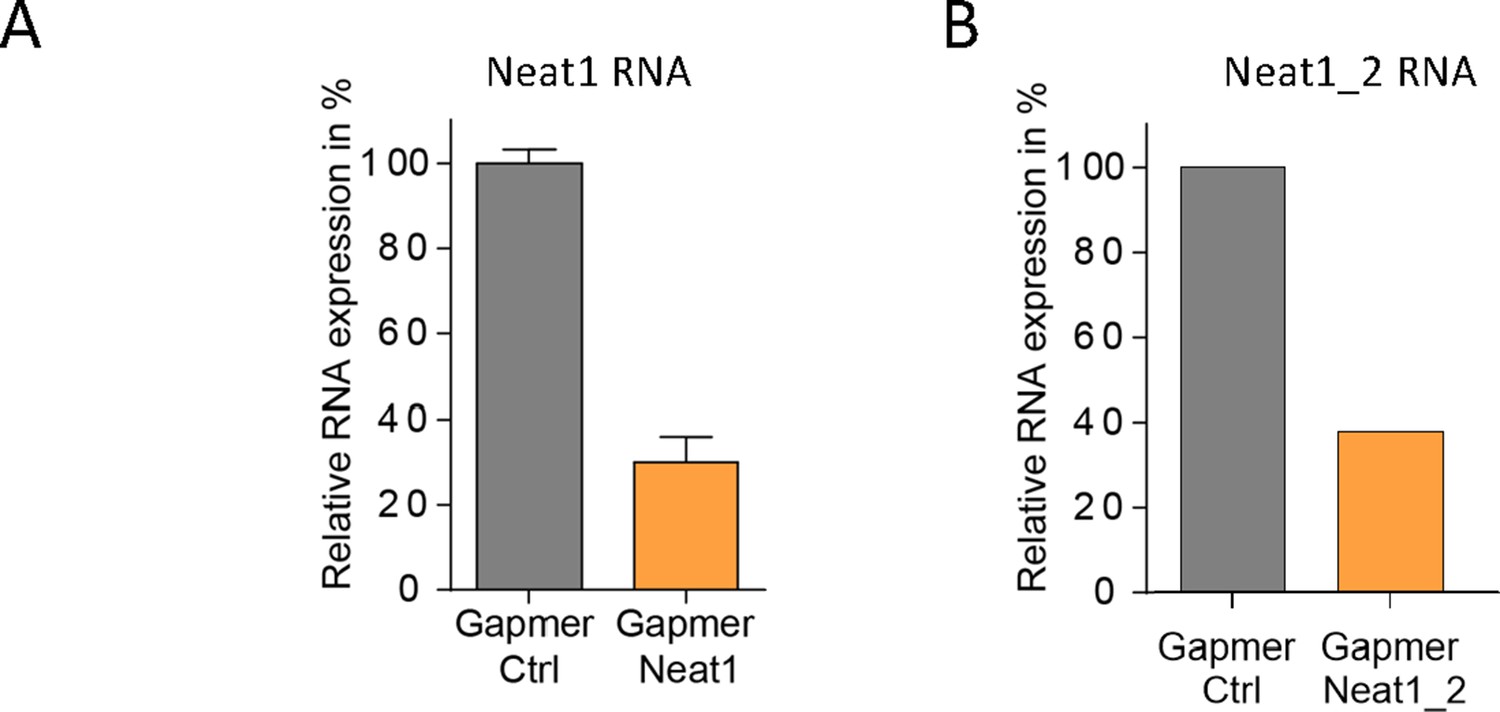
Knock-down of Neat1 and Neat1_2 in HL-1 cardiomyocytes.
Neat1 knock-down was performed in HL-1 cells using pooled LNA gapmers against Neat1 (48 hr)(A) or Neat1_2 (72 hr)(B). Neat1 and Neat1_2 RNA expression was measured by droplet digital PCR and normalized to gapmer control (Ctrl) at 100% expression.
Figure 2—figure supplement 2
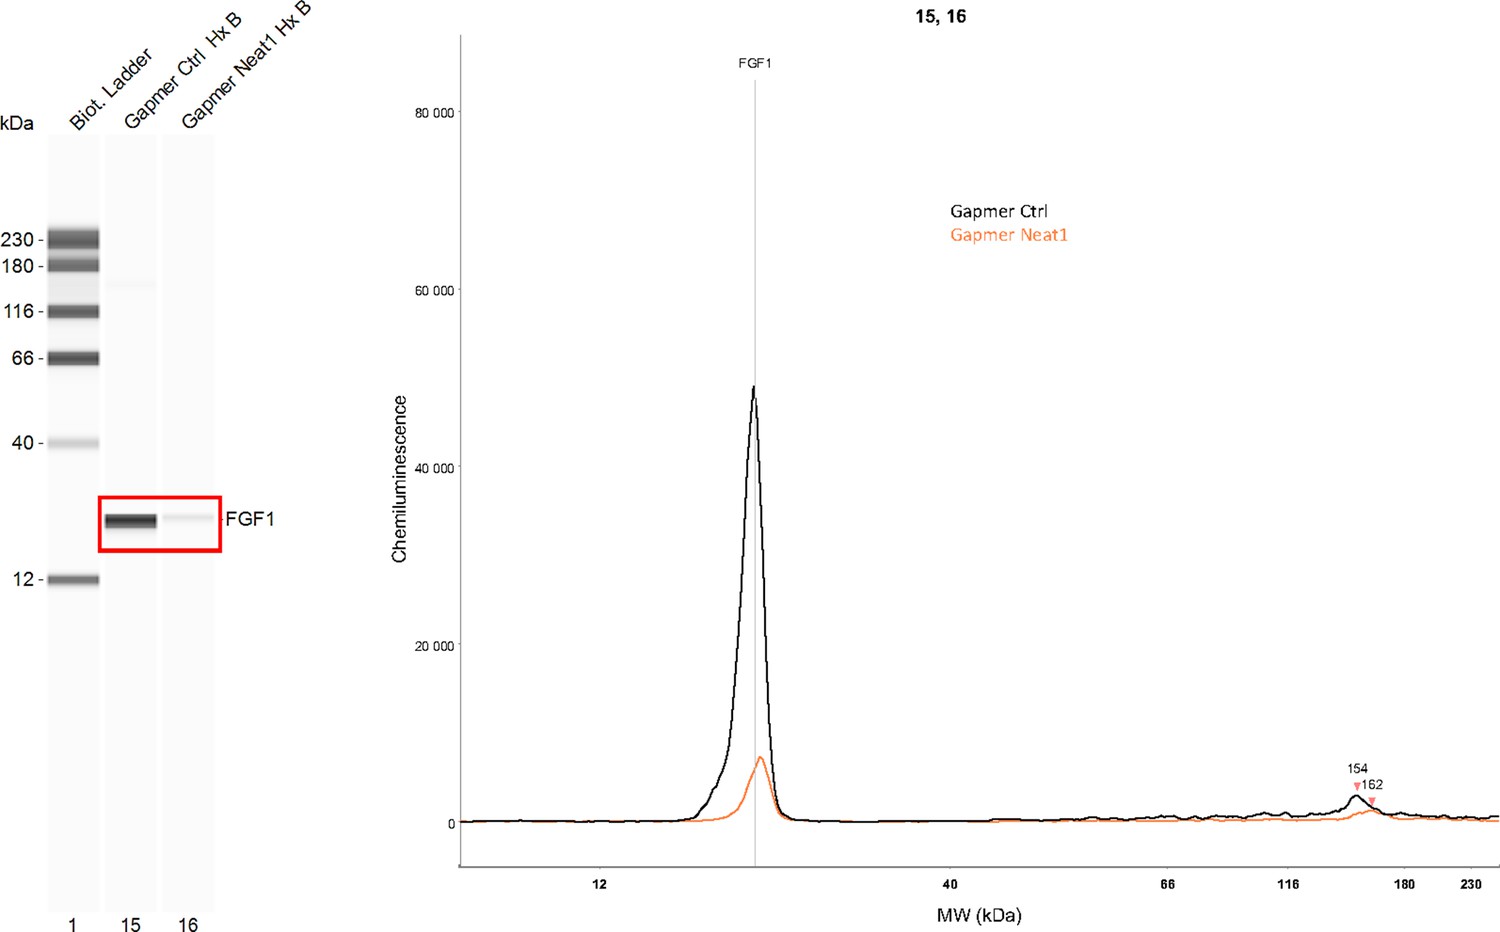
Effect of Neat1 knock-down on endogenous FGF1 protein expression.
Endogenous mouse FGF1 was detected using anti-FGF1 antibody in hypoxic HL-1 cells treated either by control gapmer (ctrl) or Neat1_2 gapmer by capillary Simple Western. The source data of the capillary Simple Western are presented (Figure 2—figure supplement 2—source data 1). The curve corresponds to the chemiluminescence signal detected with FGF1 antibody.
-
Figure 2—figure supplement 2—source data 1
- https://cdn.elifesciences.org/articles/69162/elife-69162-fig2-figsupp2-data1-v2.zip
Figure 2—figure supplement 3
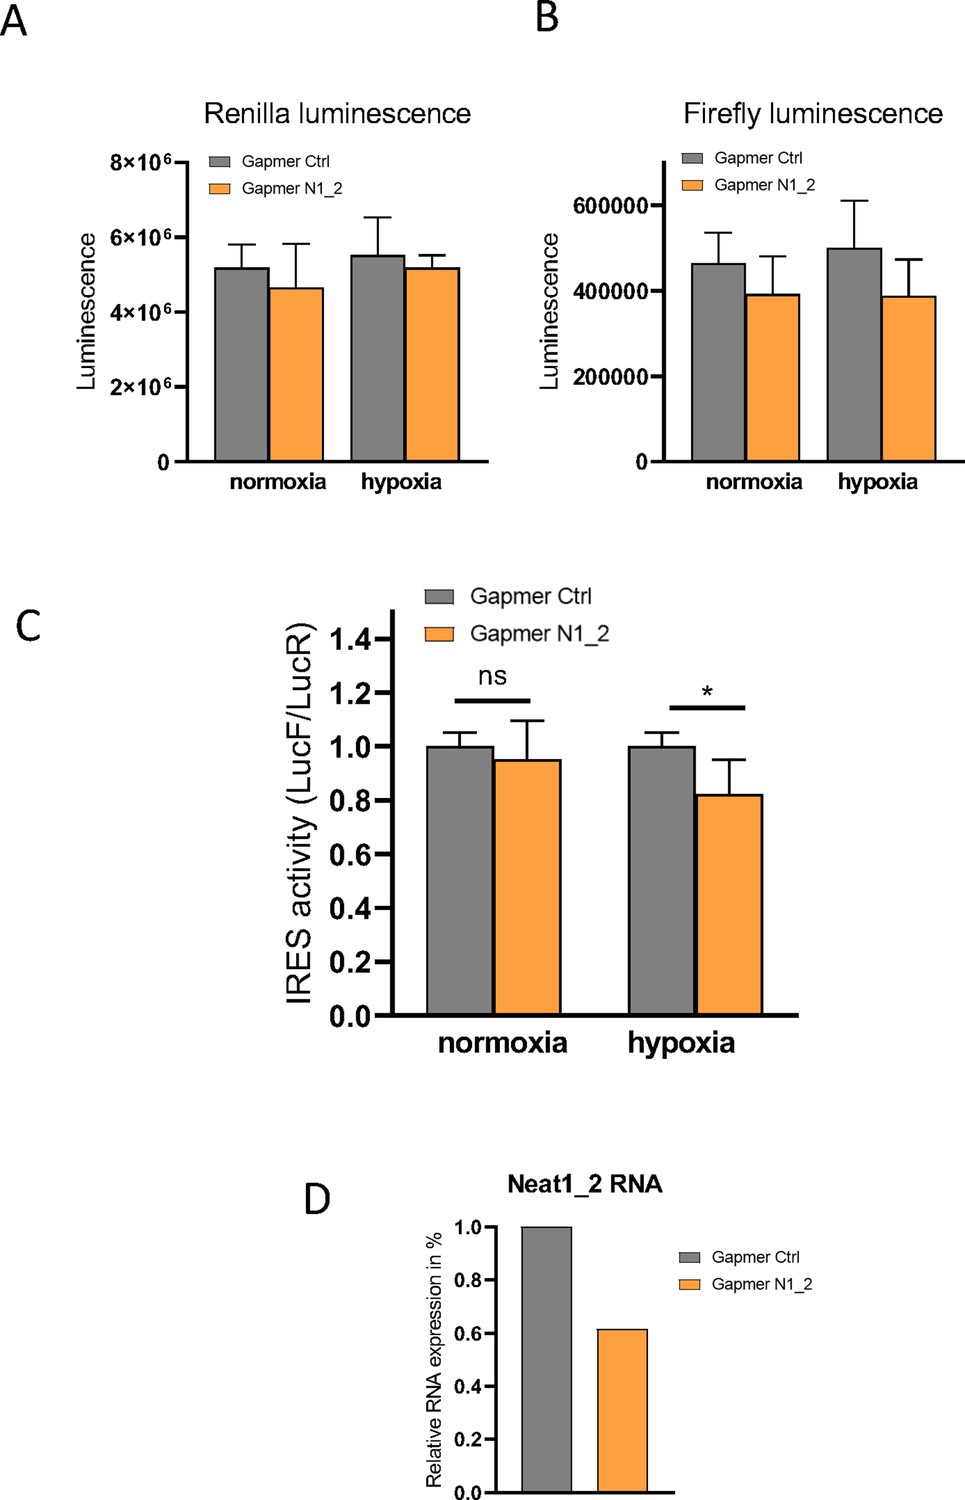
Effect of Neat 1_2 knock-down on FGF1 IRES activity.
Neat1-2 knock-down was performed in HL-1 cells transduced by the bicistronic lentivector with the FGF1 IRES during normoxia or hypoxia (1% O2). Luciferase activities as well as the LucF/LucR ratios (defined as IRES activities) are presented. (A–B) LucR and LucF activities. (C) FGF1 IRES activities. (D) Neat1_2 RNA expression was measured by RT-qPCR and normalized to control gapmer.
Figure 2—figure supplement 4
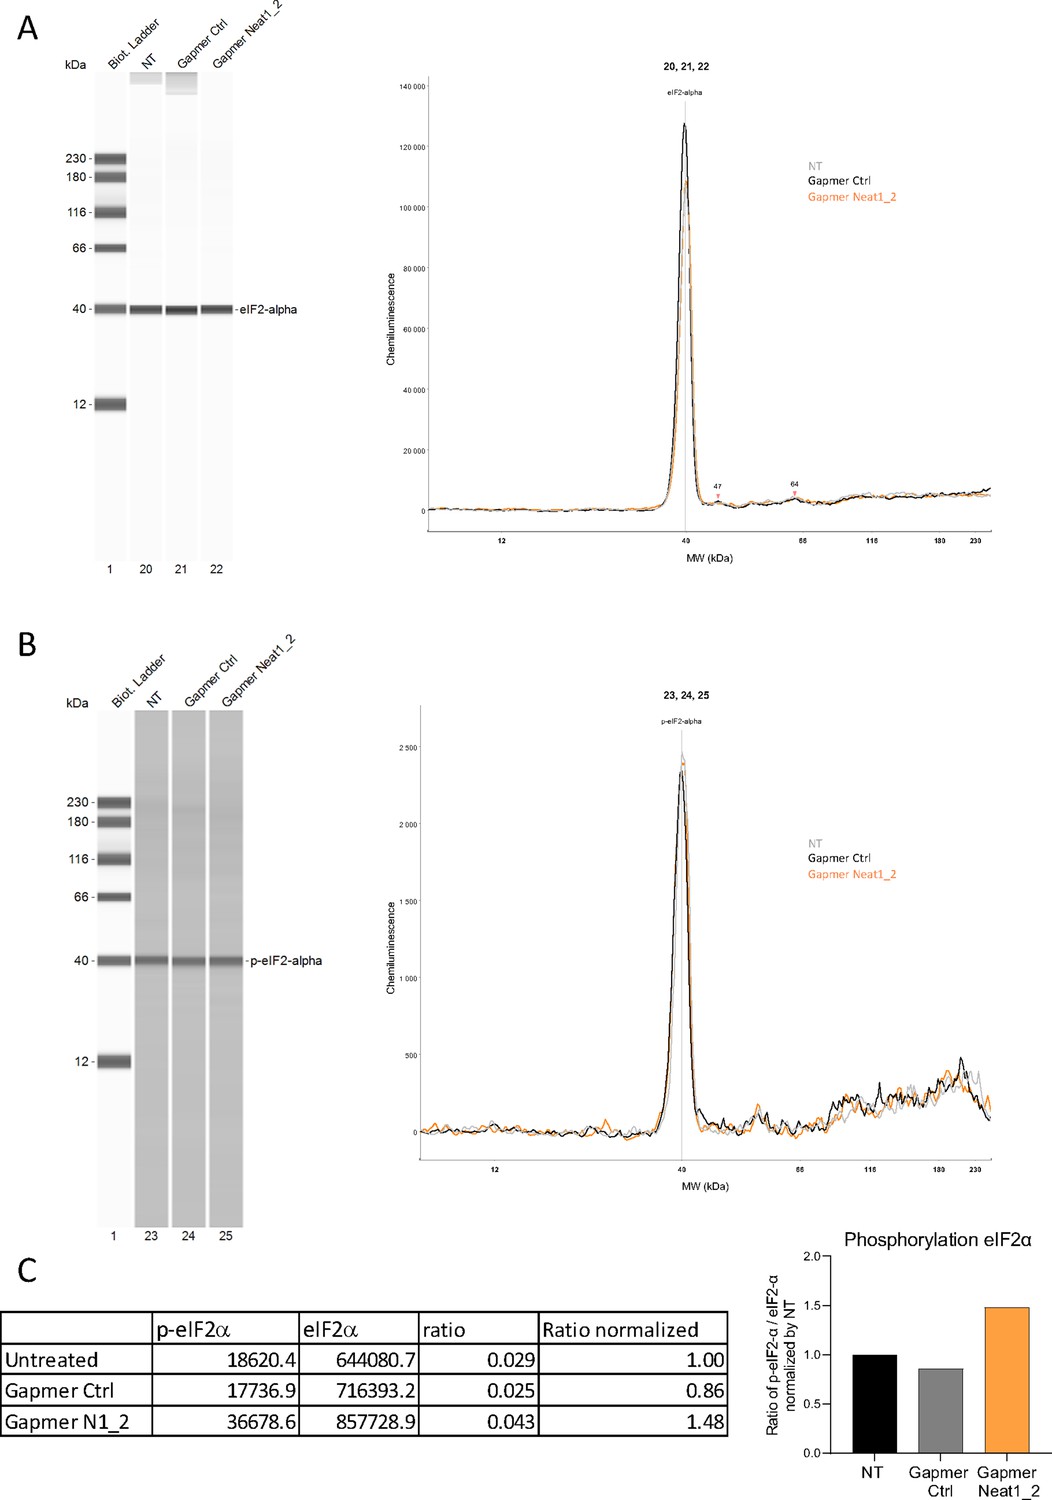
Effect of Neat1_2 knock-down on eIF2α phosphorylation.
Expression and phosphorylation of eIF2α in HL-1 cells either untreated (NT) or treated by control gapmer (ctrl) or Neat1_2 gapmer were measured using anti-eIF2α (A) and anti-phospho-eIF2α antibodies (B), respectively, by Jess capillary Simple Western, normalized to the Jess quantification of total proteins. The ratio p-eIF2α/ eIF2α was calculated and normalized by untreated cells (C) The source data of the capillary Simple Western are provided (Figure 2—figure supplement 4—source data 1).
-
Figure 2—figure supplement 4—source data 1
- https://cdn.elifesciences.org/articles/69162/elife-69162-fig2-figsupp4-data1-v2.zip
Figure 2—figure supplement 5
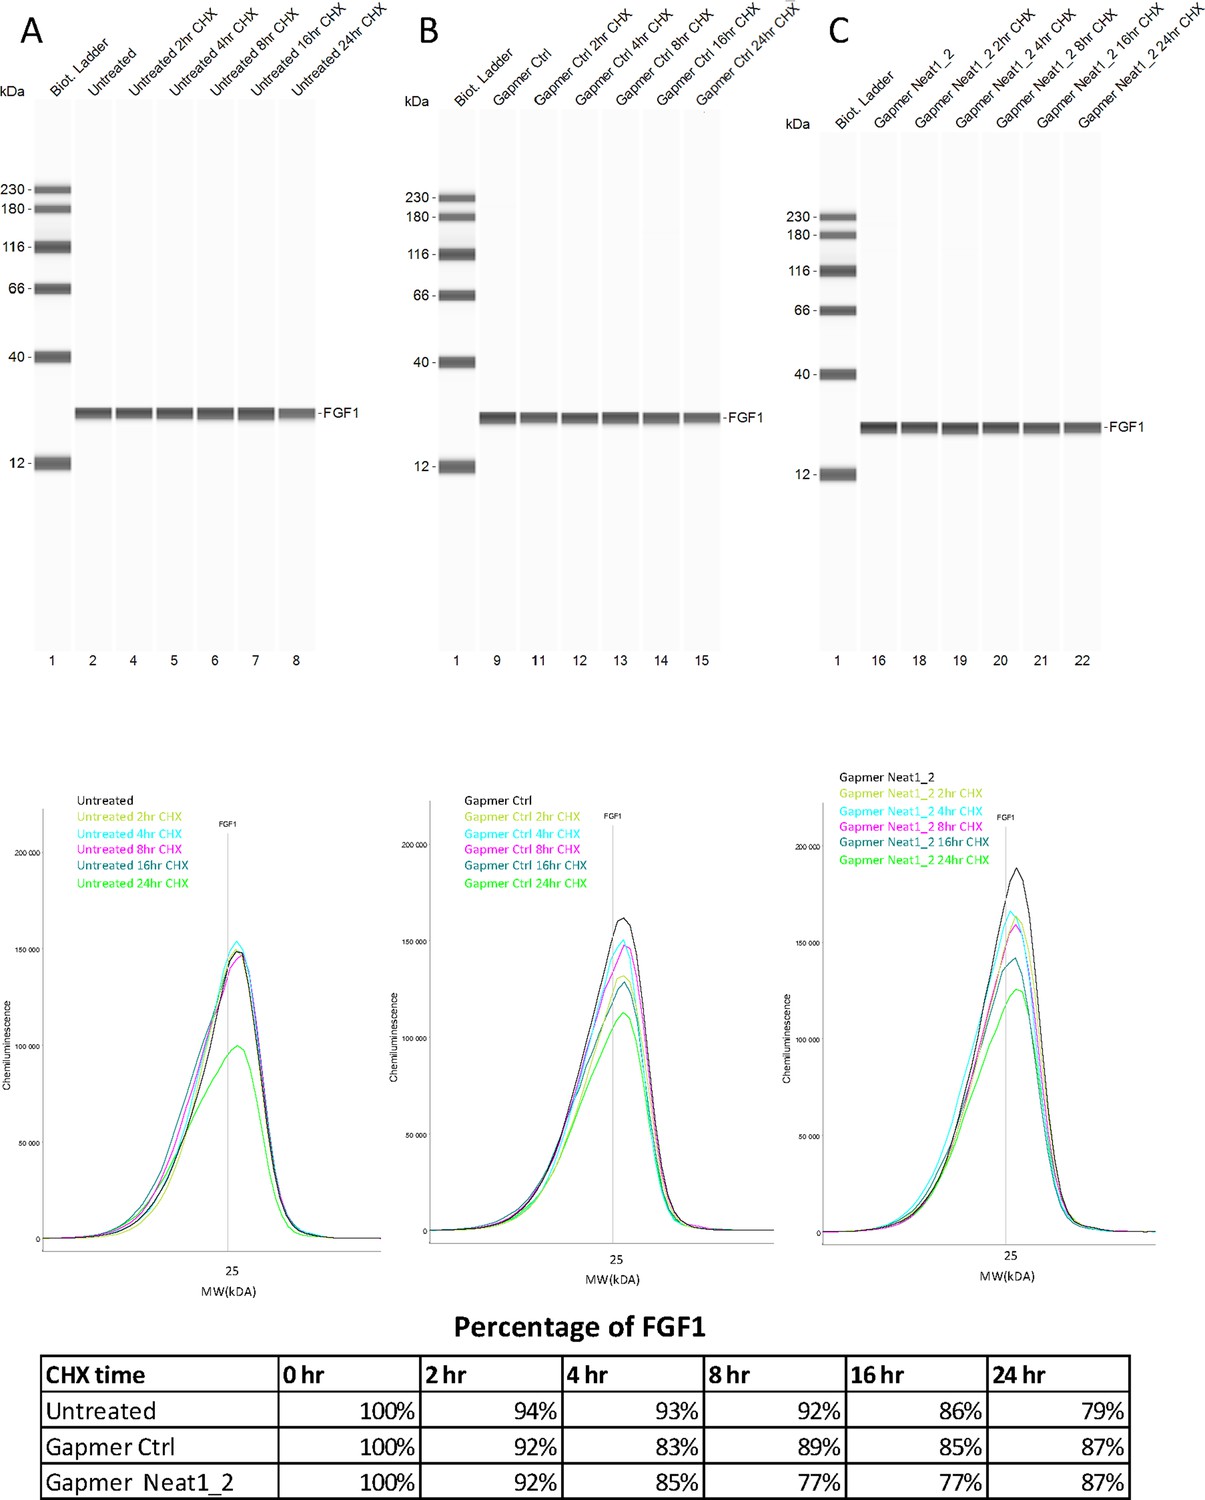
FGF1 half-life after Neat1_2 gapmer treatment.
(A–E) FGF1 half-life was determined in HL-1 cells treated with control gapmer, Neat1_2 gapmer or untreated. The half-life determination was performed by blocking protein synthesis with cycloheximide at 10 μg/mL, with time-course points at 0 hr, 2 hr, 4 hr, 8 hr, 16 hr, and 24 hr. FGF1 protein stability was measured bu capillary western. P21 was used as a control for its short half life (Figure 2—figure supplement 6). Capillary western are presented, showing FGF1 protein during the cycloheximide time course in HL-1 cells untreated (A), treated with gapmer control (B) or with gapmer Neat1_2. (C) Percentage of FGF1 is normalized to the 0 hr time course point. Source data of capillary Simple Western are provided (Figure 2—figure supplement 5—source data 1 and Figure 2—figure supplement 6—source data 1)
-
Figure 2—figure supplement 5—source data 1
- https://cdn.elifesciences.org/articles/69162/elife-69162-fig2-figsupp5-data1-v2.zip
Figure 2—figure supplement 6
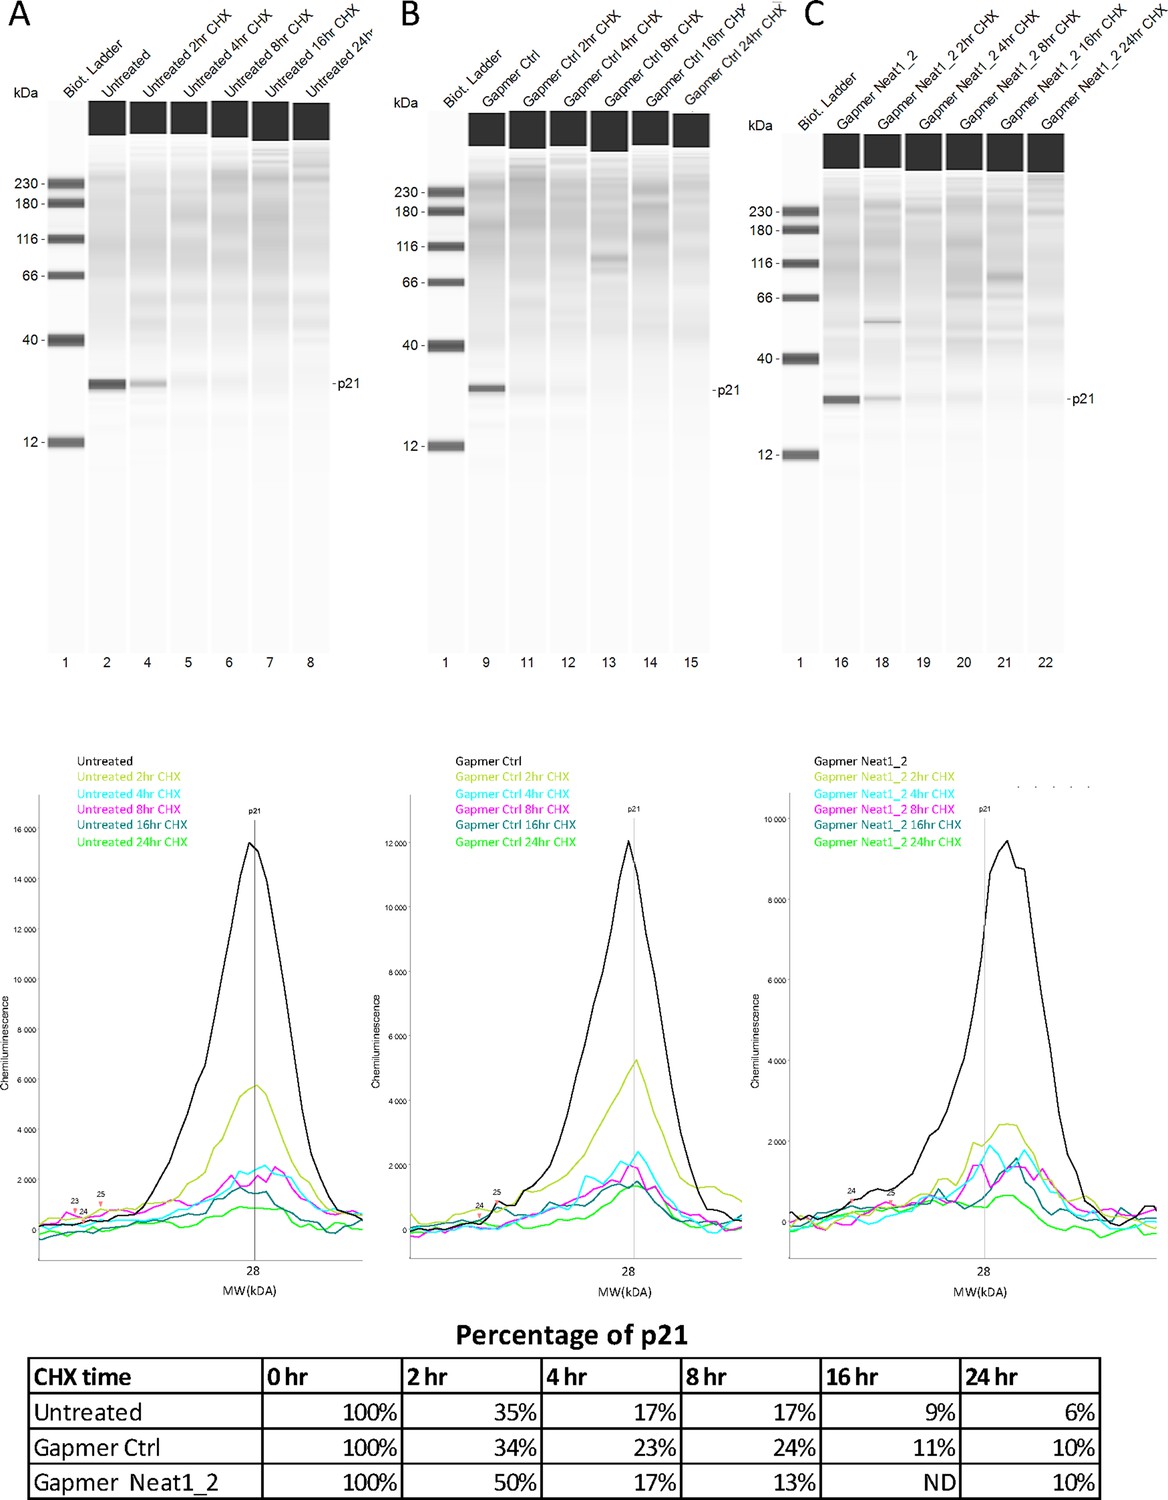
p21 half-life after Neat1_2 gapmer treatment.
(A–E) p21 half-life half-life was determined as a control in HL-1 cells treated with control gapmer, Neat1_2 gapmer or untreated, in the experiment shown in Figure 2—figure supplement 5. p21 protein stability was measured by capillary western, showing p21 protein level during the cycloheximide time course in HL-1 cells untreated (A) treated with gapmer control (B) or with gapmer Neat1_2. (C) Percentage of p21 is normalized to the 0 hr time course point. Source data of capillary Simple Western are provided (Figure 2—figure supplement 5—source data 1 and Figure 2—figure supplement 6—source data 1).
-
Figure 2—figure supplement 6—source data 1
- https://cdn.elifesciences.org/articles/69162/elife-69162-fig2-figsupp6-data1-v2.zip
Figure 3
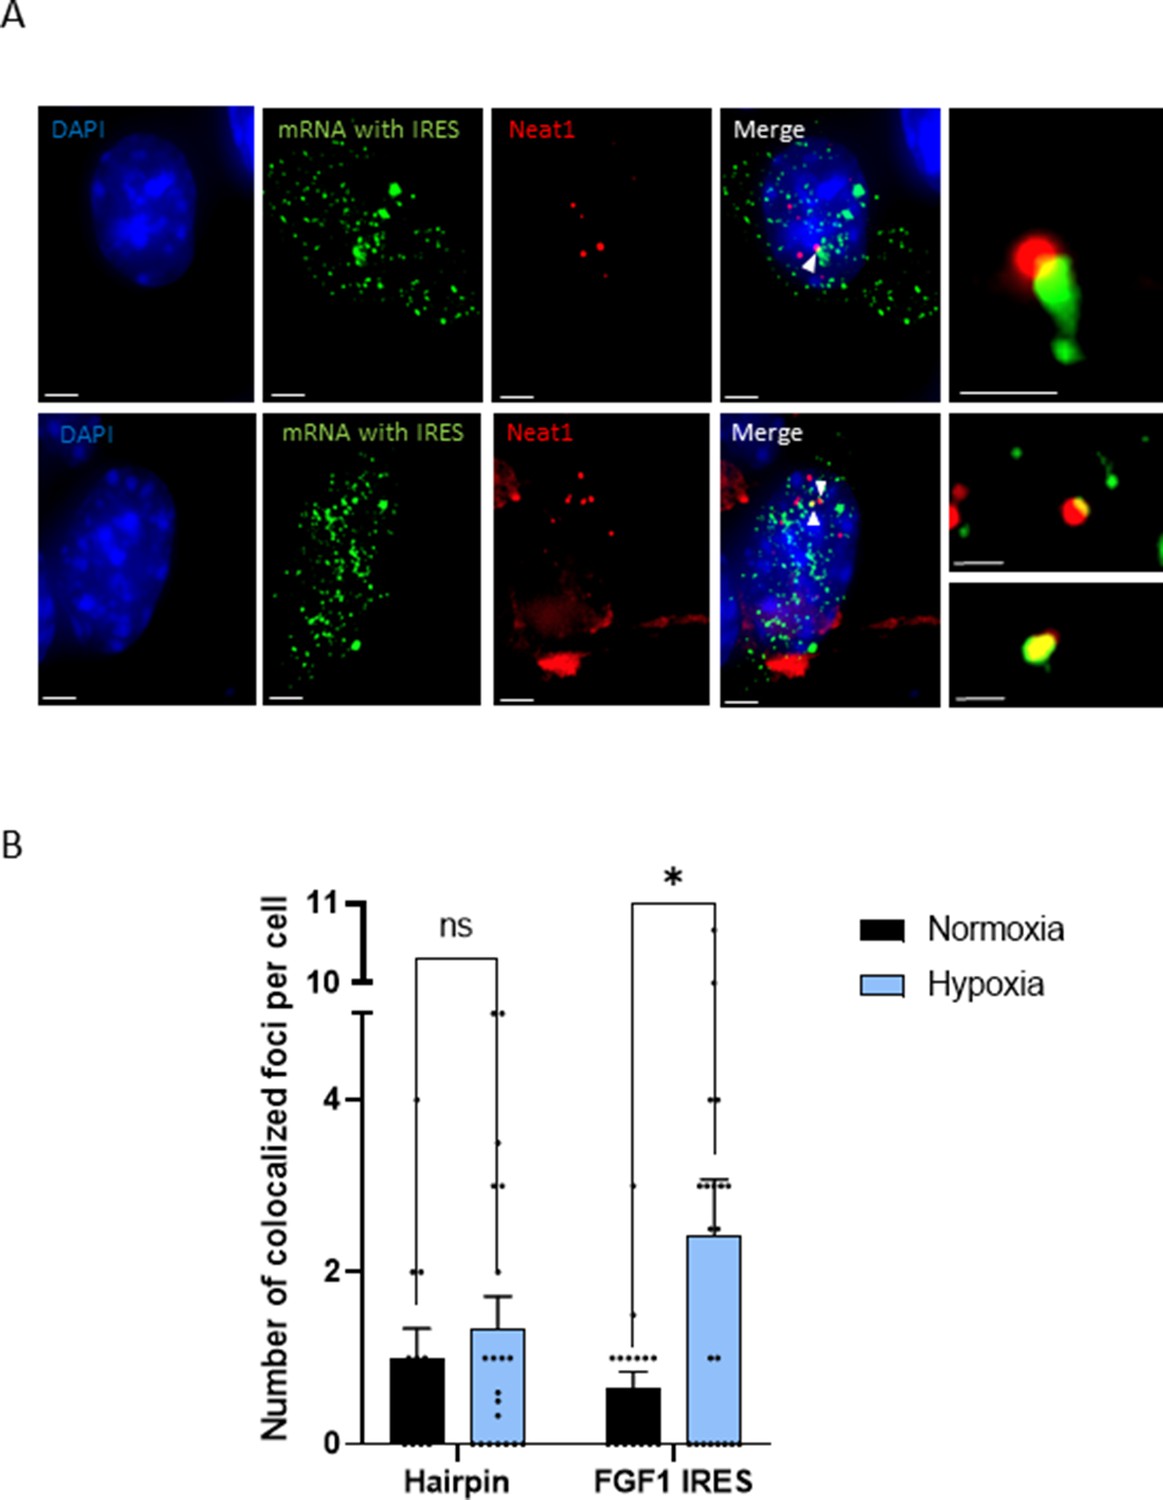
IRES-containing mRNA is colocalized with Neat1 in hypoxic HL-1 cells.
Cells were transduced with lentivectors carrying bicistronic Lucky Luke constructs with the FGF1 IRES or a hairpin (control), subjected or not to 4 hr hypoxia. SmiFISH experiments were performed. (A) SmiFISH images showing the bicistronic mRNA carrying the FGF1 IRES (green) colocalized with Neat1 RNA (red) in hypoxia condition. Two representative cells are presented. Scale bars are 3 µm for higher panels, 4 µm for lower panesl and 1 µm for zoomed images of colocalized spots. (B) Quantification of colocalized spots per cell (n=30). Unpaired two-tailed Student T-test was performed.
Figure 4 with 4 supplements
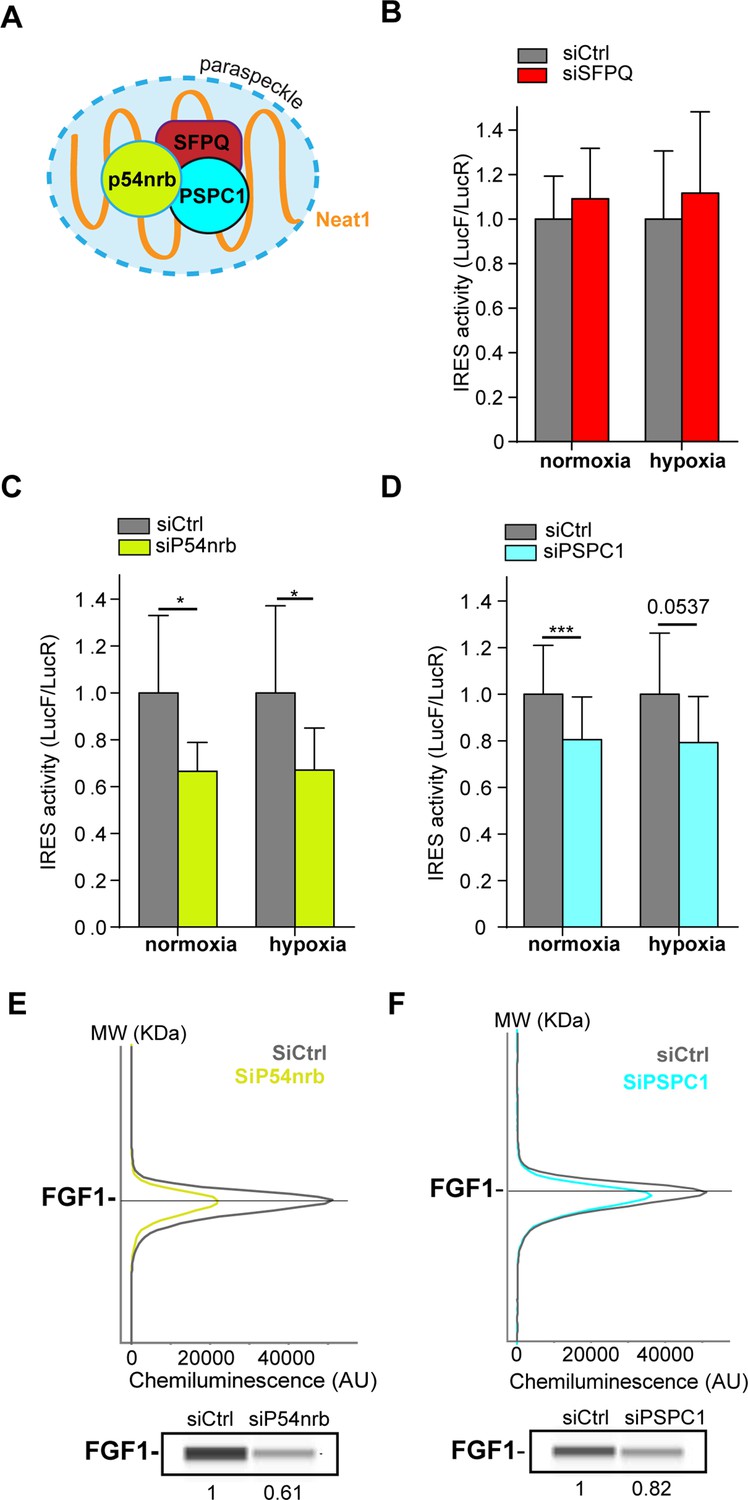
Paraspeckle proteins p54nrb and PSCP1, but not SFPQ, are ITAFs of the FGF1 IRES.
(A) Schema of paraspeckle and DBHS proteins. (B–D) FGF1 IRES activity upon knock-down of SFPQ (B), P54nrb (C) or PSPC1 (D) in HL-1 cell (Figure 4—figure supplement 1—source data 1) transduced with Lucky Luke bicistronic reporter during normoxia or hypoxia was measured as in Figure 2. Cells were harvested 72 hr after siRNA treatment. The IRES activity values have been normalized to the control siRNA. Histograms correspond to means ± standard deviation of the mean, with a non-parametric Mann-Whitney test with n=9; *p<0.05, ***<0.001. The mean has been calculated with nine cell culture biological replicates, each of them being already the mean of three technical replicates (27 technical replicates in total). Detailed values of biological replicates are presented in Supplementary file 3, Supplementary file 4, Supplementary file 5. (E and F) Capillary Simple Western detection of endogenous FGF1 protein with P54nrb (E) or PSPC1 (F) knock-down. Source data of capillary Simple Western are presented in Figure 4—figure supplement 2 (Figure 4—figure supplement 2—source data 1).
Figure 4—figure supplement 1
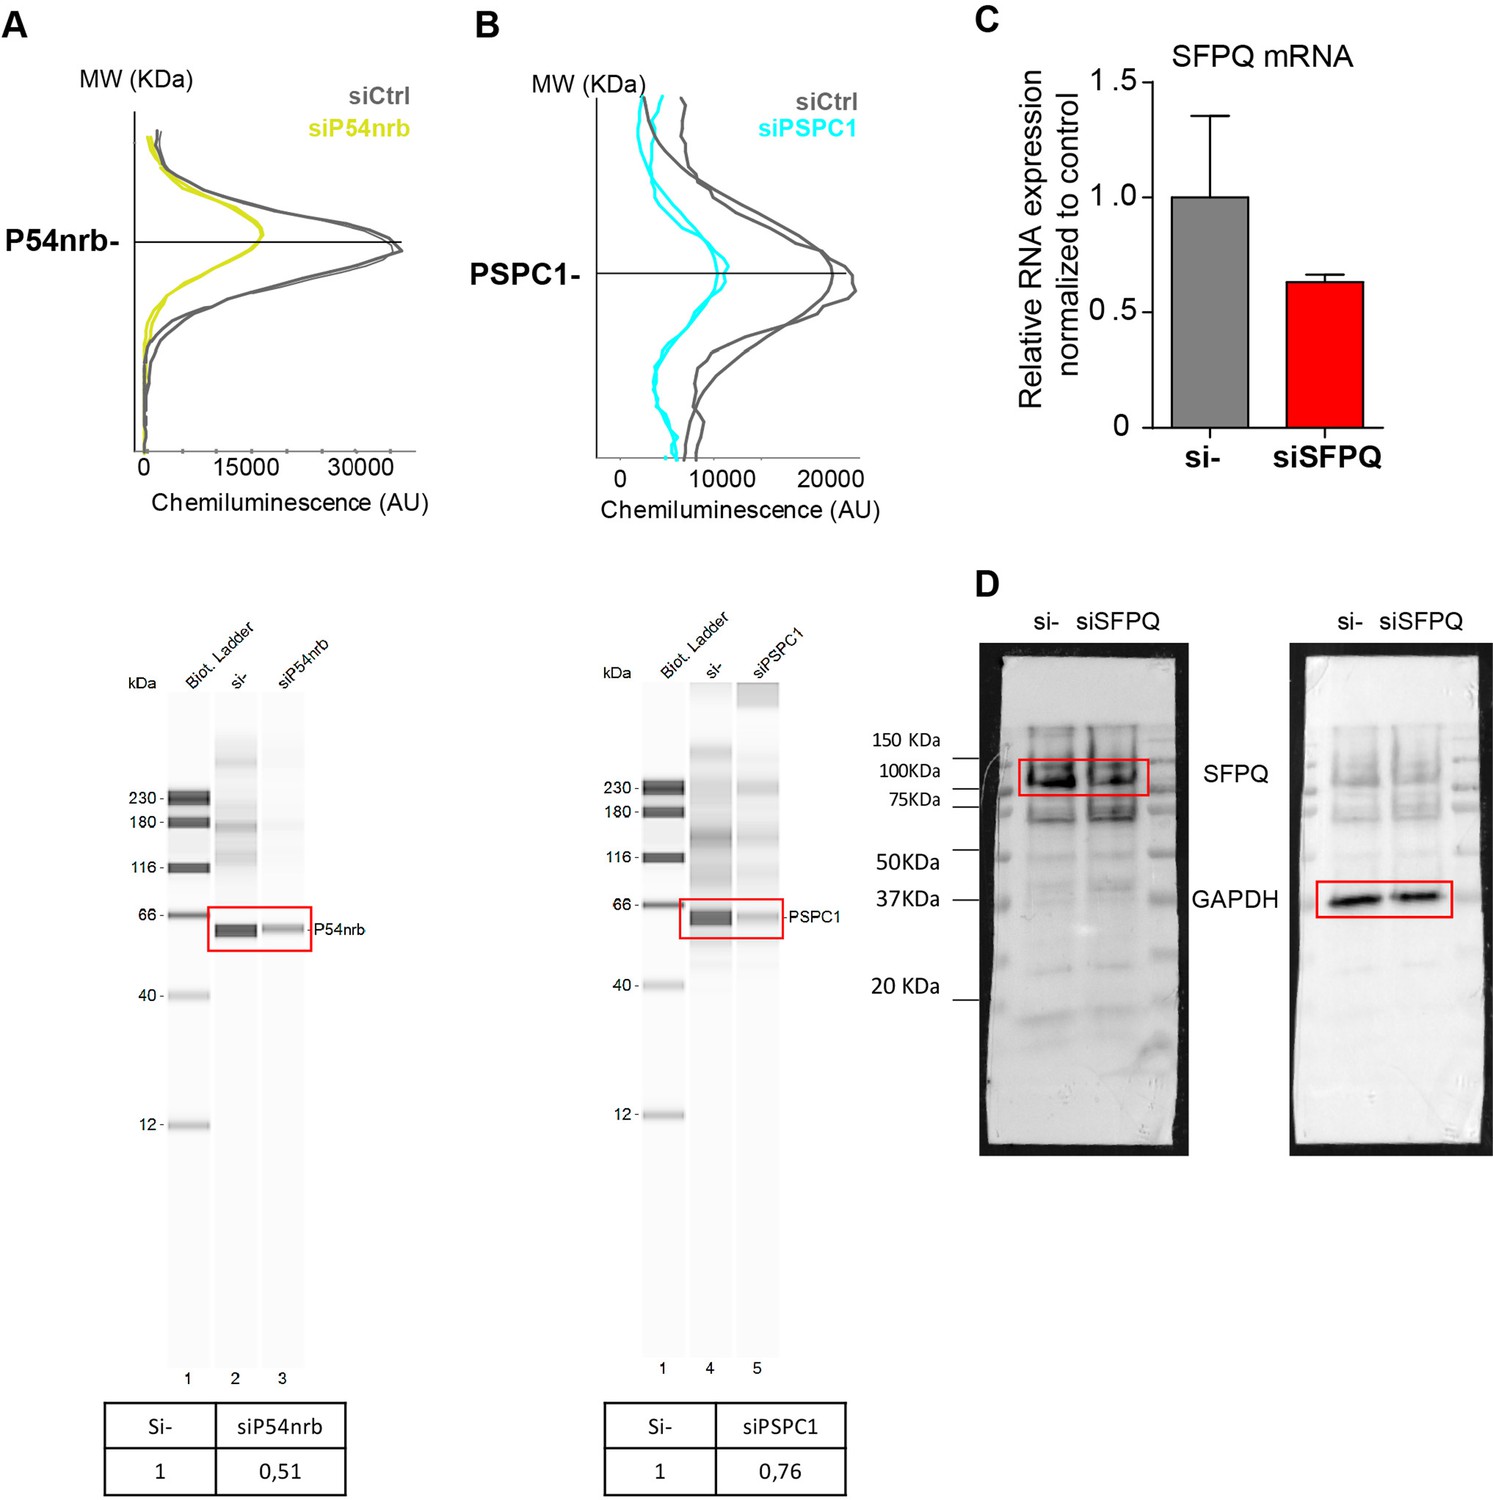
Knock-down of p54nrb, PCPC1 and SFPQ in HL-1 cardiomyocytes.
(A–B) Capillary Simple Western detection (as described in Figure 2) of p54nrb (A) and PSPC1 (B) proteins using anti-p54nrb and anti-PSPC1 antibodies, respectively, following p54nrb and PSPC1 knock-down using siRNAs. Western detection was performed 72 hr after siRNA treatment. (C–D) SFPQ knock-down was performed in HL-1 cells using siRNA against SFPQ. SFPQ RNA expression was measured by RT-qPCR and normalized to control siRNA (C). One representative experiment is shown with n=2 biological replicates. SFPQ protein expression was visualized by Western Blot using an anti-SFPQ antibody (D). Histograms correspond to means ± standard deviation. Source data of capillary Simple Western are provided (Figure 4—figure supplement 1—source data 1).
-
Figure 4—figure supplement 1—source data 1
- https://cdn.elifesciences.org/articles/69162/elife-69162-fig4-figsupp1-data1-v2.zip
Figure 4—figure supplement 2
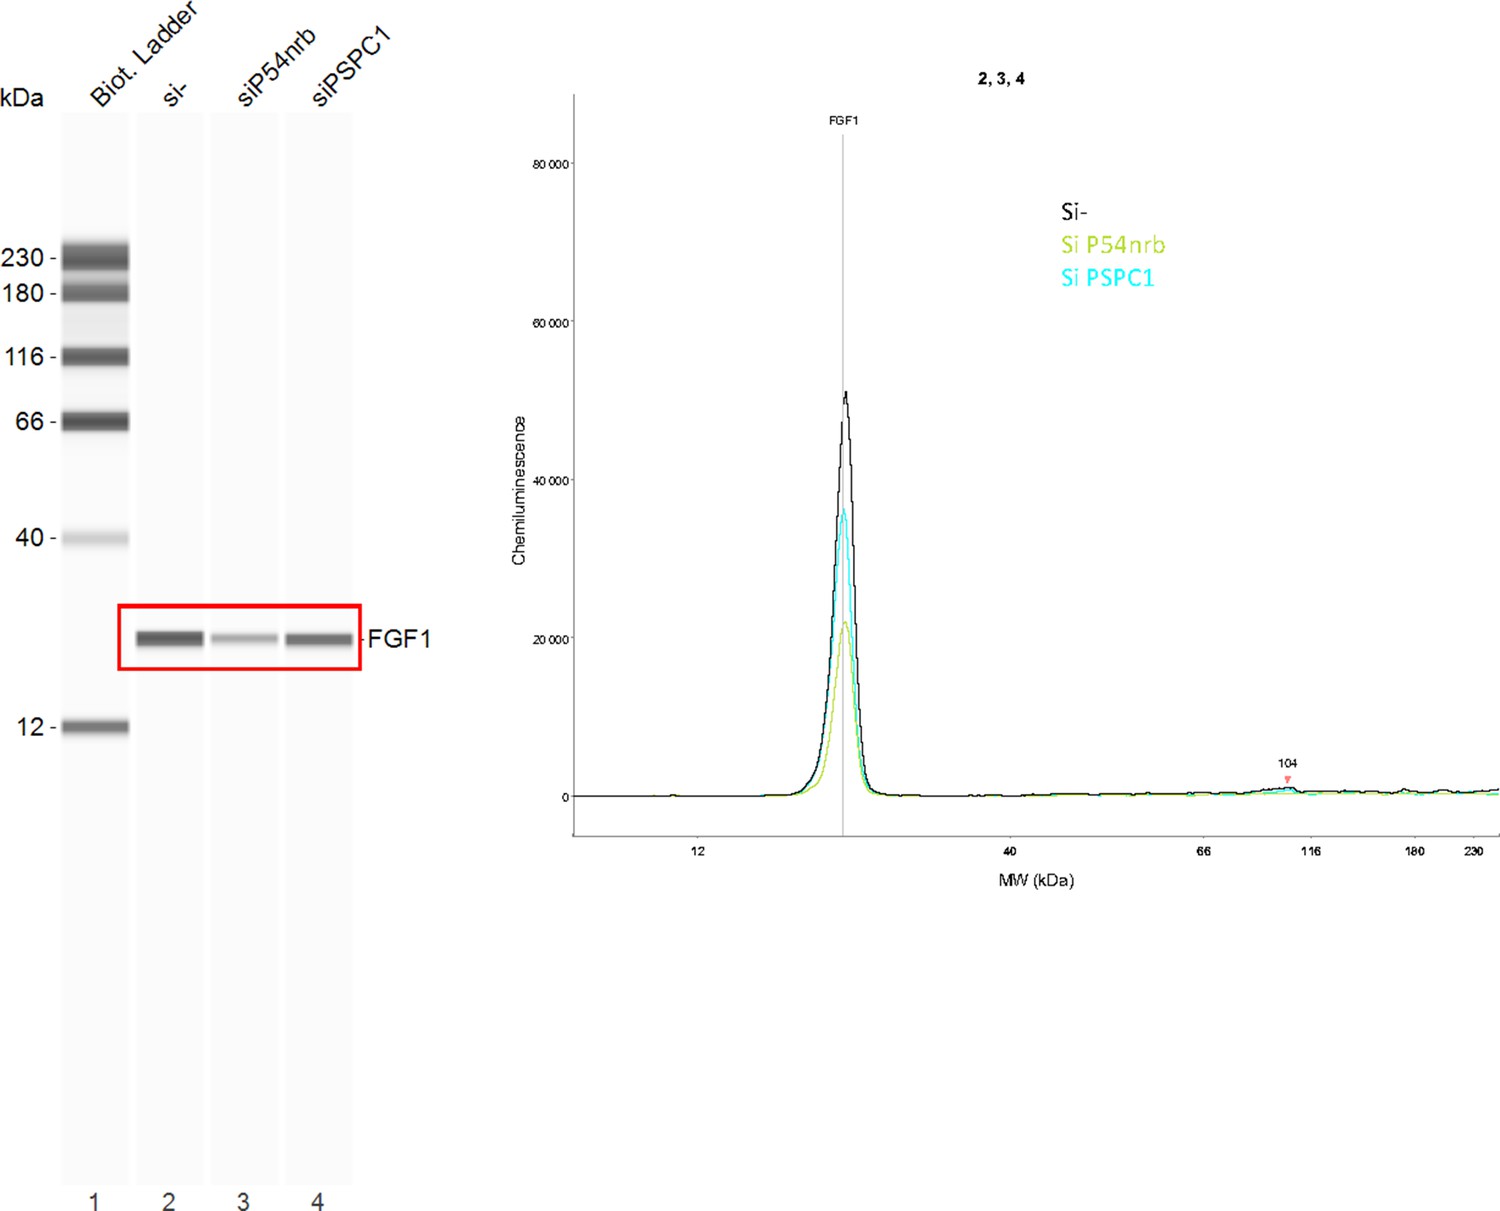
FGF1 protein expression in response to p54nrb or PSPC1 knock-down.
Endogenous FGF1 protein was detected by Capillary Simple Western in conditions of P54nrb or PSPC1 knock-down mentioned in Figure 4—figure supplement 1. The raw data presented correspond to the experiment shown in Figure 4E–F . Source data of capillary Simple Western are provided (Figure 4—figure supplement 2—source data 1).
-
Figure 4—figure supplement 2—source data 1
- https://cdn.elifesciences.org/articles/69162/elife-69162-fig4-figsupp2-data1-v2.zip
Figure 4—figure supplement 3
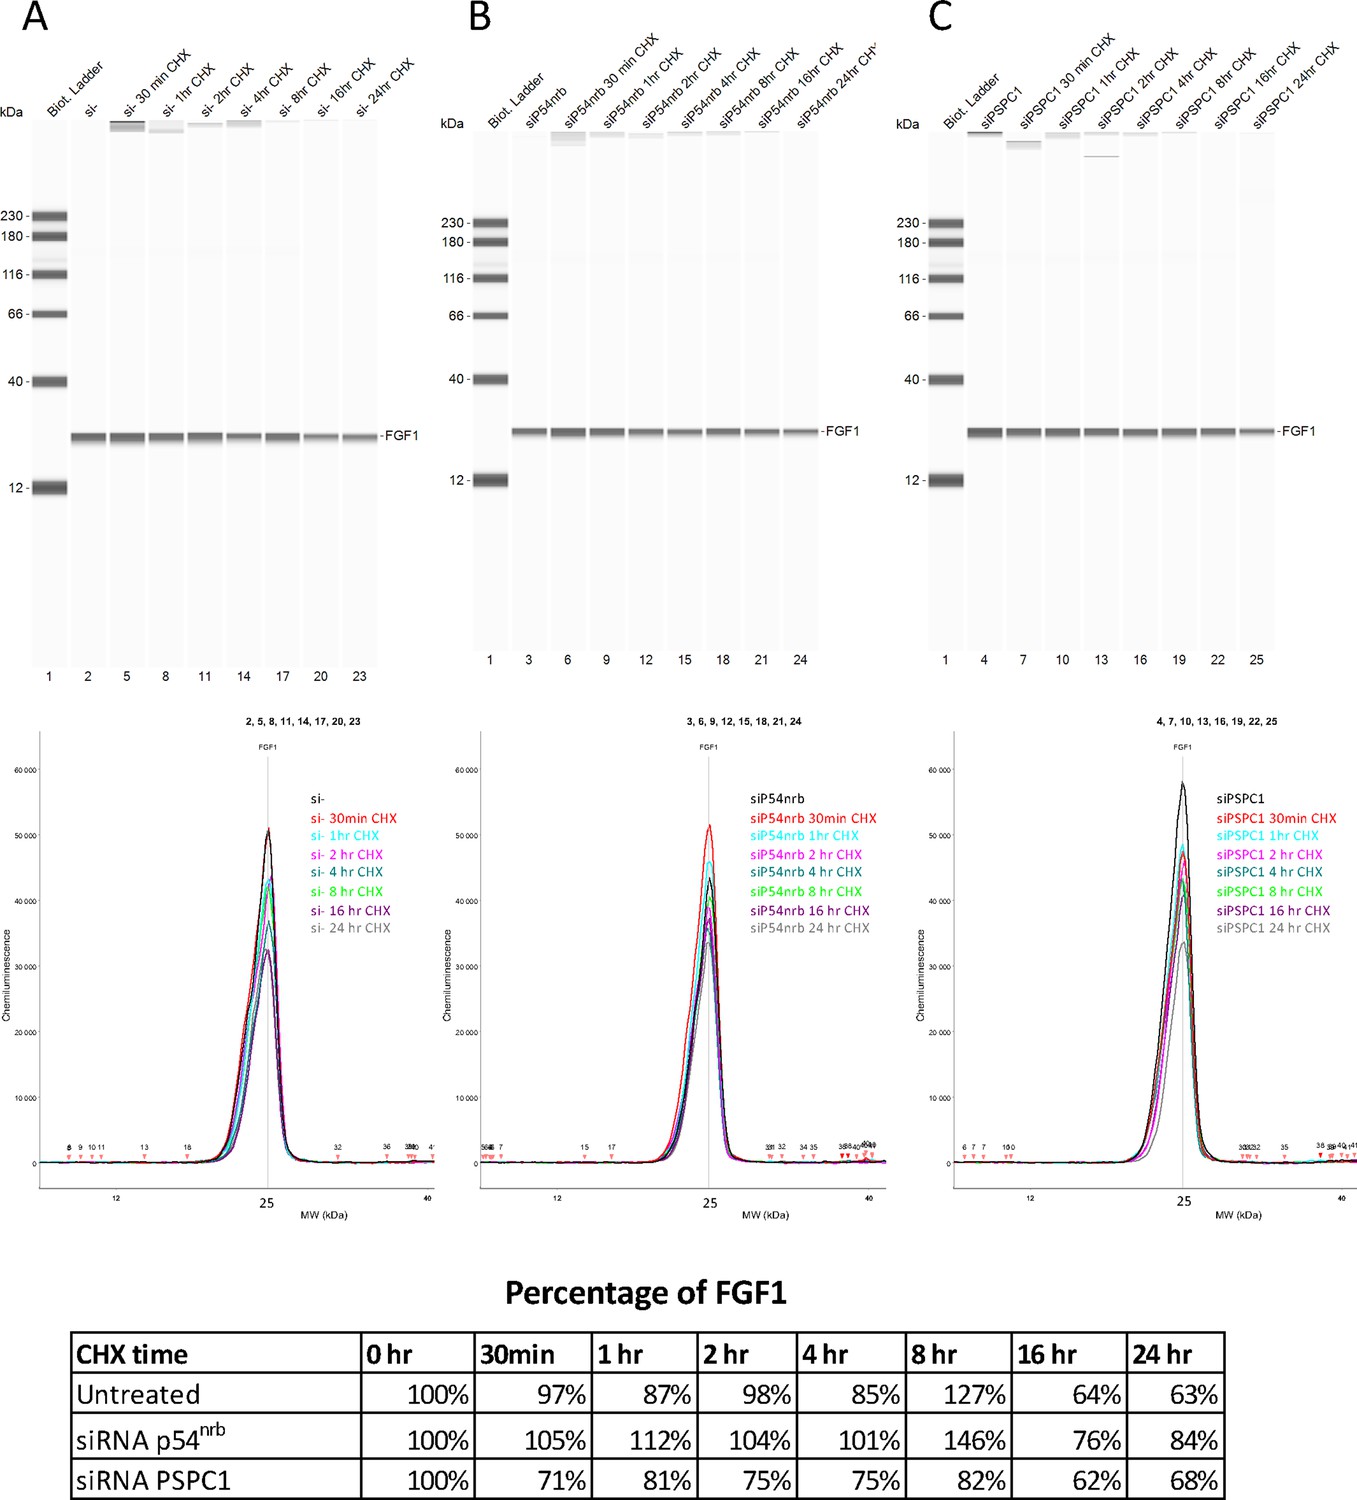
FGF1 half-life in response to p54nrb or PSPC1 knock-down.
FGF1 half-life was determined on HL-1 cells treated with p54nrb siRNA, PSPC1 siRNA or control siRNA, by blocking protein synthesis with cycloheximide at 10 μg/mL, with time-course points at 0 hr, 30 min, 1 hr, 2 hr, 4 hr, 8 hr, 16 hr, and 24 hr. FGF1 protein stability was measured by capillary Western, with normalization to 0 hr time-course point. Source data of capillary Simple Western are provided (Figure 4—figure supplement 3—source data 1).
-
Figure 4—figure supplement 3—source data 1
- https://cdn.elifesciences.org/articles/69162/elife-69162-fig4-figsupp3-data1-v2.zip
Figure 4—figure supplement 4
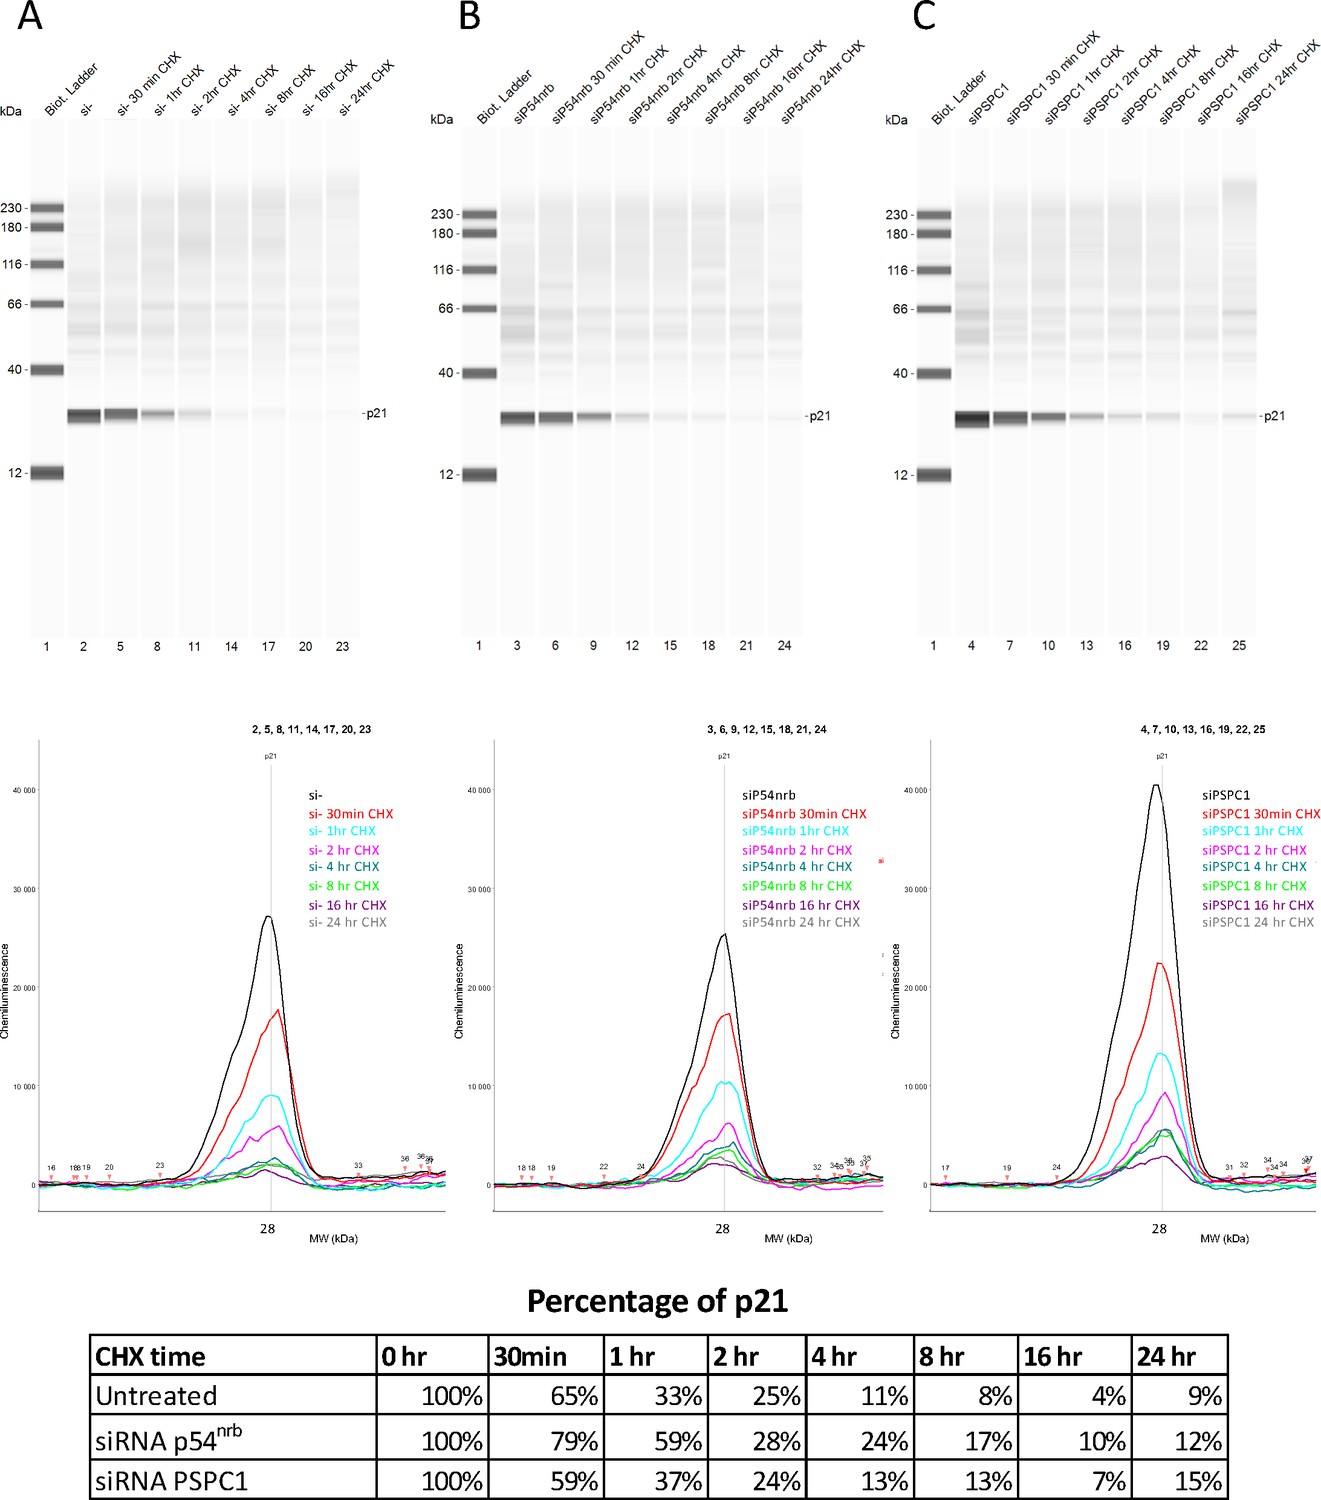
p21 half-life in response to p54nrb or PSPC1 knock-down.
p21 half-life was determined on HL-1 cells treated with p54nrb siRNA, PSPC1 siRNA or control siRNA in the same experiment as in that presented in Figure 4—figure supplement 3. p21 protein stability was measured by capillary western, with normalization to 0 hr time-course point. Source data of capillary Simple Western are provided (Figure 4—figure supplement 4—source data 1).
-
Figure 4—figure supplement 4—source data 1
- https://cdn.elifesciences.org/articles/69162/elife-69162-fig4-figsupp4-data1-v2.zip
Figure 5 with 2 supplements

P54nrb interactome in normoxic and hypoxic cardiomyocytes.
(A) Experimental workflow: p54nrb-HA transduced HL-1 cells were subjected to normoxia or hypoxia, then nucleus and cytoplasm fractionation was performed and extracts were immunoprecipitated using anti-HA antibody. Enriched interacting proteins were identified by using a label-free quantitative mass spectrometry approach. (B) Western blot of fractionation experiment of HL-1 cells in normoxia and hypoxia. Histone H3 was used as a nuclear control and GAPDH as a cytoplasm control. The dotted line delineates two different blots of the same fractionation experiment. (C) Schema of the four pairwise comparisons submitted to statistical analysis. (D and E) Volcano plots showing proteins enriched (bold black) and significantly enriched (after elimination of false-positive hits from quantitation of low-intensity signals) in the nucleus for hypoxia (purple) versus normoxia (red) (D) or in the cytoplasm for hypoxia (green) versus normoxia (E). An unpaired bilateral student t-test with equal variance was used. Enrichment significance thresholds are represented by an absolute log2-transformed fold-change (FC) greater than 1 and a -log10-transformed (p-value) greater than 1.3. Details are provided in Supplementary file 7.
Figure 5—figure supplement 1
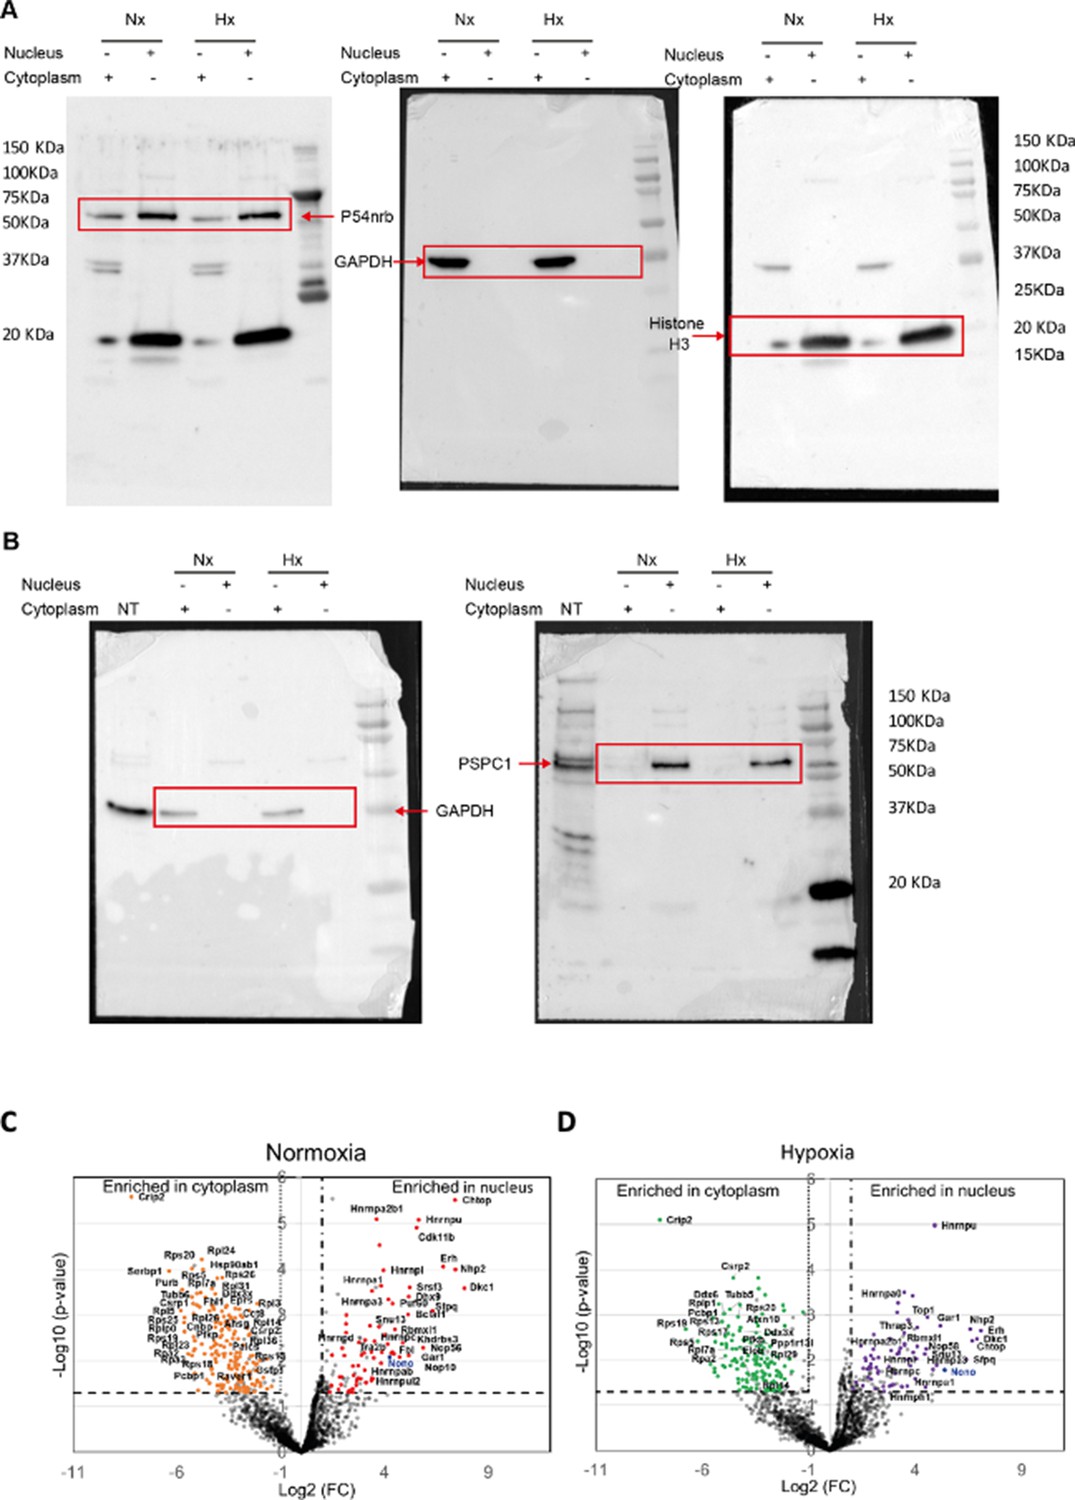
Western blot of fractionation experiment of HL-1 cells and label-free quantitative analysis of HA-P54nrb-bound proteins identified by mass spectrometry in different conditions.
(A-B) Raw data of the Western blots using nuclear or cytoplasmic extracts of HL-1 cells in normoxia and hypoxia, presented in Figure 5B. (A) Western blot successively blotted with anti-GAPDH, anti-histone H3, and anti-p54nrb antibodies. (B) Western blot successively blotted with anti-GAPDH and anti-PSPC1 antibodies. Size markers are indicated. NT corresponds to total extracts of non-transduced cells.
(C-D) Volcano plots showing proteins significantly enriched in the normoxia condition for nucleus (dots in red) versus cytoplasm (dots in orange) (C) or in the hypoxia condition (4 hr) for nucleus (dots in purple) versus cytoplasm (dots in green) (D). The p54nrb bait (endogenous mouse Nono) is indicated in blue. An unpaired bilateral student t-test with equal variance was performed. Enrichment significance thresholds are represented by an absolute log2-transformed fold-change (FC) greater than 1 and a -log10-transformed (p-value) greater than 1.3.
Figure 5—figure supplement 2
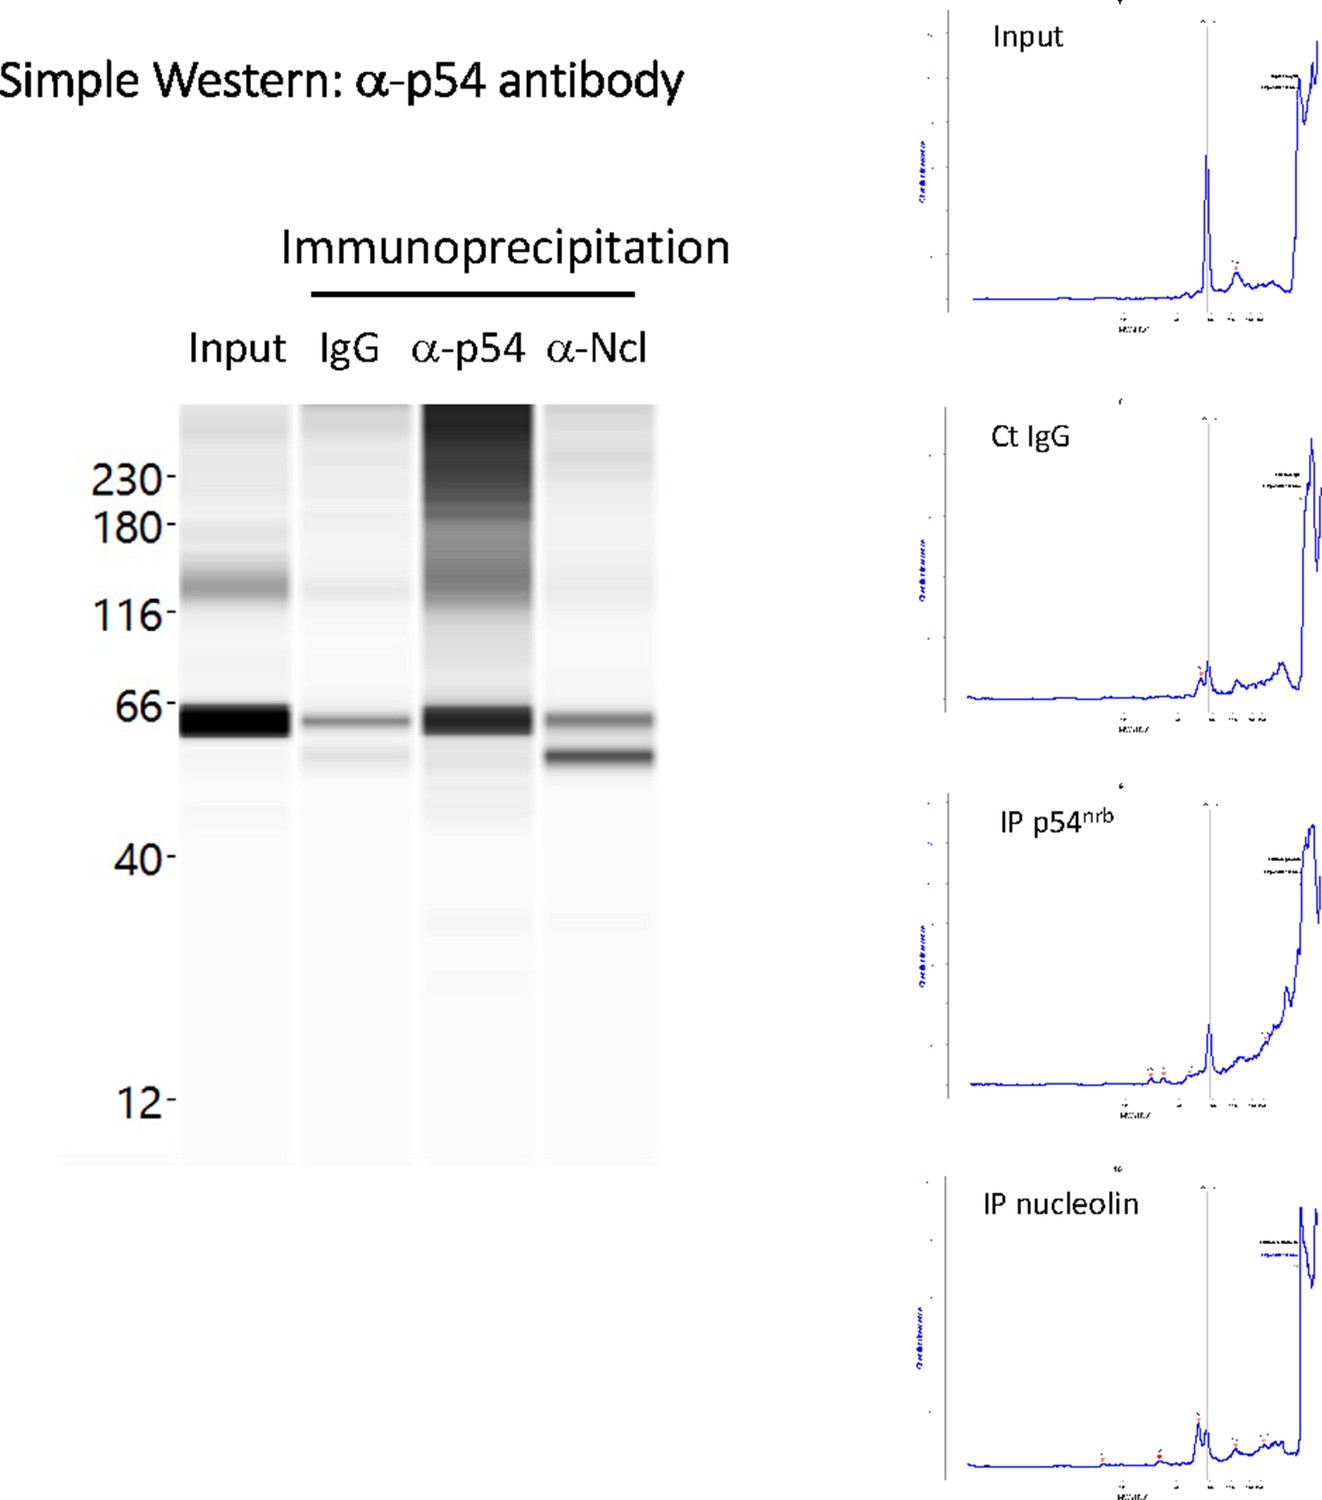
p54nrb is co-immunoprecipitated by anti-nucleolin antibody.
Immunoprecipitation was performed from HL-1 cell nuclear extracts, using either IgG (negative control), or antibody against p54nrb, or antibody against nucleolin. Capillary Simple Western (Jess) was then performed using a-p54nrb antibody. Data show an enrichment of p54 using anti-nucleolin antibody. Interestingly, a smaller isoform of p54 is efficiently co-immunoprecipitated, described in a previous report. Source data of capillary Simple Western are provided (Pavao et al., 2001; Figure 5—figure supplement 2—source data 1).
-
Figure 5—figure supplement 2—source data 1
- https://cdn.elifesciences.org/articles/69162/elife-69162-fig5-figsupp2-data1-v2.zip
Figure 6 with 1 supplement
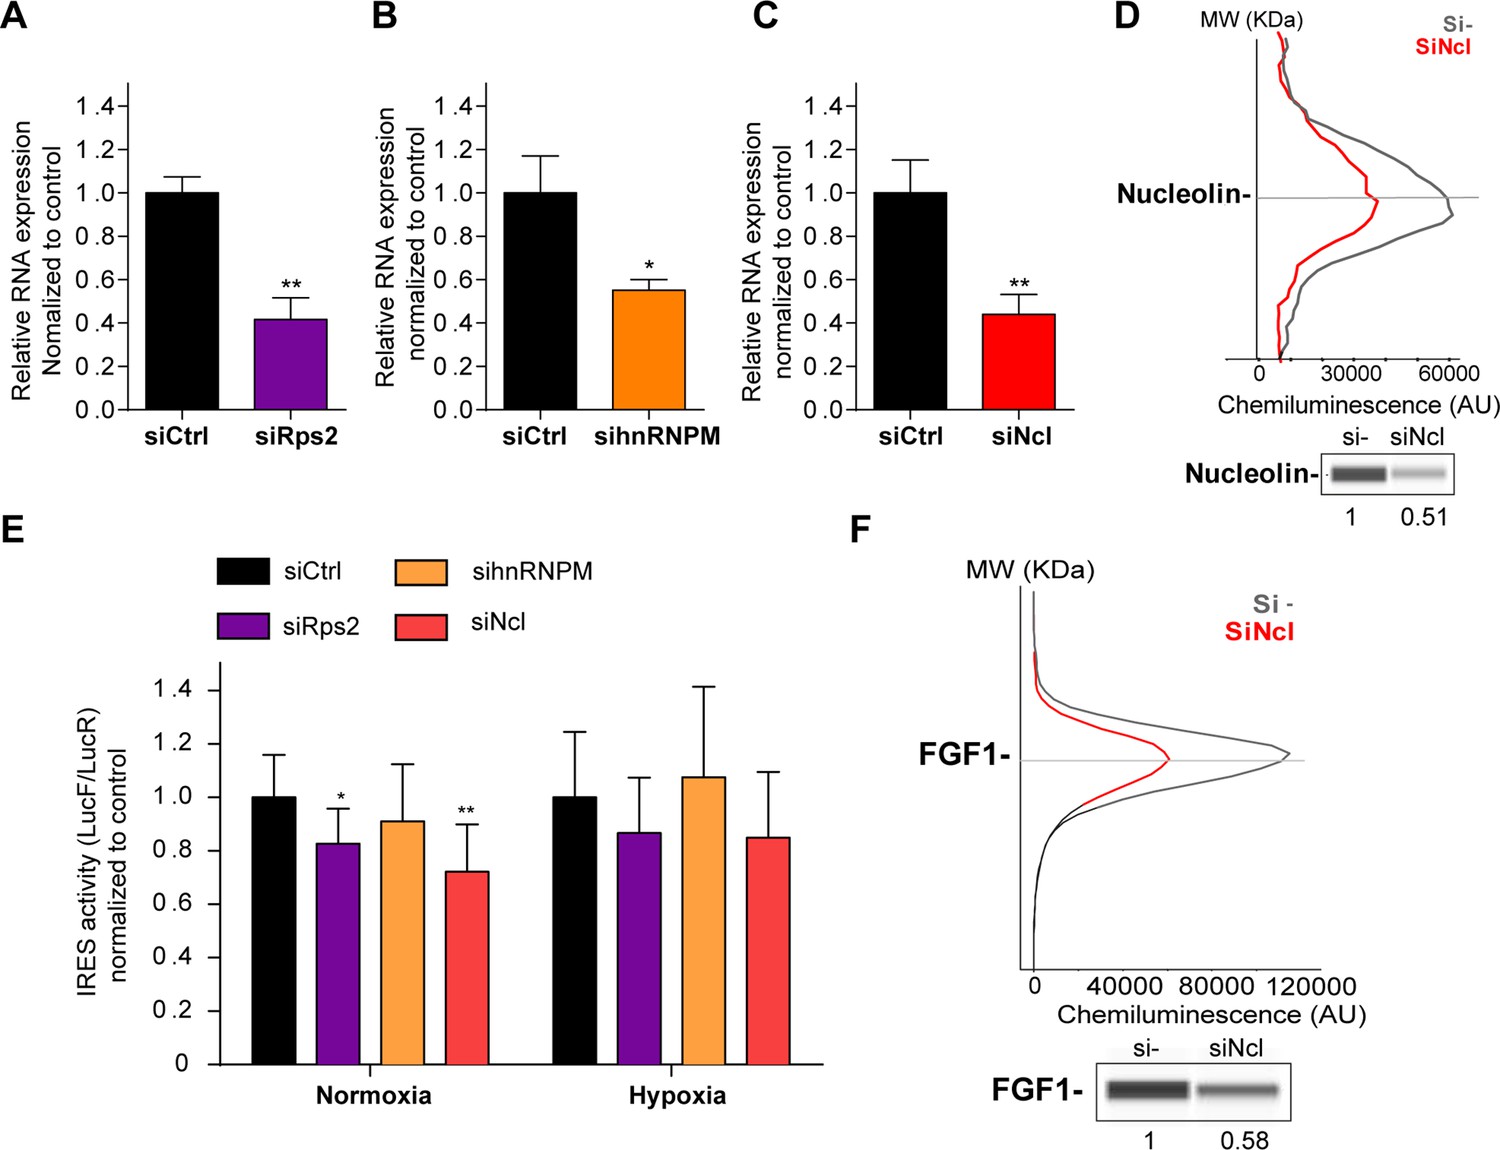
p54nrb-interacting proteins, nucleolin and RPS2, control the FGF1 IRES activity.
(A–C) Quantification of RPS2 (A), hnRNPM (B) and nucleolin (C) RNA expression in HL-1 cells transfected with siRNAs against Rps2, hnRNPM or nucleolin mRNA, respectively. RNA expression was measured by RT-qPCR and normalized to control siRNA. One representative experiment is shown with n=3 biological replicates. Student two-tailed t-test was performed with n=3 or Mann-Whitney test with n=9; *p<0.05, **p<0.01, ***<0.001, ****p<0.0001. (D) Capillary Simple Western of nucleolin following nucleolin knock-down. The full raw unedited gel is provided in Figure 6—figure supplement 1A (Figure 6—figure supplement 1—source data 1). (E) FGF1 IRES activity with knock-down by siRNA interference of candidate ITAF nucleolin in HL-1 in normoxia or hypoxia 1% O2 was performed as in Figure 2. The IRES activity values have been normalized to the control siRNA. Histograms correspond to means ± standard deviation of the mean, with a non-parametric Mann-Whitney test *p<0.05, **p<0.01. The mean has been calculated with nine cell culture biological replicates, each of them being already the mean of three technical replicates (27 technical replicates in total but the M-W test was performed with n=9). Detailed values of biological replicates are presented in Supplementary file 6. (F) Capillary Simple Western of endogenous FGF1 following nucleolin knock-down. Histograms correspond to means ± standard deviation. The source data or capillary Simple Western are provided in Figure 1—figure supplement 1B (Figure 6—figure supplement 1—source data 1).
Figure 6—figure supplement 1
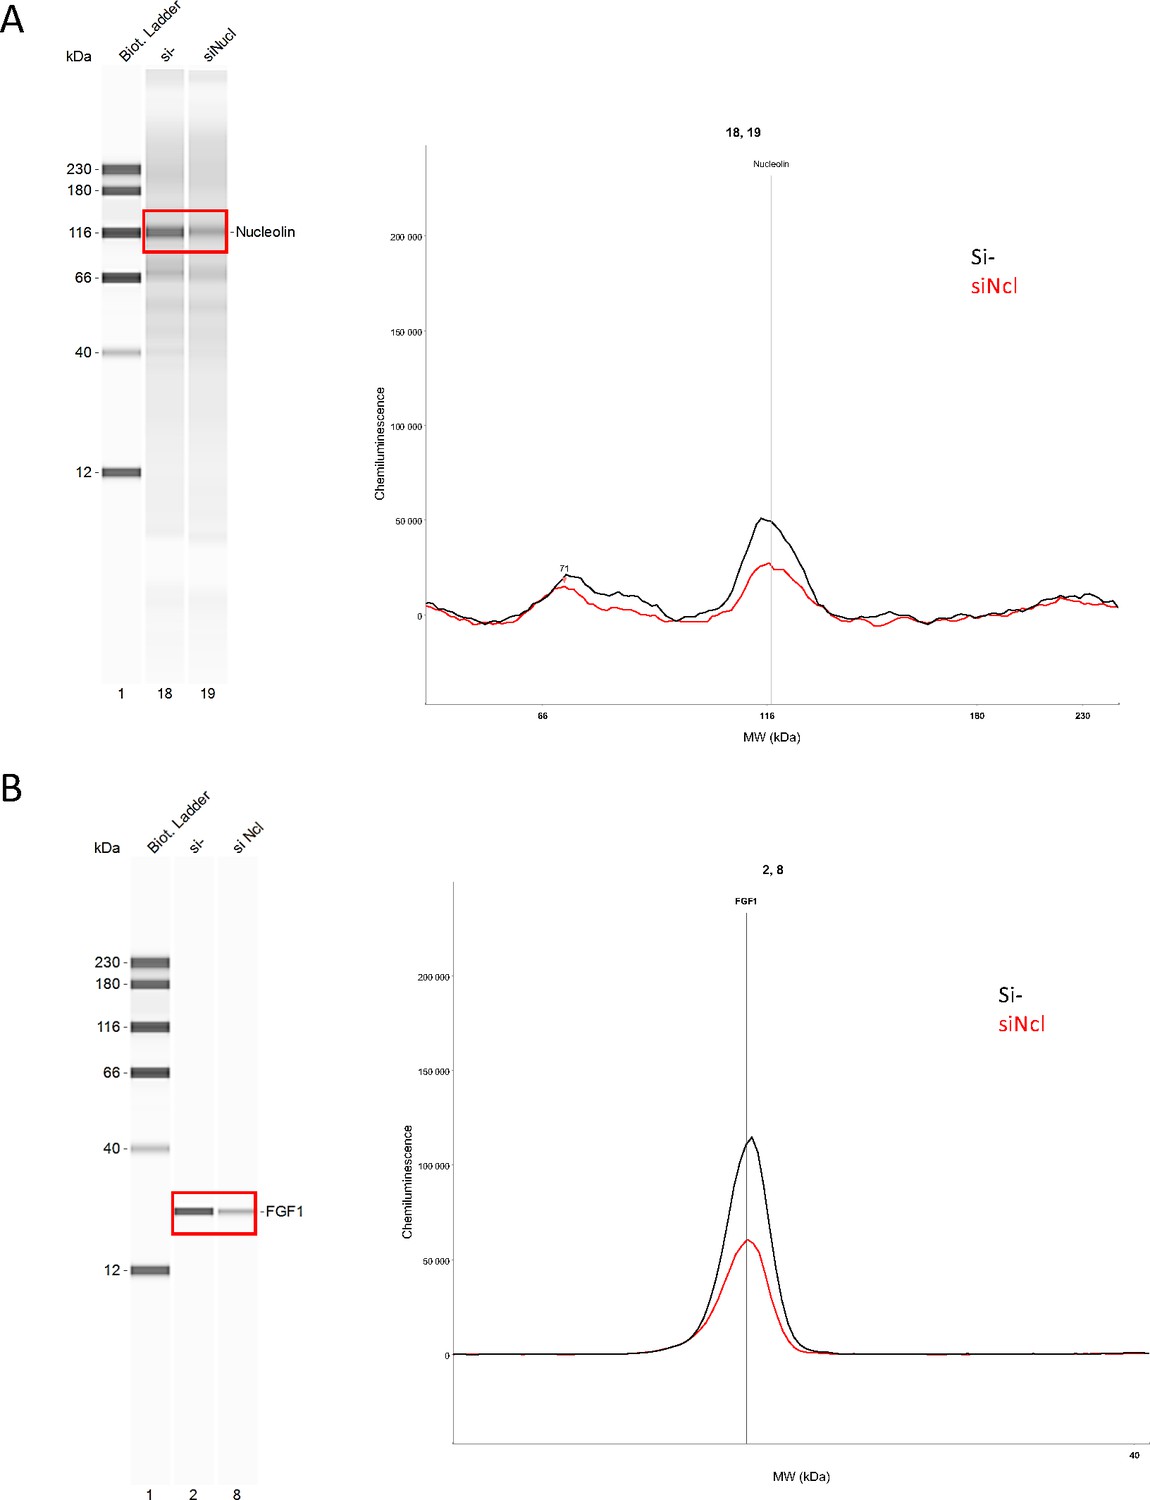
Endogenous FGF1 protein expression is down-regulated following nucleolin knock-down.
Knock-down of nucleolin was achieved in HL-1 cells using siRNA against nucleolin mRNA. Capillary Simple Western were performed using anti-nucleolin (A) of anti-FGF1 antibody (B). The source data of the capillary Simple Western are provided (Figure 6—figure supplement 1—source data 1).
-
Figure 6—figure supplement 1—source data 1
- https://cdn.elifesciences.org/articles/69162/elife-69162-fig6-figsupp1-data1-v2.zip
Figure 7
Neat1 is the key activator of (lymph)angiogenic and cardioprotective factor mRNA IRESs.
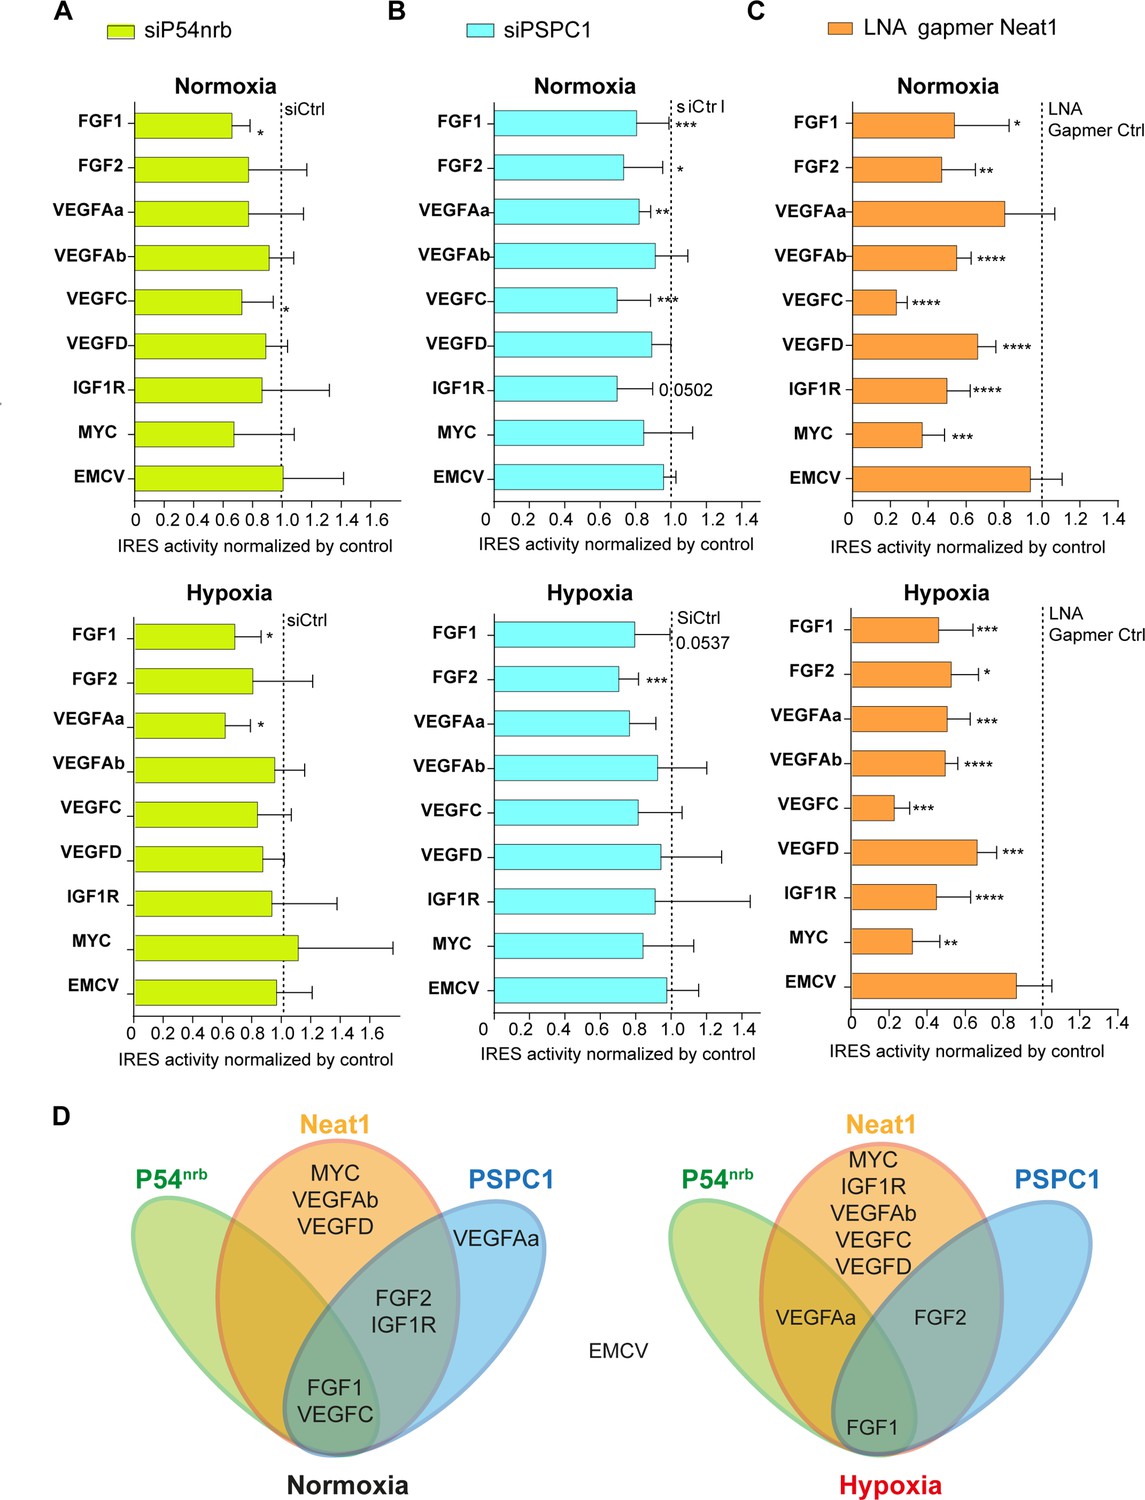
(A–C) HL-1 subjected to normoxia or 1% O2 hypoxia were transduced by Lucky Luke bicistronic lentivectors with FGF1, FGF2, VEGFAa, VEGFAb, VEGFC, VEGFD, IGF1R, MYC, or EMCV IRES, then the knock-down of p54nrb(A) PCPC1 (B) and Neat1 (C) was performed as in Figure 2 and Figure 4. IRES activities were measured and normalized to activities in normoxia. IRES activity in normoxia is represented by a dotted line at 1. Histograms correspond to means ± standard deviation, and Mann-Whitney test with n=9 or n=12 for FGF1 IRES; *p<0.05, **p<0.01, ***<0.001, ****p<0.0001. For each IRES the mean has been calculated with nine cell culture biological replicates, each of them being already the mean of three technical replicates (27 technical replicates in total). Detailed values of biological replicates are presented in Supplementary file 3, Supplementary file 5, Supplementary file 6. (D) Schema depicting groups of IRESs regulated by Neat1, PSPC1, or P54nrb in normoxia or hypoxia.
Figure 8 with 2 supplements
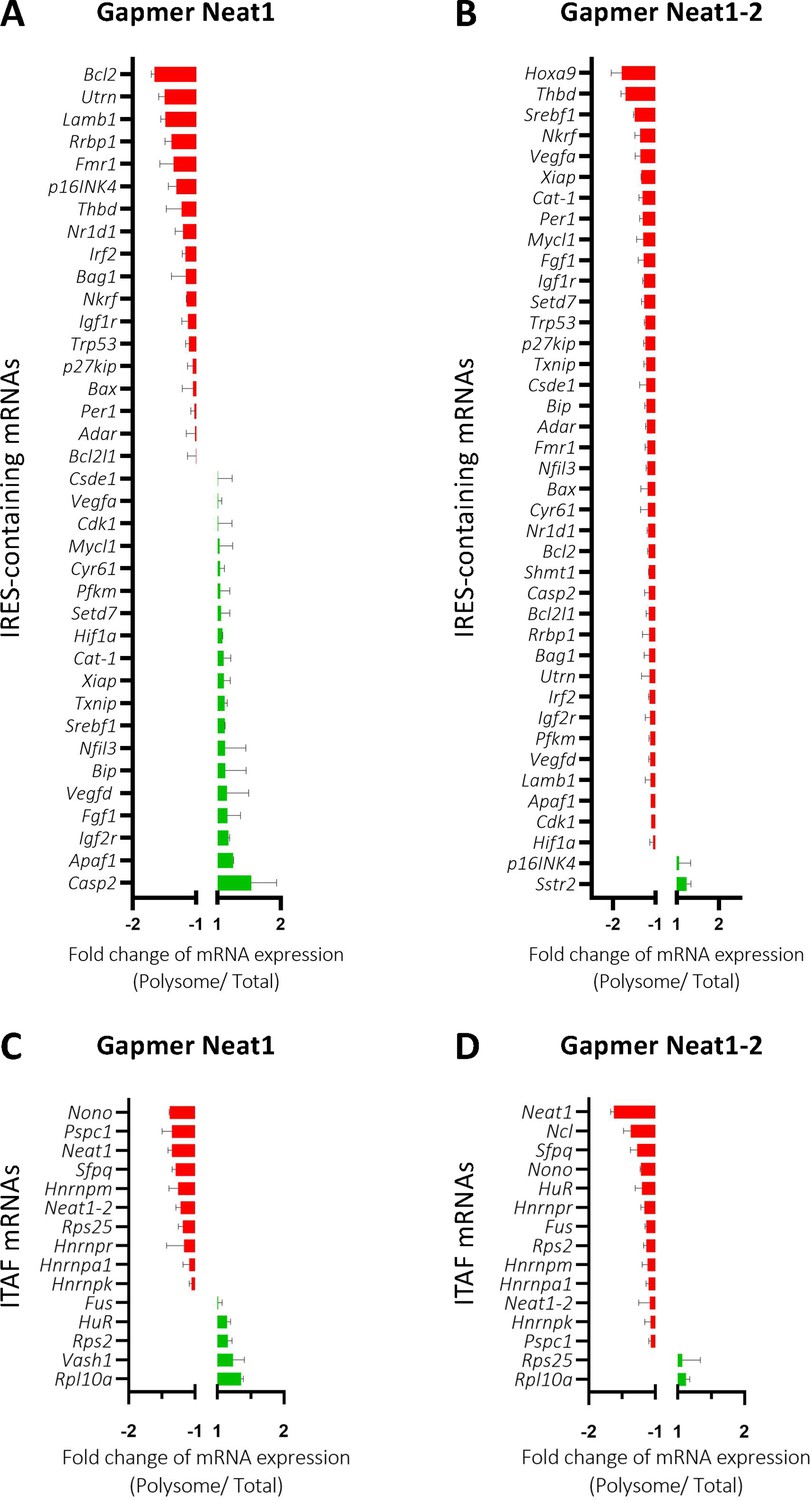
Neat1_2 knock-down down-regulates translation of most IRES-containing RNAs as well as mRNAs coding ITAFs.
HL-1 cardiomyocytes were transfected with gapmer Neat1, Neat1_2, or control. Polysomes were purified on sucrose gradient as described in Star Methods. The polysome profile is presented in Figure 8—figure supplement 1. RNAs were purified from cytoplasmic extracts and from pooled polysomal fractions and analyzed on a Fluidigm deltagene PCR array from two biologicals replicates (cell culture dishes and cDNAs), each of them measured in three technical replicates (PCR reactions) (Supplementary file 8). IRES-containing mRNAs (A–B) and ITAF mRNA levels in polysomes (C–D) polysomal RNA/ total RNA were analyzed. Relative quantification (RQ) of mRNA level was calculated using the 2– ΔΔCT method with normalization to GAPDH mRNA and to HL-1 tranfected by gapmer control, and is shown as fold change of repression (red) or induction (blue).
Figure 8—figure supplement 1
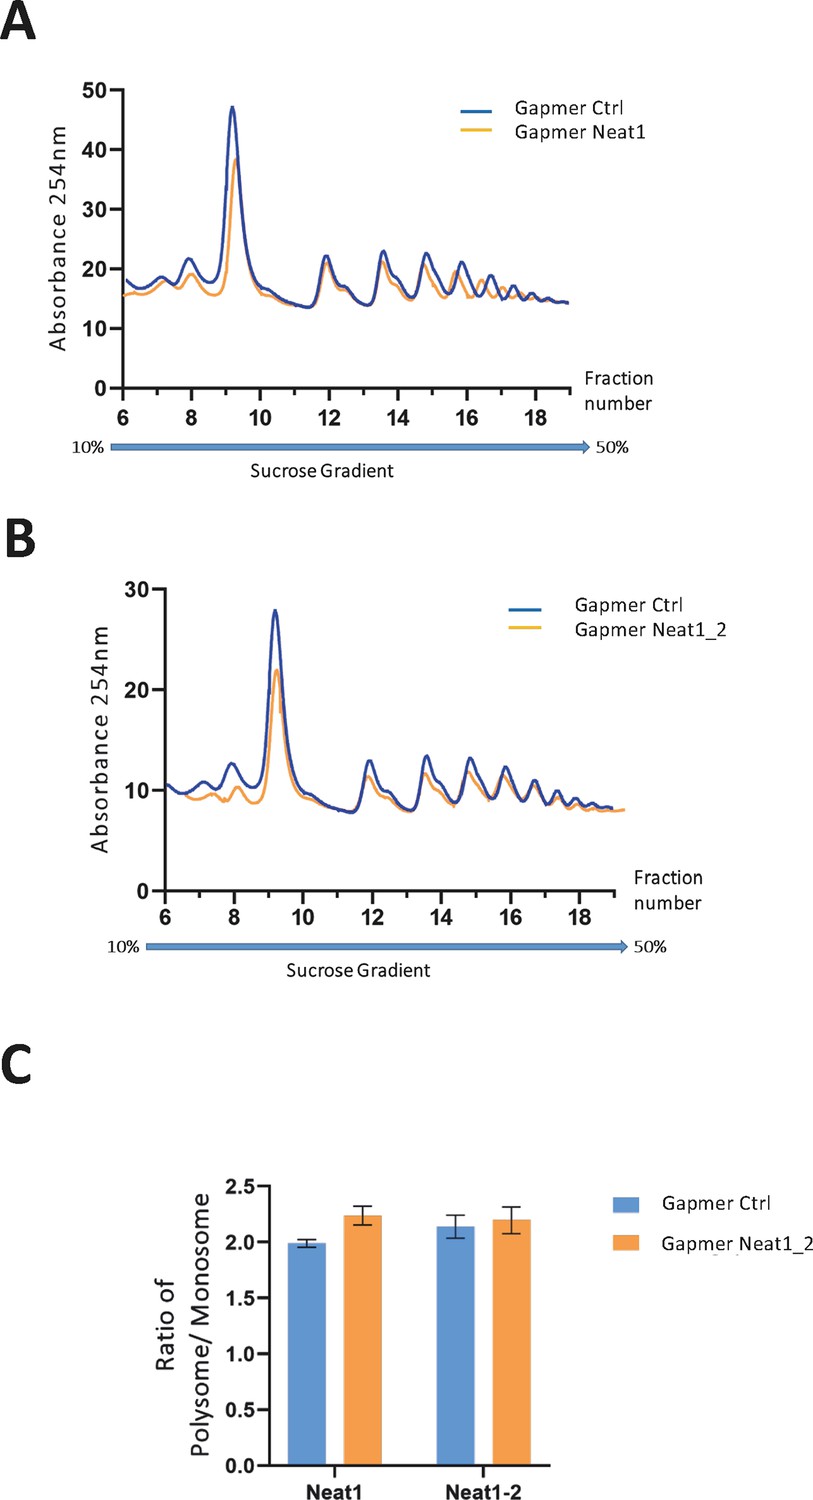
Polysome profiles of HL-1 cardiomyocytes treated by gapmer Neat1 or Neat1_2, compared to gapmer control.
In order to isolate translated mRNAs, polysomes from transfected HL-1 cardiomyocytes were purified on a sucrose gradient, as described in Star Methods. Polysomal profiles of HL-1 cardiomyocytes transfected by gapmer Neat1 (A) or Neat1_2 (B) was analyzed and compared to gapmer control. The P/M ratio (polysome/monosome) (C) was determined by delimiting the 80 S and polysome peaks, taking the lowest plateau values between each peak and calculating the area under the curve (AUC). Then the sum of area values of the nine polysome peaks was divided by the area of the 80 S peak.
Figure 8—figure supplement 2
Effect of Neat1 and Neat1_2 knock-down on translation of mRNAs coding angiogenic and cardioprotective factors.
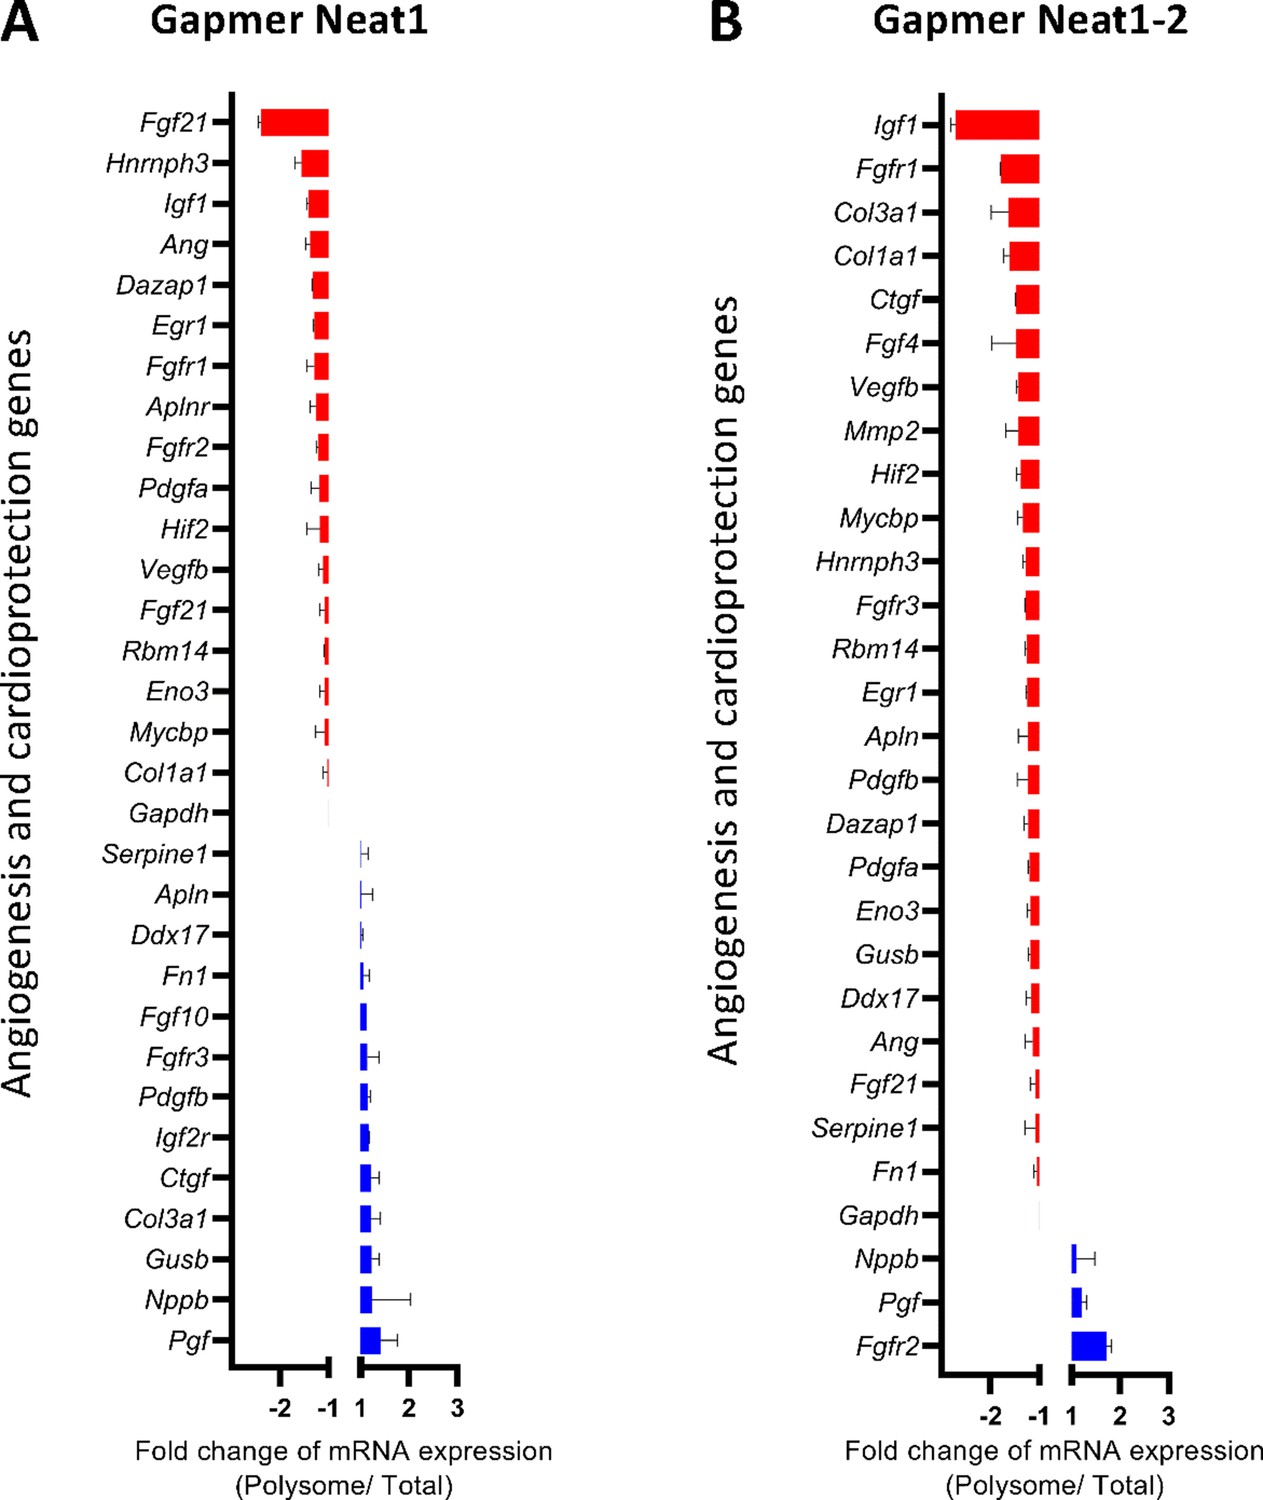
HL-1 cardiomyocytes were transfected with gapmer Neat1, Neat1-2, or control. Polysomes were purified on sucrose gradient as described in Star Methods. Polysome profile is presented in Figure 8—figure supplement 1. RNAs were purified from cytoplasmic extracts and from pooled polysomal fractions and analyzed on a Fluidigm deltagene PCR array from two biologicals replicates (cell culture dishes and cDNAs), each of them measured in three technical replicates (PCR reactions) (Supplementary file 8). Angiogenesis and cardioprotection gene mRNA levels in polysomes (polysomal RNA/ total RNA) were analyzed after knock-down of Neat1 (A) or Neat1_2 (B). Relative quantification (RQ) of mRNA levels was calculated using the 2–ΔΔCT method with normalization to GAPDH mRNA and to HL-1 tranfected by gapmer control, and is shown as fold change of repression (red) or induction (blue).
Figure 9
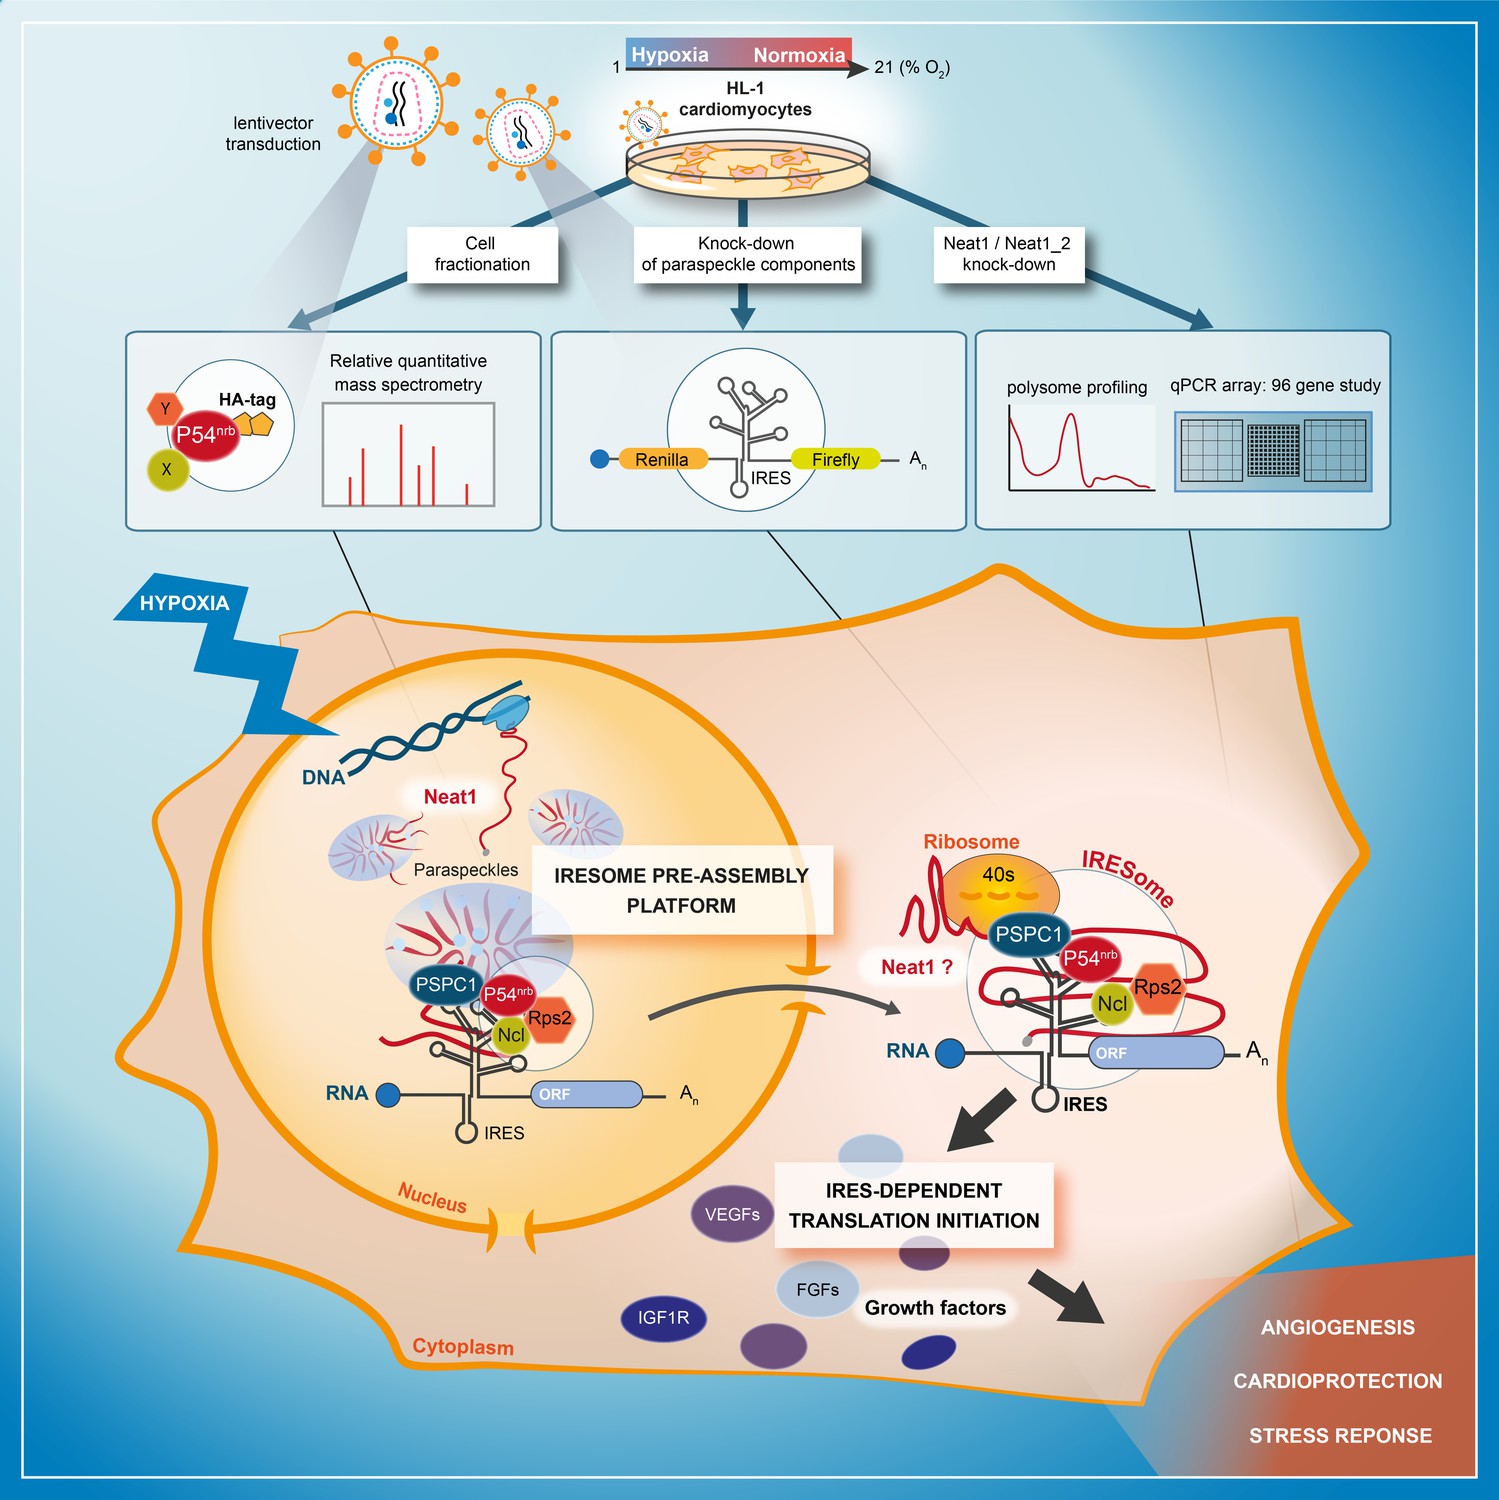
Model of IRESome formation in the paraspeckle.
According to the present data, we propose that the paraspeckle may be a recruitment platform for IRES-containing mRNAs in hypoxic cardiomyocytes. Neat1 and proteins present in the paraspeckle (among them major paraspeckle components such as p54nrb and PSPC1) would assemble the IRESome, then mRNA would be exported from the nucleus and translated in the cytosol. Identification of Neat1 in the cytoplasm suggests that it might be part of the IRESome and have a direct role in translation. However this latter hypothesis remains to be elucidated.
Author response image 1
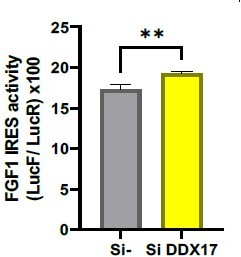
FGF1 IRES activity after DDX17 knock-down.
Videos
Video 1
Beating HL-1 cardiomyocytes (Enlargement 40X).
Mouse atrial HL-1 cardiomyocytes exhibit a beating phenotype when cultured in Claycomb medium at high density (Claycomb et al., 1998). This phenotype was required to obtain all the data described in the present study.
Tables
Table 1
The p54 interactome includes 22 among 40 proteins described as paraspeckle components.
The paraspeckle components listed in the reports by Naganuma et al., 2012 and by Yamamoto et al., 2021 is presented here with their ITAF function and their presence in the p54nrb interactome. Their belonging to class I, II, or III of the paraspeckle proteins is indicated. Class I proteins are essential for paraspeckle formation.
| Name | Alternative name | Class | ITAF | Presence in p54nrb MS-IP |
|---|---|---|---|---|
| ASXL1 | MDS/BOPS | I | No | No |
| CELF6 | n/d | No | No | |
| CIRBP | IIIB | No | Yes | |
| CPSF6 | IIIA | No | Yes | |
| CPSF7 | II | No | Yes | |
| DAZAP1 | IB | No | Yes | |
| DLX3 | n/d | No | No | |
| EWSR1 | No | Yes | ||
| FAM113A | II | No | No | |
| FAM98A | II | No | Yes | |
| FIGN | II | No | No | |
| FUS | IB | Yes | Yes | |
| FUSPI1 | SRSF10 | II | No | Yes |
| hnRNPA1 | II | Yes | Yes | |
| hnRNPA1L2 | n/d | No | No | |
| hnRNPF | n/d | No | Yes | |
| hnRNPH1 | n/d | No | Yes | |
| hnRNPH3 | IB | No | No | |
| hnRNPK | IA | Yes | Yes | |
| hnRNPM | n/d | Yes | Yes | |
| hnRNPR | II | Yes | No | |
| hnRNPUL1 | II | No | Yes | |
| MEX3C | n/d | No | No | |
| NUDT21 | IIIA | No | Yes | |
| p54nrb | NONO | IA | Yes | Yes |
| PSPC1 | IIIB | No | Yes | |
| RBM12 | II | No | No | |
| RBM14 | IA | No | No | |
| RBM3 | IIIB | No | Yes | |
| RBM4B | IIIB | No | No | |
| RBM7 | IIIB | No | No | |
| RBMX | IIIB | No | Yes | |
| RUNX3 | IIIB | No | No | |
| SFPQ | PSF | IA | Yes | Yes |
| SS18L1 | n/d | No | No | |
| SWI/SNF | IB | No | No | |
| TAF15 | No | No | ||
| TDP-43 | II | No | No | |
| UBAP2L | IIIA | No | Yes | |
| ZNF335 | TARDBP | IIIB | No | Yes |
Key resources table
| Reagent type (species) or resource | Designation | Source or reference | Identifiers | Additional information |
|---|---|---|---|---|
| Antibody | Anti-P54nrb (rabbit polyclonal) | Santacruz | Sc-67016 | Dilution 1:200 (capillary Western) Dilution 1:400 (classical Western) |
| Antibody | Anti-PSPC1 (rabbit polyclonal) | bethyl laboratory | A303-205A | Dilution 1:100 (capillary Western) Dilution 1:1000 (classical Western) |
| Antibody | Anti-SFPQ (mouse monoclonal) | Abcam | Ab11825 | Dilution 1:100 |
| Antibody | Anti-FGF1 (rabbit polyclonal) | Abcam | Ab207321 | Dilution 1:25 |
| Antibody | Anti-nucleolin (rabbit polyclonal) | Novus biological | NB600-241 | Dilution 1:50 |
| Antibody | Anti-Histone H3 (rabbit polyclonal) | Cell Signaling | 4499 | Dilution 1 : 10000 |
| Antibody | Anti-GAPDH (mouse monoclonal) | SantaCruz | Sc-32233 | Dilution 1:1000 |
| Antibody | Mouse total IgG (mouse polyclonal) | Sigma | I5381 | 2 mg/mL |
| Antibody | Anti-eIF2α (rabbit polyclonal) | Cell Signaling Technology | 9721 | Dilution 1:50 |
| Antibody | Anti-phospho-eIF2α (mouse monoclonal) | Cell Signaling Technology | 2103 | Dilution 1:50 |
| Antibody | Anti-p21 (mouse monoclonal) | Santacruz | Sc-6246 | Dilution 1:50 |
| Antibody | Anti-HA (mouse monoclonal) | Sigma | H9558/H3663 | 2.4 mg/mL (72 μg) |
| Antibody | Anti-rabbit-peroxidase conjugate (donkey polyclonal) | Jackson ImmunoResearch | 711-035-152 | Dilution 1:10000 |
| Antibody | Anti-mouse-peroxidase conjugate (rabbit polyclonal) | Jackson ImmunoResearch | 715-035-150 | Dilution 1:10000 |
| Antibody | Rabbit detection module | Protein Simple | DM-001 | 10 μl |
| Antibody | Mouse detection module | Protein Simple | DM-002 | 10 μl |
| Strain, strain background (Escherichia coli) | Top10 | InVitrogen | C404003 | |
| Strain, strain background (Escherichia coli) | Strataclone | Agilent technologies | 200185 | |
| Chemical compound, drug | TRI-Reagent | MRC Inc | TR118 | |
| Chemical compound, drug | Isopropanol | Sigma-Aldrich | 33539 | |
| Chemical compound, drug | Ethanol | Sigma-Aldrich | 32221 | |
| Chemical compound, drug | Digitonin | Sigma-Aldrich | D141 | |
| Chemical compound, drug | NP40 (IGEPAL 630) | Sigma-Aldrich | I8896 | |
| Chemical compound, drug | EDTA | Euromedex | EU0084-A | |
| Chemical compound, drug | Proteinase inhibitor cocktail | Sigma-Aldrich | P2714 | |
| Chemical compound, drug | RNAse inhibitor | AppliedBiosystem | N8080119 | |
| Chemical compound, drug | Formamide | Invitrogen | 15515026 | |
| Chemical compound, drug | Paraformaldehyde 16% | Electron Microscopy Science | ||
| Chemical compound, drug | SSC saline-sodium citrate buffer | Euromedex | EU0300-C | |
| Chemical compound, drug | RIPA | BioBasic | RB4476 | |
| Peptide, recombinant protein | HA peptides | Sigma-Aldrich | I2149 | |
| Commercial assay or kit | Premix Ex Taq II | Takara | RR820B | |
| Commercial assay or kit | EZ view red protein G beads | Sigma | E3403 | |
| Commercial assay or kit | DG32 cartridge | Bio-Rad | #1864108 | |
| Commercial assay or kit | QX200 ddPCR EvaGreen Supermix | Bio-Rad | 1864034 | |
| Commercial assay or kit | High capacity cDNA Reverse transcription kit | Thermofisher | 4368814 | |
| Commercial assay or kit | NucleoBond Xtra Maxi kits | Macherey-Nagel | 740414.10 | |
| Commercial assay or kit | EZ-10 Spin Column Plasmid DNA Miniprep Kit | BioBasic | BS413 | |
| Commercial assay or kit | StrataClone Blunt PCR Cloning Kit | Agilent | 240207 | |
| Commercial assay or kit | Dual-Luciferase Reporter Assay system | Promega | E1980 | |
| Commercial assay or kit | Jess or Wes Separation Module | ProteinSimple | SM-SW004 | |
| Commercial assay or kit | Fluorescent 5 x Master Mix 1 | ProteinSimple | PS-FL01-8 | |
| Cell line (Homo-sapiens) | 293 FT | Invitrogen | R700-07 | |
| Cell line (Homo-sapiens) | HT1080 | ATCC | CCL-121 | |
| Cell line (Mus musculus) | HL-1 | (Claycomb et al., 1998) / Sigma-Aldrich | SCC065 | Beating cardiomyocytes (Video 1) |
| Sequence-based reagent | NEAT1 | This paper | PCR primers | Supplementary file 2 |
| Sequence-based reagent | FGF1 | This paper | PCR primers | Supplementary file 2 |
| Sequence-based reagent | NEAT1_2 | This paper | PCR primers | Supplementary file 2 |
| Sequence-based reagent | HPRT | This paper | PCR primers | Supplementary file 2 |
| Sequence-based reagent | RPL11 | This paper | PCR primers | Supplementary file 2 |
| Sequence-based reagent | 18 S | Hantelys et al., 2019 | PCR primers | Supplementary file 2 |
| Sequence-based reagent | SFPQ | This paper | PCR primers | Supplementary file 2 |
| Sequence-based reagent | P54nrb | This paper | PCR primers | Supplementary file 2 |
| Sequence-based reagent | PSPC1 | This paper | PCR primers | Supplementary file 2 |
| Sequence-based reagent | NUCLEOLIN | This paper | PCR primers | Supplementary file 2 |
| Sequence-based reagent | RPS2 | This paper | PCR primers | Supplementary file 2 |
| Sequence-based reagent | HNRNPM | Hantelys et al., 2019 | PCR primers | Supplementary file 2 |
| Sequence-based reagent | Fluidigm deltagene probes | This paper | PCR primers | Supplementary file 2 |
| Sequence-based reagent | Neat1 and Neat1_2 FISH probes | This paper | Hybridization probes | Supplementary file 2 |
| Sequence-based reagent | SmiFISH secondary probes (FLAP X-Cy3 and FLAP-Y-Cy5) | This paper | Hybridization probes | Supplementary file 2 |
| Sequence-based reagent | SmiFISH Neat1 primary probes | This paper | Hybridization probes | Supplementary file 2 |
| Sequence-based reagent | SmiFISH bicistronic Lucky Luke mRNA primary probes | This paper | Hybridization probes | Supplementary file 2 |
| Sequence-based reagent | HA-p54nrb | This paper | Cloning primers | Supplementary file 2 |
| Sequence-based reagent | miR-Neat1-G2 | This paper | Cloning primers | Supplementary file 2 |
| Sequence-based reagent | miR-Neat1_2-G6 | This paper | Cloning primers | Supplementary file 2 |
| Sequence-based reagent | miR-Neat1_2-G7 | This paper | Cloning primers | Supplementary file 2 |
| Sequence-based reagent | P54nrb mouse | Dharmacon E-048587-01-0005 | siRNA smartpool | Supplementary file 2 |
| Sequence-based reagent | PSPC1 mouse | Dharmacon E-049216-00-0005 | siRNA smartpool | Supplementary file 2 |
| Sequence-based reagent | SFPQ mouse | Dharmacon E-044760-00-0005 | siRNA smartpool | Supplementary file 2 |
| Sequence-based reagent | Nucleolin mouse | Dharmacon E-059054-00-0005 | siRNA smartpool | Supplementary file 2 |
| Sequence-based reagent | Rps2 mouse | Dharmacon E-049205-00-0005 | siRNA smartpool | Supplementary file 2 |
| Sequence-based reagent | hnRNPM mouse | Dharmacon E-044465-00-0005 | siRNA smartpool | Supplementary file 2 |
| Sequence-based reagent | siRNA non-targeting control | Dharmacon D-001910-10-20 | siRNA | Supplementary file 2 |
| Sequence-based reagent | NEAT1 A | LG00218175 | LNA gapmer | Supplementary file 2 |
| Sequence-based reagent | NEAT1 B | LG00218176 | LNA gapmer | Supplementary file 2 |
| Sequence-based reagent | NEAT1 C | LG00218177 | LNA gapmer | Supplementary file 2 |
| Sequence-based reagent | NEAT1 D | LG00218178 | LNA gapmer | Supplementary file 2 |
| Sequence-based reagent | NEAT1_2 | LG00234548 | LNA gapmer | Supplementary file 2 |
| Sequence-based reagent | NEGATIVE CONTROL | LG00000002 | LNA gapmer | Supplementary file 2 |
| Recombinant DNA reagent | pTRIP-CRHL+ | Sequence available on Dryad, (2) | SIN lentivector plasmid | doi:10.5061/dryad.nvx0k6dq7 |
| Recombinant DNA reagent | pTRIP-CRF1AL+ | Sequence available on Dryad, (17; 26) | SIN lentivector plasmid | doi:10.5061/dryad.nvx0k6dq7 |
| Recombinant DNA reagent | pTRIP-CRFL+ | Sequence available on Dryad, (25) | SIN lentivector plasmid | doi:10.5061/dryad.nvx0k6dq7 |
| Recombinant DNA reagent | pTRIP-CRVAaL+ | Sequence available on Dryad, (16) | SIN lentivector plasmid | doi:10.5061/dryad.nvx0k6dq7 |
| Recombinant DNA reagent | pTRIP-CRVAbL+ | Sequence available on Dryad, (16) | SIN lentivector plasmid | doi:10.5061/dryad.nvx0k6dq7 |
| Recombinant DNA reagent | pTRIP-CRhVCL+ | Sequence available on Dryad, (2) | SIN lentivector plasmid | doi:10.5061/dryad.nvx0k6dq7 |
| Recombinant DNA reagent | pTRIP-CRhVDL+ | Sequence available on Dryad, (13) | SIN lentivector plasmid | doi:10.5061/dryad.nvx0k6dq7 |
| Recombinant DNA reagent | pTRIP-CRMP2L+ | Sequence available on Dryad, (42) | SIN lentivector plasmid | doi:10.5061/dryad.nvx0k6dq7 |
| Recombinant DNA reagent | pTRIP-CREL+ | Sequence available on Dryad, (25) | SIN lentivector plasmid | doi:10.5061/dryad.nvx0k6dq7 |
| Recombinant DNA reagent | pTRIP-CRIGL+ | This paper | SIN lentivector plasmid | doi:10.5061/dryad.m0cfxpp75 |
| Recombinant DNA reagent | pCMV-dR8.91 | Addgene | Plasmid for lentivector production | |
| Recombinant DNA reagent | pCMV-VSV-G | Addgene | Plasmid for lentivector production | |
| Recombinant DNA reagent | pTRIP-Neat1-miR-G2 | This paper | SIN lentivector plasmid | doi:10.5061/dryad.m0cfxpp75 |
| Recombinant DNA reagent | pTRIP-Neat1_2-miR-G6 | This paper | SIN lentivector plasmid | doi:10.5061/dryad.m0cfxpp75 |
| Recombinant DNA reagent | pTRIP-Neat1_2-miR-G7 | This paper | SIN lentivector plasmid | doi:10.5061/dryad.m0cfxpp75 |
| Recombinant DNA reagent | pTRIP-HA2-P54nrb | This paper | SIN lentivector plasmid | doi:10.5061/dryad.m0cfxpp75 |
| Software, algorithm | Prism 6 | Graphpad | Software to perform statistics | https://www.graphpad.com/scientific-software/prism/ |
| Software, algorithm | Excel 2007 | Microsoft office | Software to perfom graphs and tables | |
| Software, algorithm | FIJI | FIJI | Software for image analysis | https://fiji.sc/ |
| Software, algorithm | ImageJ | ImageJ/NIH | Software for image analysis | https://imagej.nih.gov/ij/download.html |
| Software, algorithm | Zen black/Blue edition | Zeiss | Microscope software | https://www.zeiss.fr/microscopie/produits/microscope-software/zen-lite.html |
| Software, algorithm | QuantStudio | AppliedBiosystems | Quantification software | https://www.thermofisher.com/fr/fr/home/global/forms/life-science/quantstudio-3-5-software.html |
| Software, algorithm | QuantaSoft 1.7.4 | Bio-Rad | Western blot quantification software | https://www.bio-rad.com/fr-fr/sku/1864011-quantasoft-software-regulatory-edition?ID=1864011 |
| Software, algorithm | Microwin 2000 | Berthold | Microplaque testing software | https://fr.freedownloadmanager.org/Windows-PC/MikroWin-2000.html |
| Software, algorithm | LSM780 Zeiss confocal microscope | Zeiss | Microscope software | N/A |
| Software, algorithm | Compass for SW | Protein Simple | Capillary Western software | N/A |
Additional files
-
Supplementary file 1
IRES activities in normoxic and hypoxic HL-1 cells after Neat1 knock-down.
HL-1 cells were transduced with Lucky Luke bicistronic lentivector containing the IRES of FGF1 mRNA. Cells were submitted to normoxia or hypoxia 1% O2 during 4 hr, 8 hr or 24 hr. Renilla and firefly luciferase activities were measured (page 1) and the IRES activities evaluated with the ratio LucF/LucR (page 2). Mann-Whitney test was performed with n=12. **P<0.01. For each hypoxia condition the mean of the LucF/LucR ratio has been calculated with 12 cell culture biological replicates, normalized to normoxia Experiments A, B, C correspond to experiments performed at different dates, while 1, 2, 3, 4 are experiments performed in parallel at the same date, each of them being already the mean of three technical replicates (36 technical replicates in total).
- https://cdn.elifesciences.org/articles/69162/elife-69162-supp1-v2.docx
-
Supplementary file 2
Sequences of FISH and smiFISH probes, PCR primers, gapmers, siRNAs and Fluidigm probes.
A/ FISH and smiFISH probes. B/ qPCR primers and cloning primers. C/ LNA gapmers used in Neat1 knock-down assays. D/ SiRNA SMARTpools (Dharmacon) used for IRES activity studies. E/ Fluidigm deltagene primers. The corresponding genes are indicated in the left column.
- https://cdn.elifesciences.org/articles/69162/elife-69162-supp2-v2.docx
-
Supplementary file 3
IRES activities in normoxic and hypoxic HL-1 cells after Neat1 knock-down.
HL-1 cells were transduced with Lucky Luke bicistronic lentivectors containing the IRES of FGF1, FGF2, VEGFA (IRES a or b), VEGFC, VEGFD, IGF1R, MYC or EMCV. Cells were then treated with a pool of gapmers Neat1, or control during normoxia or hypoxia 1% O2. For the lentivector with FGF1 IRES, cells were also treated with the gapmer Neat1_2 (N1_2, page 2). Renilla and firefly luciferase activities were measured (upper panel) and the IRES activities evaluated with the ratio LucF/LucR (lower panel). Mann-Whitney test was performed with n=9. *P<0.05, **P<0.01, ***<0.001, ****P<0.0001. For each IRES the mean has been calculated with nine cell culture biological replicates Experiments A, B, C correspond to experiments performed at different dates, while 1, 2, 3 are experiments performed in parallel at the same date, each of them being already the mean of three technical replicates (27 technical replicates in total).
- https://cdn.elifesciences.org/articles/69162/elife-69162-supp3-v2.docx
-
Supplementary file 4
FGF1 IRES activity in normoxic and hypoxic HL-1 cells after Sfpq, Rps2, Hnrnpm knock-down.
HL-1 cells were transduced with a Lucky Luke bicistronic lentivector containing the IRES of FGF1. Cells were then treated with siSfpq (A), siRps2 (B), sihnRNPM (C), siNucleolin (siNcl, D) or siControl (siCtrl) smartpools during normoxia or hypoxia 1% O2. Renilla and firefly luciferase activities were measured and the IRES activities evaluated with the ratio LucF/LucR. Mann-Whitney test was performed with n=9 (n=12 for FGF1 IRES). *P<0.05, **P<0.01, ***<0.001, ****P<0.0001. For each siRNA the mean has been calculated with nine cell culture biological replicates Experiments A, B, C correspond to experiments performed at different dates, while 1, 2, 3 are experiments performed in parallel at the same date, each of them being already the mean of three technical replicates (27 technical replicates in total).
- https://cdn.elifesciences.org/articles/69162/elife-69162-supp4-v2.docx
-
Supplementary file 5
IRES activities in normoxic and hypoxic HL-1 cells after p54nrb knock-down.
HL-1 cells were transduced with Lucky Luke bicistronic lentivectors containing the IRES of FGF1, FGF2, VEGFA (IRES a or b), VEGFC, VEGFD, IGF1R, MYC or EMCV. Cells were then treated with siP54nrb or siControl (siCtrl) smartpool during normoxia or hypoxia 1% O2. Renilla and firefly luciferase activities were measured (upper panel, or page 1 for FGF1 IRES) and the IRES activities evaluated with the ratio LucF/LucR (lower panel, or page 2 for FGF1 IRES). Mann-Whitney test was performed with n=9 (n=12 for FGF1 IRES). *P<0.05, **P<0.01, ***<0.001, ****P<0.0001. For each IRES the mean has been calculated with nine cell culture biological replicates Experiments A, B, C correspond to experiments performed at different dates, while 1, 2, 3 are experiments performed in parallel at the same date, each of them being already the mean of three technical replicates (27 technical replicates in total).
- https://cdn.elifesciences.org/articles/69162/elife-69162-supp5-v2.docx
-
Supplementary file 6
IRES activities in normoxic and hypoxic HL-1 cells after Pspc1 knock-down.
HL-1 cells were transduced with Lucky Luke bicistronic lentivectors containing the IRES of FGF1, FGF2, VEGFA (IRES a or b), VEGFC, VEGFD, IGF1R, MYC or EMCV. Cells were then treated with siPSPC1 or siControl (siCtrl) smartpool during normoxia or hypoxia 1% O2. Renilla and firefly luciferase activities were measured (upper panel, or page 1 for FGF1 IRES) and the IRES activities evaluated with the ratio LucF/LucR (lower panel, or page 2 for FGF1 IRES). Mann-Whitney test was performed with n=9 (n=12 for FGF1 IRES). *P<0.05, **P<0.01, ***<0.001, ****P<0.0001. For each IRES the mean has been calculated with nine cell culture biological replicates Experiments A, B, C correspond to experiments performed at different dates, while 1, 2, 3 are experiments performed in parallel at the same date, each of them being already the mean of three technical replicates (27 technical replicates in total).
- https://cdn.elifesciences.org/articles/69162/elife-69162-supp6-v2.docx
-
Supplementary file 7
Label-free quantitative analysis of HA-P54nrb-bound proteins identified by mass spectrometry in different conditions.
p54nrb-HA transduced HL-1 cells were subjected to normoxia or hypoxia, then nucleus and cytoplasm fractionation was performed and extracts were immunoprecipitated using anti-HA antibody. Enriched interacting proteins were identified by using a label-free quantitative mass spectrometry approach. The dataset list of proteins identified by MS/MS is presented in alphabetical order. An unpaired bilateral student t-test with equal variance was used. Enrichment significance thresholds correspond to an absolute log2-transformed fold-change (FC) greater than 1 and a -log10-transformed (p-value) greater than 1.3.
- https://cdn.elifesciences.org/articles/69162/elife-69162-supp7-v2.xlsx
-
Supplementary file 8
Change of mRNA recruitment into polysomes following Neat1 or Neat1_2 knock-down.
HL-1 cardiomyocytes were transfected with gapmer Neat1, Neat1_2, or control. Polysomes were purified on sucrose gradient as described in Star Methods. RNAs were purified from cytoplasmic extracts and from pooled polysomal fractions and analyzed on a Fluidigm deltagene PCR array from two biologicals replicates (cell culture dishs and cDNAs), each of them measured in three technical replicates (PCR reactions). mRNA levels in polysomes (polysomal RNA/ total RNA) were analyzed for each gene. Relative quantification (RQ) of mRNA level was calculated using the 2–ΔΔCT method with normalization to Gapdh mRNA and to HL-1 tranfected by gapmer control, and is shown as fold change of expression. RQ1 and RQ2 correspond to two independent experiments. To measure the fold change of repression, the mean is expressed as –1/RQ for the values <1 (yellow column).
- https://cdn.elifesciences.org/articles/69162/elife-69162-supp8-v2.docx
-
Transparent reporting form
- https://cdn.elifesciences.org/articles/69162/elife-69162-transrepform1-v2.docx
Download links
A two-part list of links to download the article, or parts of the article, in various formats.
Downloads (link to download the article as PDF)
Open citations (links to open the citations from this article in various online reference manager services)
Cite this article (links to download the citations from this article in formats compatible with various reference manager tools)
Long non-coding RNA Neat1 and paraspeckle components are translational regulators in hypoxia
eLife 11:e69162.
https://doi.org/10.7554/eLife.69162


