A covariation analysis reveals elements of selectivity in quorum sensing systems
- Department of Microbiology, University of Washington, United States
- Department of Biochemistry, University of Washington, United States
- Institute for Protein Design, University of Washington, United States
- Eugene McDermott Center for Human Growth and Development, University of Texas Southwestern Medical Center, United States
- Department of Biophysics, University of Texas Southwestern Medical Center, United States
- Howard Hughes Medical Institute, University of Washington, United States
Figures
Figure 1

Schematic of acyl-homoserine lactone (AHL) quorum sensing (QS).
(A) AHL QS circuits contain a signal synthase, a LuxI homolog (LasI in this cartoon), that produces an AHL signal. At low cell densities, the system exists in an ‘off’ state. At high cell densities, the AHL concentration increases and the signal binds its cytosolic receptor, a LuxR homolog (LasR in this cartoon), which functions as a transcription factor. (B) LuxI-type synthases produce AHL signals from two substrates: S-adenosyl methionine (SAM) and an activated organic acid in the form of an acyl-acyl carrier protein (ACP) or, in some cases, an acyl-coenzyme A (CoA). SAM provides the lactone core, which is conserved across all AHL signals, while the acyl-ACP (shown here) provides an acyl moiety which varies between signaling systems. In this example, the synthase LasI produces N-3-oxo-dodecanoyl-L-homoserine lactone (3OC12-HSL).
Figure 2 with 3 supplements
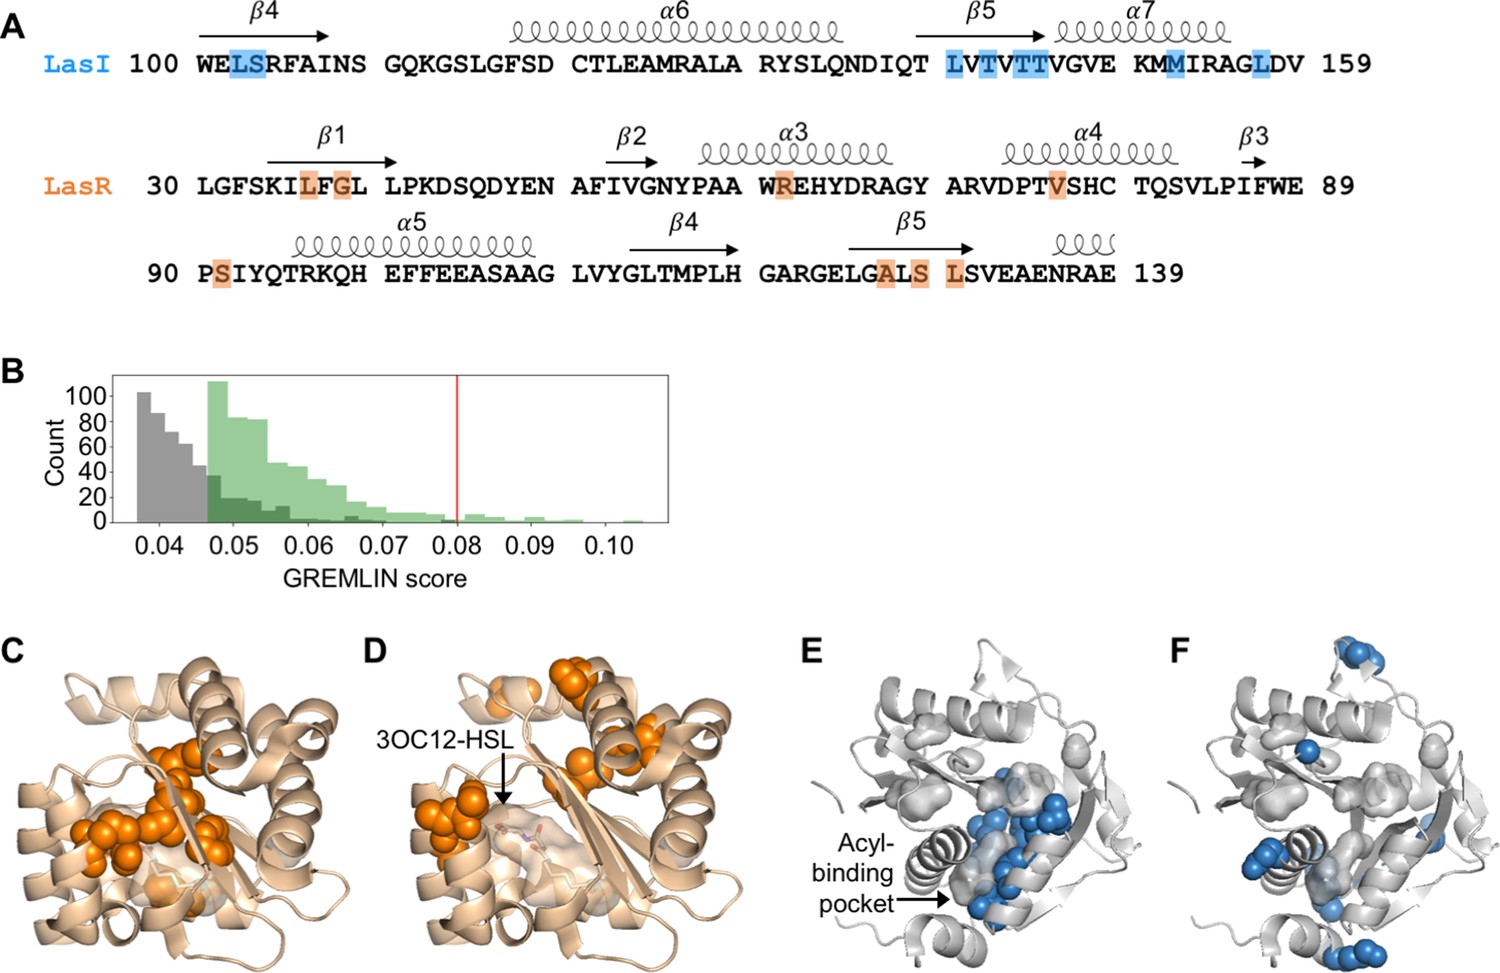
Covarying residues identified in LasI/R.
(A) Top-scoring covarying residues based on an integrated analysis of the Las and Lux systems are shaded in blue or orange on the primary amino acid sequences of LasI (synthase) and LasR (receptor), respectively. Secondary structures, shown as arrows (sheets) and loops (helixes), are based on crystal structures for LasI and LasR (PDB 1RO5 and PDB 3IX3, respectively). The list of top-scoring residue pairs along with their GRELMIN scores (with average product correction [APC]) is shown in Figure 2—figure supplement 3A. (B) Distribution of GREMLIN scores (with APC) for the top 500 pairs from the Las analysis (green) and the randomized control (gray). The top score in the control was 0.08, as indicated by the red line. (C) Top-scoring covarying residues mapped onto the N-terminal LasR ligand-binding domain (covarying residues in orange, N-3-oxo-dodecanoyl-L-homoserine lactone [3OC12-HSL] colored by element; PDB 3IX3) and (E) LasI (covarying residues in blue; PDB 1RO5). Top-scoring residues in the randomized control are mapped onto (D) LasR and (F) LasI as in panels C and E.
-
Figure 2—source data 1
Acyl-homoserine lactone (AHL) synthase and receptor sequences used in this study, aligned to LasI/R.
- https://cdn.elifesciences.org/articles/69169/elife-69169-fig2-data1-v3.txt
-
Figure 2—source data 2
Acyl-homoserine lactone (AHL) synthase and receptor sequences used in this study, aligned to LuxI/R.
- https://cdn.elifesciences.org/articles/69169/elife-69169-fig2-data2-v3.txt
Figure 2—figure supplement 1
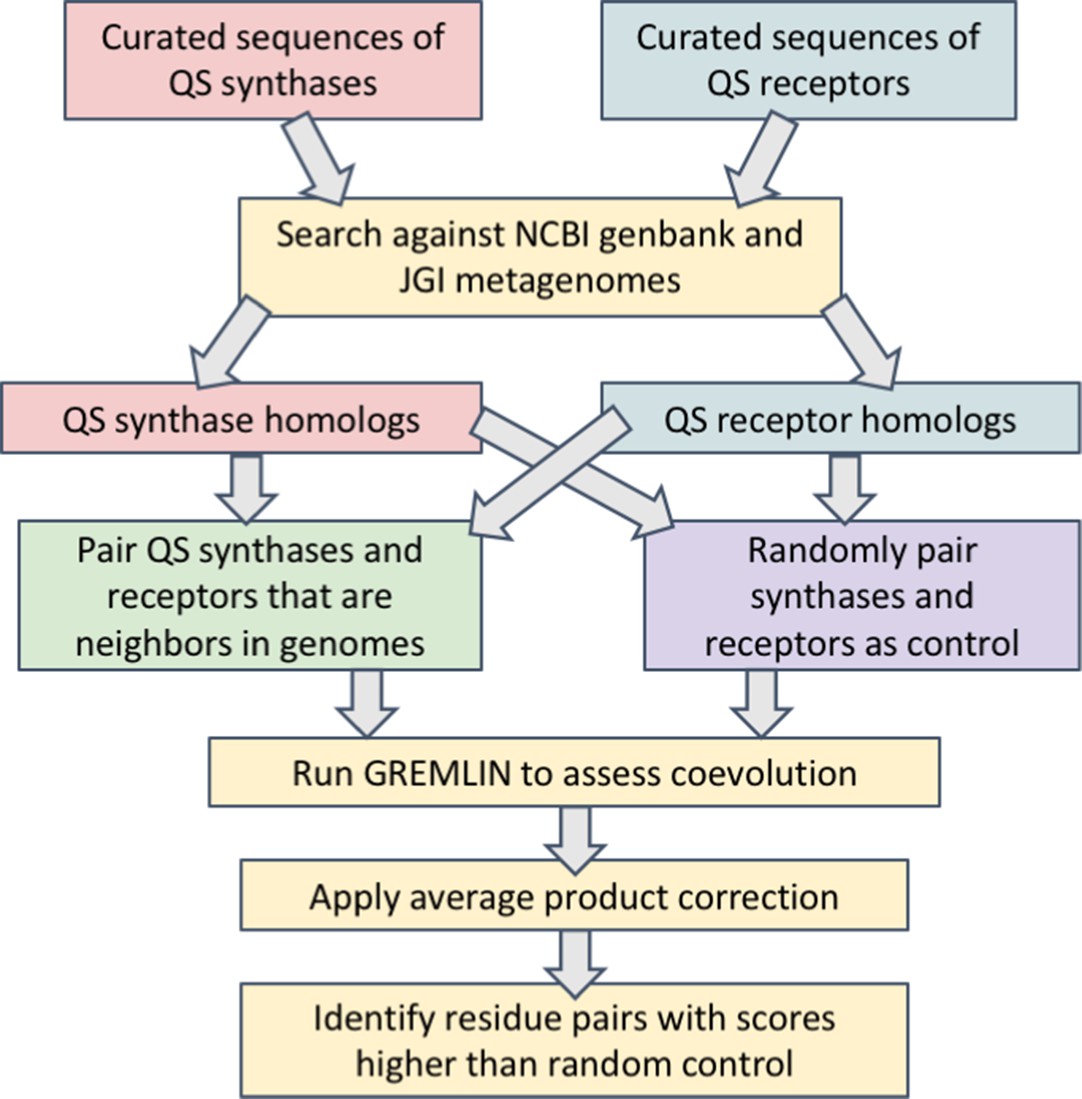
Workflow for the identification of covarying residues in acyl-homoserine lactone (AHL) quorum sensing (QS) synthases and receptors.
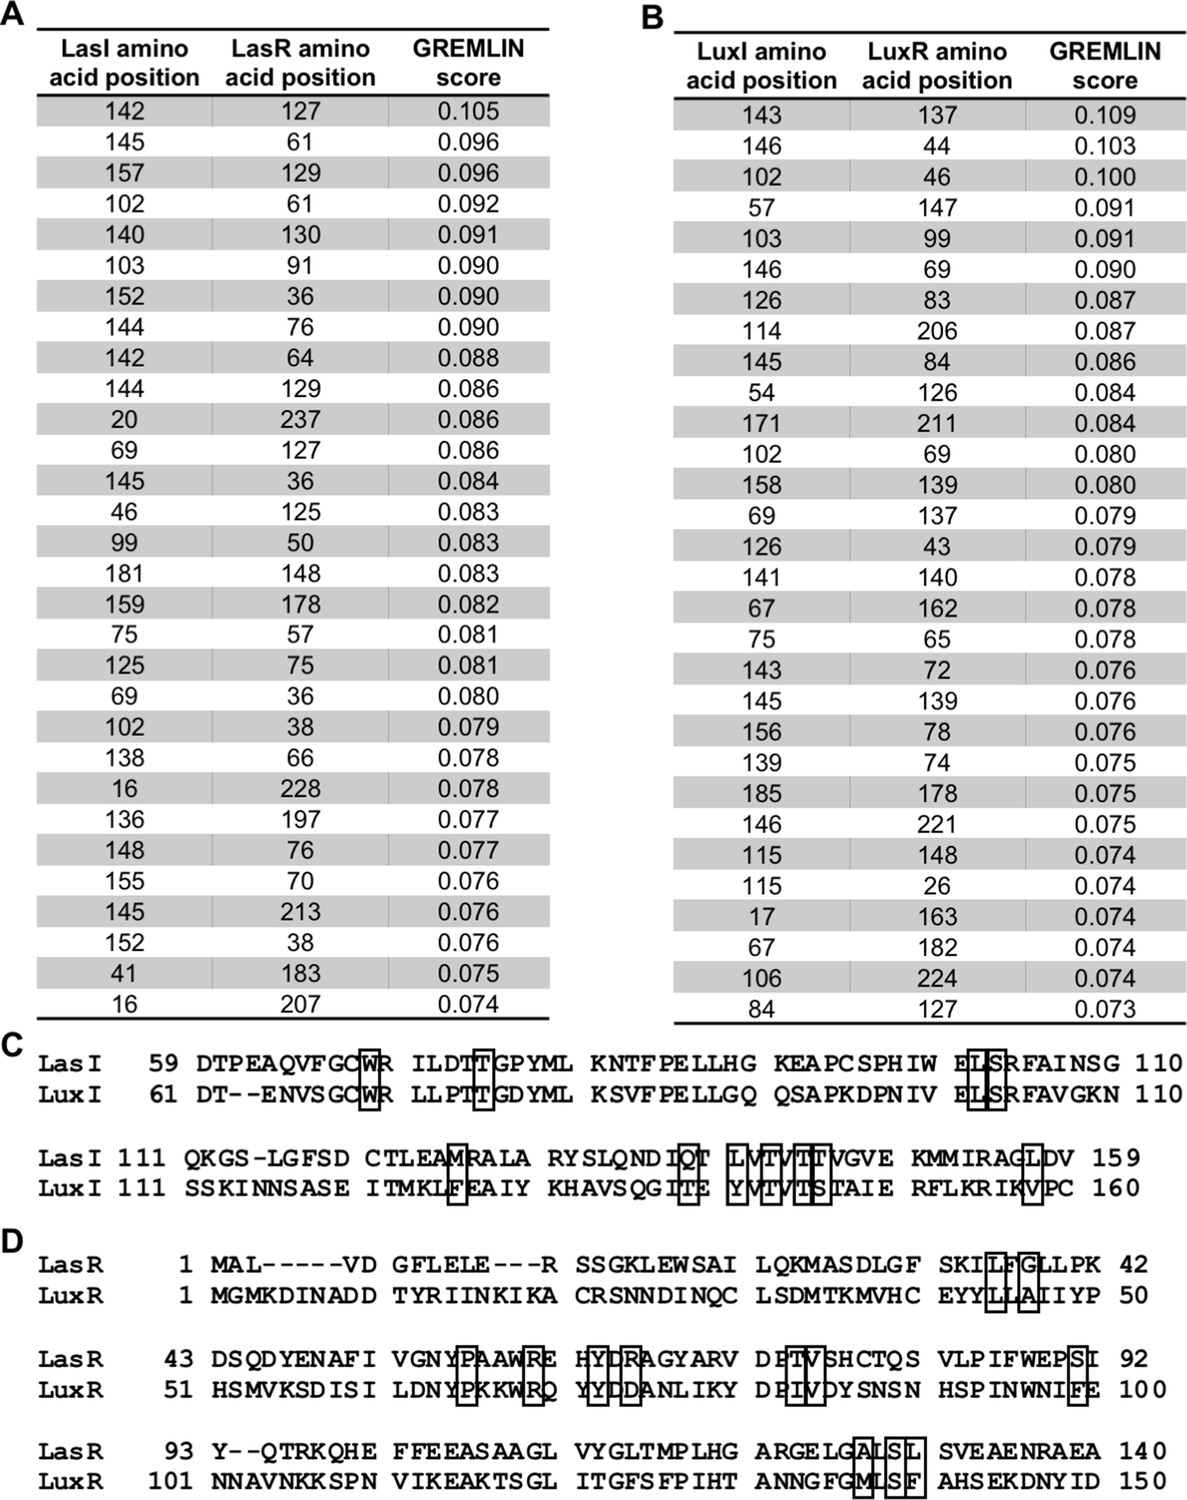
Figure 2—figure supplement 2
Top-scoring GREMLIN residues.
Top-scoring covarying amino acid residues identified in (A) Pseudomonas aeruginosa PAO1 LasI/R or (B) Vibrio fischeri MJ11 LuxI/R along with the GREMLIN score (with average product correction [APC]) for each pair. Residues that appear on both lists are shown in boxes on the sequence alignments (C) of LasI and LuxI and (D) of LasR and LuxR. Only relevant portions of the protein sequences are shown.
Figure 2—figure supplement 3
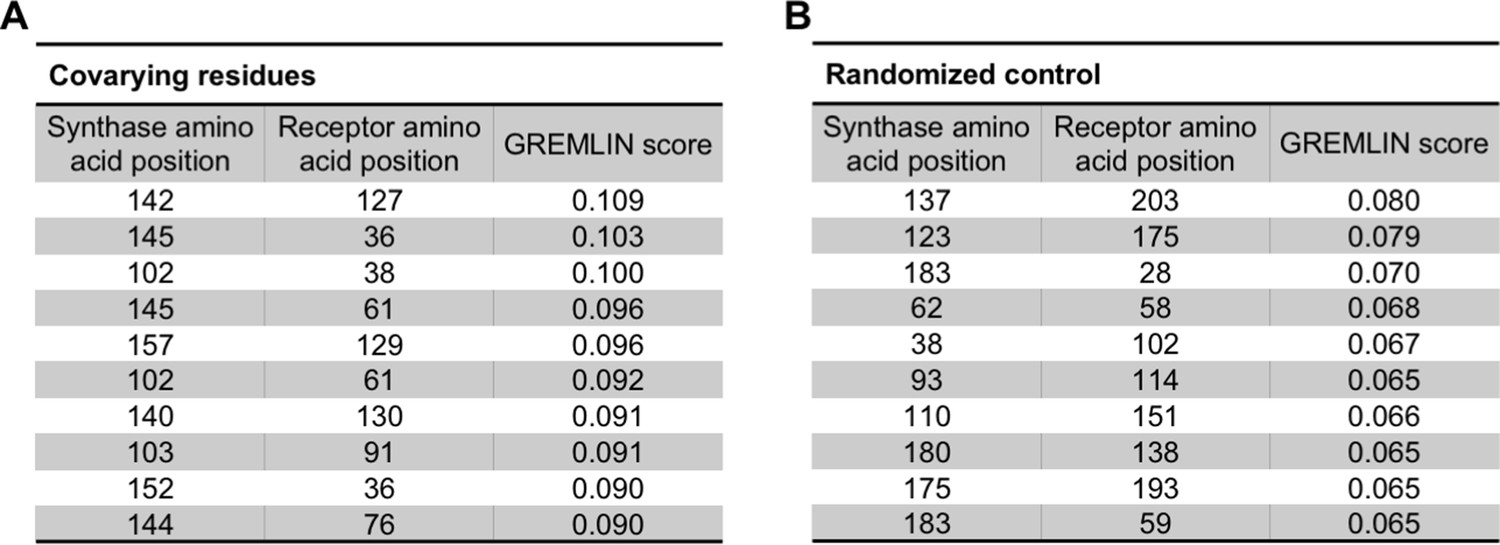
Covarying residues identified in LasI/R and in a randomized control.
(A) Top-scoring covarying residues in LasI (synthase) and LasR (receptor) along with the top GREMLIN score (with average product correction [APC]) for each residue pair based on an integrated analysis of the Las and Lux systems. (B) Top-scoring residues in a randomized control, mapped onto LasI/R, along with the GREMLIN score (with APC) for each pair.
Figure 3 with 1 supplement
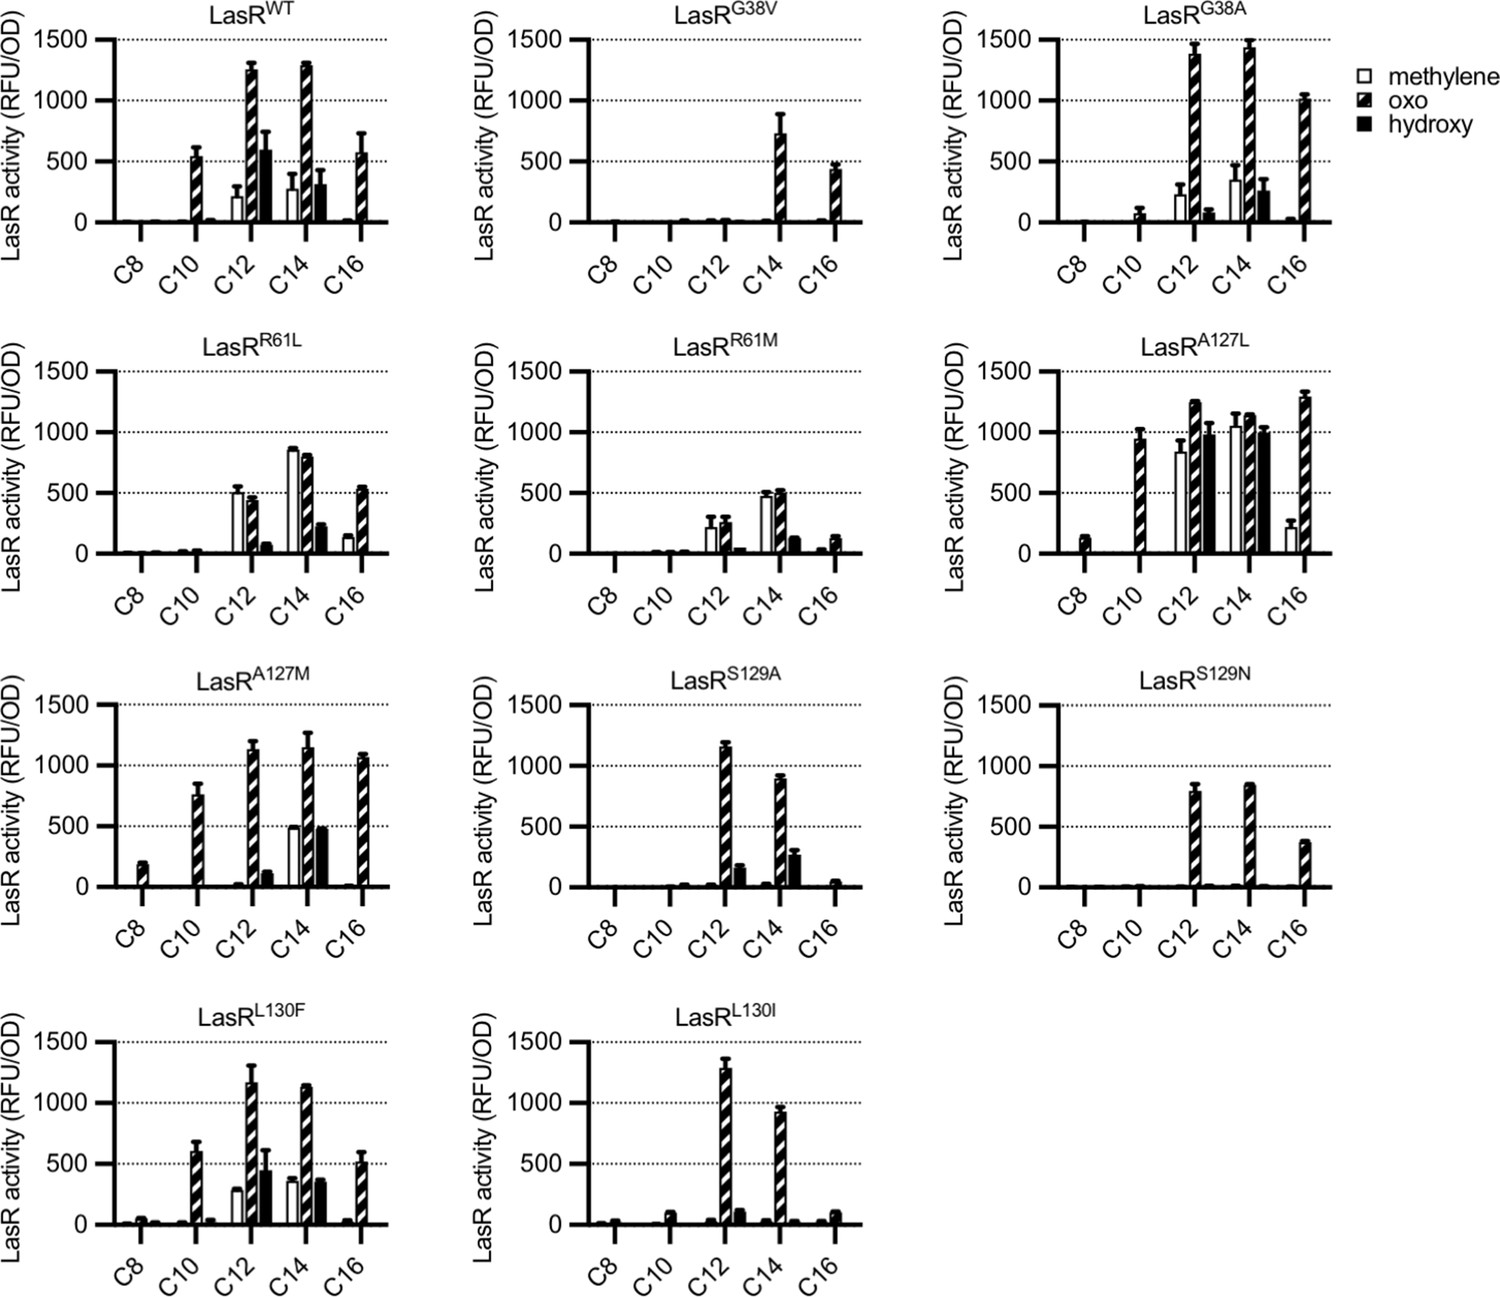
Activity of LasR variants in Escherichia coli.
LasR activity in response to a panel of acyl-homoserine lactone (AHL) signals (100 nM; chain length indicated on horizontal axis, C3 modification indicated by shading, structures and names are shown in Figure 3—figure supplement 1) is reported as relative fluorescence units (RFU) normalized by optical density at 600 nm (OD). Wild-type lasR (WT) or lasR with the indicated amino acid substitution were expressed from pJNL in E. coli harboring pPROBE-PrsaL. Signals with four or six carbons in the acyl chain did not activate any of the LasR variants and are not shown. The following LasR variants had little or no activity in response to 100 nM AHLs: R61V, R61Q, S129T, G38L. Data are the mean and standard deviation of two biological replicates and are representative of three (variants) or ten (WT) independent experiments.
Figure 3—figure supplement 1
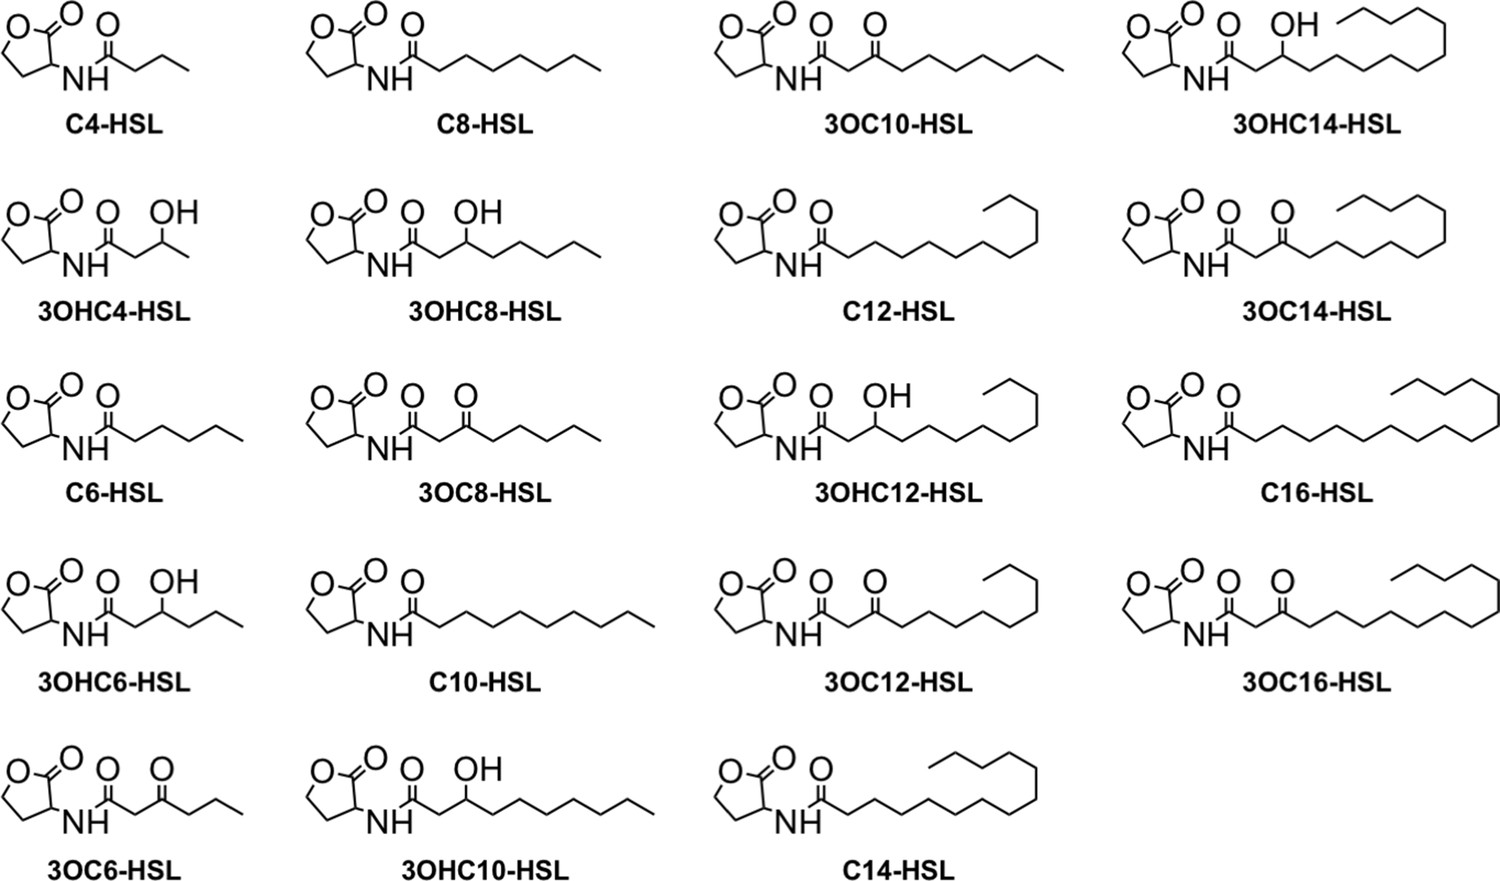
Acyl-homoserine lactone (AHL) panel used in this study.
The structures and non-IUPAC names of each AHL signal used in the panels shown in Figure 3, Figure 4—figure supplement 1, and Figure 6—figure supplement 2.
Figure 4 with 2 supplements
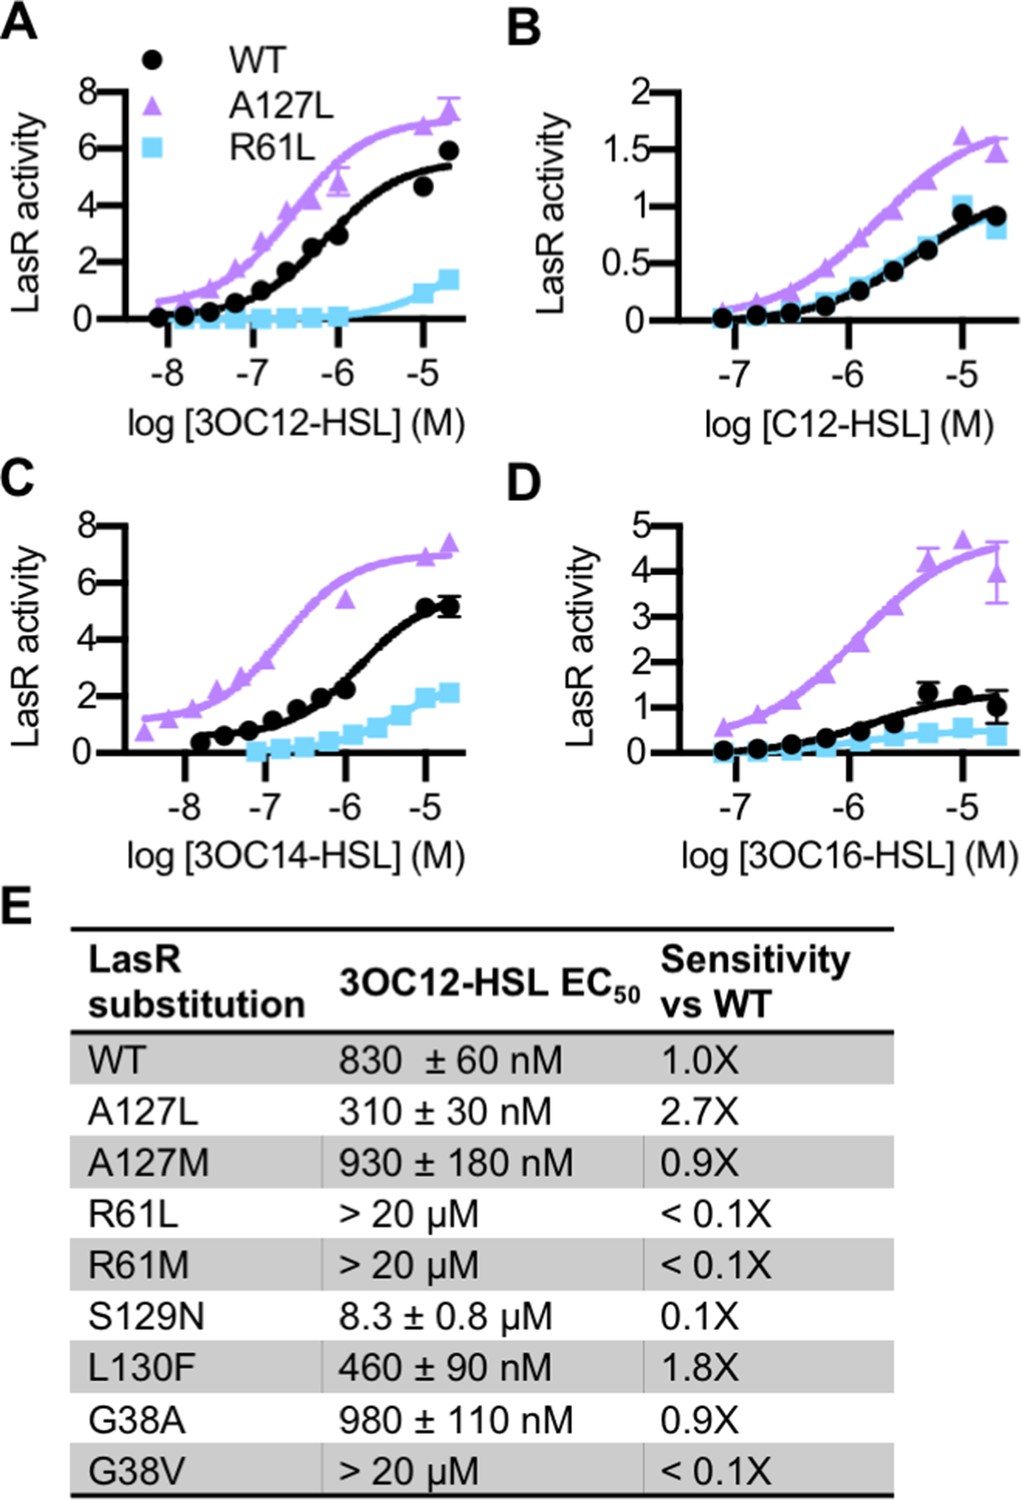
Activity of LasR variants in Pseudomonas aeruginosa.
Activity of chromosomal lasR mutants in P. aeruginosa PAO-SC4 pPROBE-PrsaL in response to (A) N-3-oxo-dodecanoyl-L-homoserine lactone (3OC12-HSL), (B) N-dodecanoyl-L-homoesrine lactone (C12-HSL), (C) N-3-oxo-tetradecanoyl-L-homoserine lactone (3OC14-HSL), or (D) N-3-oxo-hexadecanoyl-L-homoserine lactone (3OC16-HSL). Structures of the signals are shown in Figure 3—figure supplement 1. Amino acid substitutions are indicated. Wild type (WT) is shown in black, LasRA127L in purple, and LasRR61L in blue. The horizontal axis indicates acyl-homoserine lactone (AHL) concentration. LasR activity is reported on the vertical axis as relative fluorescence units normalized by optical density at 600 nm (RFU/OD × 1000). Data are the mean and standard deviation of three biological replicates and are representative of three independent experiments. (E) The half maximal effective concentration (EC50) of 3OC12-HSL for P. aeruginosa PAO-SC4 LasR variants. Data are the mean and SEM of three (variants) or six (WT) independent experiments (representative data shown in Figure 4—figure supplement 1B). Sensitivity of the variants compared to LasRWT is calculated by dividing WT EC50 by variant EC50.
Figure 4—figure supplement 1
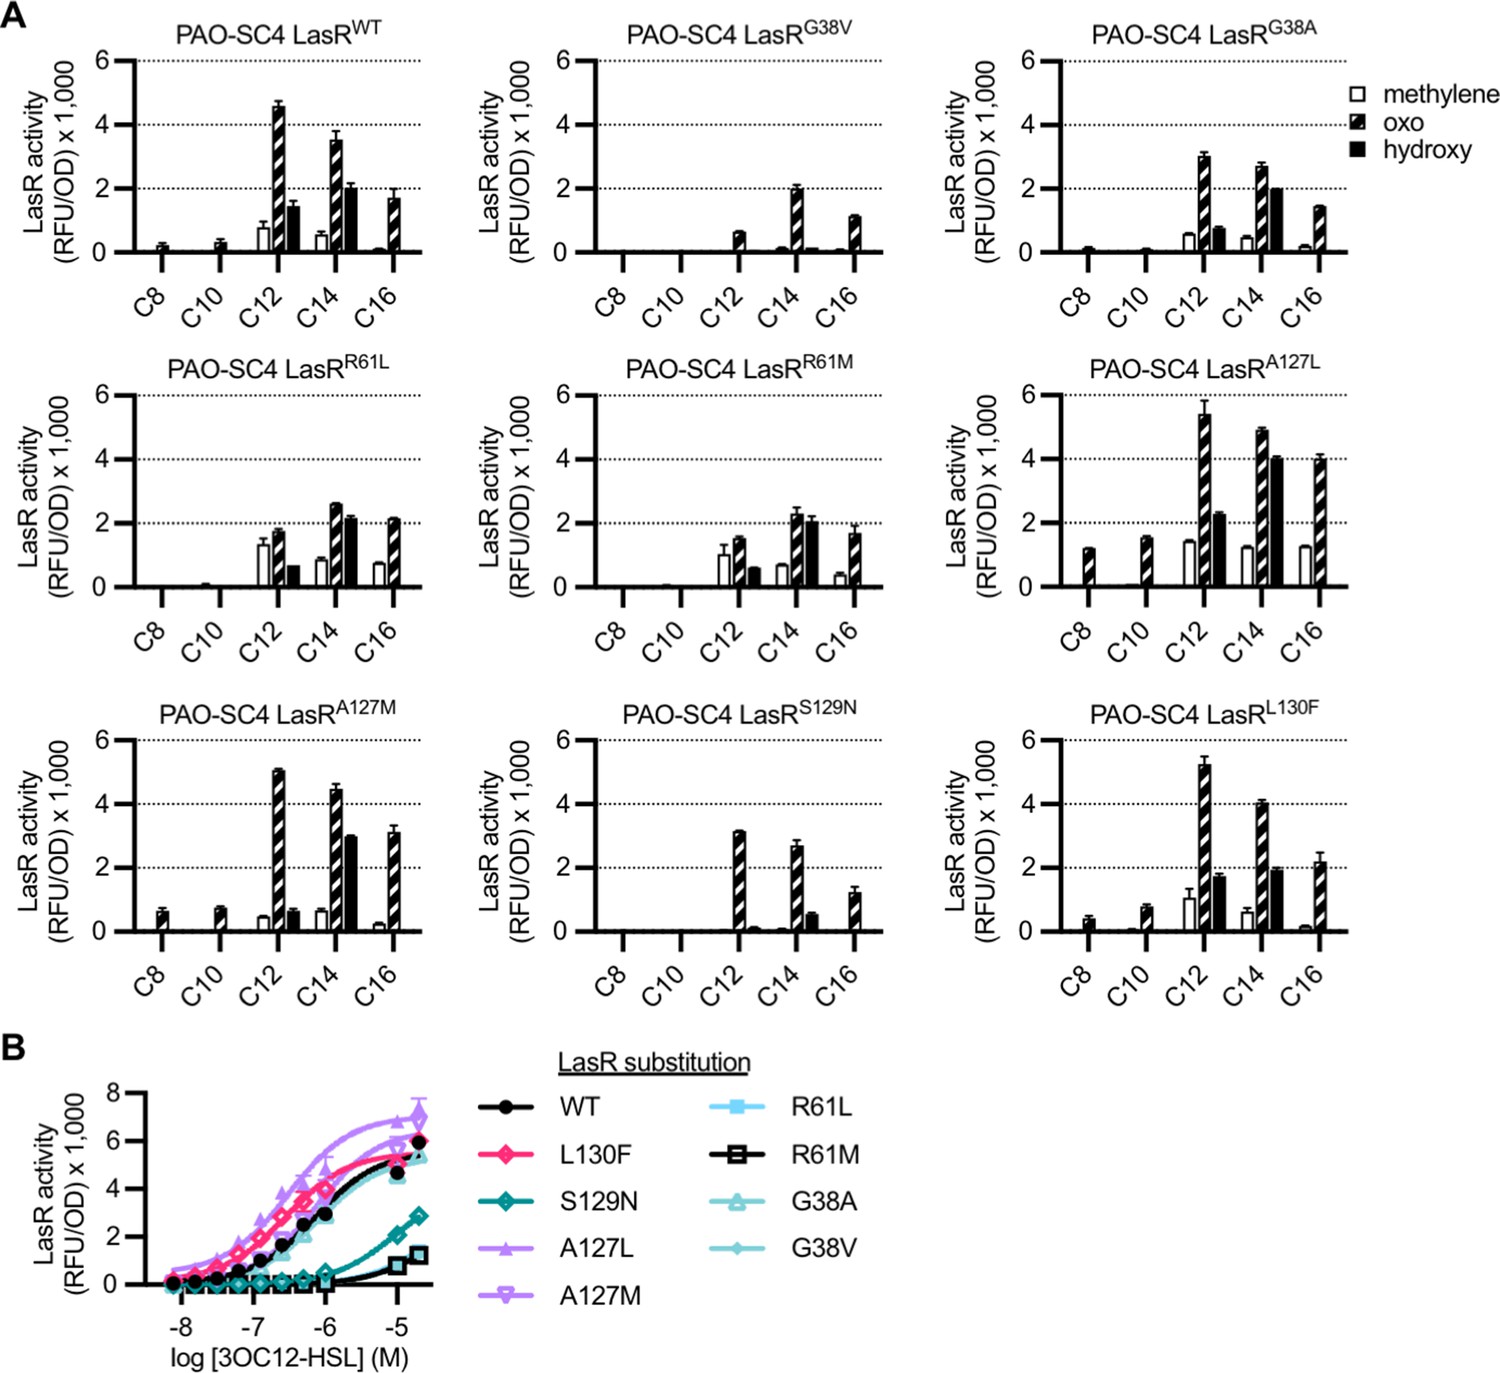
Activity of LasR variants in Pseudomonas aeruginosa.
The activity of unmarked, chromosomal lasR mutants of P. aeruginosa PAO-SC4 containing pPROBE-PrsaL measured as GFP fluorescence (relative fluorescence units normalized to optical density at 600 nm, RFU/OD). (A) Activity of each LasR mutant or wild type (WT) in response to a panel of 19 acyl-homoserine lactones (AHLs) at 20 μM. AHLs with four or six carbons in the acyl chain did not activate any of the LasR variants and are not shown. Data are the mean and standard deviation of two biological replicates and are representative of three independent experiments. (B) Activity of each LasR variant or WT in response to N-3-oxo-dodecanoyl-L-homoserine lactone (3OC12-HSL). Data are the mean and standard deviation of three biological replicates and are representative of three independent experiments.
Figure 4—figure supplement 2
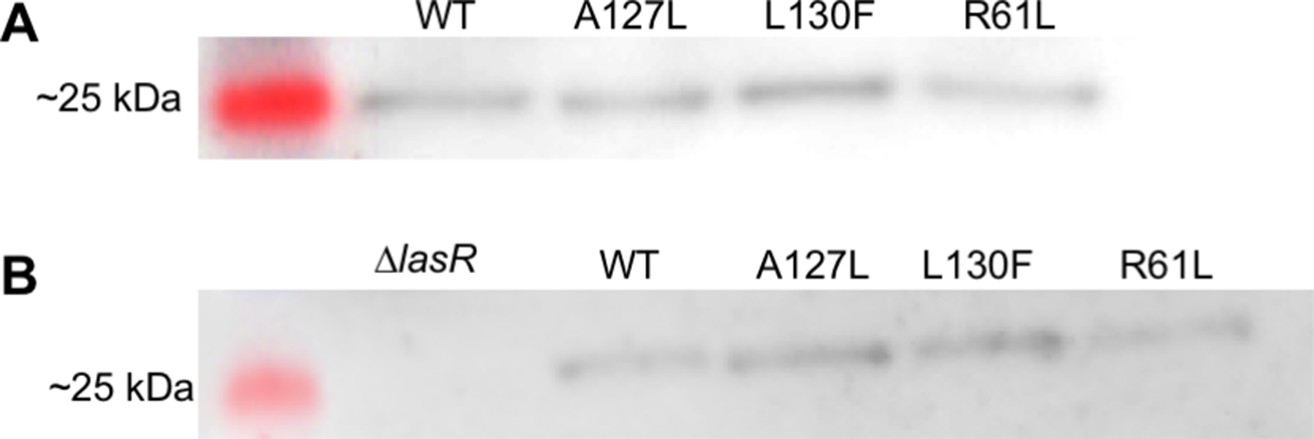
LasR solubility.
The relative abundance of soluble LasR in Pseudomonas aeruginosa PAO-SC4 was detected by immunoblotting in two independent experiments, as shown in panels A and B. Each P. aeruginosa PAO-SC4 variant harbored wild- type (WT) or mutant lasR, indicated as amino acid substitutions in the lane labels. LasR is 26.6 kDa and panel B contains the negative control, P. aeruginosa PAO1∆lasR. Chemiluminescent images are overlaid with images of the protein ladder from the same blot.
-
Figure 4—figure supplement 2—source data 1
Chemiluminescent anti-LasR immunoblot image shown in Figure 4—figure supplement 2A.
Lanes 1–4 are not relevant and not shown in any figure. Lane 5 contains a protein ladder. Lanes 6–9 contain the soluble fraction of lysed cultures of PAO-SC4 with the following LasR amino acid substitutions: (6) wild type (WT), (7) A127L, (8) L130F, (9) R61L.
- https://cdn.elifesciences.org/articles/69169/elife-69169-fig4-figsupp2-data1-v3.png.zip
-
Figure 4—figure supplement 2—source data 2
Chemiluminescent anti-LasR immunoblot image shown in Figure 4—figure supplement 2A with lanes and bands labeled.
- https://cdn.elifesciences.org/articles/69169/elife-69169-fig4-figsupp2-data2-v3.tiff.zip
-
Figure 4—figure supplement 2—source data 3
Chemiluminescent anti-LasR immunoblot image shown in Figure 4—figure supplement 2B.
Lane 1 contains a protein ladder. Lane 2 contains the soluble fraction of lysed Pseudomonas aeruginosa PAO1∆lasR. Lanes 3–6 contain the soluble fraction of lysed cultures of PAO-SC4 with the following LasR amino acid substitutions: (3) wild type (WT), (4) A127L, (5) L130F, (6) R61L.
- https://cdn.elifesciences.org/articles/69169/elife-69169-fig4-figsupp2-data3-v3.png.zip
-
Figure 4—figure supplement 2—source data 4
Chemiluminescent anti-LasR immunoblot image shown in Figure 4—figure supplement 2B with lanes and bands labeled.
- https://cdn.elifesciences.org/articles/69169/elife-69169-fig4-figsupp2-data4-v3.tiff.zip
Figure 5 with 1 supplement

Activity of LasI variants.
High-performance liquid chromatography (HPLC) analysis of radiolabeled acyl-homoserine lactones (AHLs) extracted from culture fluid of Pseudomonas aeruginosa PAO-SC4 harboring (A) pJN-RBSlasIWT or (B) pJN-RBSlasIL157W. The horizontal axis denotes the HPLC fraction number (fractions 1–14 are not shown). The methanol gradient is indicated as a dashed line plotted on the right vertical axis. The left vertical axis indicates the amount of radioactivity (counts per minute [cpm]) in each fraction. Data are representative of two (L157W) or three (wild type [WT]) independent experiments. Arrow 1 indicates the fraction in which N-3-oxo-octanoyl-L-homoserine lactone (3OC8-HSL) elutes, arrow 2 indicates the fraction in which N-3-oxo-decanoyl-L-homoserine lactone (3OC10-HSL) elutes, and arrow 3 indicates the fraction in which N-3-oxo-dodecanoyl-L-homoserine lactone (3OC12-HSL) elutes.
Figure 5—figure supplement 1
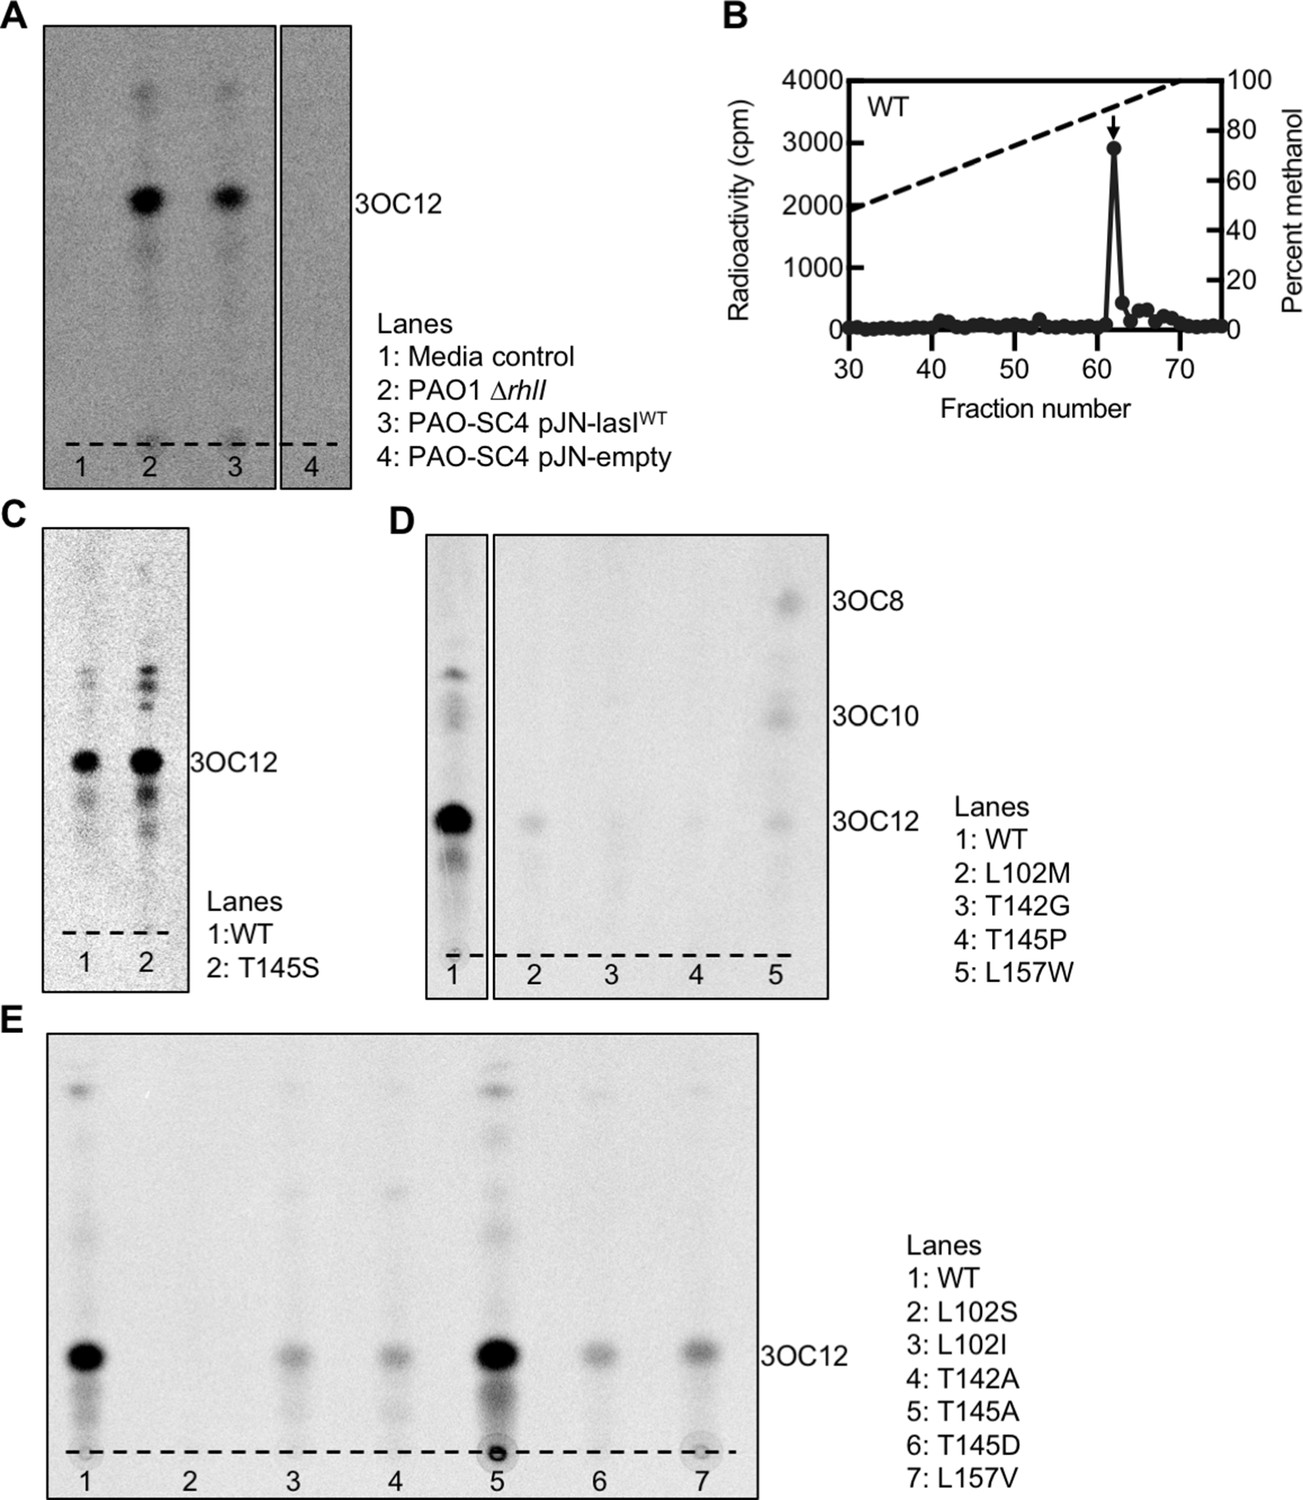
Radiotracer assays of LasI activity.
(A) Thin layer chromatography (TLC) analysis of 14C-AHLs extracted from Pseudomonas aeruginosa PAO1ΔrhlI or from P. aeruginosa PAO-SC4 harboring pJN-lasIWT or pJN-empty or from a media control in which no cells were present. The dashed lines indicates the origin. Results are representative of two independent experiments. The identities of the major spots on each TLC were deduced from high-performance liquid chromatography (HPLC) analysis of select extracts with comparison to chemically synthesized acyl-homoserine lactone (AHL) standards. (B) Extracts from P. aeruginosa PAO-SC4 pJN-lasIWT shown in panel A were also analyzed by HPLC. The horizontal axis denotes the fraction number; fractions 1–29 are not shown. The dashed line indicates the methanol gradient, plotted on the right vertical axis. The counts per minute (cpm) of radioactivity in each fraction are plotted on the left vertical axis. The arrow indicates the fraction in which N-3-oxo-dodecanoyl-L-homoserine lactone (3OC12-HSL) elutes. (C–E) TLC analysis of 14C-AHLs extracted from P. aeruginosa PAO-SC4 pJN-lasI wild type (WT) or with the indicated amino acid substitution.
-
Figure 5—figure supplement 1—source data 1
Phosphor imaging of radio-thin layer chromatography (TLC) shown in Figure 5—figure supplement 1A.
This TLC contained six samples. 14C-AHLs were extracted from (1) media-only control, (2) Pseudomonas aeruginosa PAO1ΔrhlI, (3) PAO-SC4 pJN-lasIWT, (4) PAO-SC4 pJN-lasI140Y, 145S, 152L, 157V, (5) PAO-SC4 pJN-lasI125I, 140Y, (6) PAO-SC4 pJN-empty. Lanes 1 and 6 have no detectable radioactivity, lanes 4 and 5 are irrelevant and not shown in any figure.
- https://cdn.elifesciences.org/articles/69169/elife-69169-fig5-figsupp1-data1-v3.jpeg.zip
-
Figure 5—figure supplement 1—source data 2
Phosphor imaging of radio-thin layer chromatography (TLC) shown in Figure 5—figure supplement 1A with lanes labeled and colors inverted.
- https://cdn.elifesciences.org/articles/69169/elife-69169-fig5-figsupp1-data2-v3.tiff.zip
-
Figure 5—figure supplement 1—source data 3
Phosphor imaging of radio-thin layer chromatography (TLC) shown in Figure 5—figure supplement 1C.
This TLC contained nine samples. 14C-AHLs were extracted from PAO-SC4 harboring pJN-lasI with the following amino acid substitutions: (1) wild type (WT), (2) 145S, (3) 152L, (4) 157V, (5) 145S, 152L. Lanes 6–9 are not relevant and not shown in any figure. Lanes from this TLC are also shown in Figure 7—figure supplement 2E as the second set of images in a series of three TLC images.
- https://cdn.elifesciences.org/articles/69169/elife-69169-fig5-figsupp1-data3-v3.jpg.zip
-
Figure 5—figure supplement 1—source data 4
Phosphor imaging of radio-thin layer chromatography (TLC) shown in Figure 5—figure supplement 1C with lanes labeled and colors inverted.
- https://cdn.elifesciences.org/articles/69169/elife-69169-fig5-figsupp1-data4-v3.tiff.zip
-
Figure 5—figure supplement 1—source data 5
Phosphor imaging of radio-thin layer chromatography (TLC) shown in Figure 5—figure supplement 1D.
This TLC contained nine samples. 14C-AHLs were extracted from PAO-SC4 harboring pJN-lasI with the following amino acid substitutions: (1) wild type (WT), (2) 125I, (3) 125I, 152L, (4) 125I, 145S, 152L, (5) 102M, (6) 142G, (7) 145P, (8) 157W, (9) 140Y. Lanes 1–4 of this TLC are also shown in Figure 7—figure supplement 2E as the first image in a series of three TLC images. Lane 9 is irrelevant and not shown in any figure.
- https://cdn.elifesciences.org/articles/69169/elife-69169-fig5-figsupp1-data5-v3.jpeg.zip
-
Figure 5—figure supplement 1—source data 6
Phosphor imaging of radio-thin layer chromatography (TLC) shown in Figure 5—figure supplement 1D with lanes labeled and colors inverted.
- https://cdn.elifesciences.org/articles/69169/elife-69169-fig5-figsupp1-data6-v3.tiff.zip
-
Figure 5—figure supplement 1—source data 7
Phosphor imaging of radio-thin layer chromatography (TLC) shown in Figure 5—figure supplement 1E.
This TLC contained nine samples. 14C-AHLs were extracted from: (1) Pseudomonas aeruginosa PAO1ΔrhlI, (2) PAO-SC4 pJN-empty, (3) PAO-SC4 pJN-lasIWT, (4) PAO-SC4 pJN-lasI102S, (5) PAO-SC4 pJN-lasI102I, (6) PAO-SC4 pJN-lasI142A, (7) PAO-SC4 pJN-lasI145A, (8) PAO-SC4 pJN-lasI145D, (9) PAO-SC4 pJN-lasI157V. Lanes 3–9 are shown with labels in Figure 5—figure supplement 1E. Lanes 1 and 2 are not shown in any figure.
- https://cdn.elifesciences.org/articles/69169/elife-69169-fig5-figsupp1-data7-v3.jpeg.zip
Figure 6 with 4 supplements
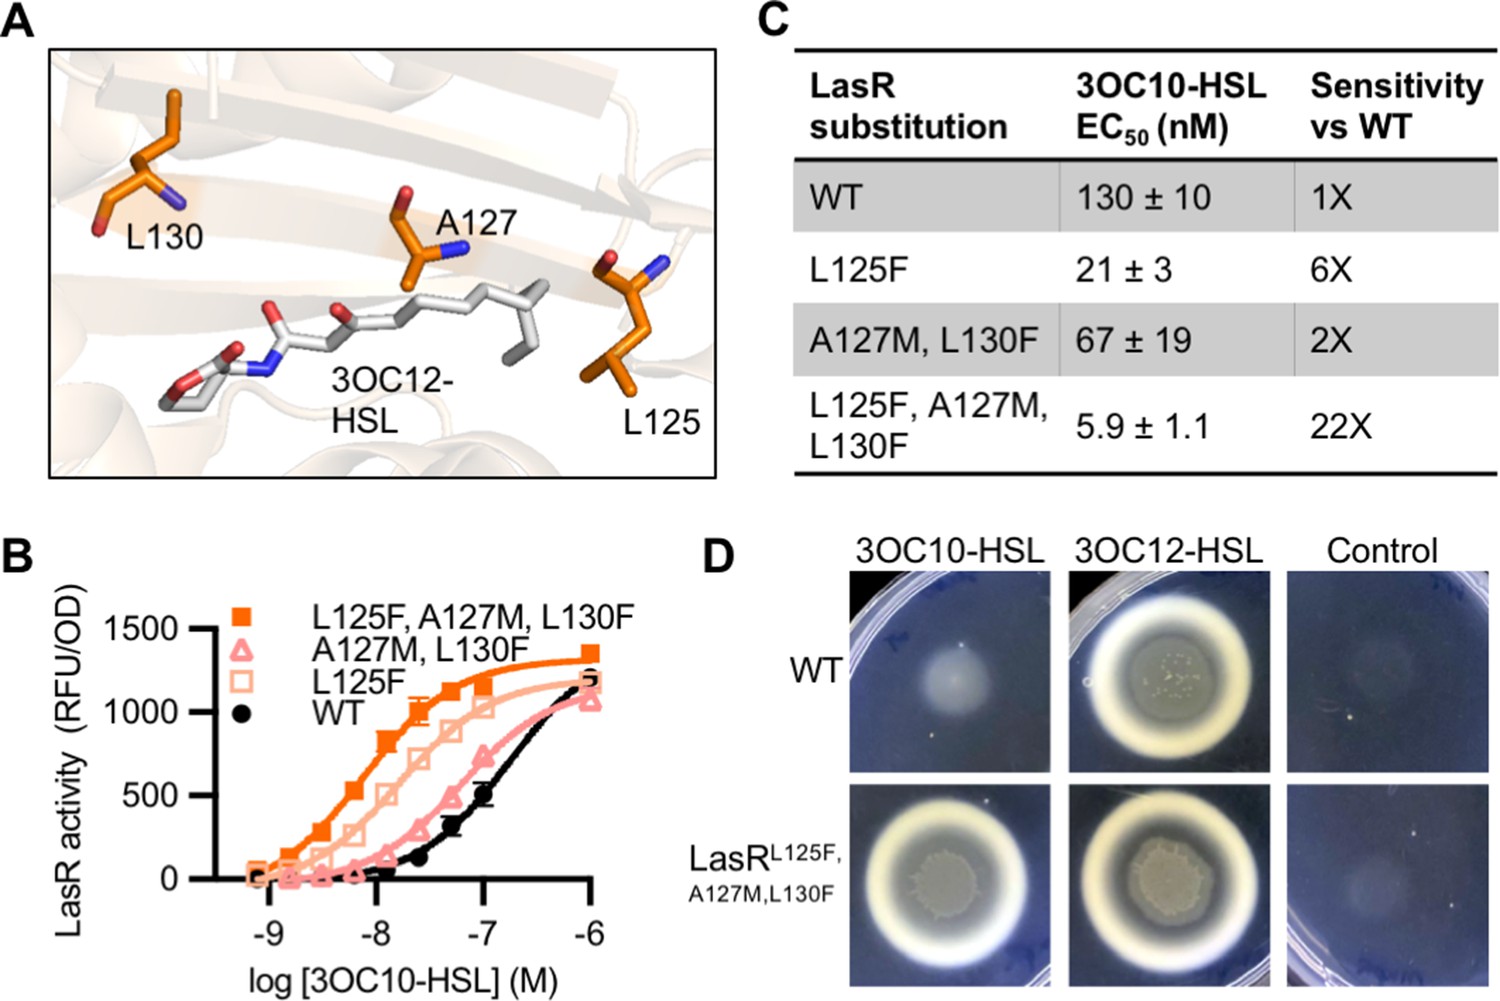
Engineering LasR to respond to N-3-oxo-decanoyl-L-homoserine lactone (3OC10-HSL).
(A) Residues altered in LasR shown as orange sticks in the LasR structure (PDB 3IX3). N-3-oxo-dodecanoyl-L-homoserine lactone (3OC12-HSL) is shown in gray. (B) LasR activity in response to 3OC10-HSL measured in Escherichia coli harboring pJNL (wild type [WT], or with indicated amino acid substitutions) and pPROBE-PrsaL. Data are the mean and standard deviation of three biological replicates and are representative of three independent experiments. (C) Half maximal effective concentration (EC50) of 3OC10-HSL for LasR, calculated from three independent experiments (representative data shown in panel B). Data are mean and SEM. Sensitivity of mutants compared to LasRWT is calculated by dividing the WT EC50 by mutant EC50. (D) Growth of Pseudomonas aeruginosa PAO-SC4 LasRWT or LasRL125F, A127M, L130F on casein agar with 10 µM 3OC10-HSL, 3OC12-HSL, or a vehicle control (DMSO). Data are representative of three independent experiments.
-
Figure 6—source data 1
Full images of casein plates shown in Figure 6D.
Pseudomonas aeruginosa PAO-SC4 wild type (WT) or harboring LasRL125F, A127M, L130F are labeled as ‘WT’ or ‘mutant’, respectively. Plates are 60 mm × 15 mm.
- https://cdn.elifesciences.org/articles/69169/elife-69169-fig6-data1-v3.tiff.zip
Figure 6—figure supplement 1
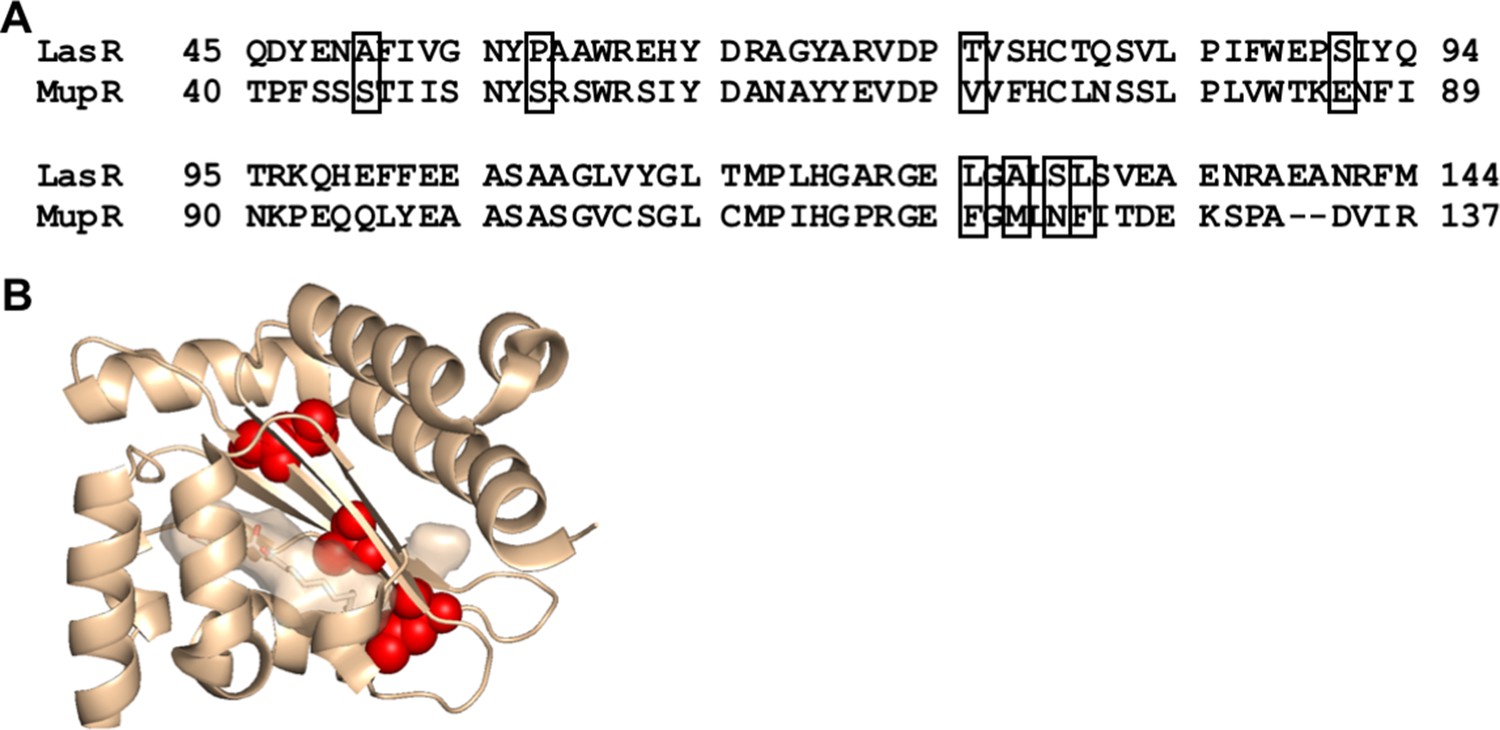
Comparison of LasR and MupR protein sequences.
(A) Sequence alignment of LasR and MupR. Boxes indicate covarying residues with a GREMLIN score (with average product correction [APC]) > 0.08 that differ between the two proteins. (B) Amino acids altered in ‘MupR-like’ LasR shown as red spheres on the crystal structure of the LasR ligand-binding domain (PDB 3IX3).
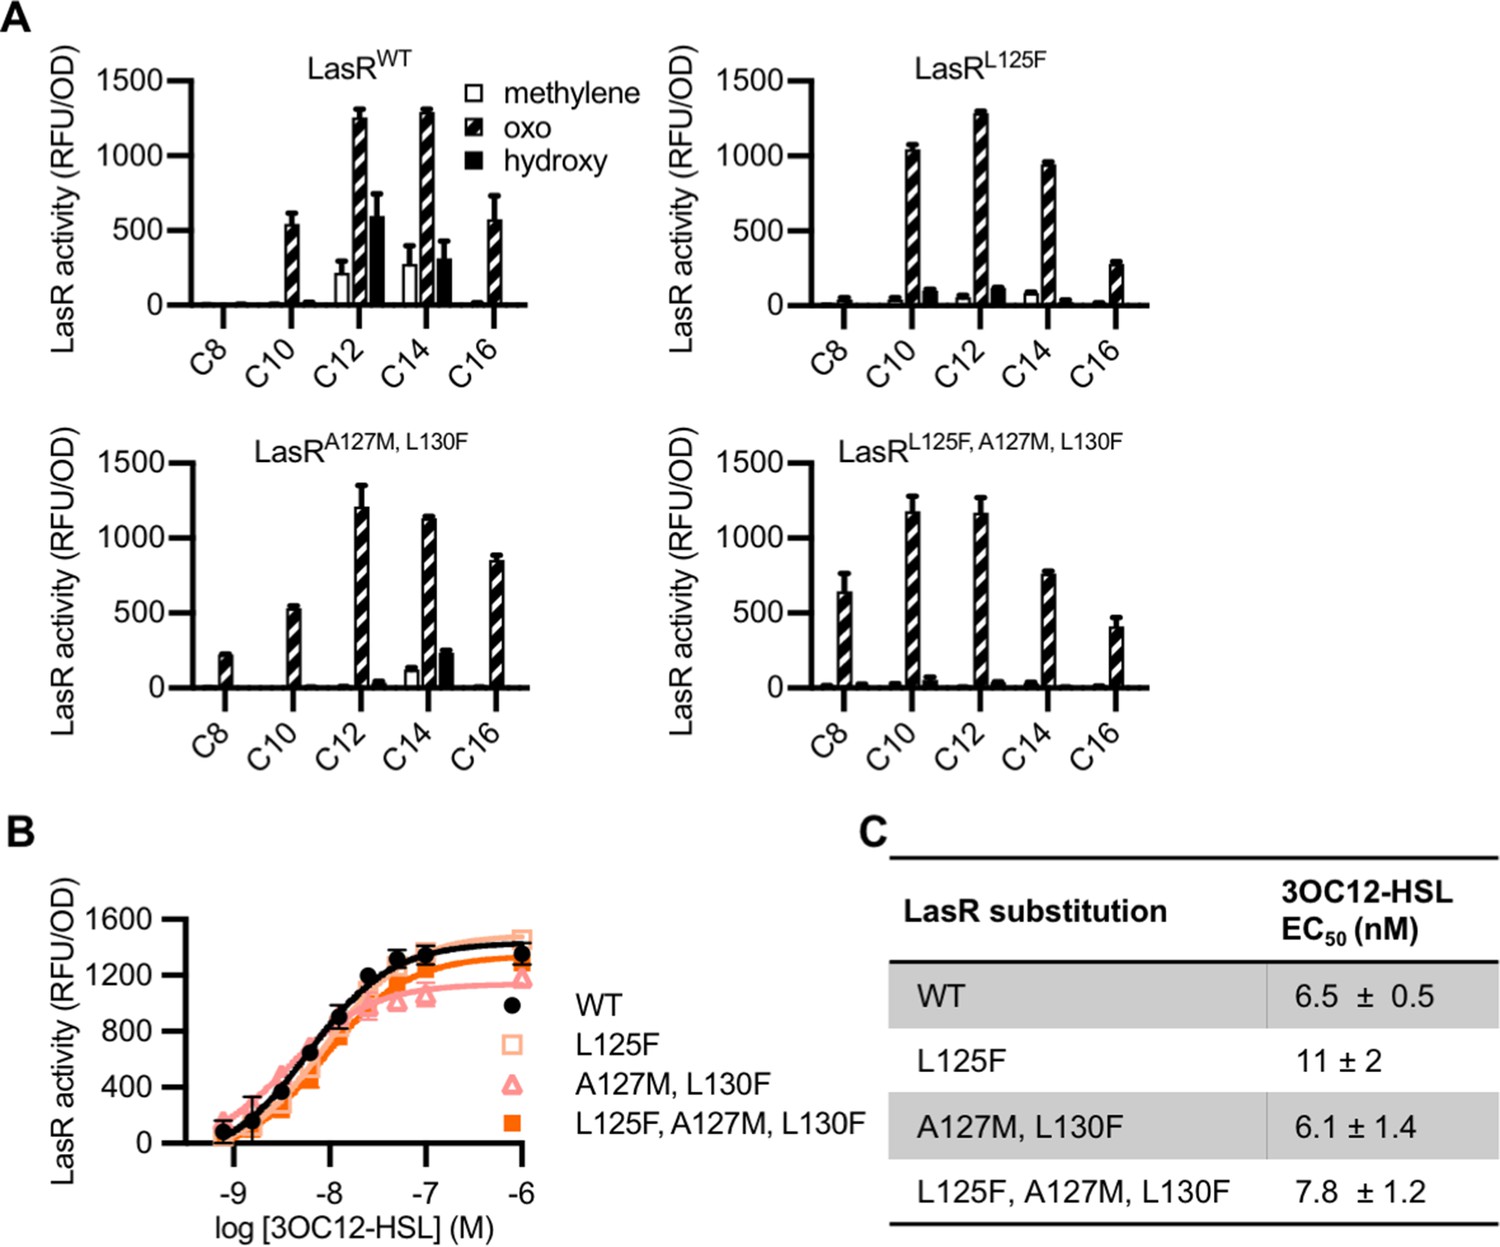
Figure 6—figure supplement 2
‘MupR-like’ LasR variant activity.
(A) Activity of LasR (wild type [WT] or with the indicated amino acid substitution) measured in Escherichia coli pJNL pPROBE-PrsaL in response to a panel of 19 acyl-homoserine lactone (AHL) signals at 100 nM. AHLs with four or six carbons in the acyl chain did not activate any of the LasR variants and are not shown. LasR activity is reported as relative fluorescence units (RFU) normalized to optical density at 600 nm (OD). Data are the mean and standard deviation of two biological replicates and are representative of three (mutants) or ten (WT) independent experiments. (B) Activity of WT or mutant LasR measured in E. coli pJNL pPROBE-PrsaL in response to N-3-oxo-dodecanoyl-L-homoserine lactone (3OC12-HSL). Data are the mean and standard deviation of three biological replicates and are representative of three independent experiments. (C) Half maximal effective concentration (EC50) of N-3-oxo-dodecanoyl-L-homoserine lactone (3OC12-HSL) for LasR, calculated from three independent experiments (representative data shown in panel B). Data are mean and SEM.
Figure 6—figure supplement 3
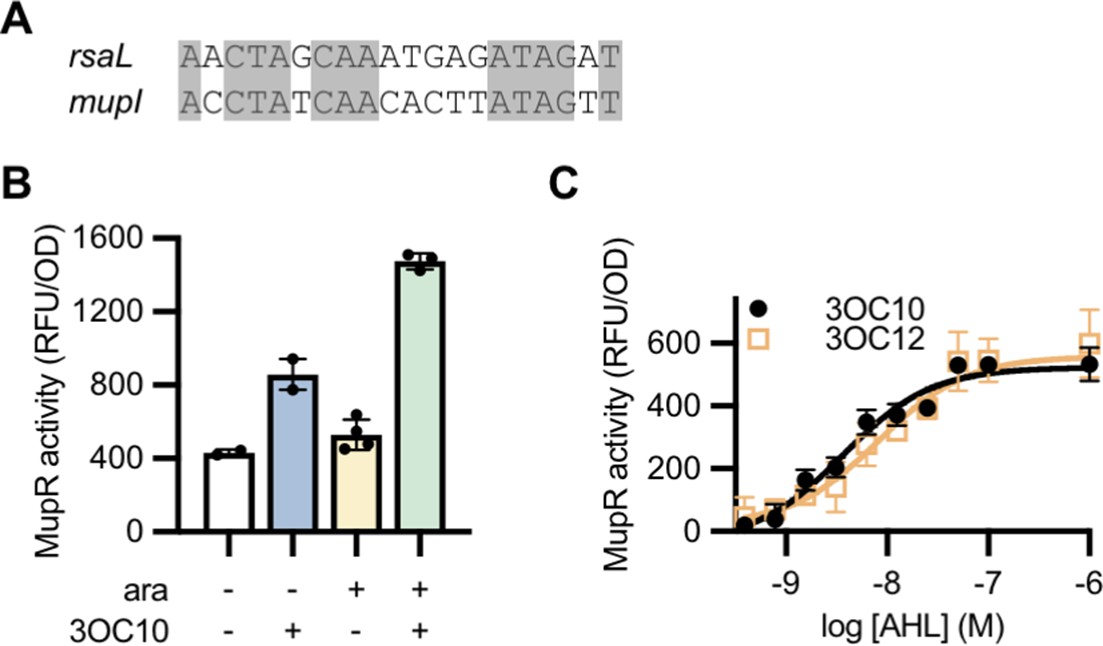
Activity of a MupR transcriptional reporter.
(A) Alignment of the potential MupR-binding site upstream of the mupI open reading frame with the LasR-binding site upstream of rsaL. (B) Fluorescence (relative fluorescence units [RFU]) normalized to optical density at 600 nm (OD) of Escherichia coli harboring the mupR expression vector pJN105-mupR and the transcriptional reporter pPROBE-PmupI. Where indicated, arabinose (ara) was added to induce mupR expression and N-3-oxo-decanoyl-L-homoserine lactone (3OC10-HSL) (10 µM) was added to stimulate MupR activity at the mupI promoter. Data are the mean and range of two to four biological replicates (indicated as individual data points) and are representative of three independent experiments. (C) MupR activity, measured as fluorescence normalized to optical density (RFU/OD) in E. coli harboring pJN105-mupR and pPROBE-PmupI, in response to the indicated concentration of 3OC10-HSL or N-3-oxo-dodecanoyl-L-homoserine lactone (3OC12-HSL). Data are the mean and standard deviation of three biological replicates and are representative of two independent experiments.
Figure 6—figure supplement 4
Activity ‘MupR-like’ LasR variants in Pseudomonas aeruginosa.
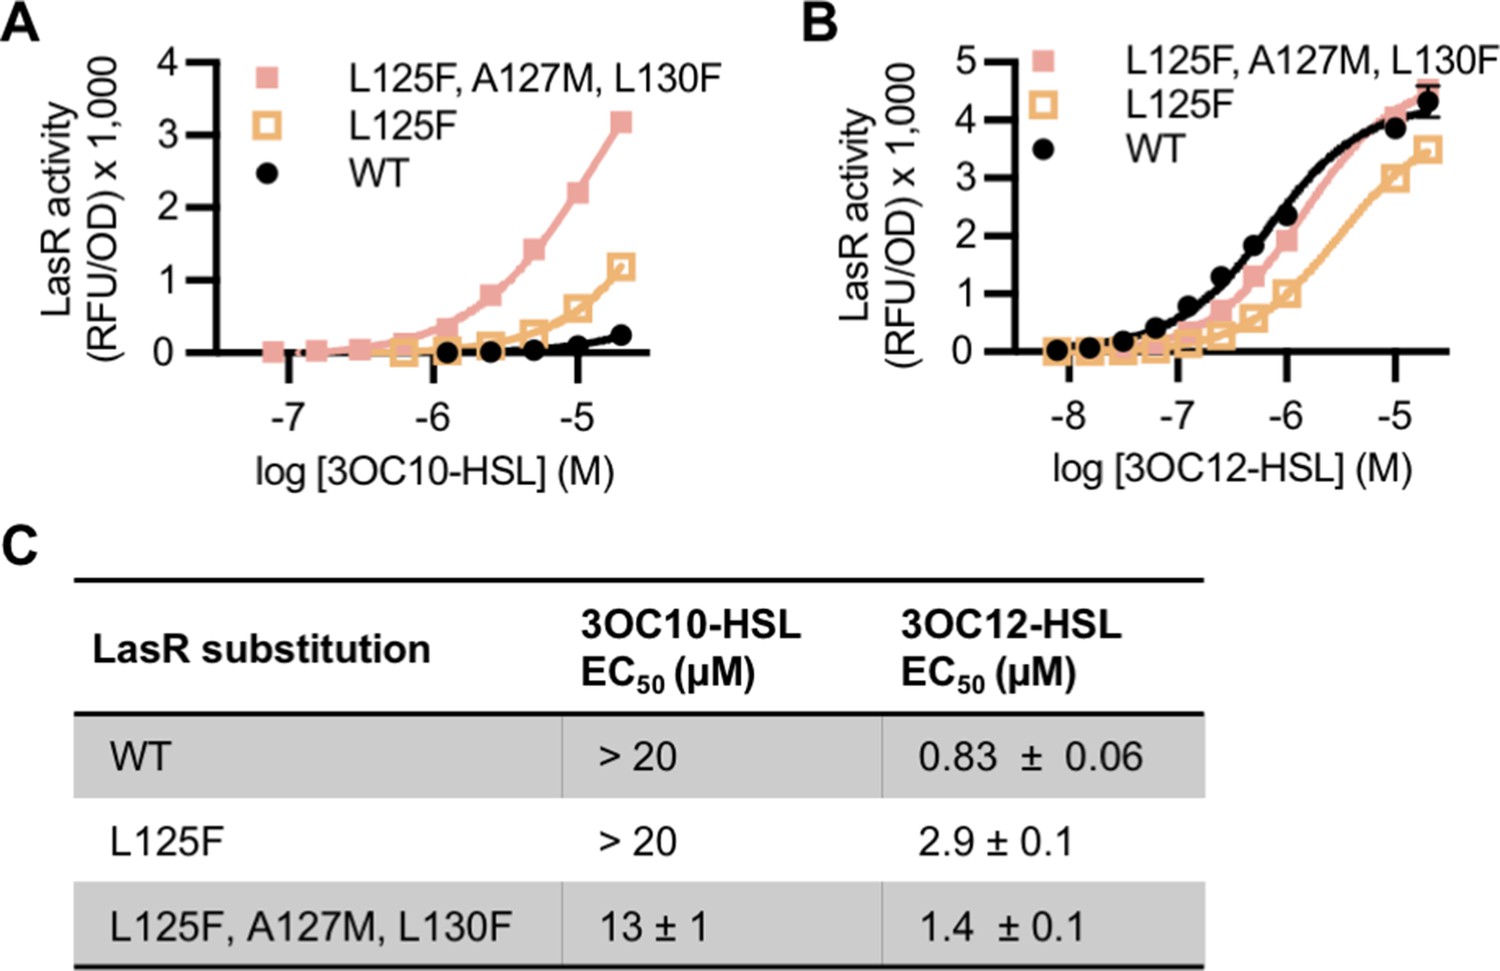
LasR activity in unmarked chromosomal lasR mutants of P. aeruginosa PAO-SC4 harboring pRPOBE-PrsaL measured as GFP fluorescence (relative fluorescence units normalized to optical density at 600 nm, RFU/OD). Activity of LasR with the indicated amino acid substitution(s) was measured in response to the indicated concentrations of (A) N-3-oxo-decanoyl-L-homoserine lactone (3OC10-HSL) or (B) N-3-oxo-dodecanoyl-L-homoserine lactone (3OC12-HSL). Data are the mean and standard deviation of three biological replicates and are representative of three independent experiments. (C) Half maximal effective concentration (EC50) of 3OC10-HSL and 3OC12-HSL for LasR, calculated from three (variants) or six (wild type) independent experiments (representative data shown in panels A and B). Data are mean and SEM.
Figure 7 with 2 supplements
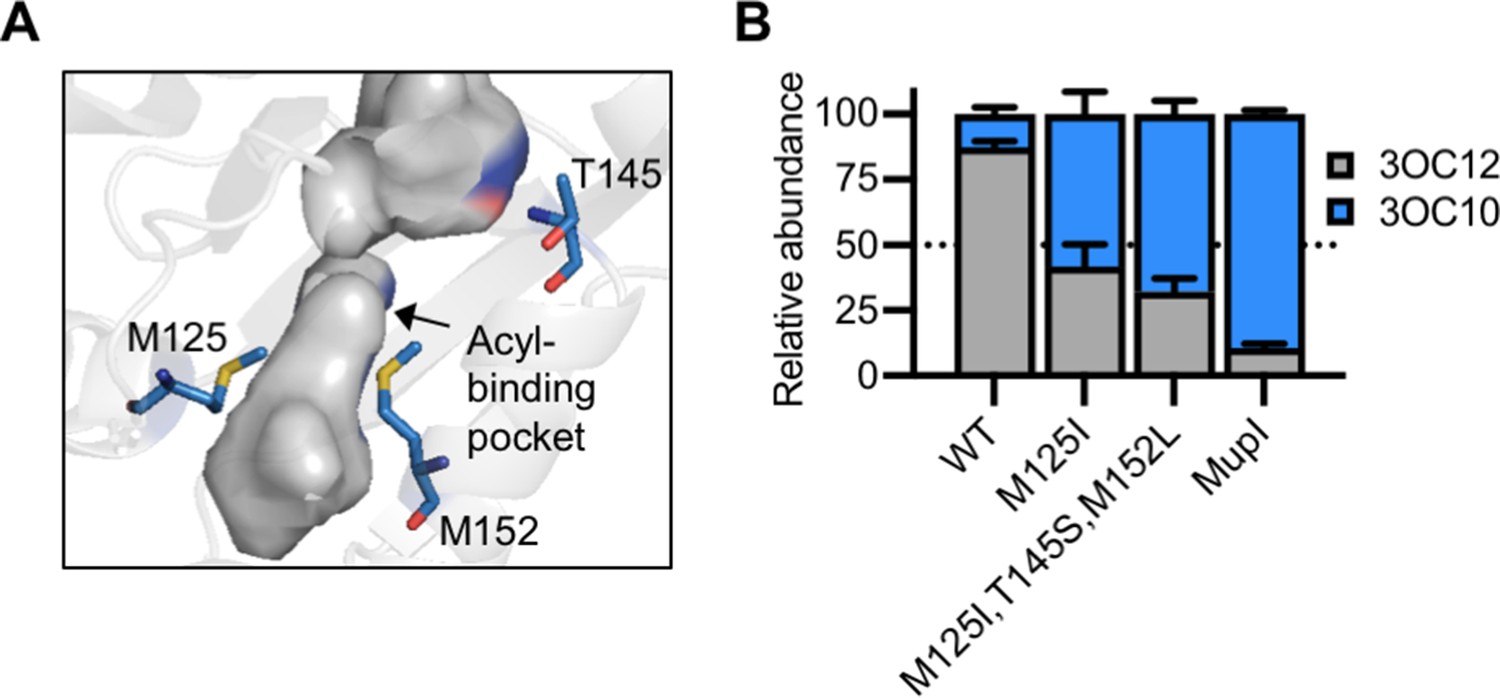
Engineering LasI to produce N-3-oxo-decanoyl-L-homoserine lactone (3OC10-HSL).
(A) Residues altered in LasI shown as blue sticks in the LasI structure (PDB 1ROH). (B) Relative amount of acyl-homoserine lactones (AHLs) produced by Pseudomonas aeruginosa PAO-SC4 harboring pJN-RBSlasI (wild type [WT] or with the indicated amino acid substitutions) or pJN-RBSmupI. Ratios were calculated from high-performance liquid chromatography (HPLC) data (representative data shown in Figure 7—figure supplement 2A–D). Bars show mean and standard deviation. The dashed line indicates equal production of 3OC10-HSL and N-3-oxo-dodecanoyl-L-homoserine lactone (3OC12-HSL).
Figure 7—figure supplement 1
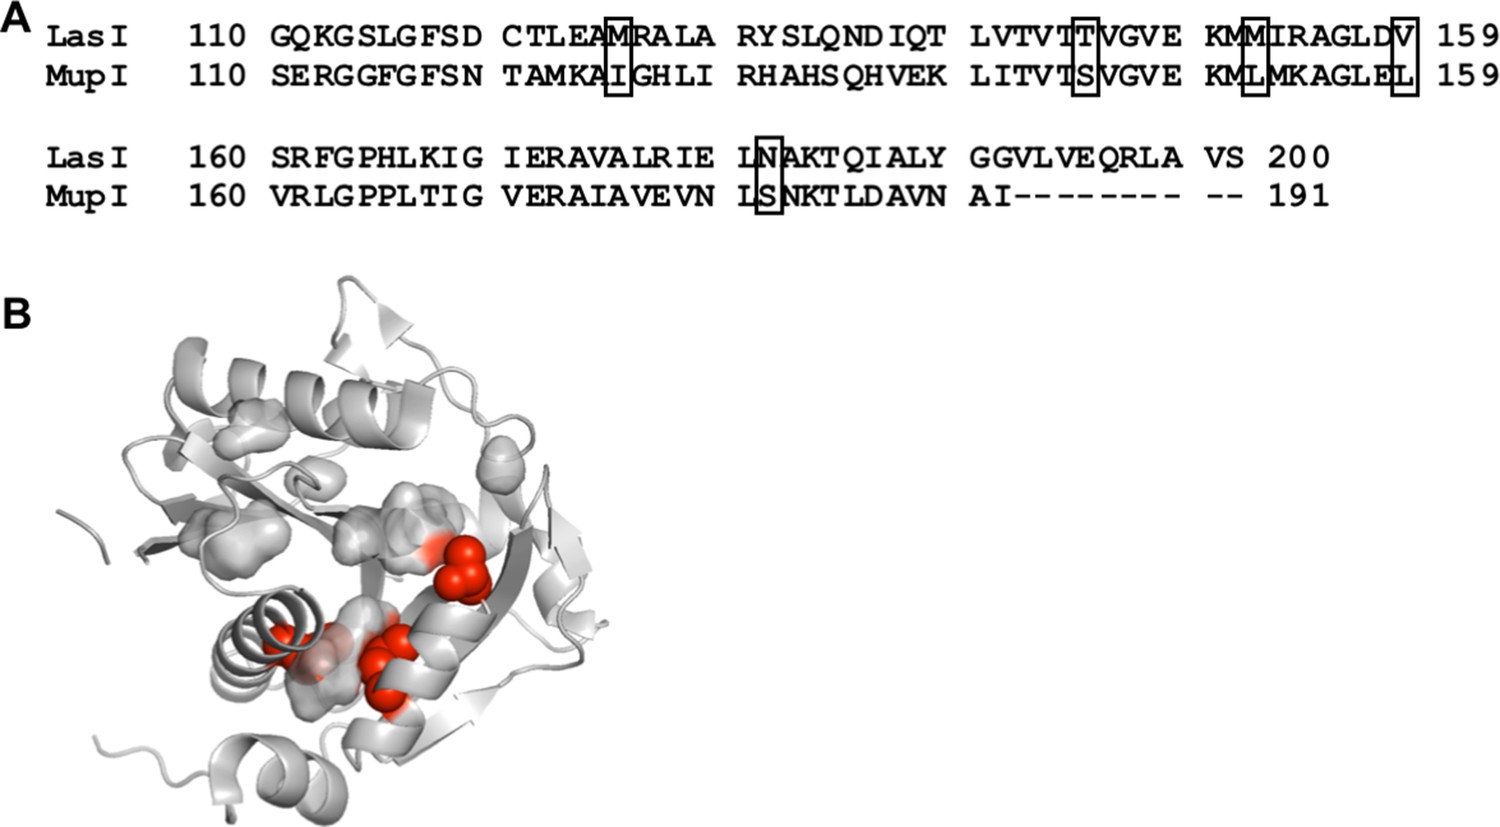
Comparison of LasI and MupI protein sequences.
(A) Sequence alignment of LasI and MupI. Boxes indicate covarying residues with a GREMLIN score (with average product correction [APC]) > 0.08 that differ between the two proteins. (B) Amino acids altered in ‘MupI-like’ LasI shown as red spheres on the crystal structure of LasI (PDB 1ROH).
Figure 7—figure supplement 2
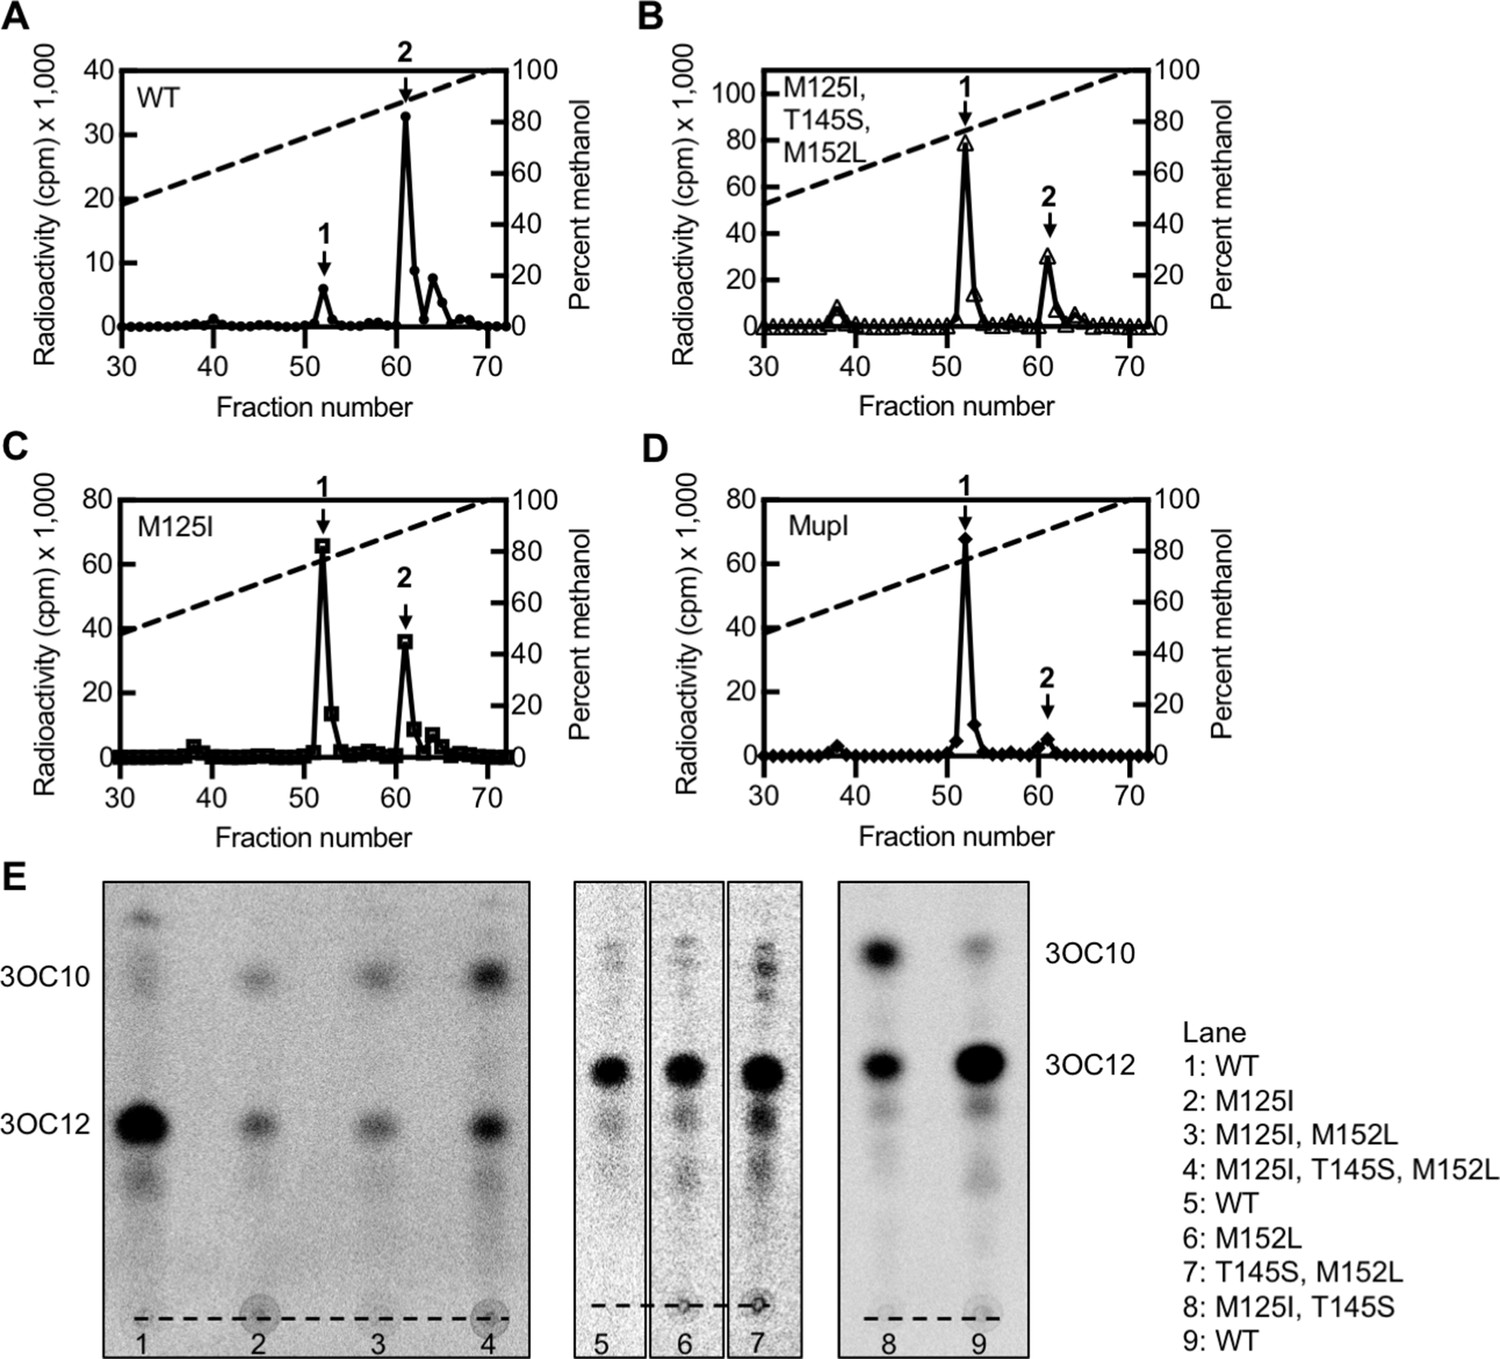
‘MupI-like’ LasI variant activity.
High-performance liquid chromatography (HPLC) analysis of 14C-AHLs extracted from Pseudomonas aeruginosa PAO-SC4 harboring (A) pJN-RBSlasIWT (B) pJN-RBSlasIM125I, T145S, M152L, (C) pJN-RBSlasIM125I, or (D) pJN-RBSmupI. The horizontal axis denotes the fraction number; fractions 1–29 are not shown. The left vertical axis indicates the counts per minute (cpm) of radioactivity in each fraction. Arrow 1 indicates the fraction in which N-3-oxo-decanoyl-L-homoserine lactone (3OC10-HSL) elutes and arrow 2 indicates the fraction in which N-3-oxo-dodecanoyl-L-homoserine lactone (3OC12-HSL) elutes. Data are representative of two (mutants) or three (wild type [WT]) independent experiments. (E) Thin layer chromatography (TLC) analysis of 14C-AHLs extracted from P. aeruginosa PAO-SC4 pJN-lasI WT or with the indicated amino acid substitution. The identities of the two major spots on each TLC were deduced from HPLC analysis of select extracts. The origin is indicated by a dashed line.
-
Figure 7—figure supplement 2—source data 1
Phosphor imaging of radio-thin layer chromatography (TLC) shown in Figure 7—figure supplement 2E, which contains images from three TLCs.
Source data for the first two sets of images in this series are provided in Figure 5—figure supplement 1—source data 3–6. Source data for the third image is provided here. This TLC contained seven samples. 14C-AHLs were extracted from PAO-SC4 harboring pJN-lasI with the following amino acid substitutions: (1) 125I, 145S, (2) wild type (WT). These two lanes are shown, with labels in Figure 7—figure supplement 2E. Lanes 3–6 are irrelevant and not shown in any figure.
- https://cdn.elifesciences.org/articles/69169/elife-69169-fig7-figsupp2-data1-v3.jpg.zip
Tables
Key resources table
| Reagent type (species) or resource | Designation | Source or reference | Identifiers | Additional information |
|---|---|---|---|---|
| Strain, strain background (Pseudomonas aeruginosa) | PAO-SC4 | Wellington and Greenberg, 2019 | P. aeruginosa PAO1 with unmarked deletions of lasI and rhI | AHL synthase-null mutant |
| Strain, strain background (Pseudomonas aeruginosa) | PAO1ΔrhlI | Wang et al., 2015 | PAO1 with unmarked in-frame deletion of rhlI | |
| Strain, strain background (Pseudomonas aeruginosa) | PAO1∆lasR | Wang et al., 2015 | PAO1 with unmarked in-frame deletion of lasR | |
| Strain, strain background (Escherichia coli) | 5-Alpha | New England Biolabs | fhuA2 Δ(argF-lacZ)U169 phoA glnV44 Φ80 Δ(lacZ)M15 gyrA96 recA1 relA1 endA1 thi-1 hsdR17 | Chemically competent cells; used for cloning and for LasR and MupR activity reporter strains |
| Strain, strain background (Escherichia coli) | S17-1 | Simon et al., 1983 | recA pro hsdR RP4-2Tc::Mu-Km::Tn7 | Used for conjugal transfer of plasmid DNA |
| Strain, strain background (Pseudomonas fluorescens) | Migula (ATCC 49323) | ATCC | ||
| Antibody | Anti-LasR (Rabbit polyclonal) | Covance; Gilbert et al., 2009 | (1:1000) | |
| Recombinant DNA reagent | pPROBE-PrsaL | Wellington and Greenberg, 2019 | gfp reporter of LasR activity, GmR | |
| Recombinant DNA reagent | pJNL | Wellington and Greenberg, 2019 | Arabinose-inducible lasR expression vector, ApR | |
| Recombinant DNA reagent | pJN-empty | Wellington and Greenberg, 2019 | Arabinose-inducible expression vector with no gene inserted, ApR | |
| Recombinant DNA reagent | pJN-lasI | This paper* | Arabinose-induciblelasI expression vector, ApR | Derived from pJN105, see Materials and methods for details |
| Recombinant DNA reagent | pJN-RBSlasI | This paper | pJN-lasI with nativelasI RBS, ApR | Derived from pJN105, see Materials and methods for details |
| Recombinant DNA reagent | pJN-RBSmupI | This paper | Arabinose-inducible mupI expression vector, ApR | Derived from pJN105, see Materials and methods for details |
| Recombinant DNA reagent | pJN105-mupR | This paper | Arabinose-inducible mupR expression vector, ApR | Derived from pJN105, see Materials and methods for details |
| Recombinant DNA reagent | pPROBE-PmupI | This paper | gfp reporter of MupR activity, GmR | pPROBE-GT with themupI promoter extending from −300 to +42, see Materials and methods for details |
| Recombinant DNA reagent | pEXG2 | Rietsch et al., 2005 | Allelic exchange vector with pBR origin, sacB, GmR | |
| Recombinant DNA reagent | pEXG2-lasR | Gift from M Kostylev and EP Greenberg | pEXG2 containing lasR gene and 500 bp up- and down-stream | |
| Sequence-based reagent | Cloning primers | This paper | See Supplementary file 1F | |
| Gene (various) | lasI, lasR, mupI, mupR | See Supplementary file 1A | ||
| Software, algorithm | GREMLIN | Ovchinnikov et al., 2014 | Protein covariation analysis algorithm | |
| Chemical compound, drug | 14C-methionine | American Radiolabeled Chemicals | Methionine, L-[1–14C], 0.1 mCi/mL; SKU ARC 0271 |
-
* Please contact the corresponding author (EP Greenberg) to request strains or plasmids created in this study.
Additional files
-
Source data 1
Chemiluminescent images for immunoblots, phorphor imaging of radio-thin layer chromatography, and uncropped images of casein plates.
- https://cdn.elifesciences.org/articles/69169/elife-69169-data1-v3.zip
-
Supplementary file 1
Supplementary tables containing the following information.
(A) Manually curated quorum sensing (QS) synthases and receptors. (B) Select previously reported data for LasR homologs with relevant amino acid substitutions. The native signal for each receptor is indicated in parentheses. (C) Select previously reported data for LasI homologs with relevant amino acid substitutions. The native signal for each synthase is indicated in parentheses. (D) LasR amino acid substitutions evaluated in Figure 3. Relative abundance is the frequency of a given amino acid at the indicated position across all LasR homologs. (E) LasI amino acid substitutions evaluated in Figure 5—figure supplement 1. Relative abundance is the frequency of a given amino acid at the indicated position across all LasI homologs. (F) Primers used in this study.
- https://cdn.elifesciences.org/articles/69169/elife-69169-supp1-v3.docx
-
Transparent reporting form
- https://cdn.elifesciences.org/articles/69169/elife-69169-transrepform-v3.docx
Download links
A two-part list of links to download the article, or parts of the article, in various formats.
Downloads (link to download the article as PDF)
Open citations (links to open the citations from this article in various online reference manager services)
Cite this article (links to download the citations from this article in formats compatible with various reference manager tools)
A covariation analysis reveals elements of selectivity in quorum sensing systems
eLife 10:e69169.
https://doi.org/10.7554/eLife.69169


