Role of direct and indirect social and spatial ties in the diffusion of HIV and HCV among people who inject drugs: a cross-sectional community-based network analysis in New Delhi, India
- Department of Medicine, Division of Infectious Diseases, Johns Hopkins School of Medicine, United States
- Department of Epidemiology, Johns Hopkins Bloomberg School of Public Health, United States
- YR Gaitonde Centre for AIDS Research and Education (YRGCARE), India
- Department of Biostatistics, Johns Hopkins Bloomberg School of Public Health, United States
- Department of Health, Behavior, and Society, Johns Hopkins Bloomberg School of Public Health, United States
Figures
Figure 1
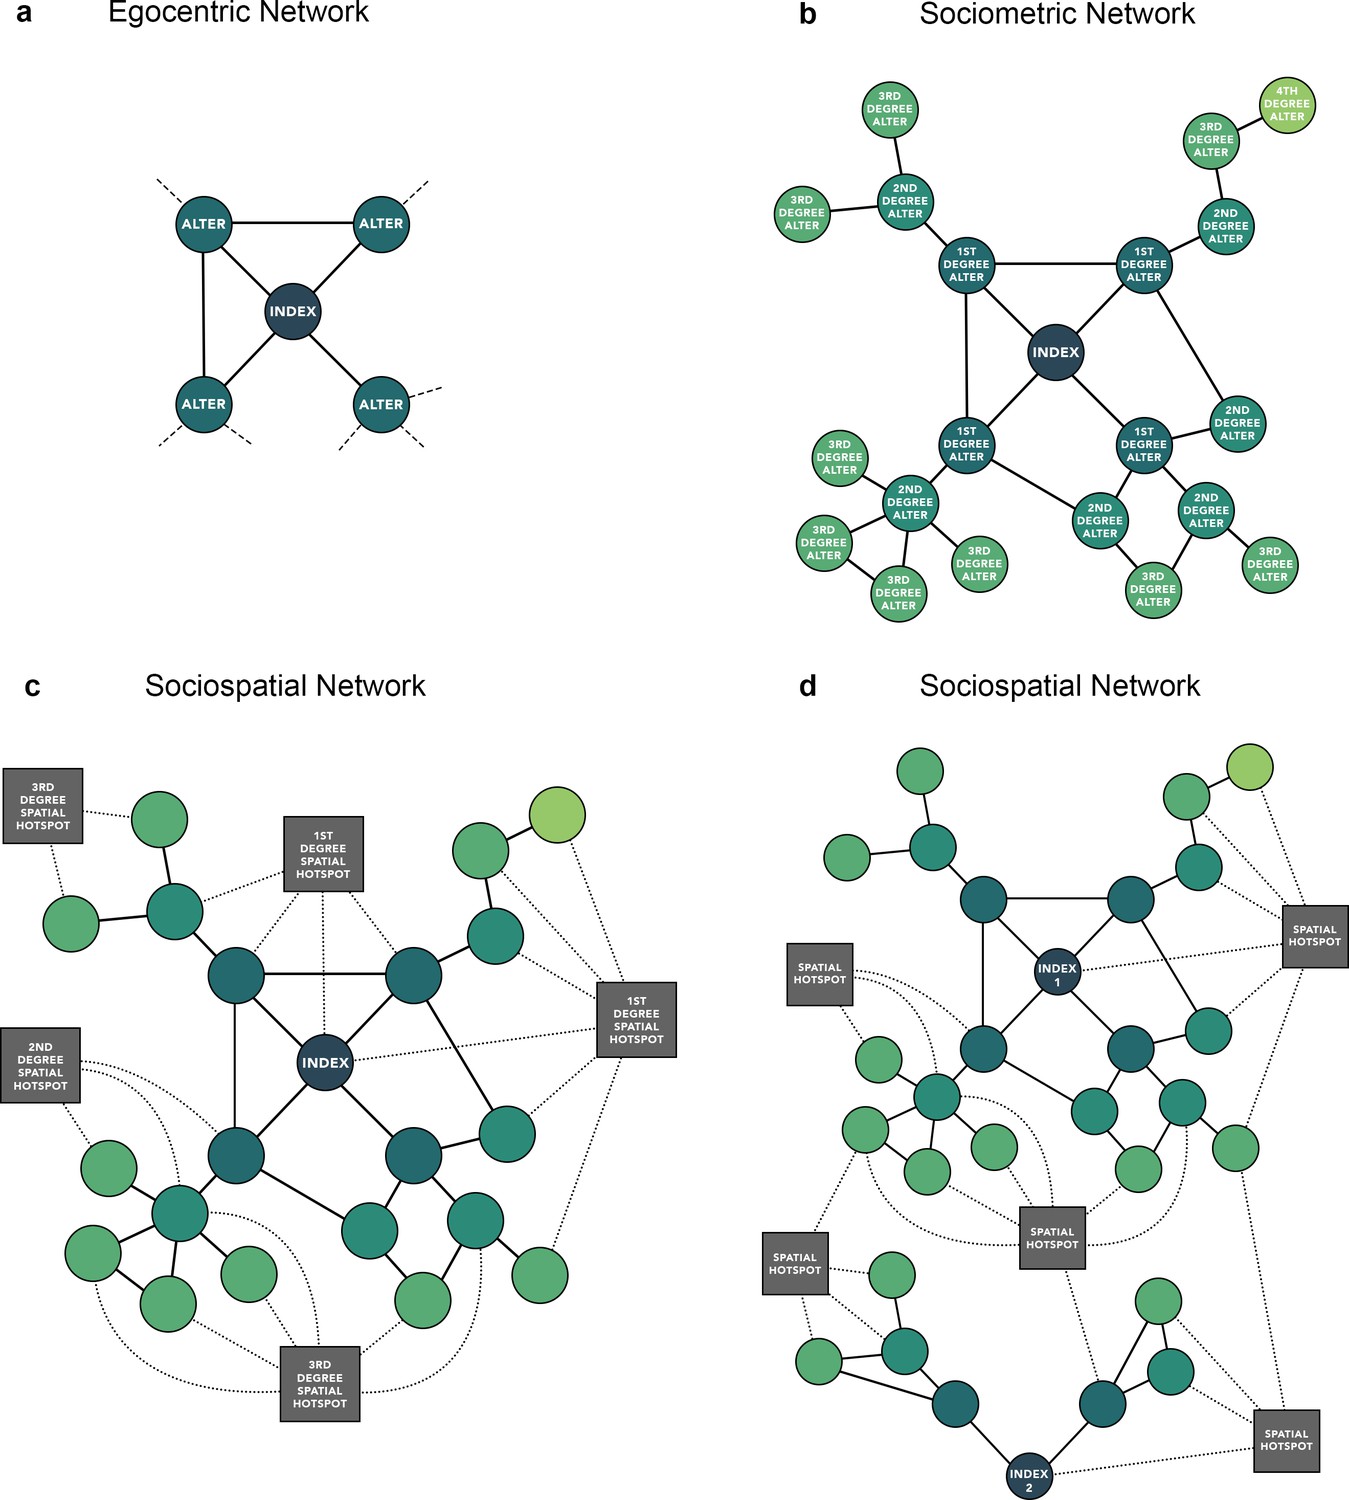
Comparison of (a) egocentric, (b) sociometric, and (c) sociospatial network structure.
Circular nodes represent an individual. Square nodes represent a venue. Solid edges represent a social tie, dashed lines (a) represent a potential tie not captured by an egocentric network, dotted edges represent a spatial tie (c, d); (d) depicts an example of how two independent sociometric networks can merge into a single network when considering space.
Figure 2 with 1 supplement
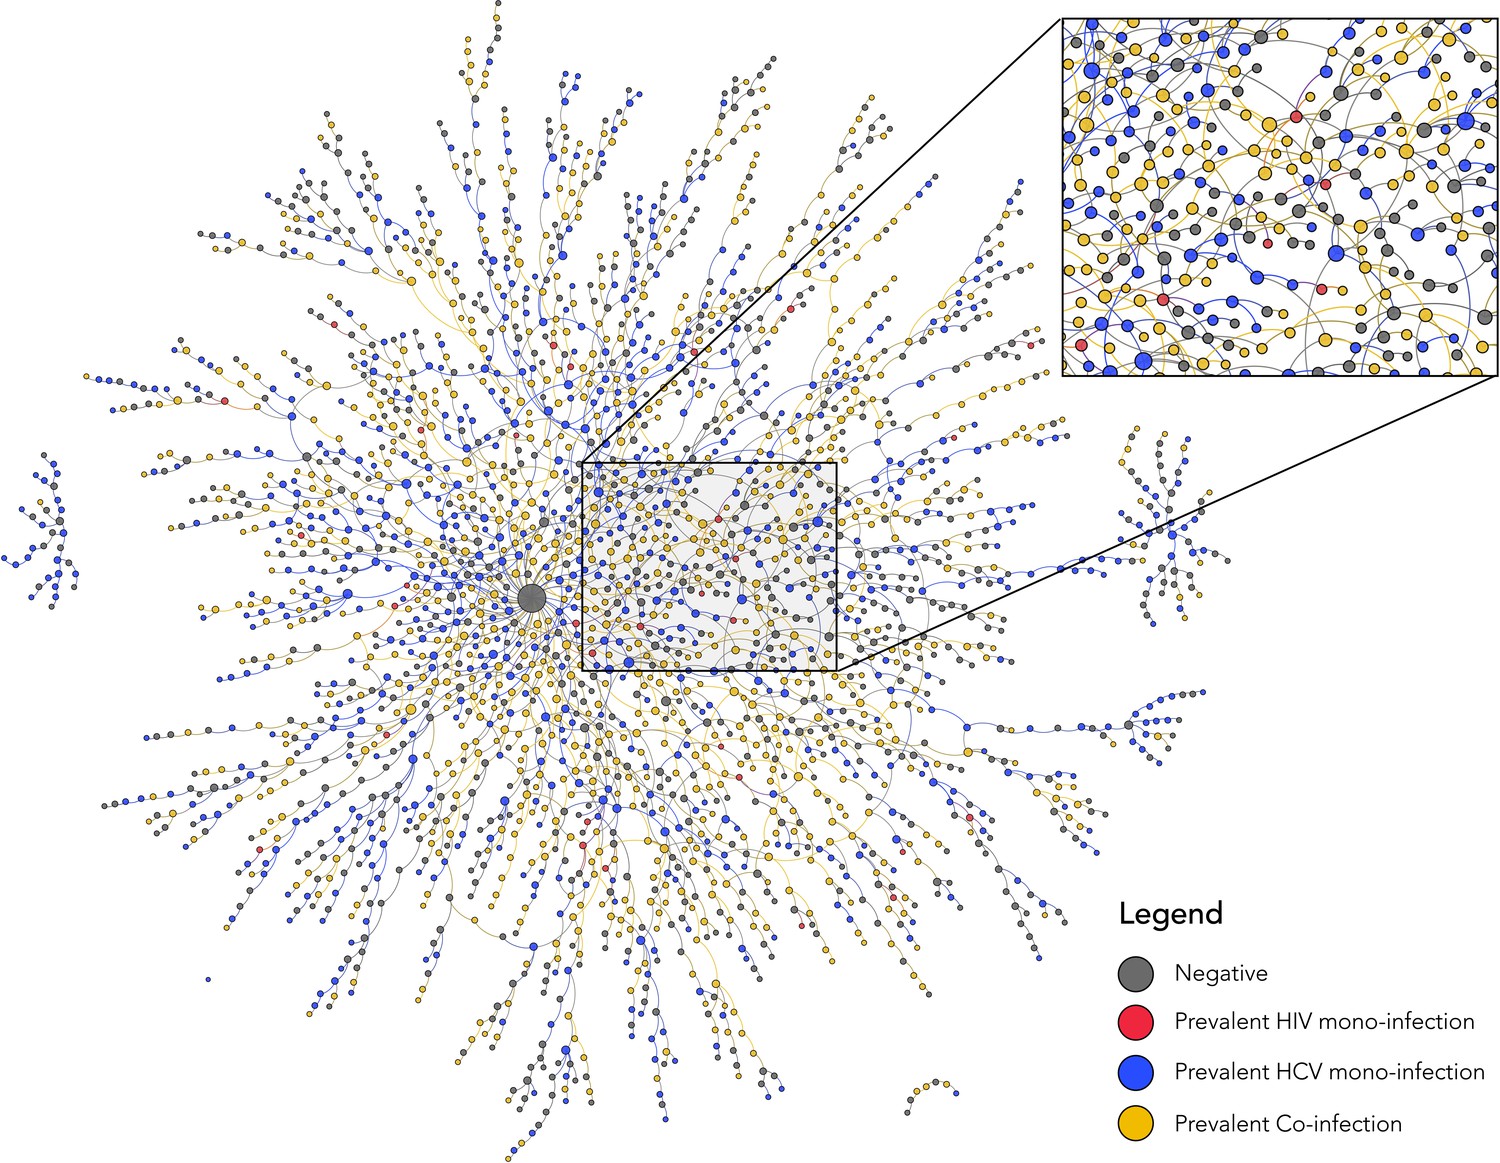
Baseline sociometric network structure and HIV/HCV infection status of 2512 people who inject drugs in New Delhi, India.
Nodes are colored by infection status and sized by degree. HCV, hepatitis C virus; HIV, human immunodeficiency virus.
Figure 2—figure supplement 1
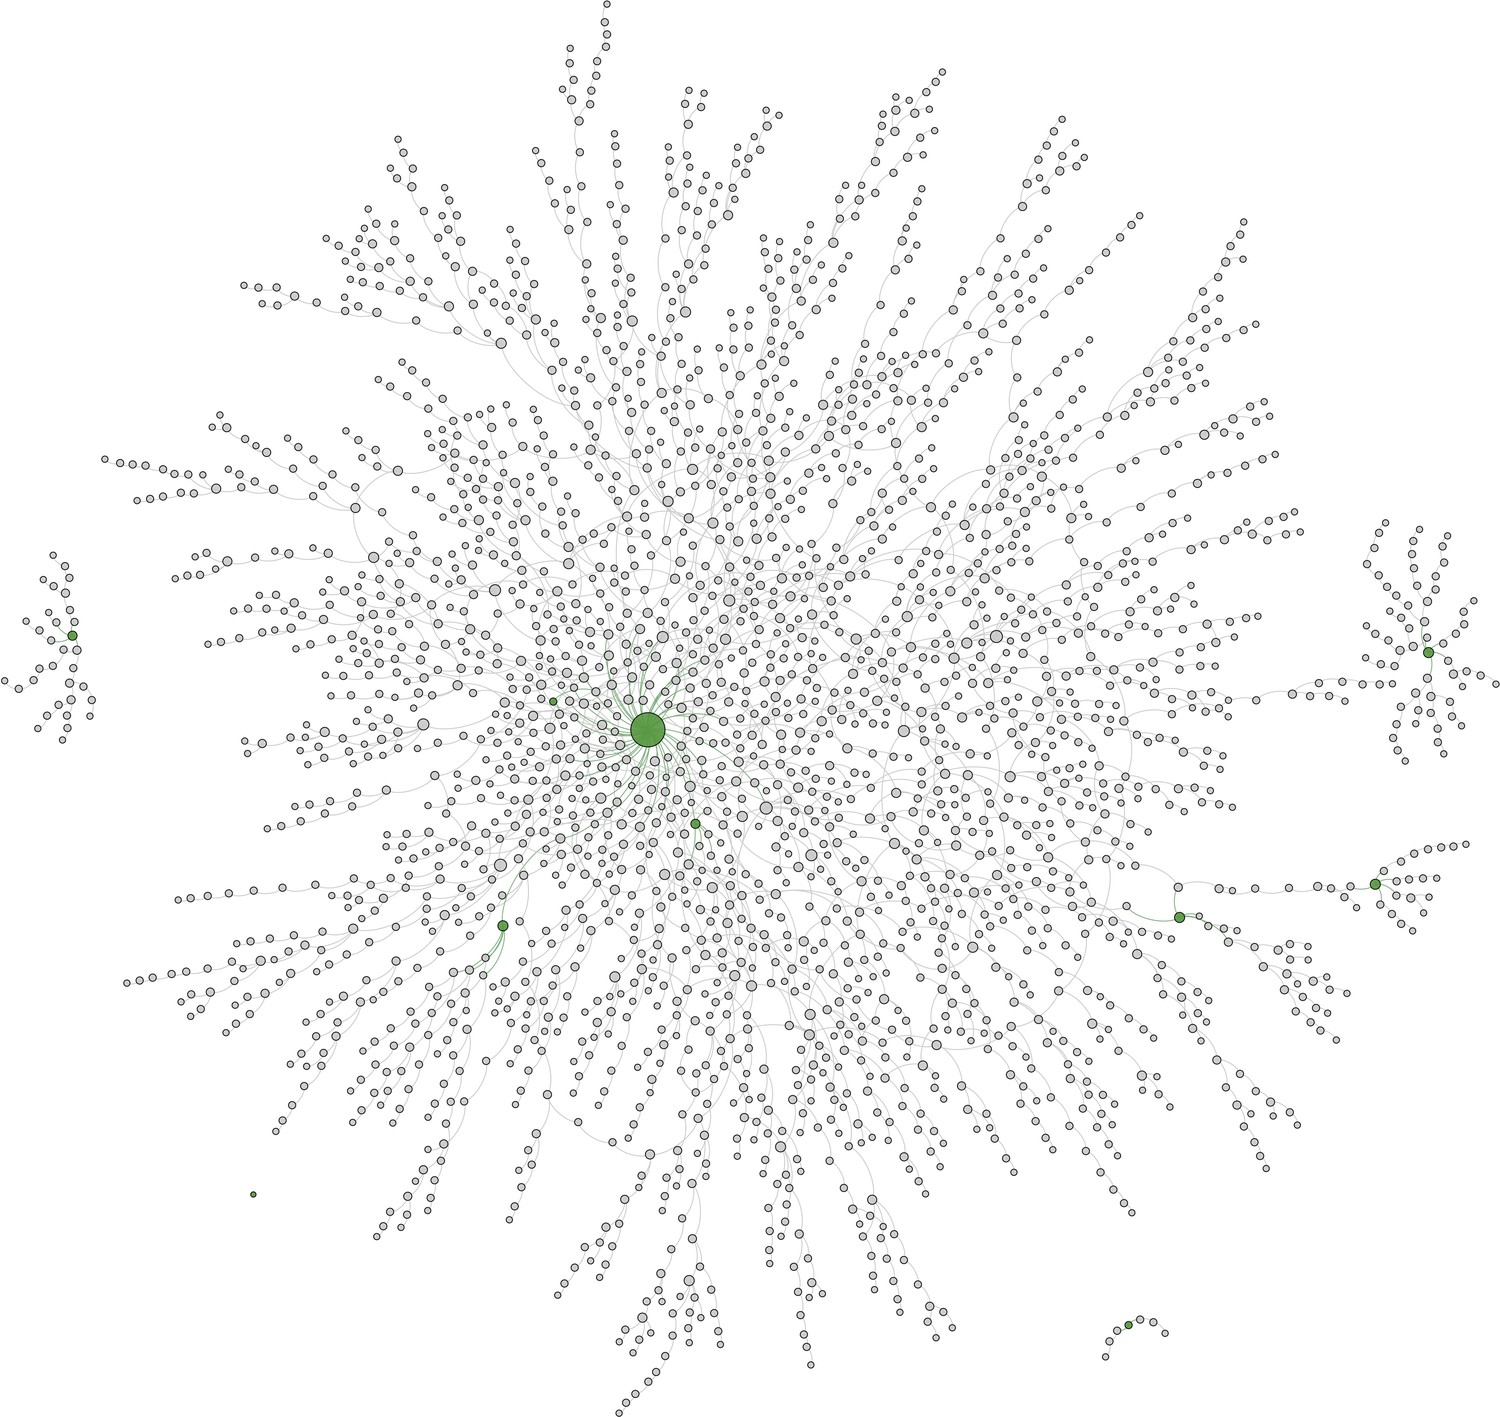
Baseline sociometric network structure of 2512 people who inject drugs in New Delhi, India with the 10 indexes that initiated recruitment colored green.
Figure 3 with 2 supplements
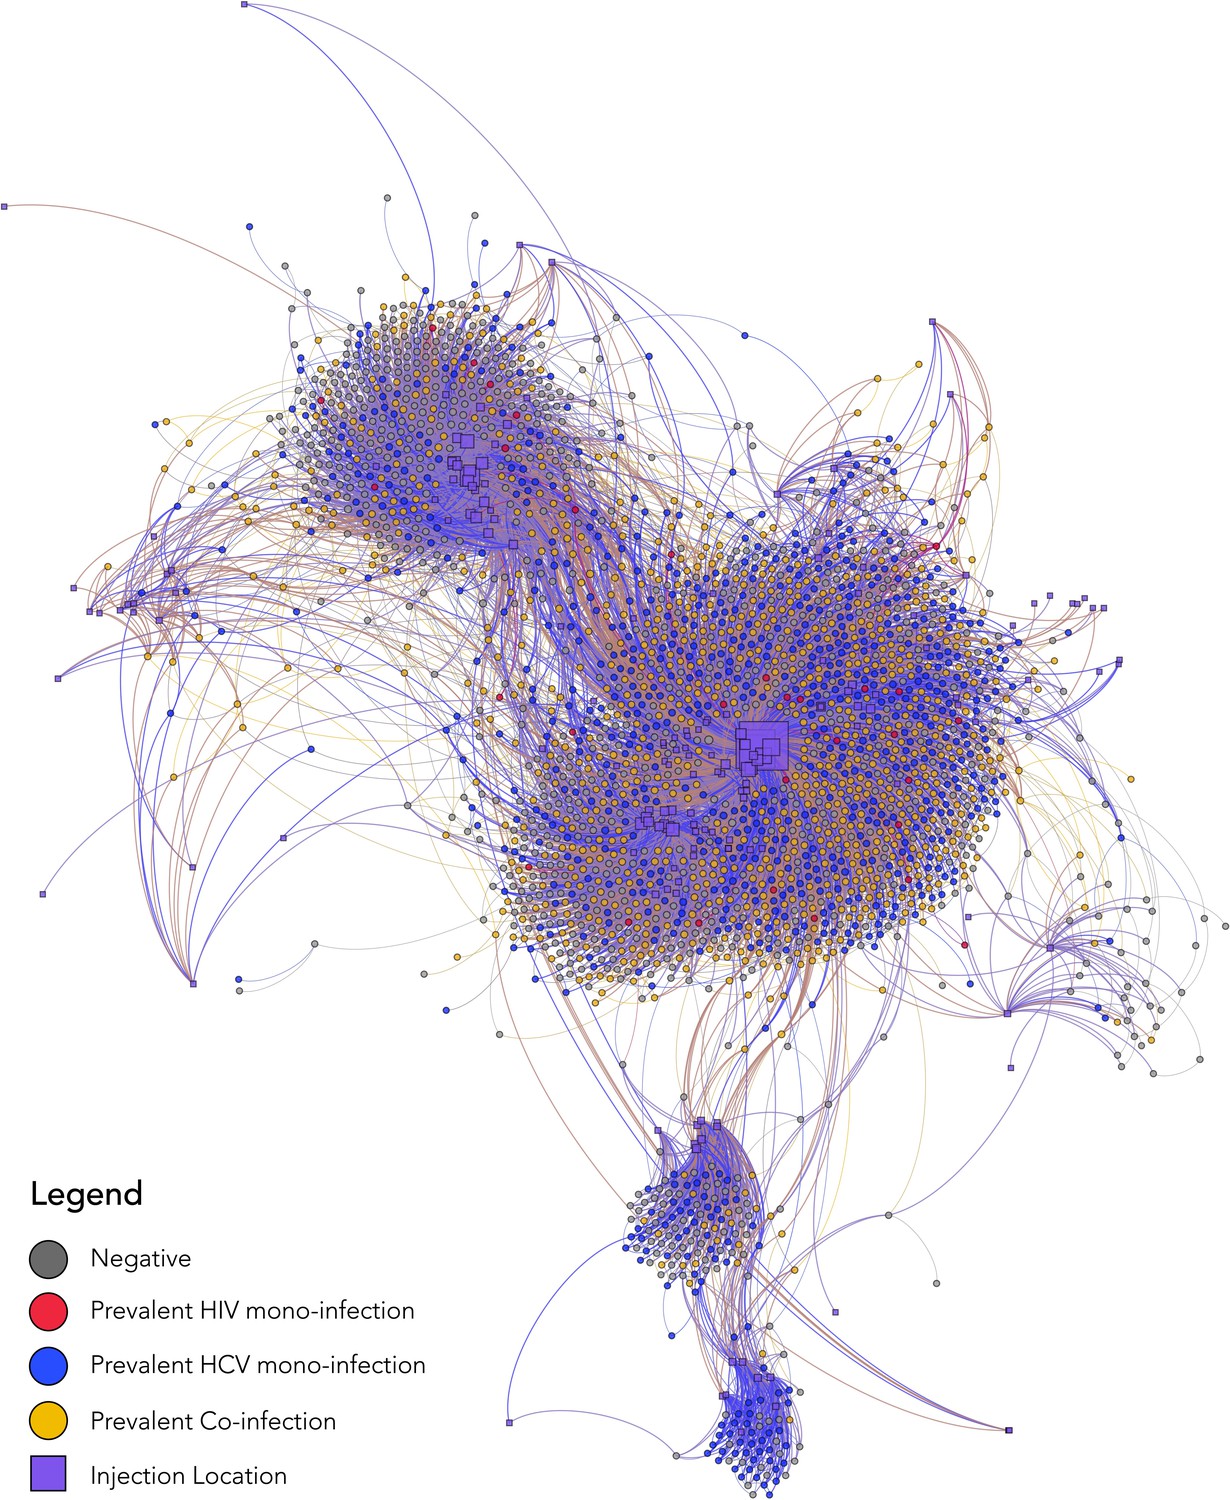
Baseline sociospatial network structure and HIV/HCV infection status of 2512 people who inject drugs in New Delhi, India.
The nodes in this sociospatial network represent persons (circles) or injection venues (squares), and the edges represent a social tie (in the case of a connection between two person nodes) or a spatial tie (in the case of a connection between a person node and spatial node). Person nodes are colored by HIV/HCV infection status, sized by degree, and are placed by using a degree-dependent force-directed algorithm. Spatial nodes are sized by degree and placed by GPS coordinates to be geographically congruent under a Mercator projection. HCV, hepatitis C virus; HIV, human immunodeficiency virus.
Figure 3—figure supplement 1
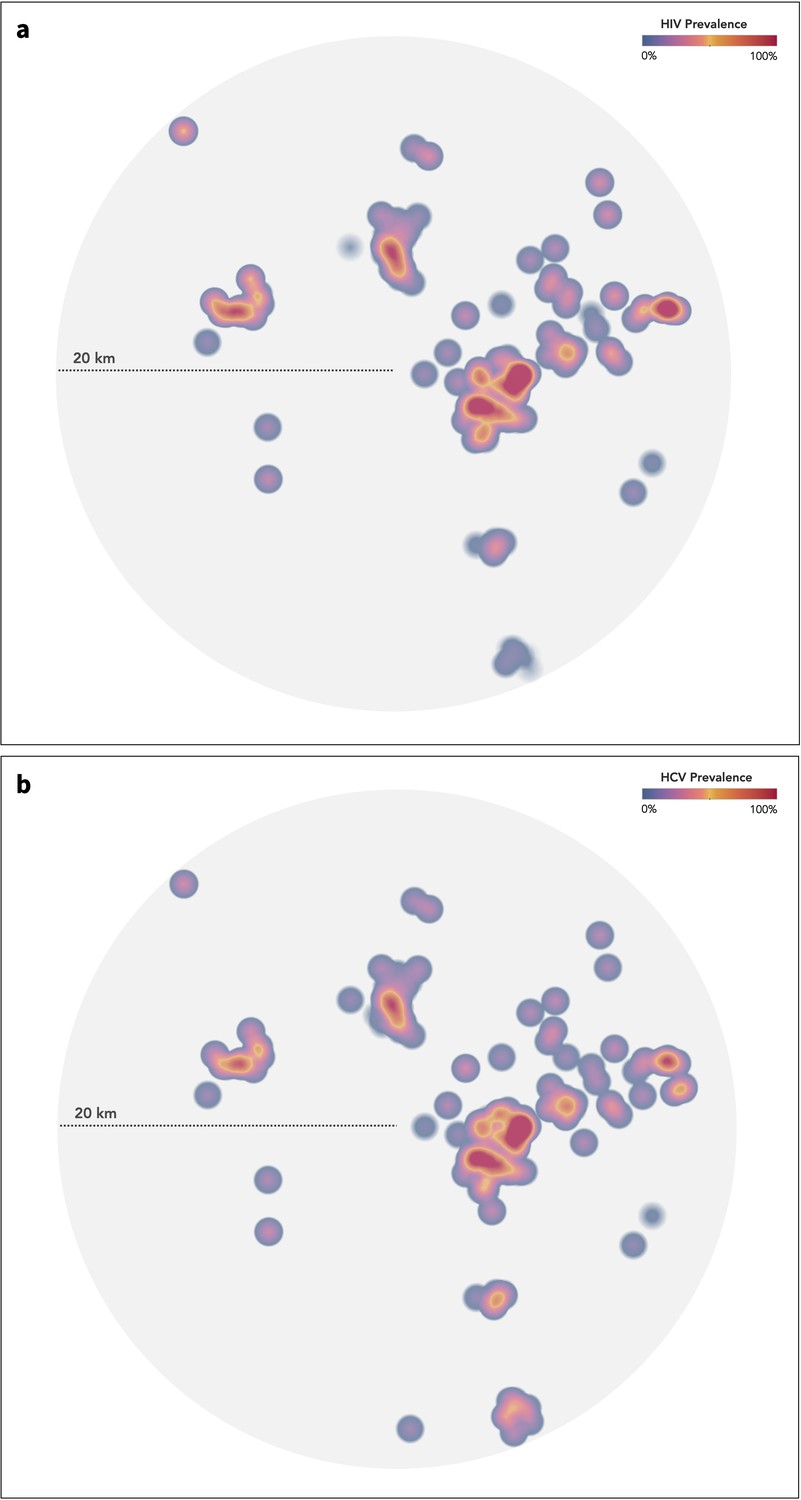
Geographic extent of 181 injection venues identified by study participants and kernel density plot of (a) HIV prevalence and (b) HCV prevalence.
While the figure is geospatially congruent, a map is not displayed to protect study participants. HCV, hepatitis C virus; HIV, human immunodeficiency virus.
Figure 3—figure supplement 2
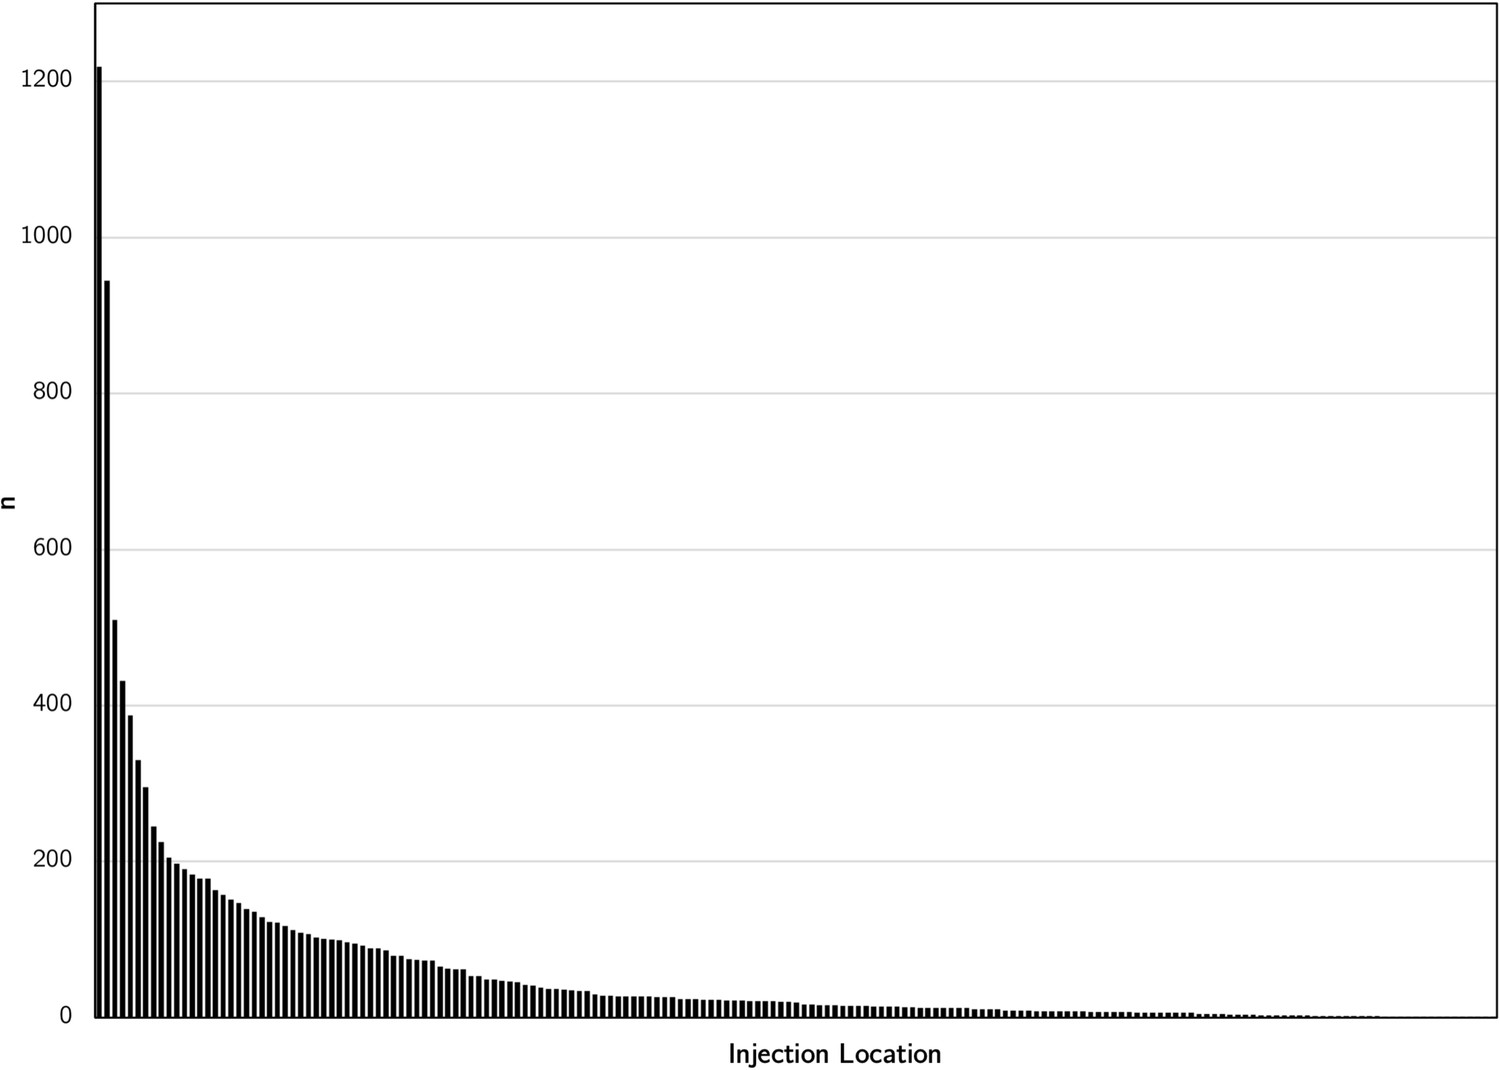
Distribution of the number of people who report injecting drugs across 181 injection venues in New Delhi, India.
Each bar along the x-axis represents a single injection venue.
Author response image 1
Tables
Table 1
Participant baseline characteristics of 2512 people who inject drugs in New Delhi, India (parenthesis denote n unless otherwise specified).
| Overall | HIV mono-infected | Anti-HCV mono-infected | HIV/anti-HCV co-infected | Negative for HIV and HCV | |
|---|---|---|---|---|---|
| Number of participants | 2512 | 31 | 737 | 897 | 847 |
| Median age (IQR) | 26 (22–34) | 24 (20–32) | 27 (22–35) | 26 (22–32) | 26 (22–36) |
| Male gender | 99% (2489) | 97% (30) | 99% (728) | 99% (890) | 99% (837) |
| Self-report of ever having sex with a man | 20% (498) | 26% (8) | 16% (121) | 21% (192) | 21% (177) |
| Self-identify as gay or bisexual | 19% (479) | 23% (7) | 17% (123) | 21% (188) | 20% (167) |
| Highest level of education | |||||
| No schooling | 30% (754) | 32% (10) | 31% (225) | 39% (345) | 21% (174) |
| Primary school (Grades 1–5) | 25% (618) | 26% (8) | 25% (183) | 28% (250) | 21% (177) |
| Secondary school (Grades 6–10) or above | 45% (1130) | 42% (13) | 44% (327) | 33% (300) | 58% (490) |
| Employment | |||||
| Earn daily wage | 62% (1545) | 68% (21) | 60% (442) | 70% (630) | 53% (452) |
| Earn weekly or monthly wage | 28% (714) | 26% (8) | 30% (222) | 21% (190) | 35% (294) |
| Unemployed | 7% (165) | 6% (2) | 6% (45) | 5% (47) | 8% (71) |
| Currently Experiencing homeless | 30% (754) | 32% (10) | 30% (221) | 41% (371) | 18% (152) |
| Median years injecting drugs (IQR) | 5 (2–10) | 4 (1–8) | 5 (2–10) | 5 (2–9) | 3 (2–8) |
| Median injections in prior 6 months (IQR) | 360 (180–540) | 360 (360–540) | 360 (180–540) | 360 (344–540) | 340 (96–360) |
| Mean no. injection partners in prior month | 3.2 | 2.9 | 3.3 | 3.5 | 2.8 |
| Ever shared syringes | 60% (1518) | 74% (23) | 63% (463) | 73% (651) | 45% (381) |
| Shared syringes in prior 6 months | 51% (1284) | 65% (20) | 53% (391) | 61% (547) | 39% (326) |
| Type of drug injected (ever) | |||||
| Heroin only | 4% (89) | 6% (2) | 3% (25) | 2% (17) | 5% (45) |
| Buprenorphine only | 54% (1350) | 58% (18) | 50% (368) | 47% (422) | 64% (542) |
| Heroin and buprenorphine | 42% (1061) | 36% (11) | 46% (342) | 51% (458) | 30% (250) |
| Type of drug injected (prior 6 months) | |||||
| Heroin only | 4% (107) | 7% (2) | 4% (30) | 3% (25) | 6% (50) |
| Buprenorphine only | 73% (1820) | 74% (23) | 71% (521) | 70% (630) | 78% (646) |
| Heroin and buprenorphine | 22% (559) | 19% (6) | 25% (181) | 27% (240) | 16% (132) |
| Access to services | |||||
| Ever tested for HIV | 48% (1203) | 29% (9) | 53% (394) | 49% (440) | 43% (360) |
| Ever tested for HCV | 4% (104) | 0% (0) | 6% (46) | 5% (43) | 2% (15) |
| Ever used medication assisted therapy | 36% (906) | 36% (11) | 37% (272) | 32% (290) | 39% (333) |
| Ever used syringe service program | 17% (427) | 7% (2) | 19% (137) | 21% (191) | 12% (97) |
-
Note: anti-HCV, HCV antibody.
Table 2
Factors associated with prevalent HIV infection in a sample of 2512 PWID in New Delhi, India.
Columns represent a logistic regression model and depict the odds ratios/adjusted odds ratios and 95% confidence intervals for the included variables.
| Factors associated with prevalent HIV | Univariable OR (95% CI) | Multivariable AOR (95% CI) | Multivariable AOR (95% CI) | Multivariable AOR (95% CI) | Multivariable AOR (95% CI) | Multivariable AOR (95% CI) |
|---|---|---|---|---|---|---|
| Age per 5 year increase | 0.88 (0.84–0.92) | 0.88 (0.84–0.92) | 0.90 (0.84–0.93) | 0.88 (0.84–0.92) | 0.88 (0.84–0.93) | 0.88 (0.84–0.93) |
| Education | ||||||
| No schooling (ref.) | 1.00 | 1.00 | 1.00 | 1.00 | 1.00 | 1.00 |
| Primary school | 0.80 (0.65–0.99) | 0.89 (0.71–1.13) | 0.92 (0.73–1.15) | 0.93 (0.74–1.17) | 0.95 (0.75–1.20) | 0.95 (0.75–1.20) |
| Secondary school or above | 0.43 (0.35–0.52) | 0.54 (0.44–0.67) | 0.55 (0.44–0.68) | 0.56 (0.45–0.69) | 0.57 (0.46–0.70) | 0.57 (0.46–0.71) |
| Experiencing Homelessness | 2.27 (1.91–2.71) | 1.54 (1.27–1.87) | 1.52 (1.25–1.85) | 1.48 (1.22–1.80) | 1.30 (1.07–1.60) | 1.32 (1.07–1.62) |
| Sexual activity vaginal or anal sex in prior 6 months | 0.42 (0.35–0.51) | 0.53 (0.44–0.65) | 0.53 (0.43–0.68) | 0.53 (0.43–0.64) | 0.53 (0.43–0.64) | 0.52 (0.43–0.63) |
| Ever shared syringes | 2.34 (1.96–2.78) | 1.78 (1.48–2.15) | 1.76 (1.45–2.12) | 1.76 (1.46–2.13) | 1.73 (1.43–2.10) | 1.75 (1.44–2.11) |
| Injection frequency per 50 injections in prior 6 months | 1.10 (1.08–1.11) | 1.06 (1.04–1.08) | 1.06 (1.04–1.08) | 1.06 (1.04–1.08) | 1.06 (1.04–1.08) | 1.06 (1.04–1.07) |
| Type of drug injected (ever) | ||||||
| Buprenorphine only (ref.) | 1.00 | 1.00 | 1.00 | 1.00 | 1.00 | 1.00 |
| Heroin only | 0.56 (0.33–0.94) | 0.58 (0.34–1.01) | 0.59 (0.34–1.03) | 0.58 (0.33–1.01) | 0.61 (0.35–1.07) | 0.61 (0.35–1.06) |
| Heroin and buprenorphine | 1.64 (1.39–1.94) | 1.39 (1.16–1.68) | 1.35 (1.12–1.63) | 1.34 (1.11–1.62) | 1.33 (1.10–1.60) | 1.31 (1.08–1.58) |
| Number infected injection partners per one person increase in anti-HIV-positive injection partners | 1.25 (1.13–1.37) | – | 1.20 (1.08–1.34) | 1.15 (1.03–1.28) | 1.16 (1.04–1.29) | 1.14 (1.02–1.27) |
| Network distance from an HIV-infected participant | 0.83 (0.78–0.88) | – | – | 0.87 (0.82–0.95) | 0.90 (0.82–0.96) | 0.92 (0.85–0.99) |
| Injecting at venue #40 | 2.22 (1.88–2.62) | – | – | – | 1.50 (1.24–1.82) | 1.10 (0.85–1.43) |
| Network distance from venue #40 | 0.79 (0.75–0.83) | – | – | – | – | 0.86 (0.82–0.91) |
Table 3
Factors associated with active HCV infection (HCV RNA positive) in a sample of 2512 PWID in New Delhi, India.
Columns represent a logistic regression model and depict the odds ratios/adjusted odds ratios and 95% confidence intervals for the included variables.
| Factors associated with active HCV infection (HCV RNA positive) | Univariable OR (95% CI) | Multivariable AOR (95% CI) | Multivariable AOR (95% CI) | Multivariable AOR (95% CI) | Multivariable AOR (95% CI) | Multivariable AOR (95% CI) |
|---|---|---|---|---|---|---|
| Age per 5 year increase | 0.96 (0.92–0.99) | 0.97 (0.93–1.01) | 0.97 (0.93–1.01) | 0.97 (0.93–1.01) | 0.97 (0.93–1.01) | 0.97 (0.93–1.02) |
| Education | ||||||
| No schooling (ref.) | 1.00 | 1.00 | 1.00 | 1.00 | 1.00 | 1.00 |
| Primary school | 0.91 (0.73–1.14) | 1.04 (0.82–1.32) | 1.06 (0.84–1.34) | 1.06 (0.84–1.35) | 1.09 (0.86–1.38) | 1.09 (0.86–1.39) |
| Secondary school or above | 0.56 (0.46–0.67) | 0.70 (0.57–0.85) | 0.70 (0.57–0.86) | 0.70 (0.57–0.86) | 0.71 (0.58–0.88) | 0.72 (0.59–0.89) |
| Experiencing Homelessness | 1.97 (1.64–2.36) | 1.45 (1.19–1.77) | 1.40 (1.15–1.71) | 1.41 (1.15–1.72) | 1.17 (0.95–1.45) | 1.18 (0.95–1.45) |
| Sexual activity vaginal or anal sex in prior 6 months | 0.58 (0.49–0.69) | 0.69 (0.58–0.83) | 0.69 (0.58–0.83) | 0.70 (0.58–0.84) | 0.70 (0.58–0.84) | 0.69 (0.57–0.83) |
| Ever shared syringes | 2.08 (1.75–2.45) | 1.65 (1.38–1.98) | 1.65 (1.38–1.98) | 1.67 (1.40–2.00) | 1.62 (1.35–1.94) | 1.62 (1.36–1.95) |
| Injection frequency per 50 injections in prior 6 months | 1.08 (1.06–1.10) | 1.05 (1.03–1.07) | 1.05 (1.03–1.07) | 1.05 (1.03–1.07) | 1.04 (1.02–1.06) | 1.04 (1.02–1.06) |
| Type of drug injected (ever) | ||||||
| Buprenorphine only | 1.00 | 1.00 | 1.00 | 1.00 | 1.00 | 1.00 |
| Heroin only | 0.80 (0.51–1.24) | 0.85 (0.53–1.35) | 0.85 (0.53–1.35) | 0.84 (0.53–1.34) | 0.91 (0.57–1.45) | 0.90 (0.56–1.44) |
| Heroin and buprenorphine | 1.75 (1.48–2.07) | 1.48 (1.23–1.78) | 1.45 (1.20–1.74) | 1.45 (1.21–1.75) | 1.43 (1.18–1.72) | 1.41 (1.17–1.70) |
| Number infected injection partners per one person increase in HCV RNA positive injection partners | 1.25 (1.14–1.36) | – | 1.21 (1.10–1.34) | 1.13 (1.00–1.28) | 1.12 (0.99–1.27) | 1.11 (0.98–1.26) |
| Network distance from an HCV RNA+ participant | 0.82 (0.77–0.80) | – | – | 0.90 (0.82–0.99) | 0.93 (0.84–1.03) | 0.96 (0.85–1.00) |
| Injecting at location #40 | 2.29 (1.94–2.70) | – | – | – | 1.69 (1.40–2.03) | 1.31 (1.03–1.68) |
| Network distance from location #40 | 0.81 (0.77–0.84) | – | – | – | – | 0.90 (0.85–0.97) |
Additional files
-
Supplementary file 1
Baseline characteristics of 10 indexes that initiated network recruitment (parenthesis denote n unless otherwise specified).
- https://cdn.elifesciences.org/articles/69174/elife-69174-supp1-v2.docx
-
Reporting standard 1
STROBE Checklist for Cross-sectional Studies.
- https://cdn.elifesciences.org/articles/69174/elife-69174-repstand1-v2.docx
-
Reporting standard 2
STROBE Flowchart.
- https://cdn.elifesciences.org/articles/69174/elife-69174-repstand2-v2.pdf
-
Transparent reporting form
- https://cdn.elifesciences.org/articles/69174/elife-69174-transrepform-v2.pdf
Download links
A two-part list of links to download the article, or parts of the article, in various formats.
Downloads (link to download the article as PDF)
Open citations (links to open the citations from this article in various online reference manager services)
Cite this article (links to download the citations from this article in formats compatible with various reference manager tools)
Role of direct and indirect social and spatial ties in the diffusion of HIV and HCV among people who inject drugs: a cross-sectional community-based network analysis in New Delhi, India
eLife 10:e69174.
https://doi.org/10.7554/eLife.69174


