The amyloid precursor protein is a conserved Wnt receptor
- Paris Brain Institute – Institut du Cerveau, Sorbonne Université, Inserm, CNRS, Hôpital Pitié-Salpêtrière, France
- Doctoral School of Biomedical Sciences, Belgium
- Center for Brain and Disease, Belgium
- Center for Human Genetics, University of Leuven School of Medicine, Belgium
- Laboratory of Developmental Neurobiology, Department of Molecular Cell Biology, Leiden University Medical Center, Netherlands
- UK Dementia Research institute at University College London, United Kingdom
Figures
Figure 1
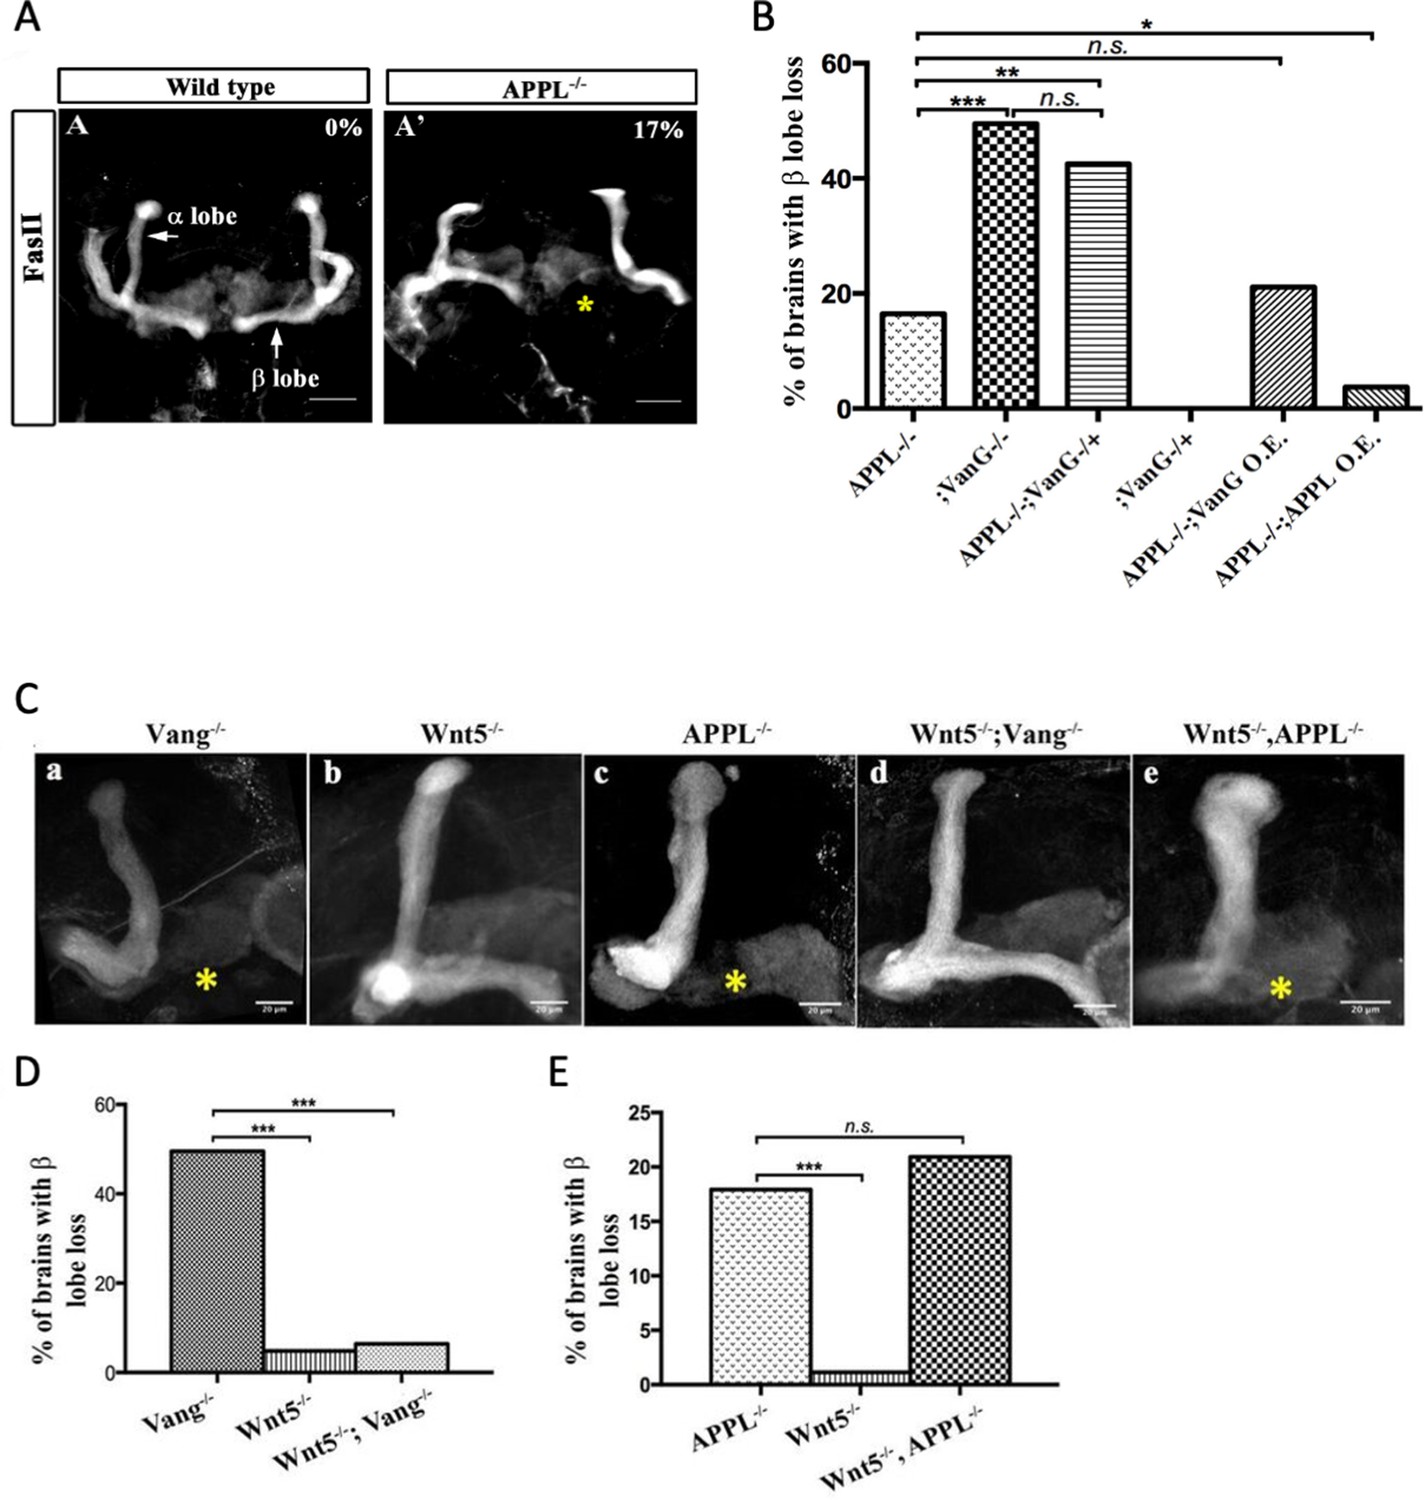
APPL mediates Wnt5a function in axonal growth.
(A–A’) Structure of the MB neurons in adult wild type and APPL-/- mutant flies. Immunofluorescence using anti-FascilinII (FasII) antibody that labels the axons of the MB. (A) In wild type brains, the axons of the MB project dorsally to form the α lobe and medially to form the β lobe. (A’) In APPL null mutant flies (APPLd/Y referred to as APPL-/-), there is axonal growth defect of the β lobe (as indicated by the asterisk) in 17% of the brains examined (n=97). Images are z-projections of confocal image stacks (scale bar, 50 μm). (B) APPL and VanG synergistically interact and APPL is necessary for VanG activity. The histogram shows the percentage of the β lobe defect in different genetic backgrounds. The loss of Vang induced a significantly higher penetrant phenotype up to 50%, (n=103) compared to APPL-/-; p value = 5.18−7 calculated with G-test. The loss of one copy of Vang in wild type background had no effect on axonal growth (n=30). However, the removal of one copy of Vang in APPL-/- background significantly increased the phenotype to 43% (n=47) compared to APPL-/-; p value = 0.001026. The penetrance of the latter phenotype was not significantly different from the one observed in Vang-/-; p value = 0.4304. While the overexpression of APPL rescued the APPL-/- phenotype (4%, n=54); p value = 0.01307, the overexpression of Vang failed to (21%, n=52); p value = 0.4901. * Indicates a p value<0.05. Data are shown as median ± whiskers. (Ca-e) Immunofluorescence analysis using anti-FasII antibody to show the structure of the MB axons in adult mutant flies of the following genotypes: (a) Vang-/-, (b) Wnt5-/Y referred to as Wnt5-/-, (c) APPL-/-, (d) Wnt5-/-,Vang-/-, and (e) Wnt5-/-,APPL-/-. Images are z-projections of confocal image stacks (scale bar, 20 μm). The asterisks correspond to the β lobe loss phenotype. (D) Wnt5 inhibits axonal growth, after branching, independently of Vang. The Histogram shows the percentage of the β lobe loss phenotype. Vang-/- flies exhibit a highly penetrant phenotype of 50% (n=104), while Wnt5-/- flies show a significantly less penetrant phenotype (5%, n=103); p value = 2.33−14 calculated with G-test. The loss of Wnt5 rescued Vang loss of function (6%, n=98); p value = 4.56−12. (E) Wnt5 inhibits axonal growth probably through APPL. Histogram showing the penetrance of the β lobe loss phenotype. In APPL-/- flies, 18% of the brains tested showed an axonal defect (n=106). This percentage did not significantly change in the absence of both Wnt5 in APPL-/- flies (21%, n=86); p value = 0.6027. *** indicates a p value< 1−5.
Figure 2 with 2 supplements
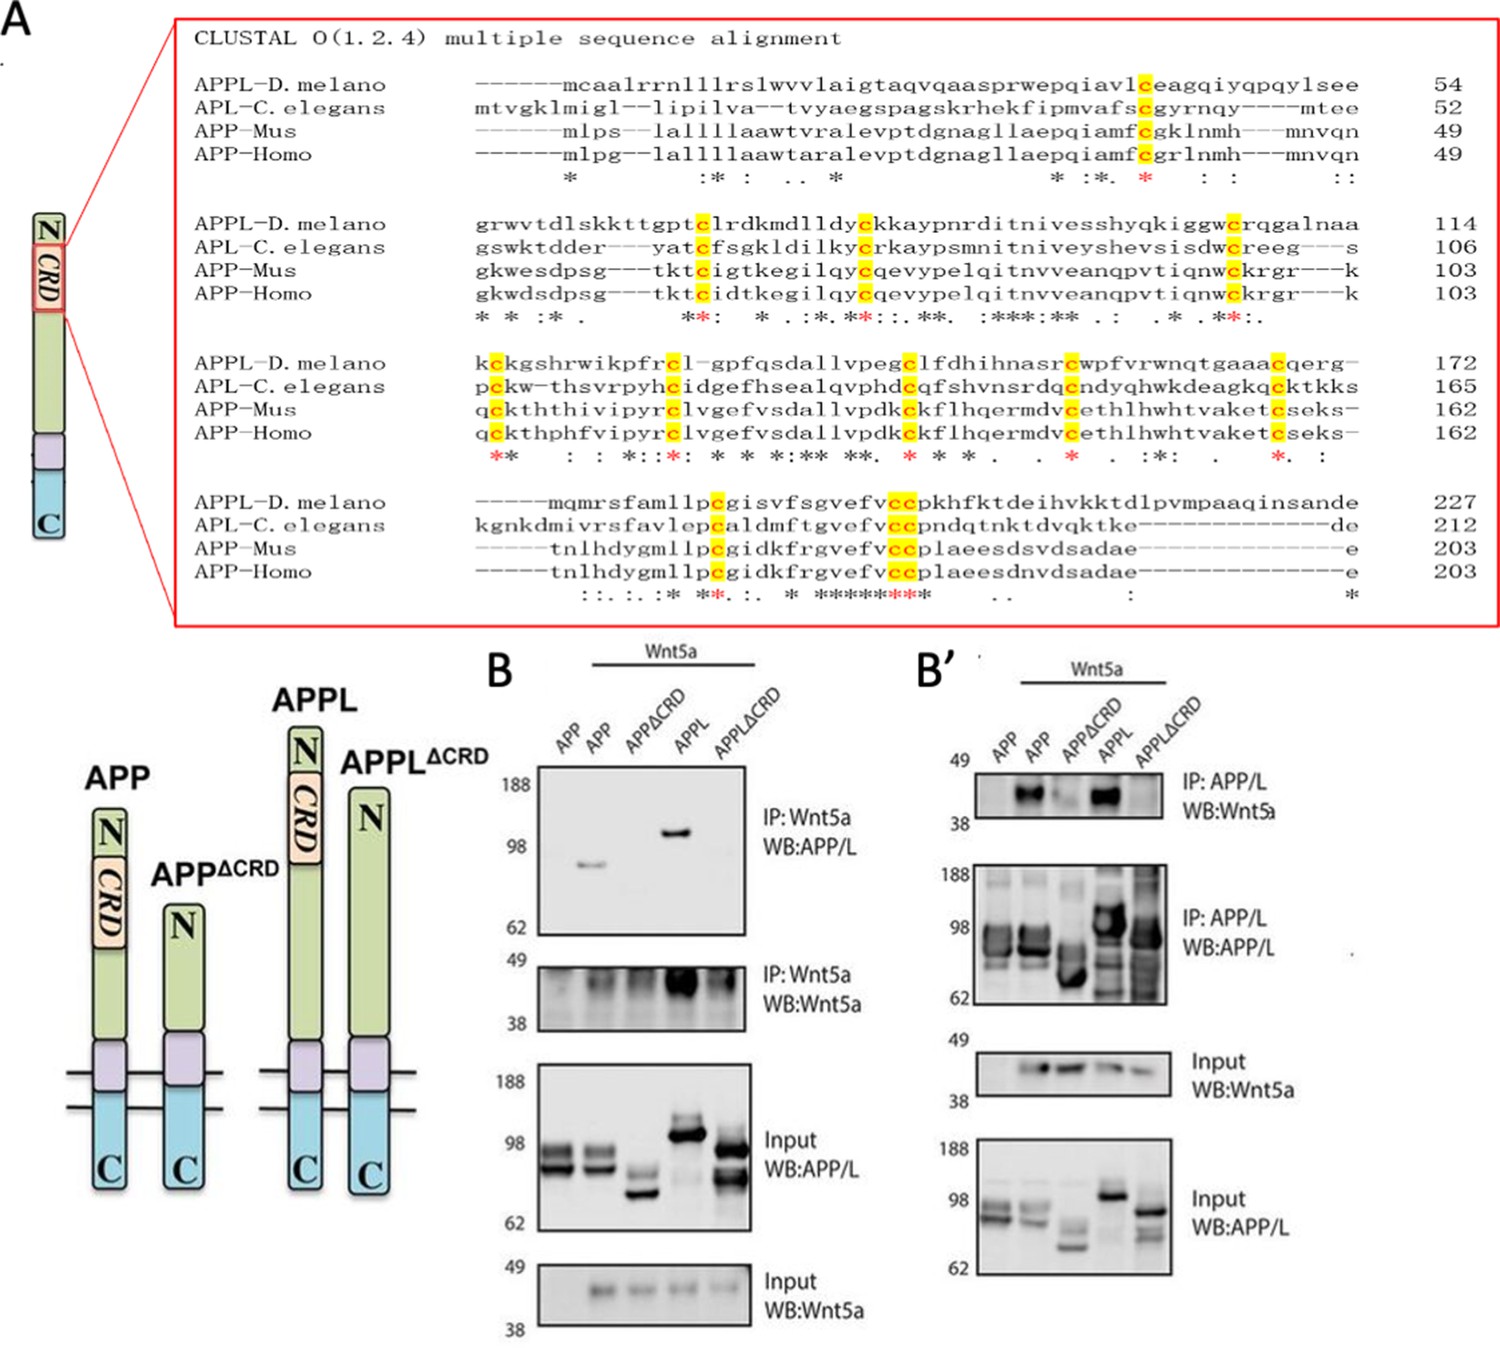
APPL and Wnt5 interact via the APP Cysteine-Rich Domain.
(A) APPL extracellular region contains a conserved CRD. The figure shows a CLUSTAL alignment of the CRD of different APP homologs. The 12 cysteine residues (as indicated by the red asterisks) are highly conserved across species. (B–B’) Wnt5a binds APPL and APP in a CRD-dependent manner. (B) Co-immunoprecipitation (co-IP) of the full-length proteins APP-flag and APPL-flag but not their truncated forms APPΔCRD-flag and APPLΔCRD-flag with Wnt5a-myc. (B’) Reciprocal co-IP showing that Wnt5a-myc is co-IPed with flAPP-flag and APPL-flag can but not when the CRDs are deleted.
Figure 2—figure supplement 1
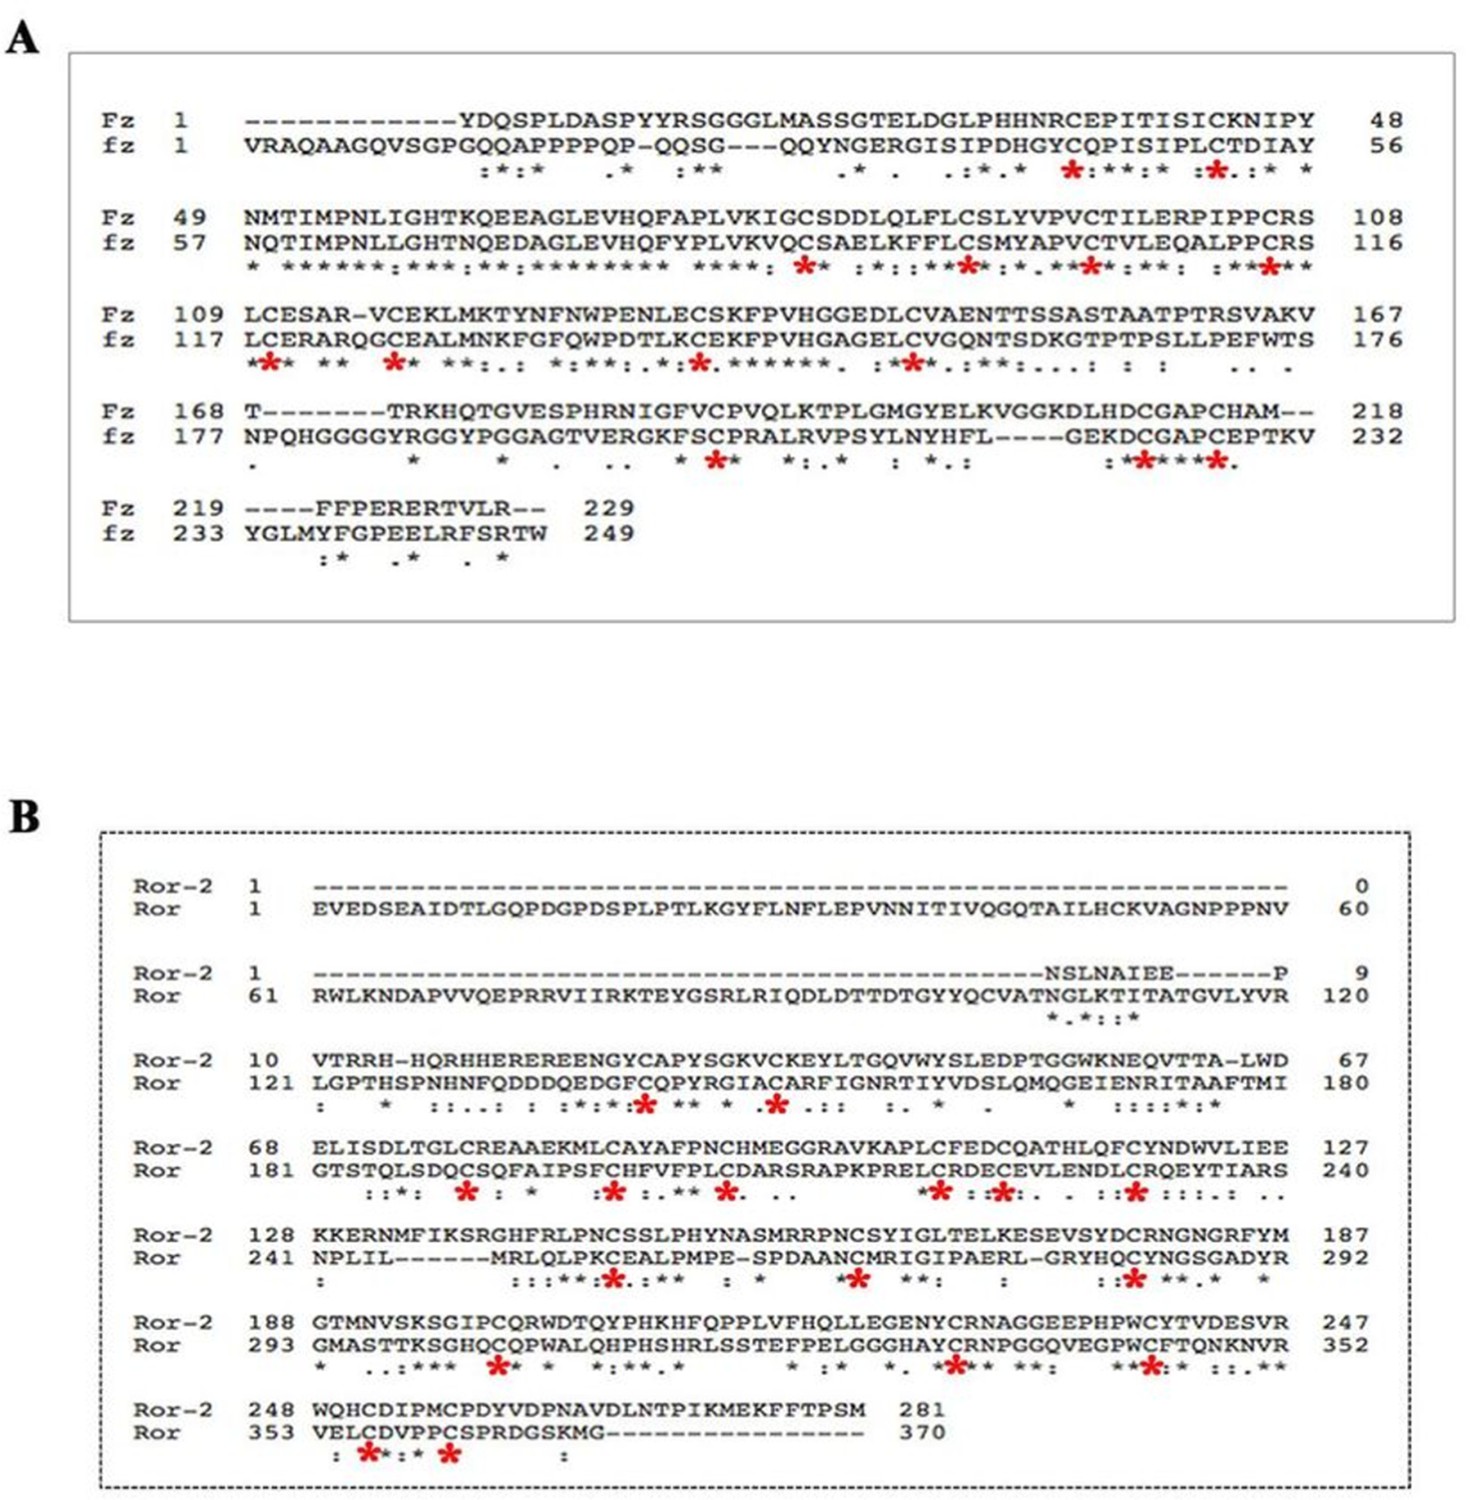
PCP receptors harbor conserved Cysteine-Rich Domains (CRD).
CLUSTAL alignment of the extracellular regions of Drosophila Frizzled (Fz) and Mus musculus Firzzled-1 (Fz-1) (A). CLUSTAL alignment of the extracellular regions of Drosophila Ror-2 and Mus musculus Ror-2 (Ror) (B). All proteins showed conserved cysteine residues in their extracellular region (as indicated by the red asterisks).
Figure 2—figure supplement 2
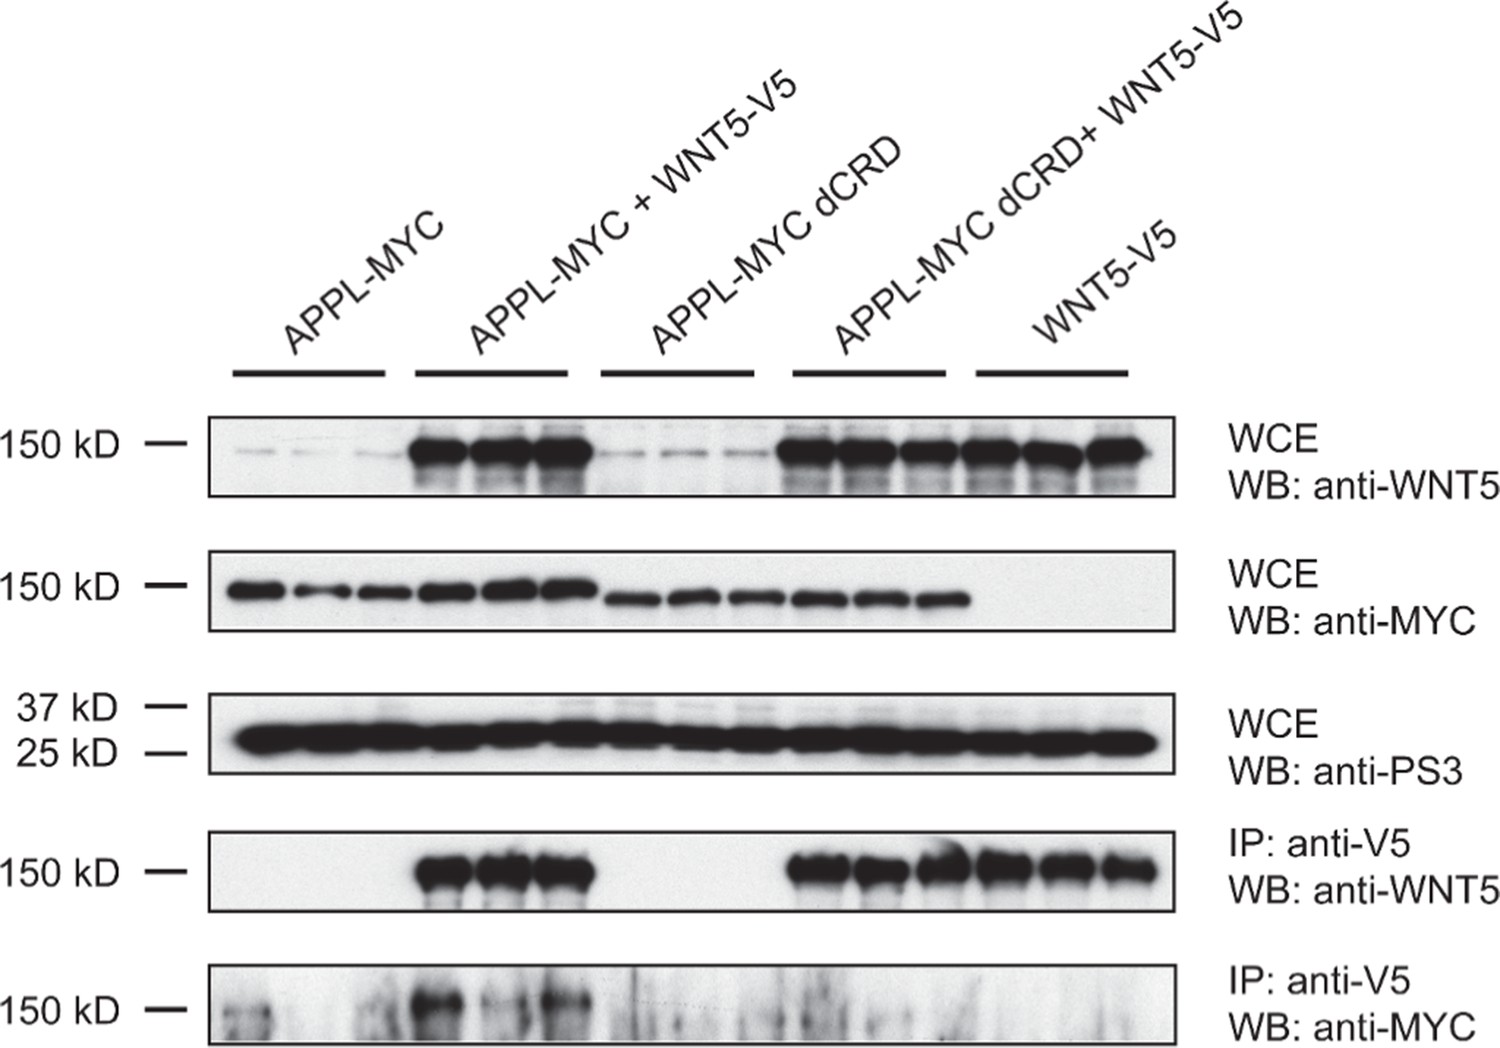
Co-immunoprecipitation assays reveal that Drosophila APPL binds to WNT5.
S2 cells were transfected in triplo with the indicated expression plasmids, lysates prepared and V5-tagged WNT5-containing complexes were immunoprecipitated with anti-V5 antisera. Following SDS-PAGE and transfer to PVDF membrane, MYC-tagged APPL species were detected with anti-MYC and an HRP-conjugated chemiluminscent detection reagent.
Figure 3 with 5 supplements
Wnt5a regulates APP expression through changing its intracellular trafficking.
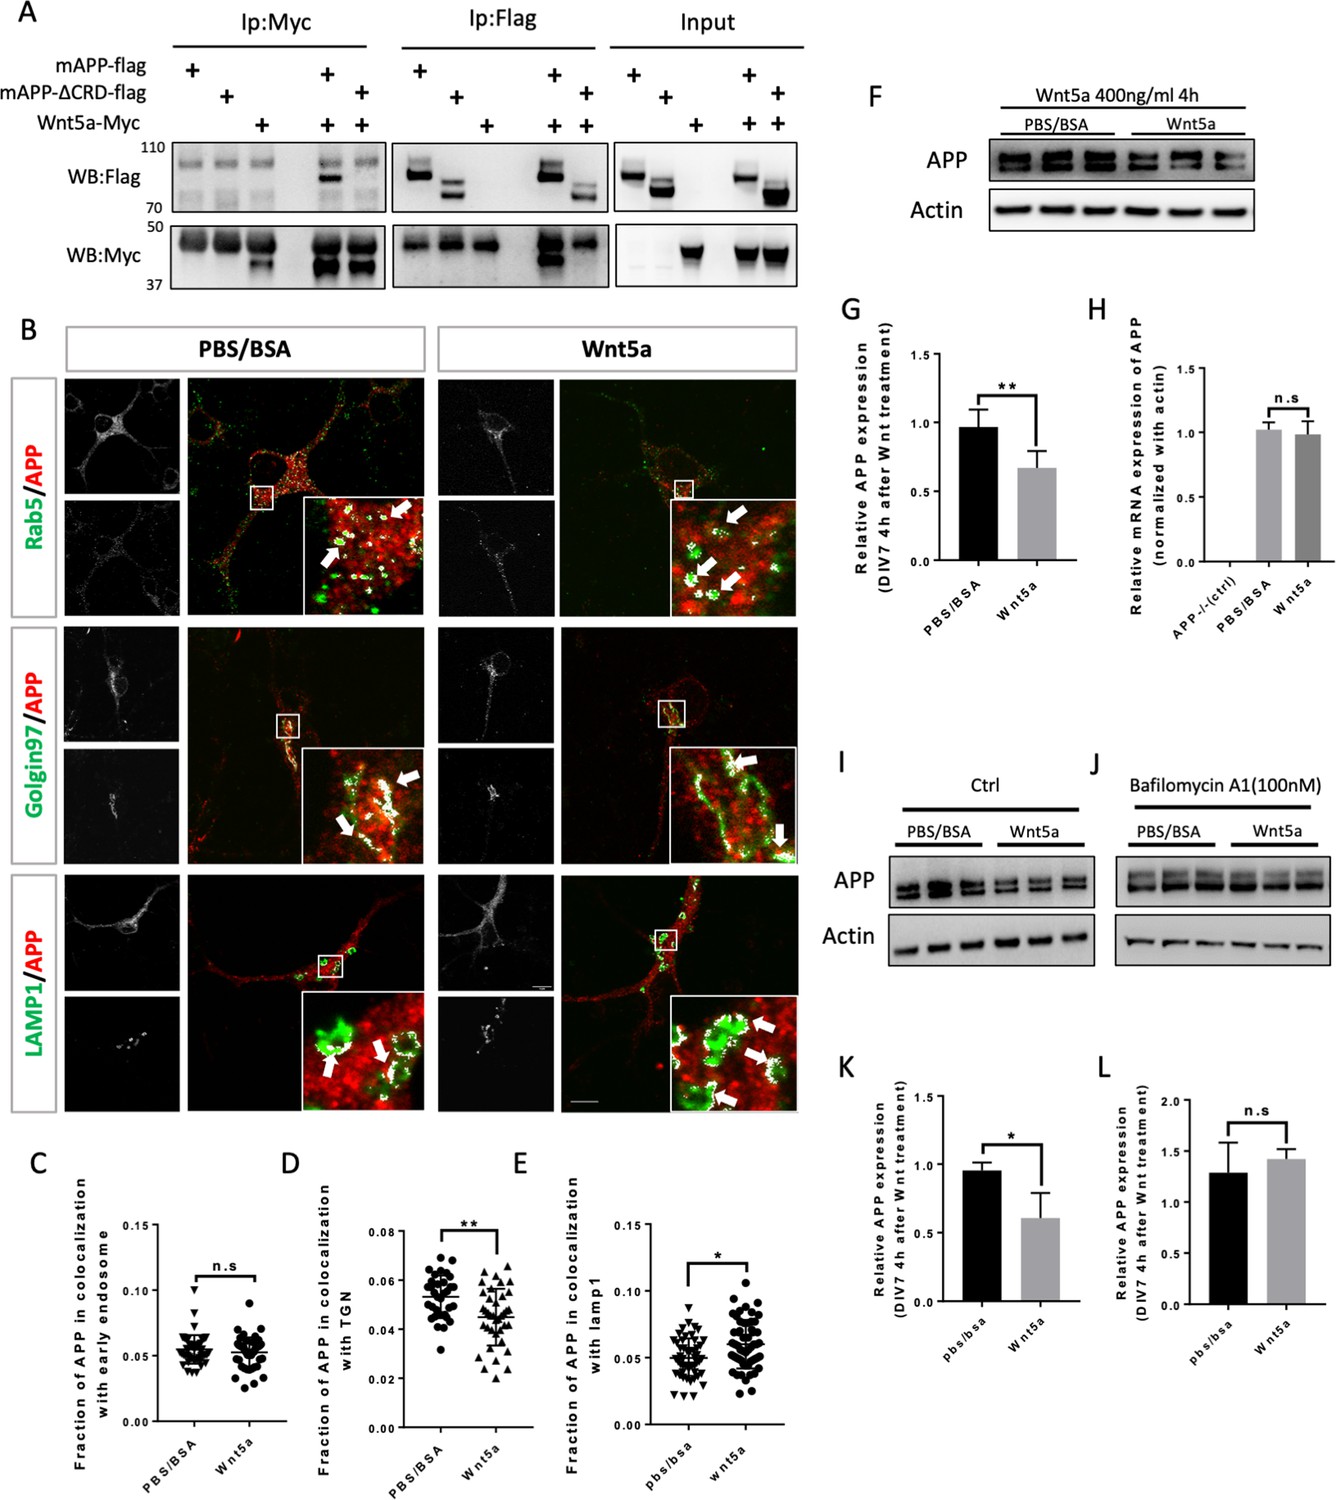
(A) Co-immunoprecipitation (co-IP) of Wnt5a-Myc with full-length proteins mAPP-flag or mAPP-delatCRD-flag. The tagged proteins were co-expressed in HEK293T cells and immunoprecipitated with ant-flag and anti-Myc antibodies. Wild-type mAPP could pull down Wnt5a and vice versa, while mAPP lacking the CRD domain showed impaired ability to pull down Wnt5a, even with higher protein levels compared to wild-type mAPP in the input. (B) mAPP localization after 4 hr PBS/BSA or Wnt5a treatment. Immunofluorescence for APP (red), Rab5 (early endosome marker, green), Golgin97 (TGN marker, green), and Lamp1 (lysosome marker, green) revealed mAPP localization in different intracellular compartments. The inset showed zoomed in images of the area in the white box and arrows indicated the overlap of mAPP with respective cellular compartment markers. Scale bar = 10 µm. (C–E) Quantification of the overlap of mAPP with early endosome (C), TGN (D) or lysosome (E), respectively, after Wnt5a treatment. (n=33–55 cells, t-test). (F) Western blots of mAPP and Actin on the lysates of DIV7 primary cultured cortical neurons showed that mAPP protein expression level was altered after Wnt5a treatment. (G) Quantification of the western blots results for fig F. (n=three biological independent repeat, t-test). (H) qPCR results showed that mApp mRNA expression was not affected after Wnt5a treatment on DIV7. App-/- mice derived primary neurons were used as a negative control. (n=three biological independent repeat, one-way ANOVA). (I and J) Western blots for APP showed that the lysosome inhibitor Bafilomycin-A (J) could rescue Wnt5a-induced mAPP reduction compared with control groups (I). (K and L) Quantification of the western blots result for figure I and J. (n=three biological independent repeat, t-test). Bars represent the mean ± S.E.M. Samples collected from at least two independent experiments. *p<0.05, **p<0.01. .
-
Figure 3—source data 1
Co-immunoprecipitation (co-IP) of Wnt5a-Myc with full-length proteins mAPP-flag or mAPP-delatCRD-flag.
- https://cdn.elifesciences.org/articles/69199/elife-69199-fig3-data1-v1.zip
-
Figure 3—source data 2
Western blots for mAPP and Actin after Wnt5a treatment on DIV7 primary cortical neurons.
- https://cdn.elifesciences.org/articles/69199/elife-69199-fig3-data2-v1.zip
-
Figure 3—source data 3
Western blots for mAPP and Actin after Wnt5a treatment on DIV7 primary cortical neurons.
- https://cdn.elifesciences.org/articles/69199/elife-69199-fig3-data3-v1.zip
-
Figure 3—source data 4
Western blots for mAPP and Actin after adding Bafilomycin followed by Wnt5a treatment on DIV7 primary cortical neurons.
- https://cdn.elifesciences.org/articles/69199/elife-69199-fig3-data4-v1.zip
Figure 3—figure supplement 1
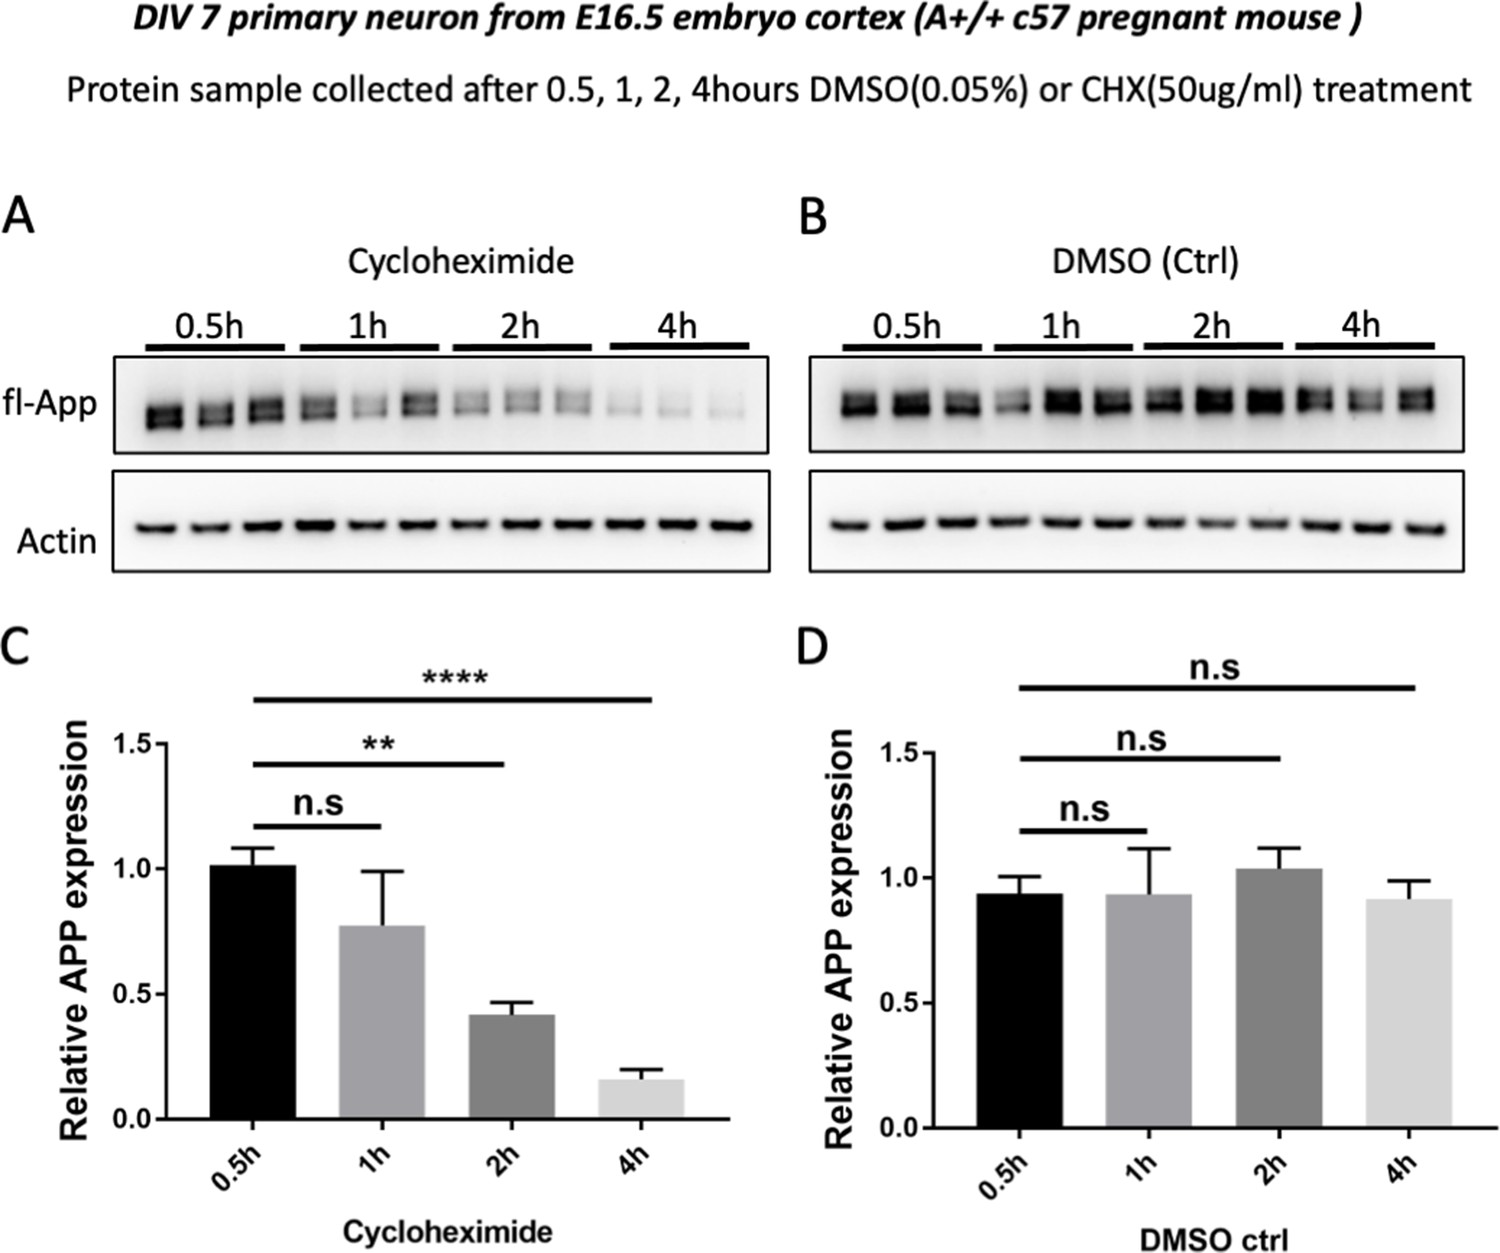
Rapid turnover of fl-mAPP in culture mouse primary cortical neurons.
(A and B) Western blots for the time course (0.5 hr, 1 hr, 2 hr, 4 hr) of fl-mAPP expression after Cycloheximide (50 µg/ml, A) or DMSO (0.05%, B) treatment at DIV7. (C and D) Quantification of fl-mAPP expression after Cycloheximide (C) or DMSO treatment (D). (n=three biological independent repeat, one-way ANOVA). Bars represent the mean ± S.E.M. **p<0.01, ****p<0.0001.
-
Figure 3—figure supplement 1—source data 1
Western blots for time course (0.5 hr, 1 hr, 2 hr, 4 hr) of fl-mAPP expression after Cycloheximide (50 µg/ml) treatment on DIV7 primary cortical neurons.
- https://cdn.elifesciences.org/articles/69199/elife-69199-fig3-figsupp1-data1-v1.zip
-
Figure 3—figure supplement 1—source data 2
Western blots for time course (0.5 hr, 1 hr, 2 hr, 4 hr) of fl-mAPP expression after DMSO (0.05%), treatment on DIV7 primary cortical neurons.
- https://cdn.elifesciences.org/articles/69199/elife-69199-fig3-figsupp1-data2-v1.zip
Figure 3—figure supplement 2
APP overlap with early endosome, TGN and lysosome after Wnt3a/5a treatment.
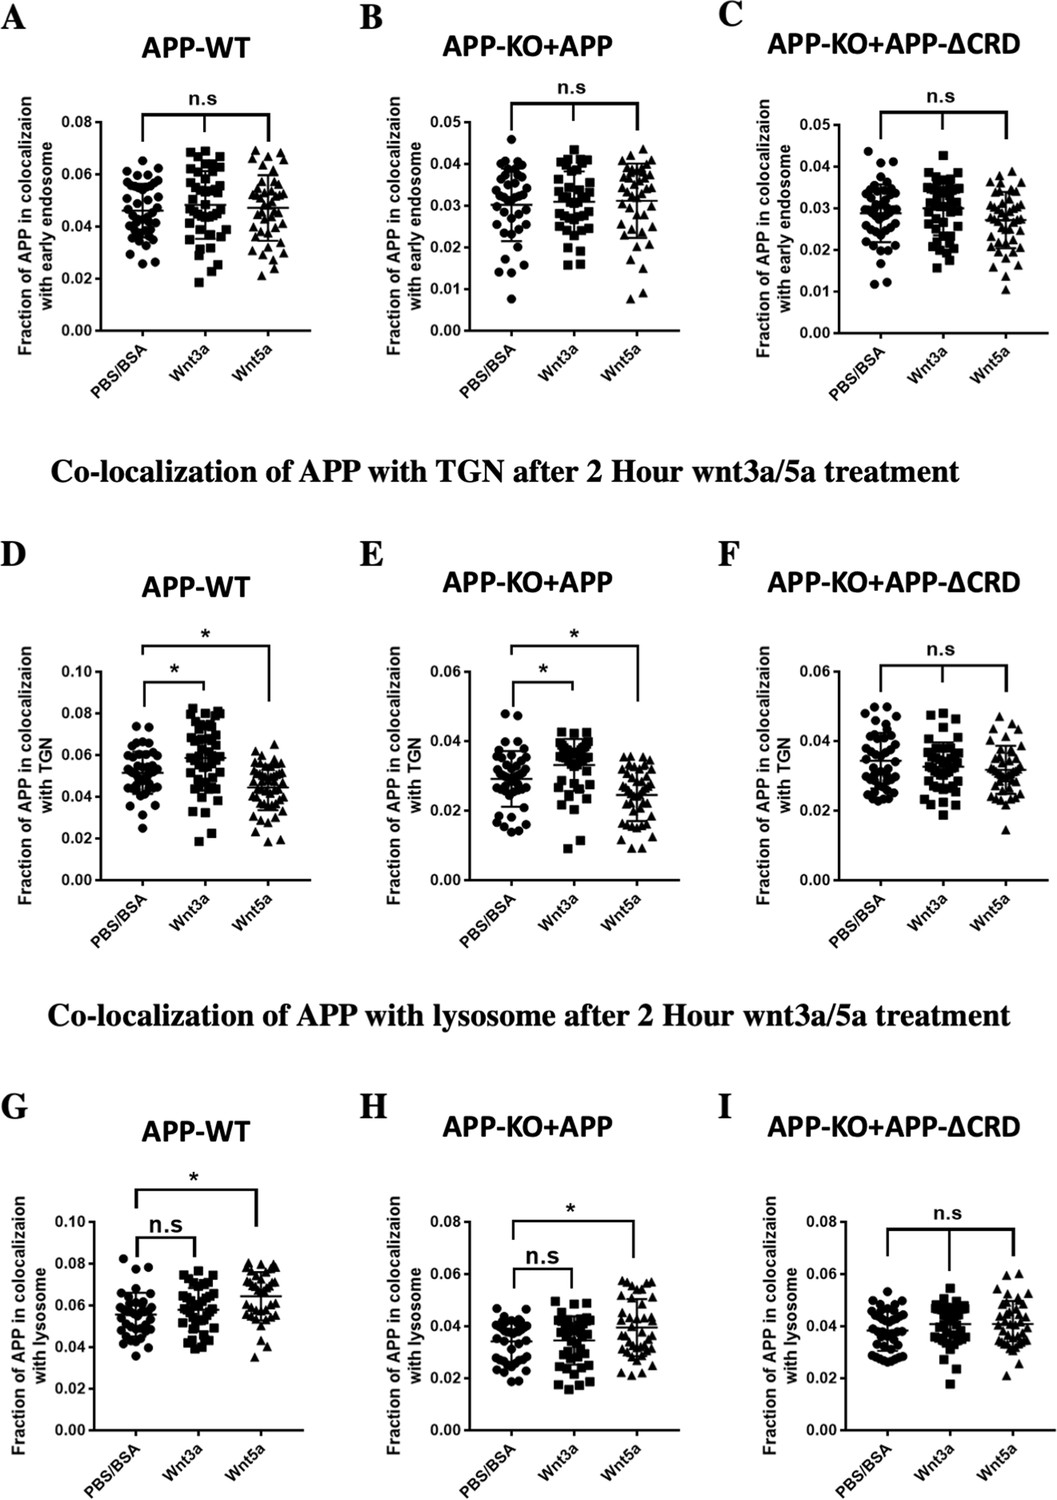
(A–C) Quantification of the overlap between mAPP and early endosome 2 hr after Wnt3a/5a treatment in DIV7 cultured cortical primary neurons: APP-WT groups (A), APP-KO rescued with APP groups (B) and APP-KO rescued with APP-ΔCRD groups (C). (n=38–44 cells, one-way ANOVA). (D–F) Quantification of the overlap between mAPP and TGN 2 hr after Wnt3a/5a treatment in DIV7 cultured cortical primary neurons: APP-WT groups (D), APP-KO rescued with APP groups (E) and APP-KO rescued with APP-ΔCRD groups (F). (n=43–48 cells, one-way ANOVA). (G–I) Quantification of the overlap between mAPP and lysosome 2 hr after Wnt3a/5a treatment in DIV7 cultured cortical primary neurons: APP-WT groups (G), APP-KO rescued with APP groups (H) and APP-KO rescued with APP-ΔCRD groups (I). (n=38–40 cells, one-way ANOVA). Bars represent the mean ± S.E.M. Samples collected from at least two independent experiments. *p<0.05.
Figure 3—figure supplement 3
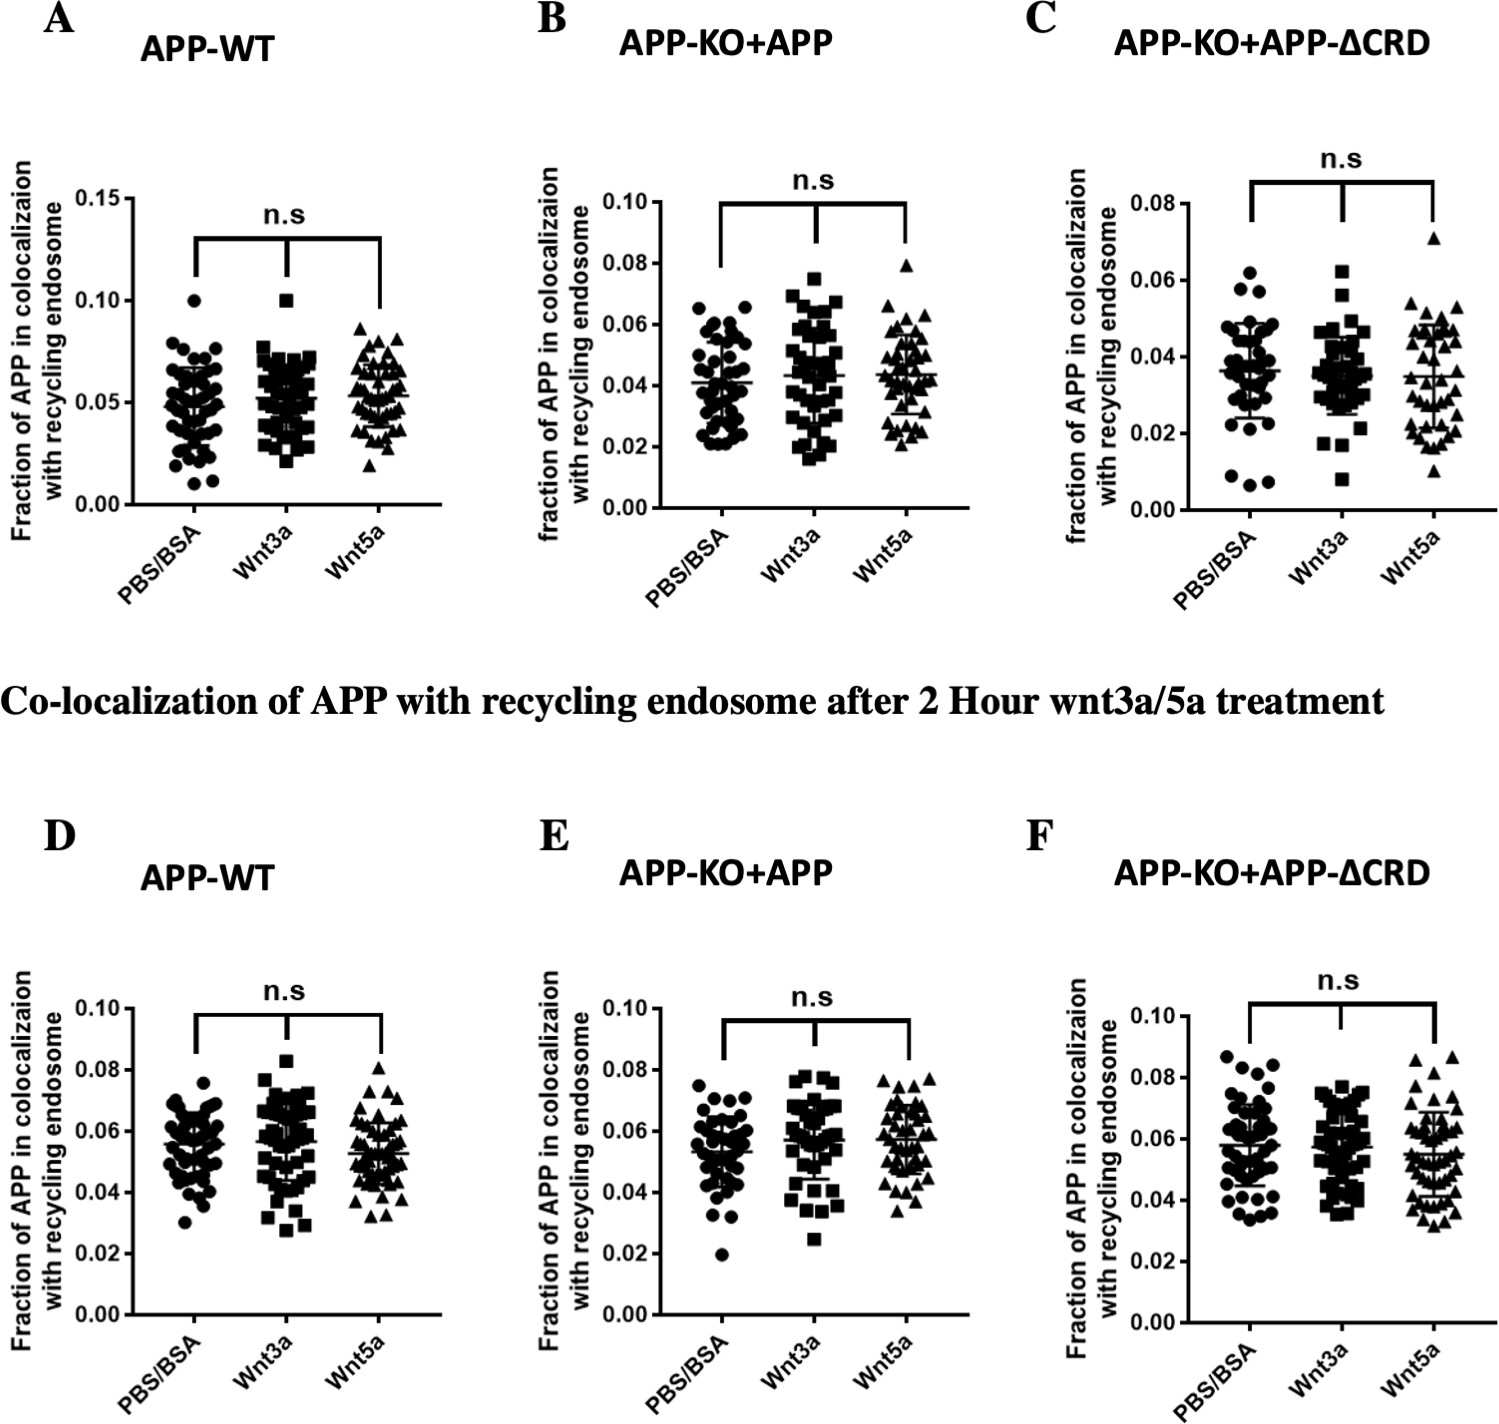
Wnt3a/5a treatment barely affect APP overlap with recycling endosome.
(A–C) Quantification of the overlap between mAPP and recycling endosome 4 hr after Wnt3a/5a treatment in DIV7 cultured cortical primary neurons: APP-WT groups (A), APP-KO rescued with APP groups (B) and APP-KO rescued with APP-ΔCRD groups (C). (n=41–49 cells, one-way ANOVA). (D–F) Quantification of the overlap between mAPP and recycling endosome 2 hr after Wnt3a/5a treatment in DIV7 cultured cortical primary neurons: APP-WT groups (D), APP-KO rescued with APP groups (E) and APP-KO rescued with APP-ΔCRD groups (F). (n=42–56 cells, one-way ANOVA). Bars represent the mean ± S.E.M. Samples collected from at least two independent experiments.
Figure 3—figure supplement 4
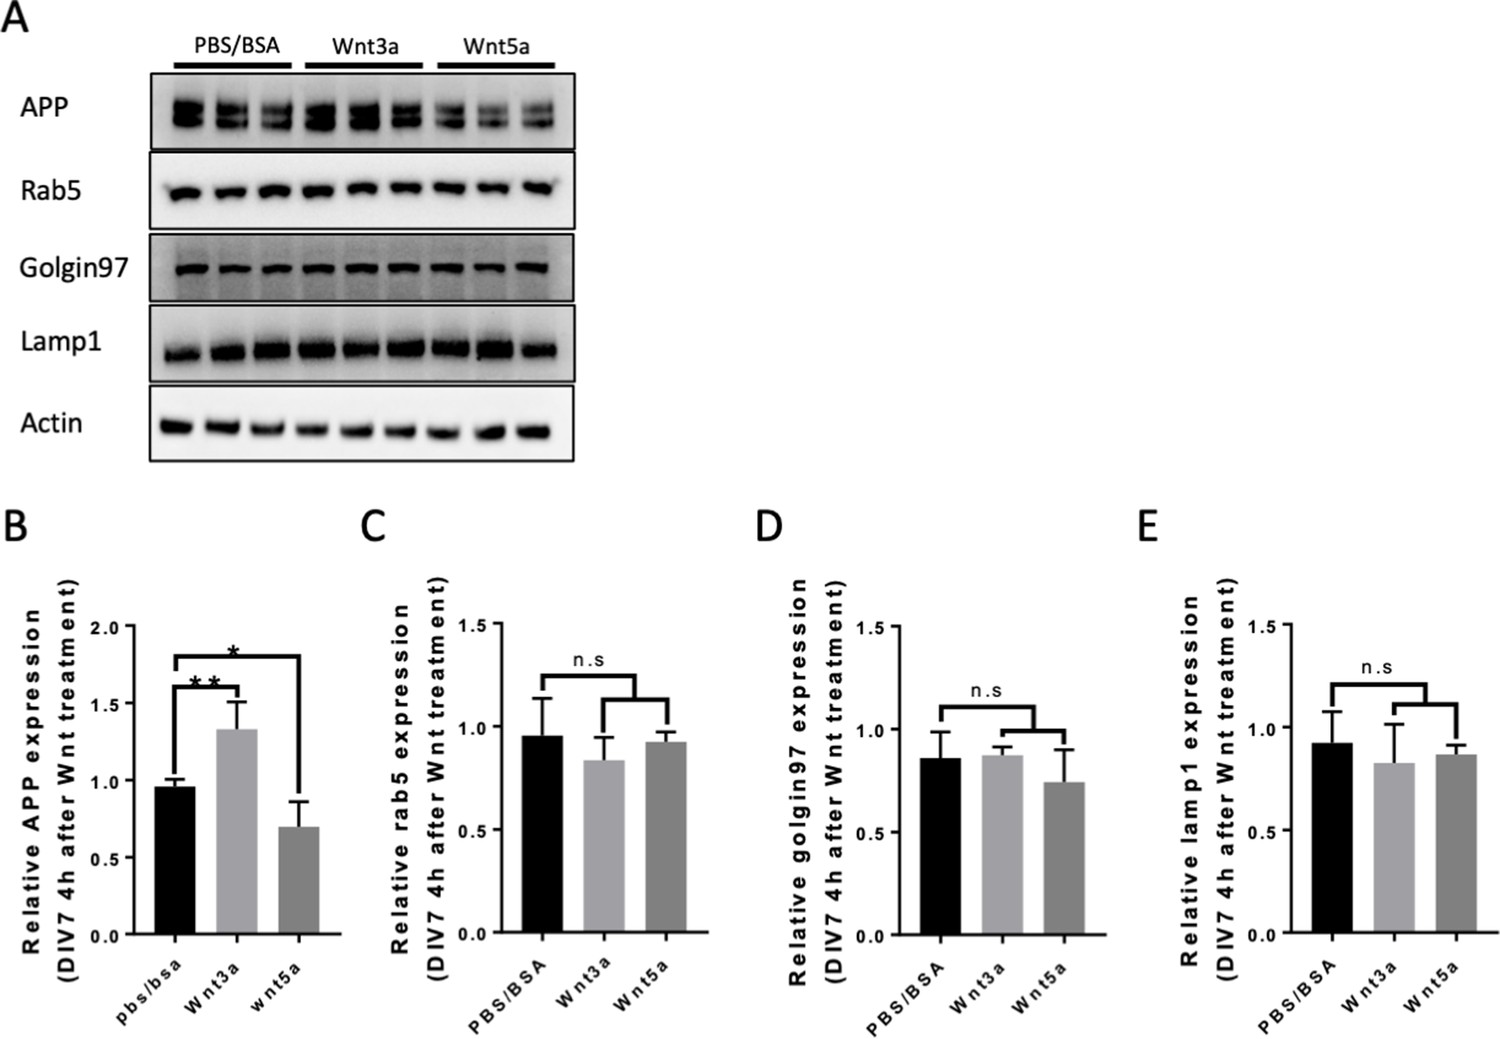
Rab5 Golgin97 and Lamp1 expression after Wnt3a/5a treatment.
(A) Western blots for fl-mAPP, Rab5, Golgin97, Lamp1, and Actin 4 hr after Wnt3a/5a treatment at DIV7. (B–E) Quantification of the western blots results for figure (A) fl-mAPP (B), Rab5 (C), Golgin97 (D), and Lamp1 (E). (n=three biological independent repeat, one-way ANOVA). Bars represent the mean ± S.E.M. Samples collected from at least two independent experiments. *p<0.05, **p<0.01.
-
Figure 3—figure supplement 4—source data 1
Western blots for fl-mAPP, Rab5, Golgin97, and Lamp1 after 4 hr of Wnt3a/5a treatment on DIV7 primary cortical neurons.
- https://cdn.elifesciences.org/articles/69199/elife-69199-fig3-figsupp4-data1-v1.zip
Figure 3—figure supplement 5
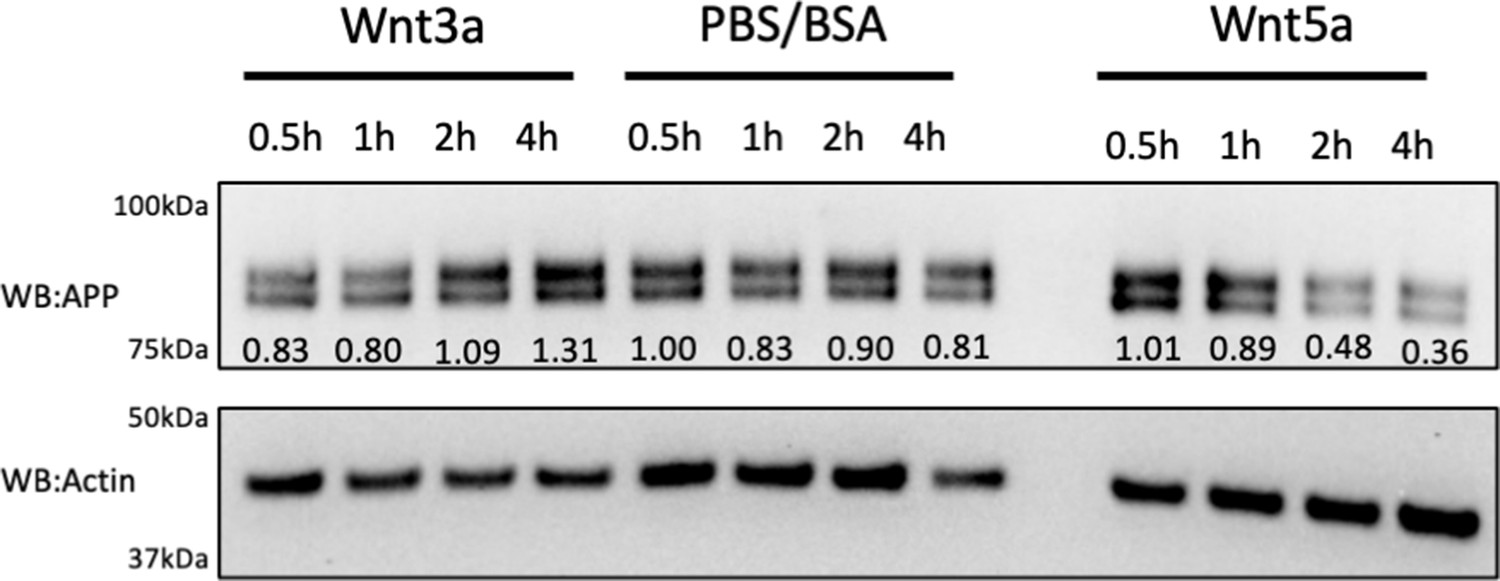
Time course of fl-mAPP after Wnt3a/5a treatment.
Representative western blots for the time course (0.5 hr, 1 hr, 2 hr, 4 hr) of fl-mAPP expression after PBS/BSA (ctrl) and Wnt3a/5a treatment at DIV7. Relative expression value of the protein bands normalized to the respective actin were also shown.
-
Figure 3—figure supplement 5—source data 1
Representative western blots for the time course (0.5 hr, 1 hr, 2 hr, 4 hr) of fl-mAPP expression after PBS/BSA (ctrl) and Wnt3a/5a treatment at DIV7.
- https://cdn.elifesciences.org/articles/69199/elife-69199-fig3-figsupp5-data1-v1.zip
Figure 4 with 2 supplements
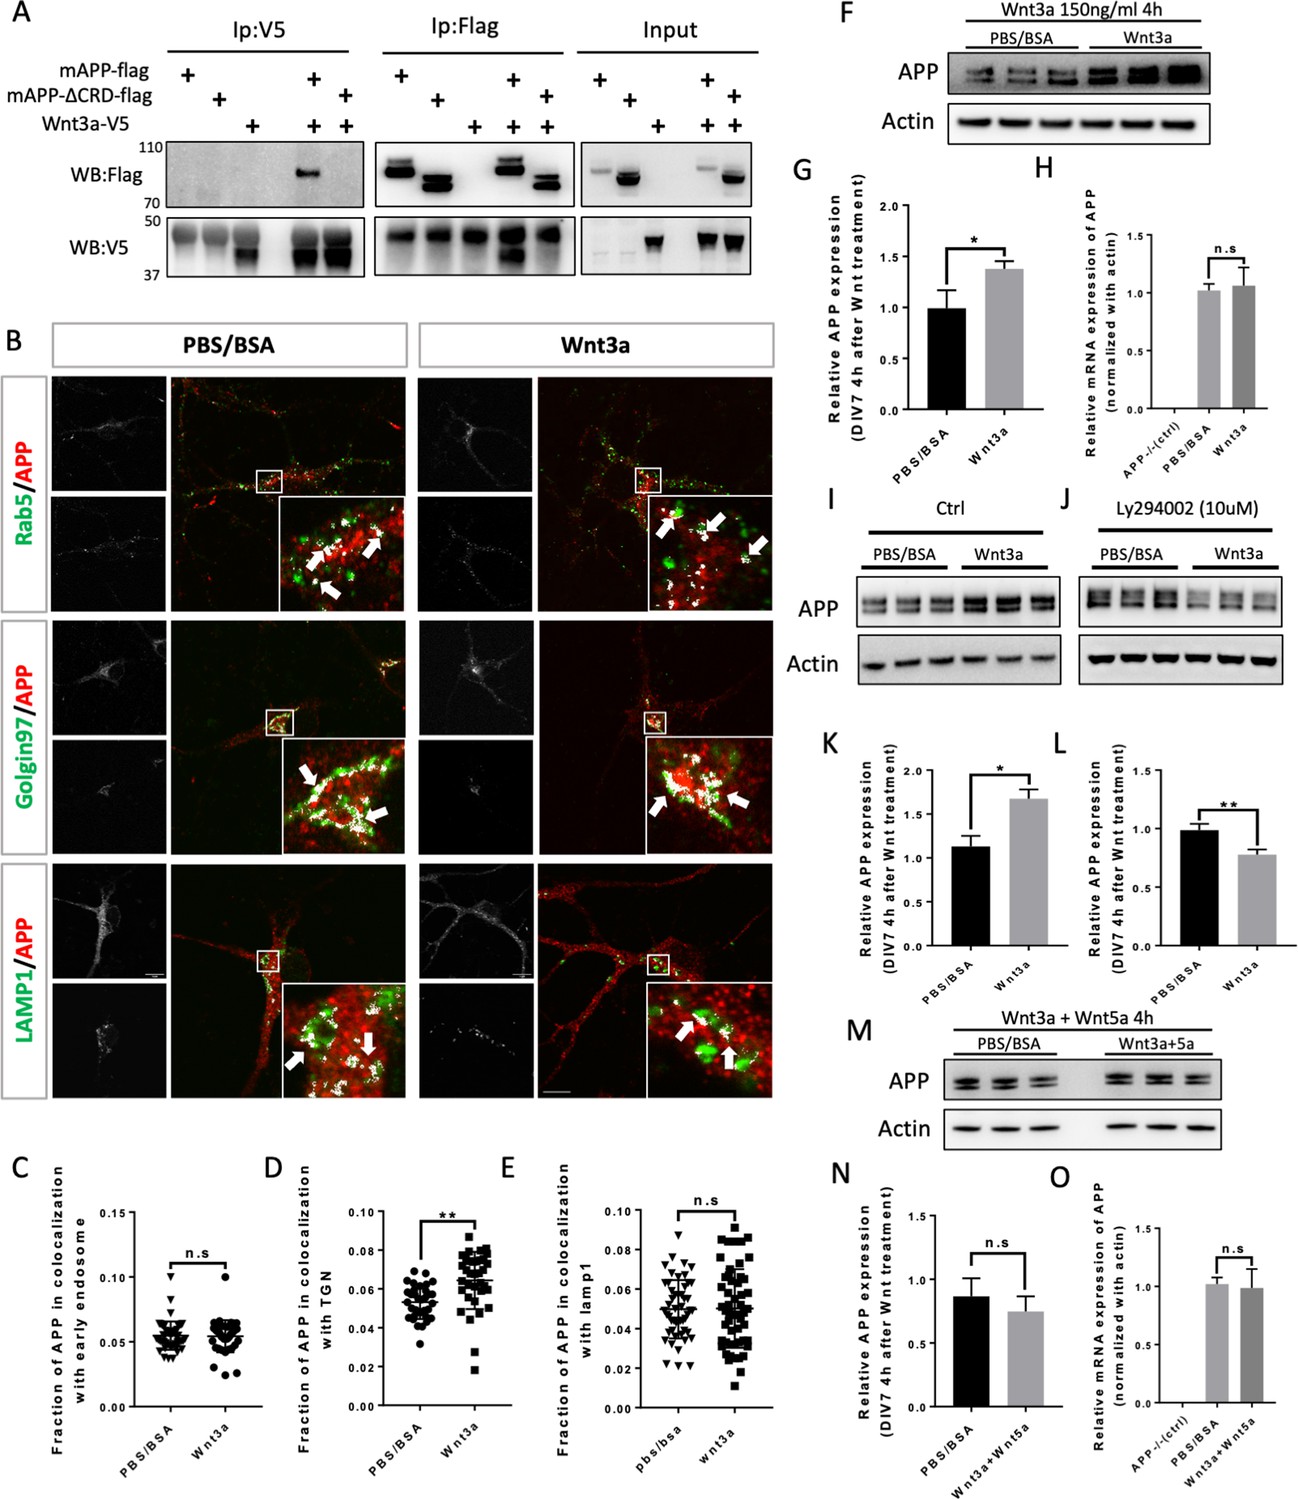
Wnt3a binds to and regulates APP expression through changing its intracellular trafficking.
(A) Co-immunoprecipitation (co-IP) of Wnt3a-V5 with full-length proteins mAPP-flag or mAPPLΔCRD. The tagged proteins were co-expressed in HEK293T cells and immunoprecipitated with ant-flag and anti-v5 antibodies. Wild-type mAPP could pull down Wnt3a and vice versa, while mAPP lacking the CRD domain showed impaired ability to pull down Wnt3a even with higher protein levels compared to wild type mAPP in the input. (B) mAPP localization after 4 hr PBS/BSA or Wnt3a treatment. Immunofluorescence for APP (red), Rab5 (green), Golgin97 (green), and Lamp1 (green) revealed mAPP localization in different intracellular compartments. The inset showed zoomed in images of the area in the white box and arrows indicated the overlap of mAPP with respective cellular compartment markers. Scale bar = 10 um. (C–E) Quantification of the overlap of mAPP with early endosome (C), TGN (D) or lysosome (E), respectively, after Wnt3a treatment. (n=33–54 cells, t-test). (F) Western blots of mAPP and Actin on the lysates of DIV7 primary cultured cortical neurons showed that mAPP protein expression level was altered after Wnt3a treatment. (G) Quantification of the western blots results for figure F. (n=three biological independent repeat, t-test). (H) qPCR results showed that mApp mRNA expression was not affected after Wnt3a treatment on DIV7. App-/- mice derived primary neurons were used as a negative control. (n=three biological independent repeat, one-way ANOVA). (I and J) Western blots for APP showed that the Retromer inhibitor Ly294002 (J) could rescue Wnt3a-induced mAPP increase compared with control groups (I). (K and L) Quantification of the western blots results for figure I and J. (n=three biological independent repeat, t-test). (M) Western blots for mAPP expression 4 hr after Wnt3a and Wnt5a treatment at the same time on DIV7. PBS/BSA group acted as control group. (N) Quantification of the western blots results for figure M. (n=three biological independent repeat, t-test). (O) qPCR results for mApp mRNA expression in mApp knockout neurons (negative control), PBS/BSA treated control group neurons and Wnt3a+Wnt5a-treated group neurons. (n=three biological independent repeat, one-way ANOVA). Bars represent the mean ± S.E.M. Samples collected from at least two independent experiments. *p<0.05, **p<0.01.
-
Figure 4—source data 1
Co-immunoprecipitation (co-IP) of Wnt3a-V5 with full-length proteins mAPP-flag or mAPPLΔCRD.
- https://cdn.elifesciences.org/articles/69199/elife-69199-fig4-data1-v1.zip
-
Figure 4—source data 2
Western blots for mAPP and Actin after Wnt3a treatment on DIV7 primary cortical neurons.
- https://cdn.elifesciences.org/articles/69199/elife-69199-fig4-data2-v1.zip
-
Figure 4—source data 3
Western blots for mAPP and Actin after Wnt3a treatment on DIV7 primary cortical neurons.
- https://cdn.elifesciences.org/articles/69199/elife-69199-fig4-data3-v1.zip
-
Figure 4—source data 4
Western blots for mAPP and Actin after adding Ly294002 followed by Wnt3a treatment on DIV7 primary cortical neurons.
- https://cdn.elifesciences.org/articles/69199/elife-69199-fig4-data4-v1.zip
-
Figure 4—source data 5
Western blots for mAPP and Actin after Wnt3a + Wnt5a treatment on DIV7 primary cortical neurons.
- https://cdn.elifesciences.org/articles/69199/elife-69199-fig4-data5-v1.zip
Figure 4—figure supplement 1
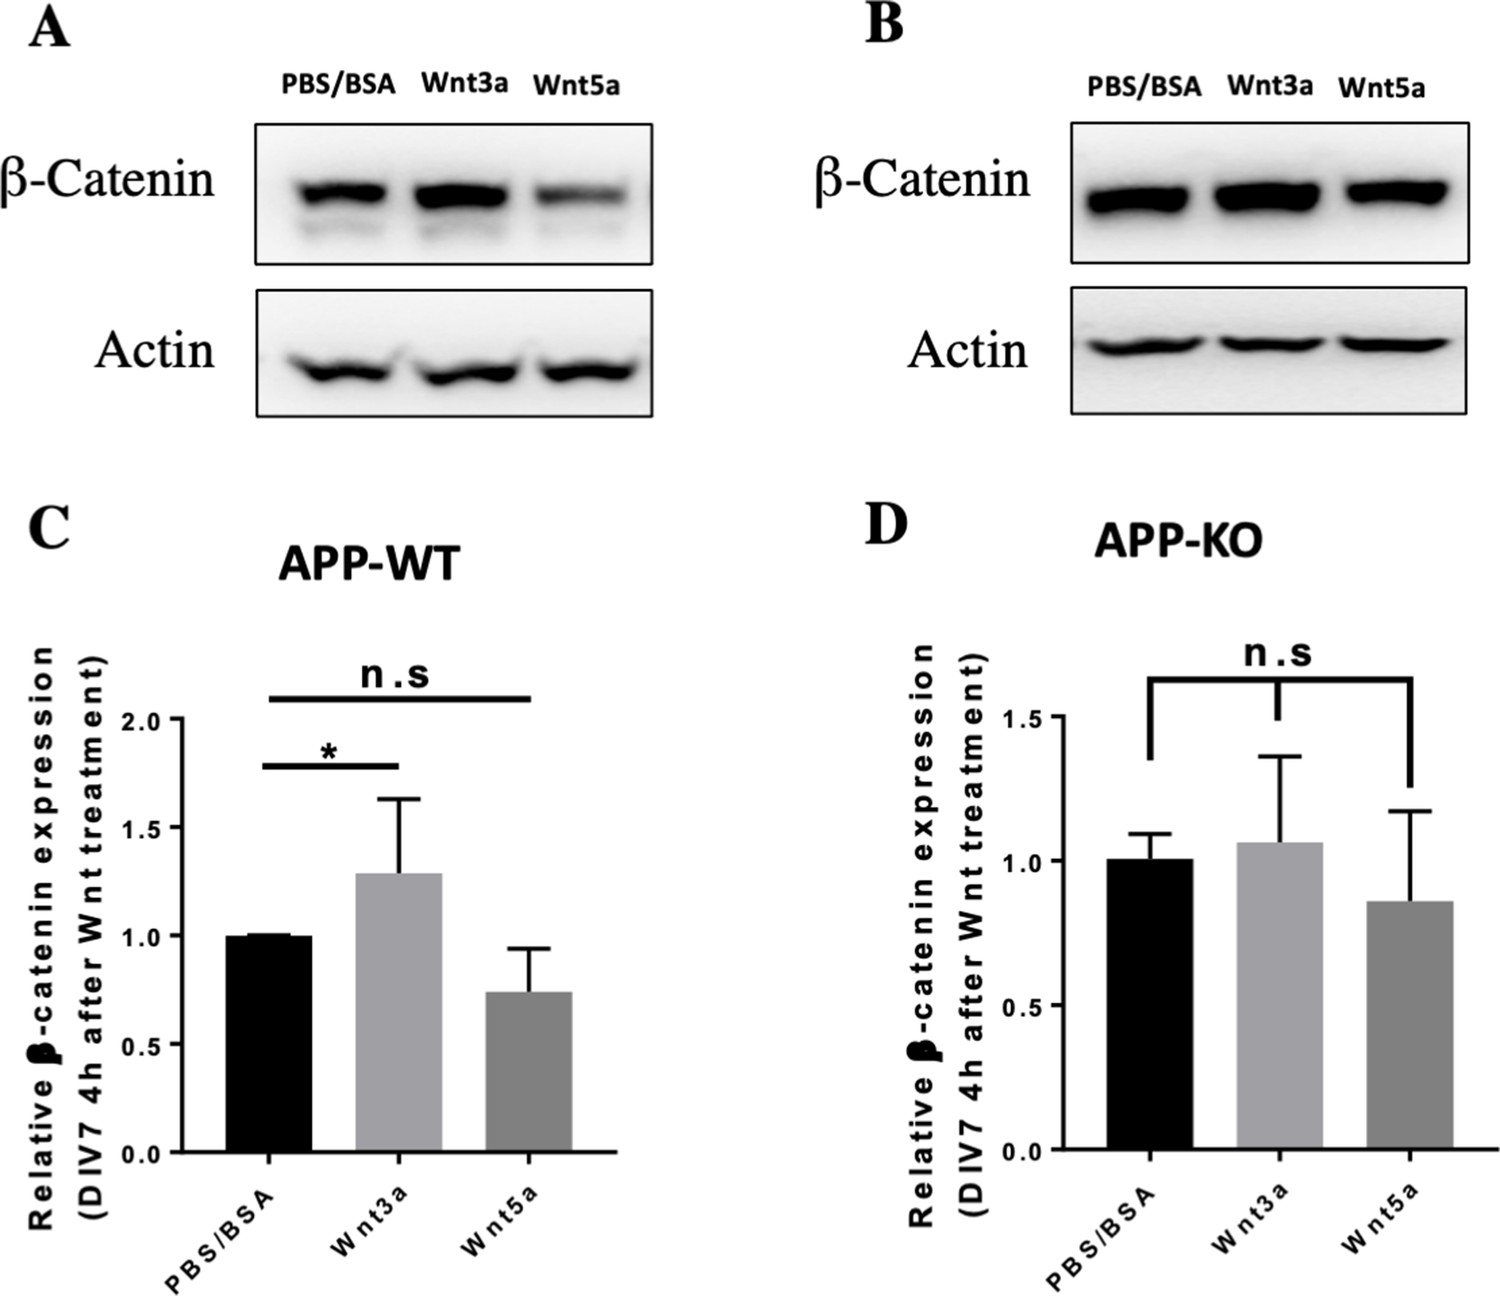
APP affects beta-catenin expression after Wnt3a treatment.
(A and B) Western blots for β-Catenin and Actin expression on APP-WT (A) and APP-KO (B) primary cultured cortical neurons 4 hr after Wnt3a/5a treatment at DIV7. (C and D) Quantification of the western blots results for figure A and B. (n=three biological independent repeat, one-way ANOVA). Bars represent the mean ± S.E.M. Samples collected from at least two independent experiments. *p<0.05.
-
Figure 4—figure supplement 1—source data 1
Western blots for β-Catenin and Actin for APP-WT primary cultured cortical neurons after 4 hr of Wnt3a/5a treatment on DIV7 primary cortical neurons.
- https://cdn.elifesciences.org/articles/69199/elife-69199-fig4-figsupp1-data1-v1.zip
-
Figure 4—figure supplement 1—source data 2
Western blots for β-Catenin and Actin for APP-KO primary cultured cortical neurons after 4 hr of Wnt3a/5a treatment on DIV7 primary cortical neurons.
- https://cdn.elifesciences.org/articles/69199/elife-69199-fig4-figsupp1-data2-v1.zip
Figure 4—figure supplement 2
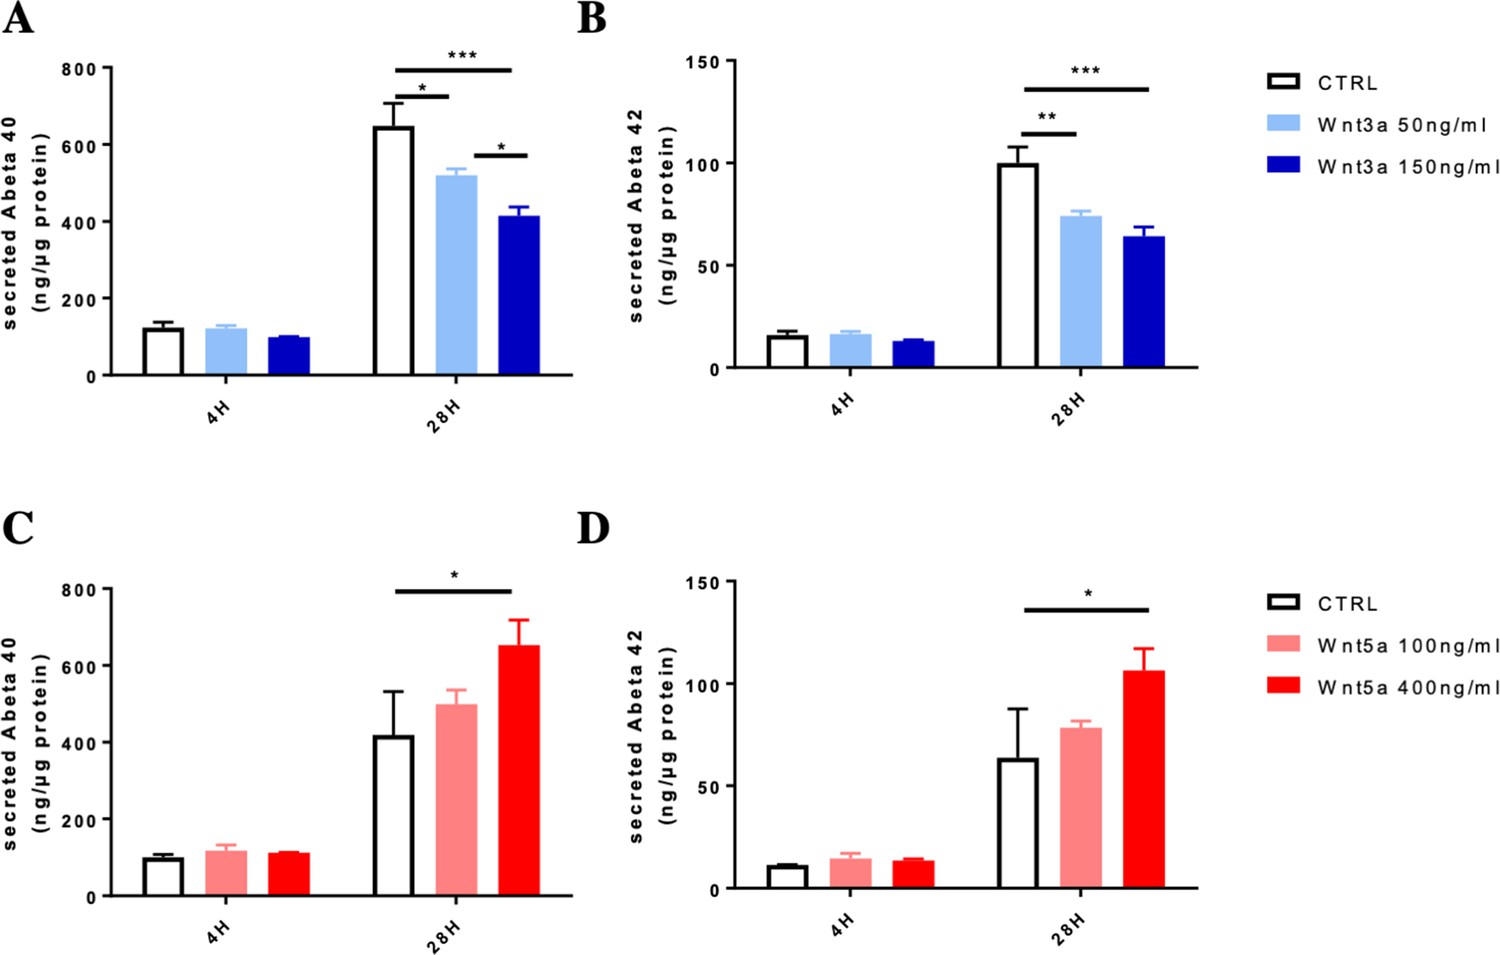
Aβ detection after Wnts treatment on DIV7 primary cortical neurons.
(A and B) Detection of secreted Aβ40 (A) and Aβ42 (B) from DIV7 primary cultured cortical neurons treated with Wnt3a (supernatant collected from 4 hr Wnt3a treatment or anther 24 hr cultured with medium refreshed without Wnt3a). (C and D) Detection of secreted Aβ40 (C) and Aβ42 (D) from DIV7 primary cultured cortical neurons treated with Wnt5a (supernatant collected from 4 hr Wnt5a treatment or anther 24 hr cultured with medium refreshed without Wnt5a). Bars represent the mean ± S.E.M., n=three biological independent repeat, one-way ANOVA. *p<0.05, **p<0.01, ***p<0.001.
Figure 5 with 2 supplements
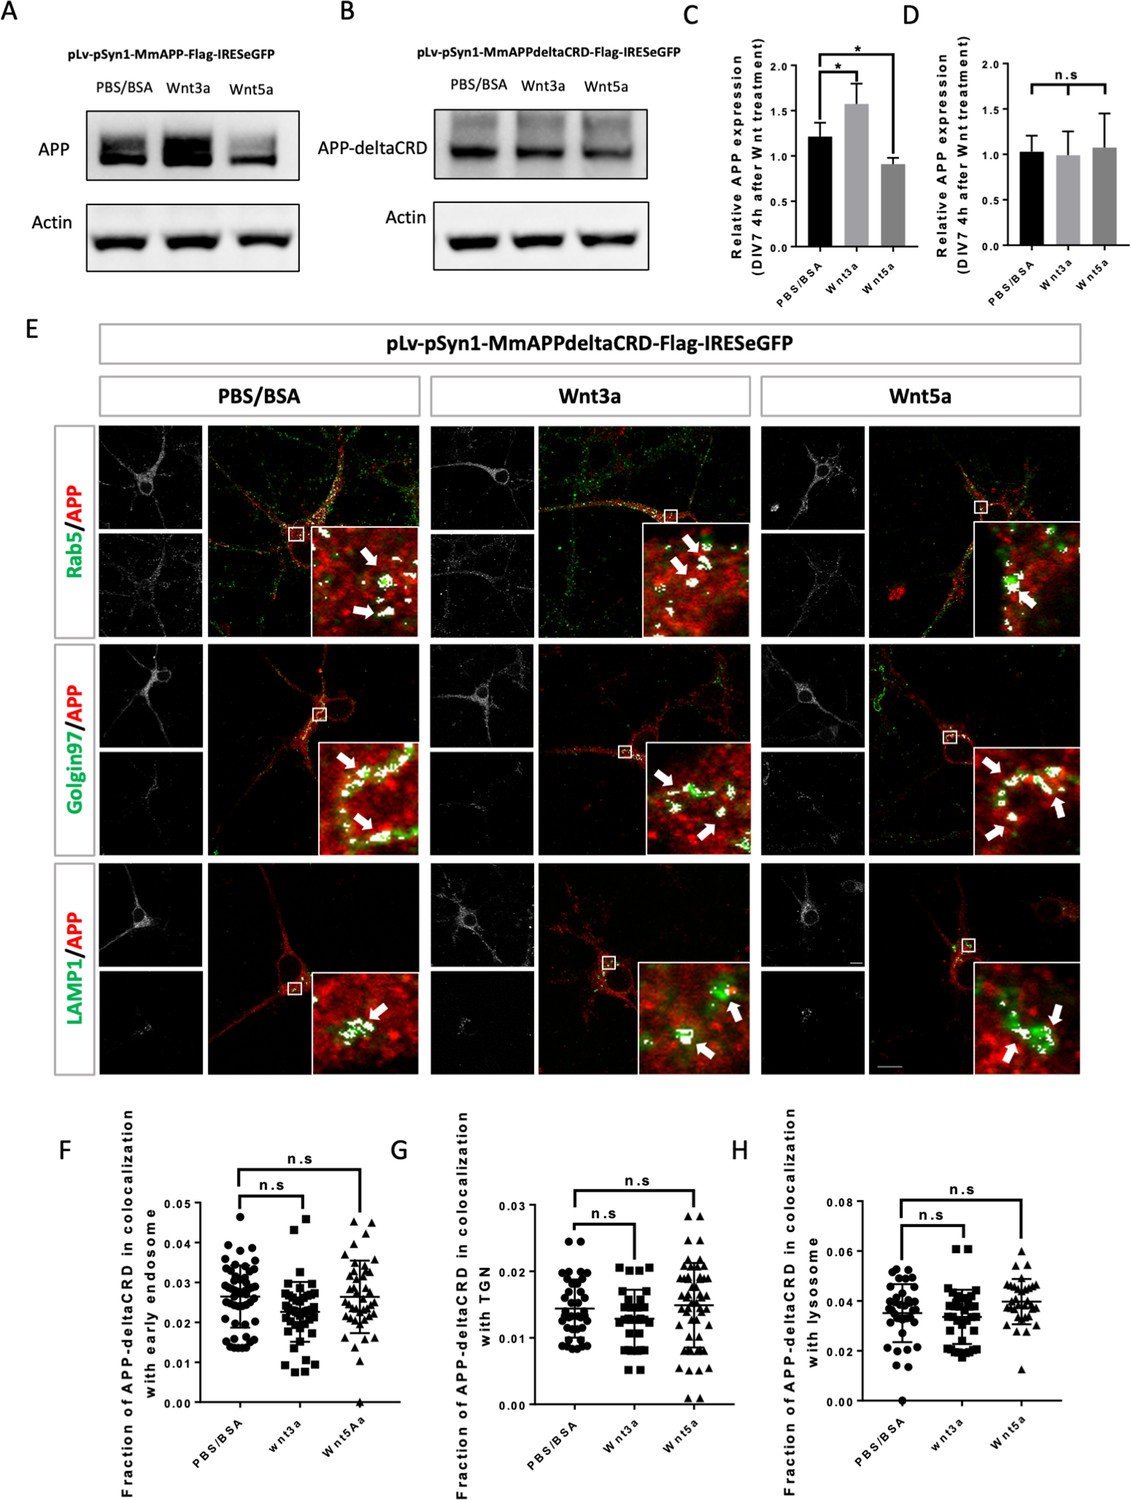
CRD is required for Wnt3a/5a to affect APP trafficking and expression.
(A and B) Western blots for the detection of exogenous APP expression 4 hr after PBS/BSA (control), Wnt3a or Wnt5a treatment at DIV7 in APP-KO primary cultured neurons which were transfected with pLv-pSyn1-mAPP-Flag-IRESeGFP (A) or pLv-pSyn1-mAPPΔCRD-Flag-IRESeGFP (B) lenti-virus. (C and D) Quantification of the western blots results for figure A and B, respectively. (n=three biological independent repeat, one-way ANOVA). (E) Localization of exogenous mAPP expression in APP–KO primary cultured cortical neurons 4 hr after Wnt3a or Wnt5a treatment. Immunofluorescence for APP (red), Rab5 (green), Golgin97 (green), and Lamp1 (green) revealed mAPP localization in different intracellular compartments. The inset showed zoomed in images of the area in the white box and arrows indicated the overlap of mAPP with respective cellular compartment markers. (F–H) Quantification of the overlap of mAPP with early endosome (F), TGN (G), or lysosome (H), respectively, after Wnt3a or Wnt5a treatment. (n=32–51 cells, one-way ANOVA). Bars represent the mean ± S.E.M. Samples collected from at least two independent experiments. *p<0.05.
-
Figure 5—source data 1
Western blots for APP and Actin after lenti-virus transduction followed by Wnt3a or Wnt5a treatment on DIV7 primary cortical neurons.
- https://cdn.elifesciences.org/articles/69199/elife-69199-fig5-data1-v1.zip
-
Figure 5—source data 2
Western blots for APP-deltaCRD and Actin after lenti-virus transduction followed by Wnt3a or Wnt5a treatment on DIV7 primary cortical neurons.
- https://cdn.elifesciences.org/articles/69199/elife-69199-fig5-data2-v1.zip
Figure 5—figure supplement 1
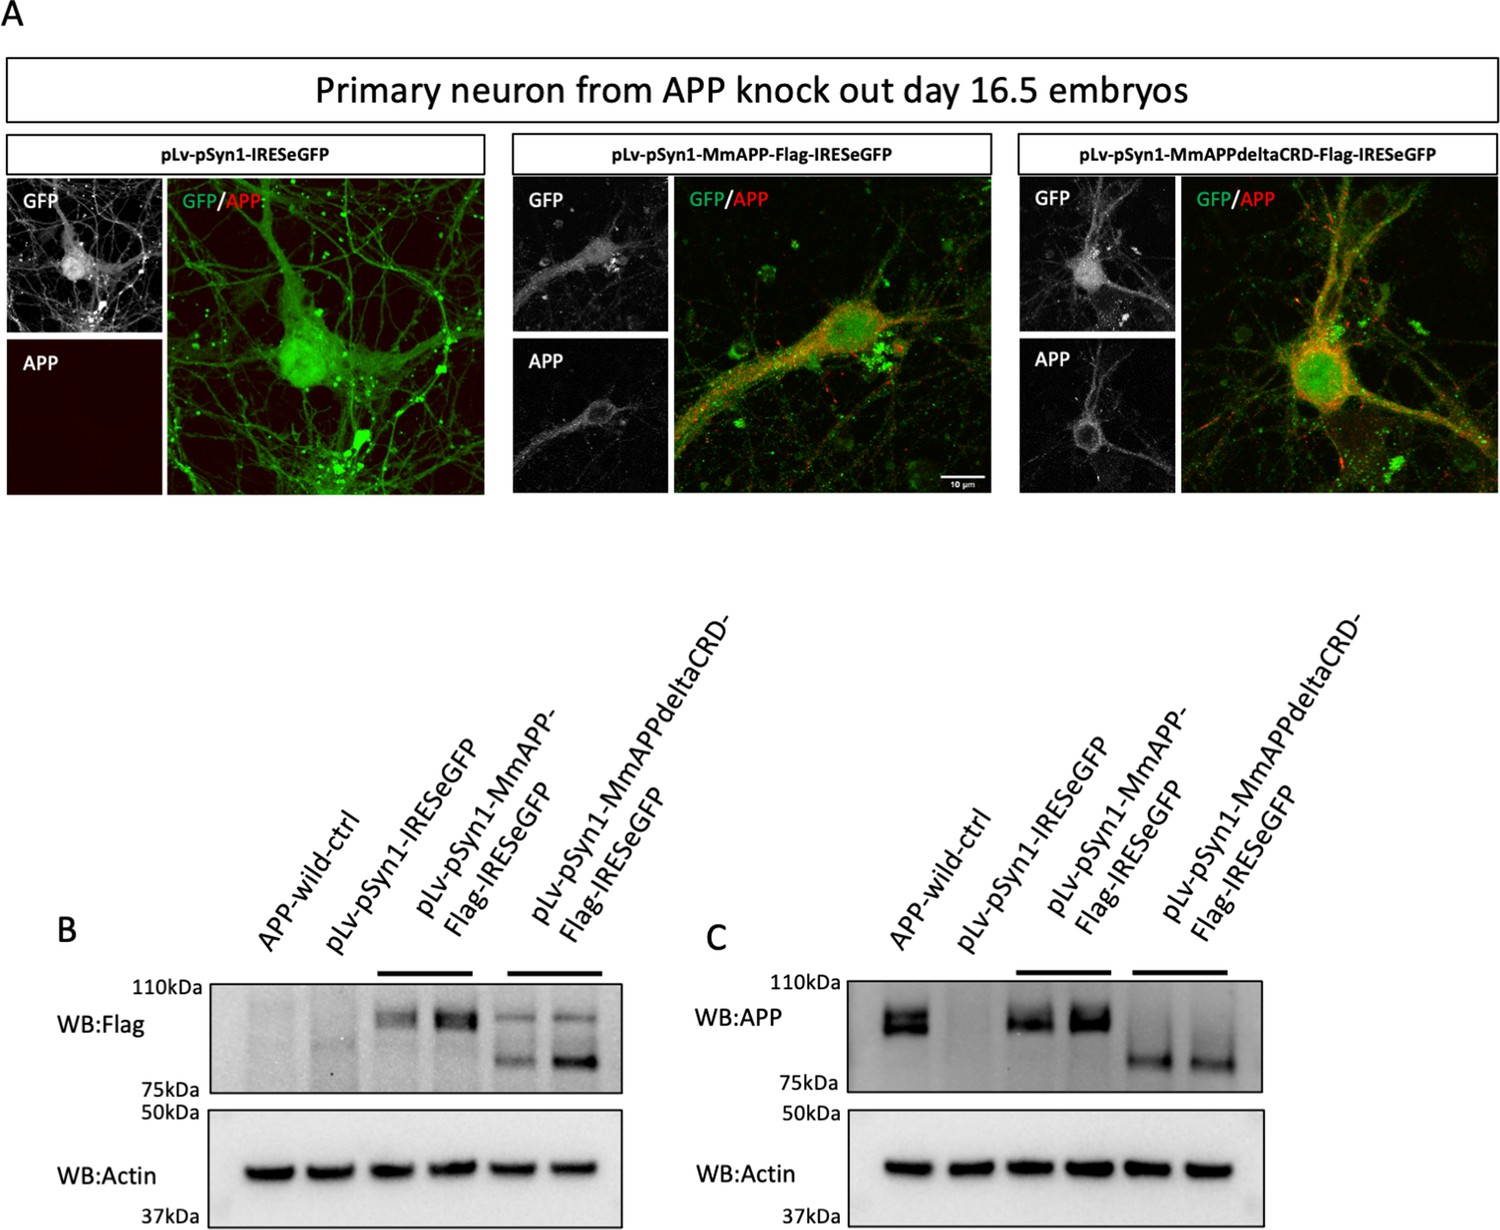
Lenti-virus-induced exogenous mAPP expressed in mAPP knock out primary cortical neuron.
(A) Immunostaining of APP (red) after transfected with pLv-pSyn1-IRESeGFP (left panel, negative control), pLv-pSyn1-mAPP-Flag-IRESeGFP (middle panel), and pLv-pSyn1-mAPPΔCRD-Flag-IRESeGFP (right panel) lenti-virus in APP-KO primary cultured neurons. Scale bar = 10 um. (B and C) Western blots for the detection of exogenous mAPP expression by using anti-flag (B) and anti-APP (C) antibodies.
-
Figure 5—figure supplement 1—source data 1
Western blots for flag and Actin after lenti-virus transduction on DIV7 primary cortical neurons.
- https://cdn.elifesciences.org/articles/69199/elife-69199-fig5-figsupp1-data1-v1.zip
-
Figure 5—figure supplement 1—source data 2
Western blots for APP and Actin after lenti-virus transduction on DIV7 primary cortical neurons.
- https://cdn.elifesciences.org/articles/69199/elife-69199-fig5-figsupp1-data2-v1.zip
Figure 5—figure supplement 2
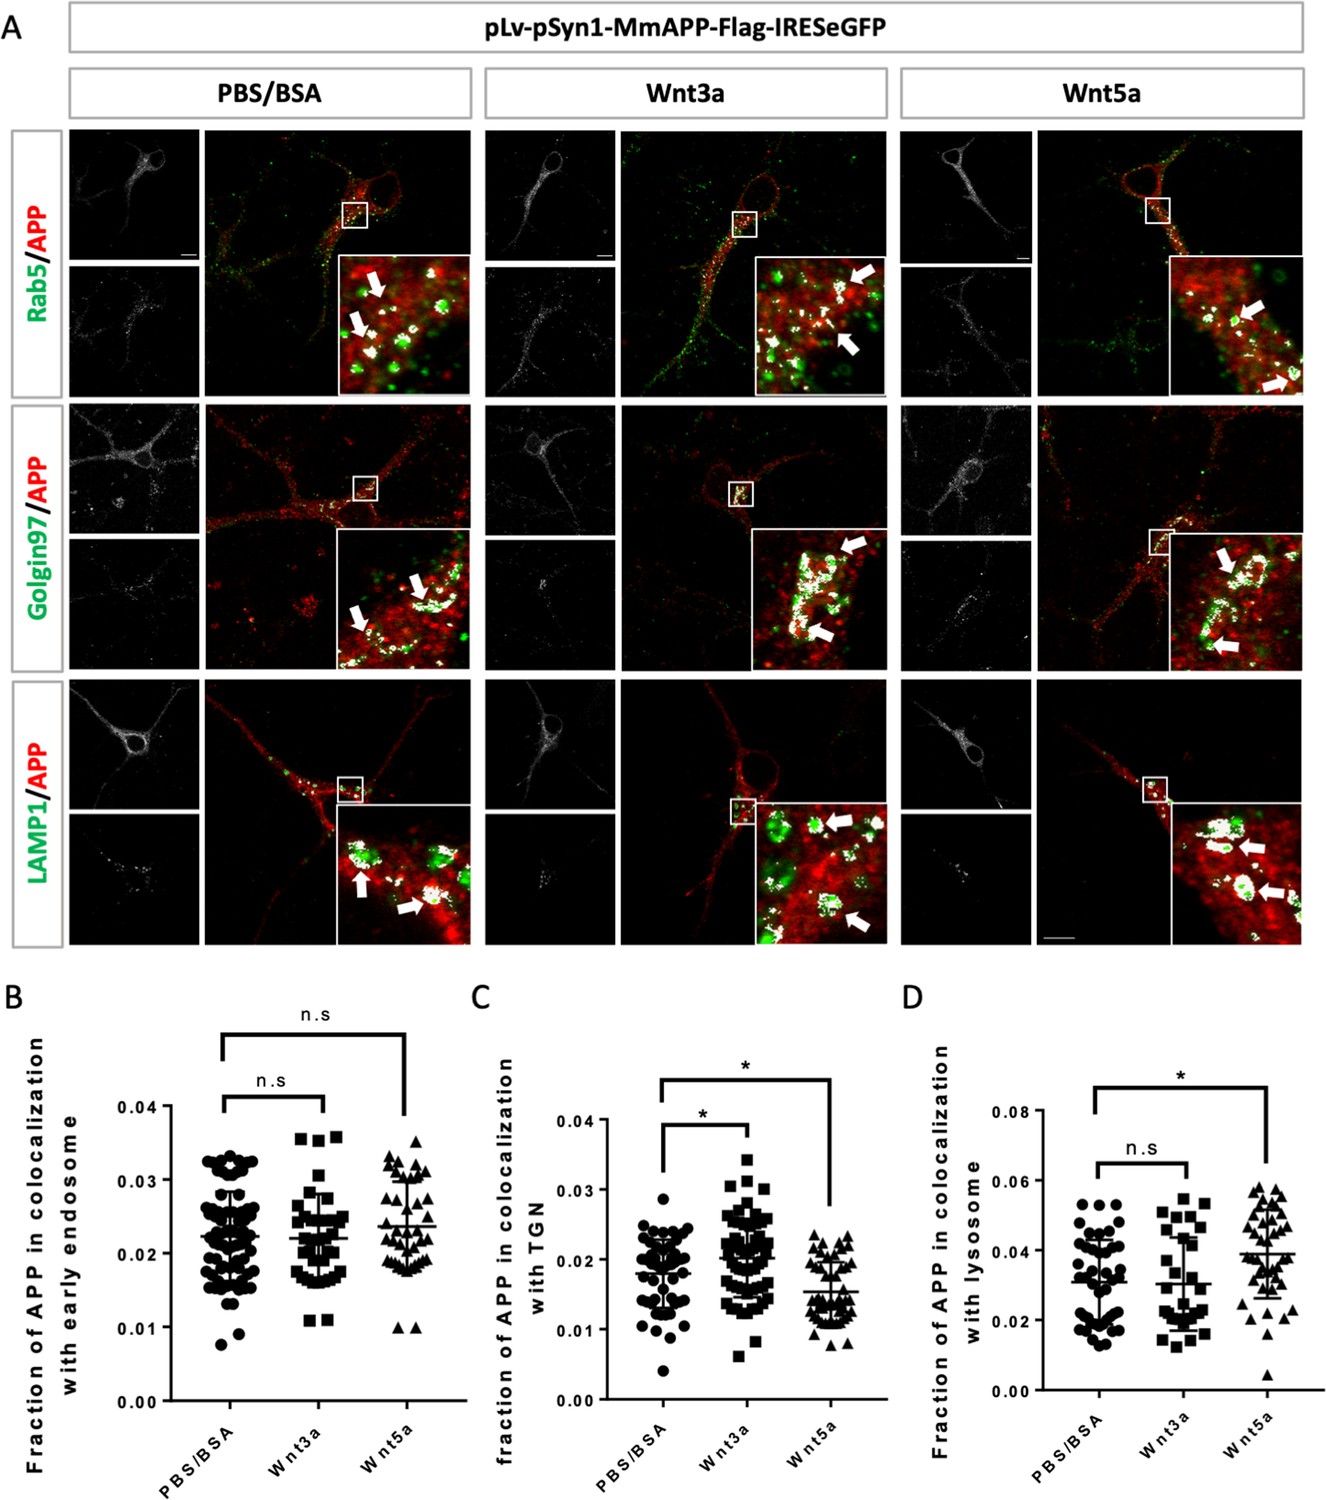
Lenti-virus induced exogenous interact with Wnts in mAPP knock out primary cortical neuron.
(A) Location of exogenous mAPP in APP knock-out primary cultured cortical neurons 4 hr after Wnt3a or Wnt5a treatment on DIV7. Immunofluorescence for APP (red), Rab5 (green), Golgin97 (green), and Lamp1 (green) revealed mAPP localization in different intracellular compartments. The inset showed zoomed in images of the area in the white box and arrows indicated the overlap of mAPP with respective cellular compartment markers. Scale bar = 10 um. (B–D) Quantification of the overlap of mAPP with early endosome (B), TGN (C) or lysosome (D), respectively, after Wnt3a or Wnt5a treatment. Bars represent the mean ± S.E.M., n=37–50 cells, one-way ANOVA. Samples collected from at least two independent experiments. *p<0.05.
Figure 6 with 2 supplements
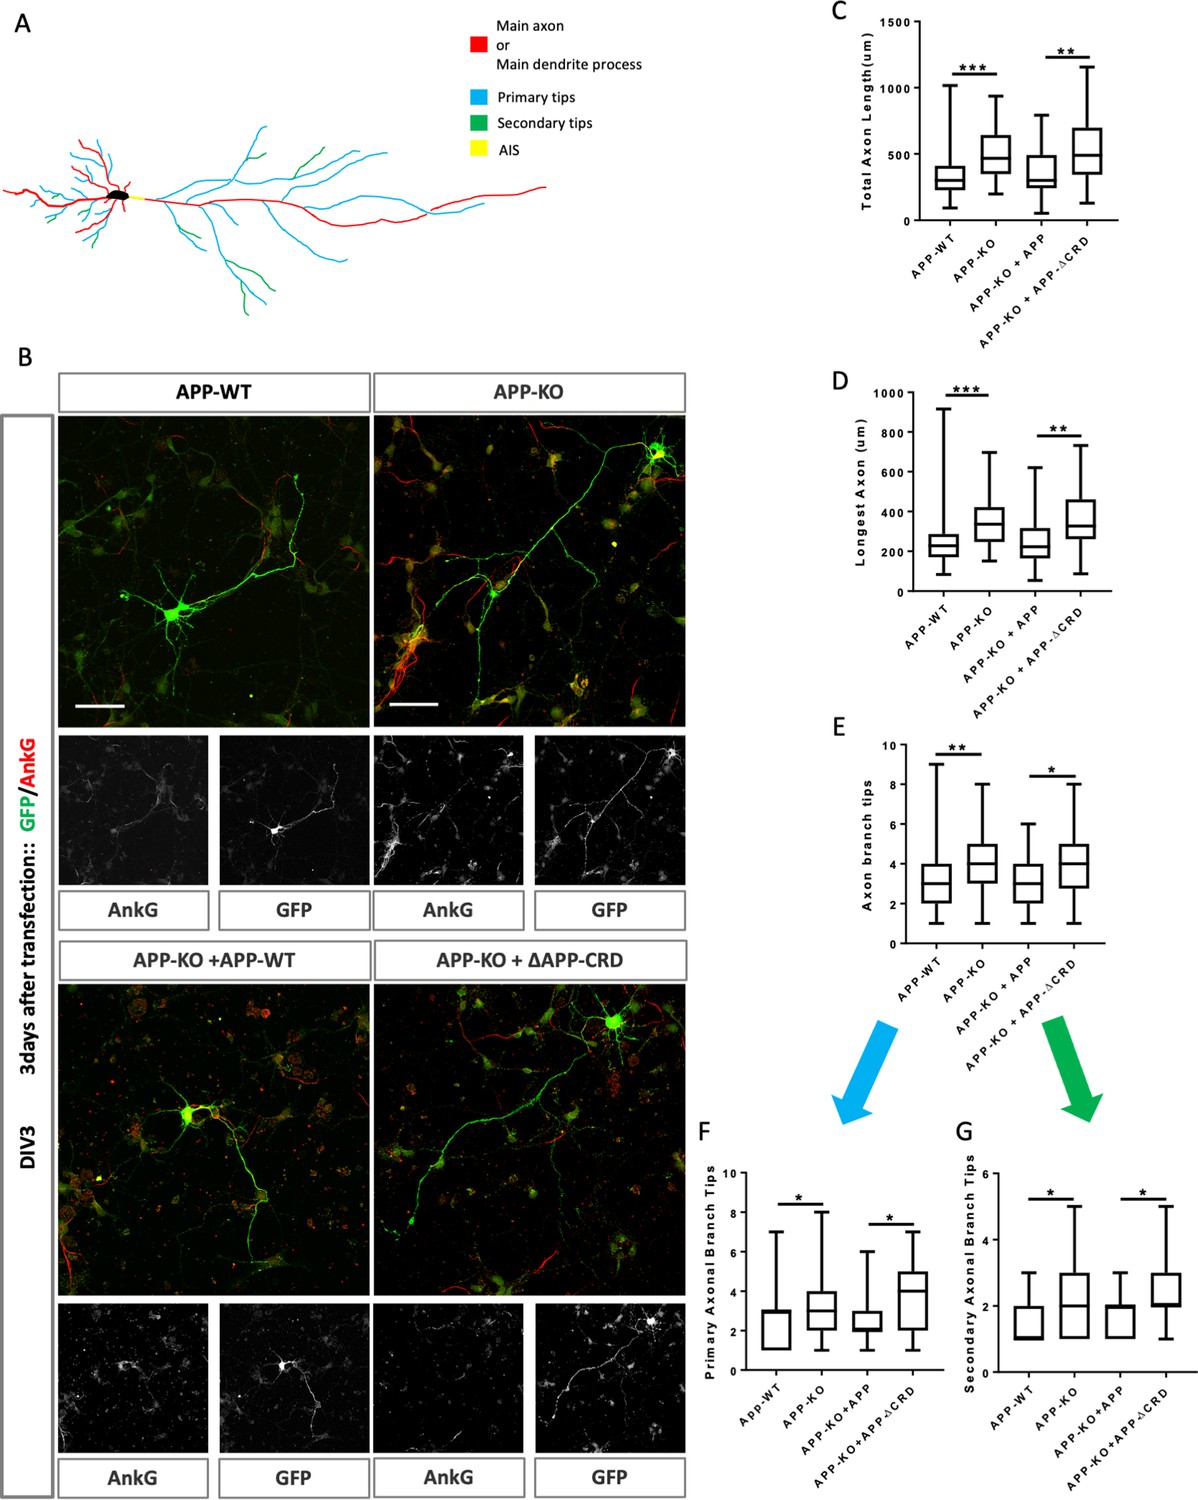
Cysteine-Rich Domain is critical for APP to regulate neurite outgrowth at DIV3.
(A) Schematic of a primary neuron. Colored lines indicate axonal or dendritic branch tips which were quantified. Yellow indicates the Axon Initial Segment (AIS) marked with Ankry G in experiments. (B) Representative confocal images for GFP (green) and AnkG (red) immunostaining at DIV3 on primary cultured cortical neurons of the four genotypes examined: mAPP wild type, mAPP–KO, and mAPP–KO rescued with mAPP or CRD-mutant mAPP. Transfected plasmids containing GFP alone, mAPP-flag-GFP or mAPPΔCRD-flag-GFP, which was performed at the onset of cell seeding. Scale bar = 50 µm. (C–E). Quantification of three parameters on these four genotypes at DIV3: the total axon length (the main axonal process and the branches deriving from the main process, C), the longest axonal length (D), the total axonal branch tips (E), primary branch tips (F) and secondary branch tips (G). (n=59–70 cells, one-way ANOVA). Bars represent the mean ± S.E.M. Samples collected from at least two independent experiments. *p<0.05, **p<0.01 ***p<0.001.
Figure 6—figure supplement 1
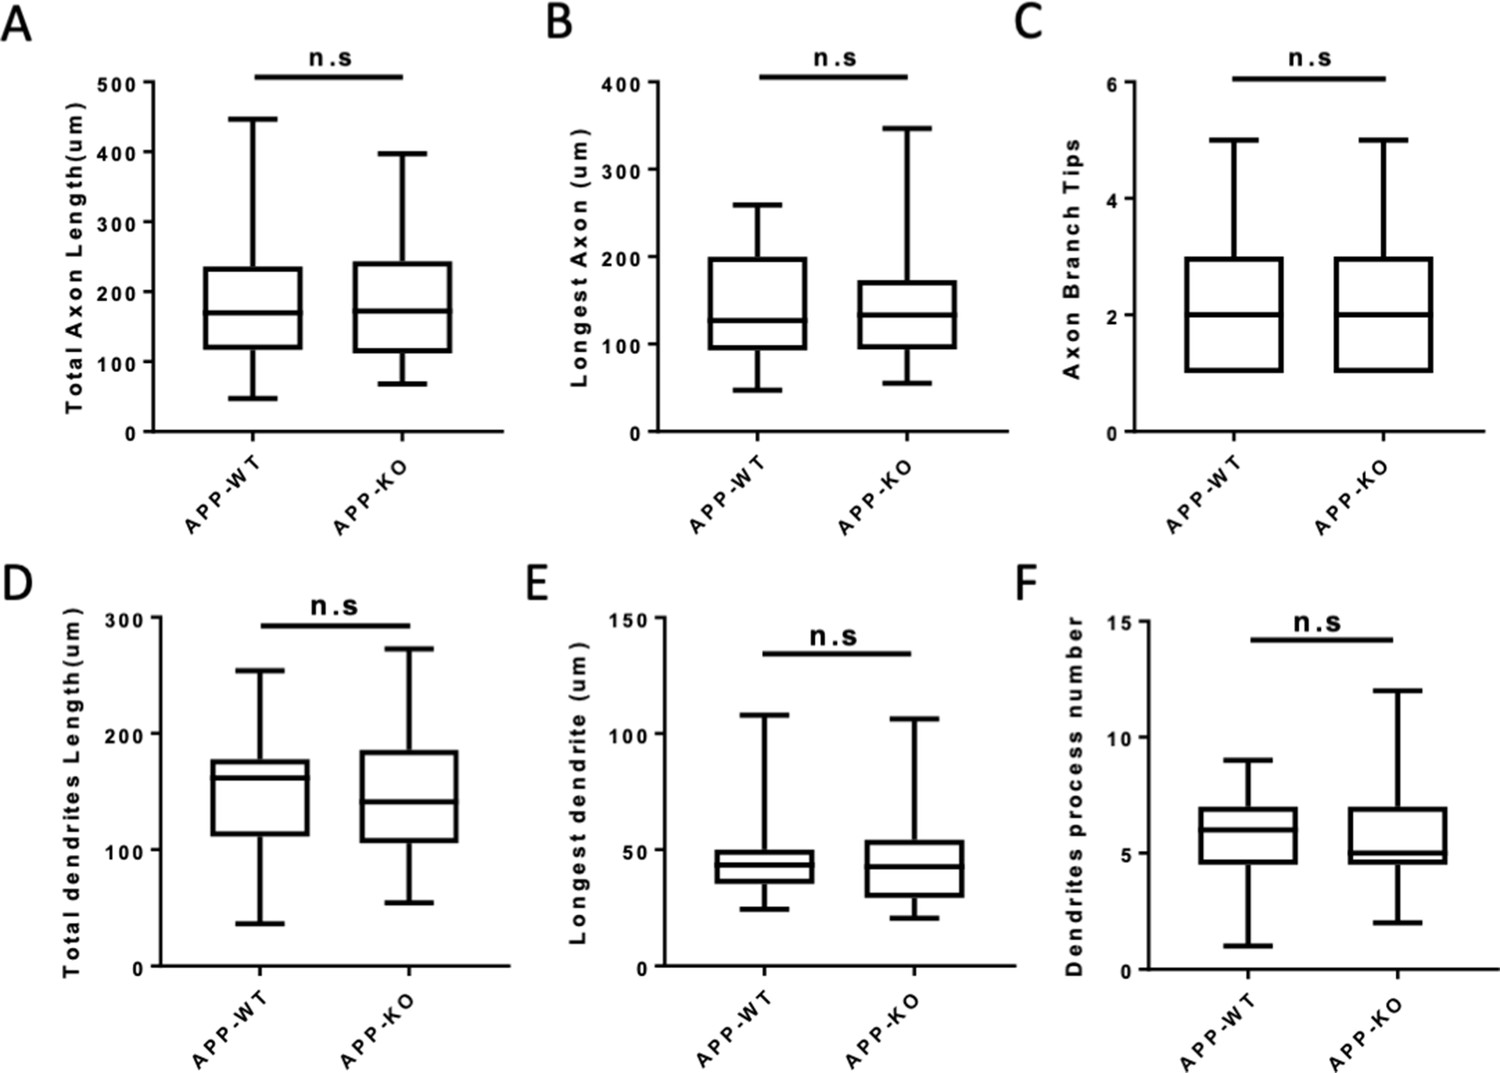
Neurite outgrowth is unaffected in APP knock out neurons at DIV2.
(A–C) Quantification of the total axon length (A), the longest axon length (B) and axon branch tips (C) from DIV2 cultured primary cortical neuron. (D–F) Quantification of the total dendrite length (D), the longest dendrite length (E) and dendrite branch tips (F) from DIV2 cultured primary cortical neuron. Bars represent the mean ± S.E.M., n=30–38 cells, t-test. Samples collected from at least two independent experiments.
Figure 6—figure supplement 2
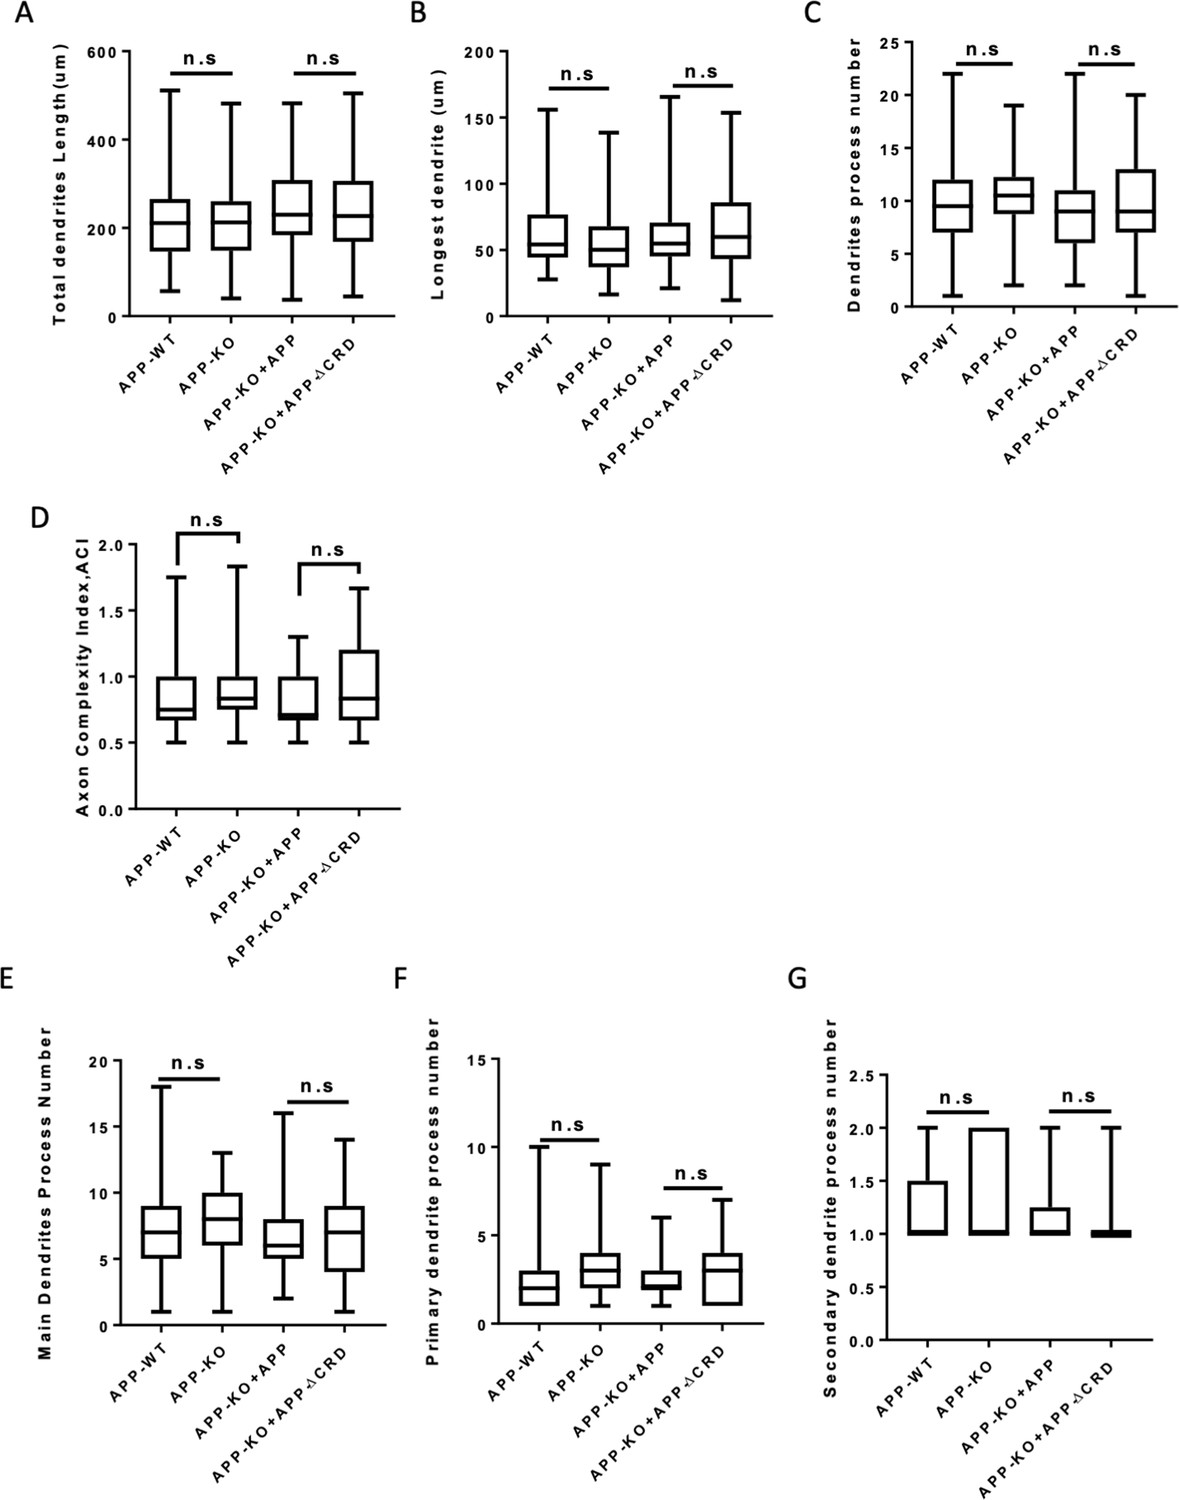
Analysis of dendritic outgrowth and axon complexity index at DIV3.
(A–C) Quantification of the total dendrite length (A), the longest dendrite length (B) and dendrite branch tips (C) from DIV3 cultured primary cortical neurons on APP-WT groups, APP-KO groups, APP-KO rescued with APP groups and APP-KO rescued with APP-ΔCRD groups. (n=51 cells, one-way ANOVA). (D) Axon complexity Index (ACI) analysis of axon at DIV3 on each group (n=59–69 cells, one-way ANOVA). (E–G) Quantification of the main dendrite process (E), the primary (F) and secondary (G) dendrite process numbers on each group (n=51 cells, one-way ANOVA). Bars represent the mean ± S.E.M. Samples collected from at least two independent experiments.
Figure 7 with 1 supplement
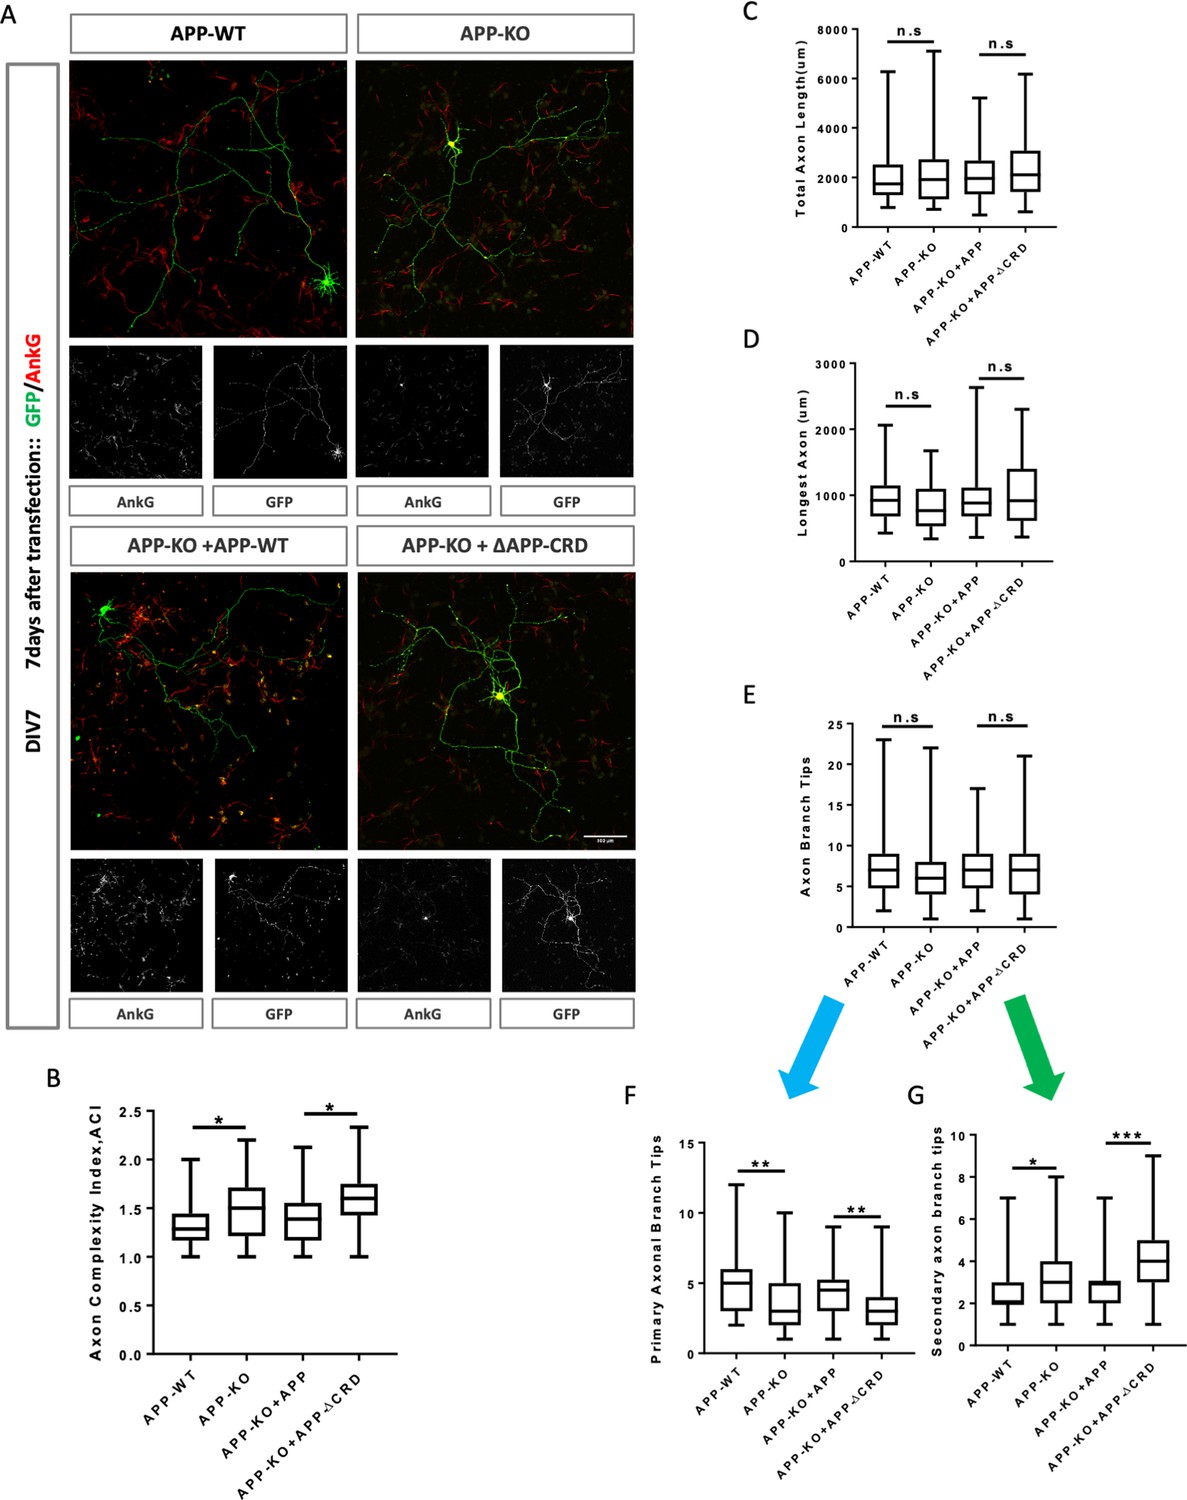
Cysteine-Rich Domain is critical for APP to regulate neurite outgrowth and complexity at DIV7.
(A) Representative confocal images for GFP (green) and AnkG (red) immunostaining at DIV7 on primary cultured cortical neurons of the four genotypes examined: mAPP wild type, mAPP- KO and mAPP-KO rescued with APP or CRD-mutant APP. Transfected plasmids containing GFP alone, mAPP-flag-GFP or mAPPΔCRD-flag-GFP, which was performed at the onset of cell seeding. Scale bar = 100 um. (B–G) Analysis of Axon complexity Index (ACI, B), the total axonal length (C), the longest axonal length (D), all axonal branch tips (E), the primary branch tips (F) and the secondary branch tips (G) at DIV7. (n=54 cells, one-way ANOVA). Bars represent the mean ± S.E.M. Samples collected from at least two independent experiments. *p<0.05, **p<0.01, ***p<0.001.
Figure 7—figure supplement 1
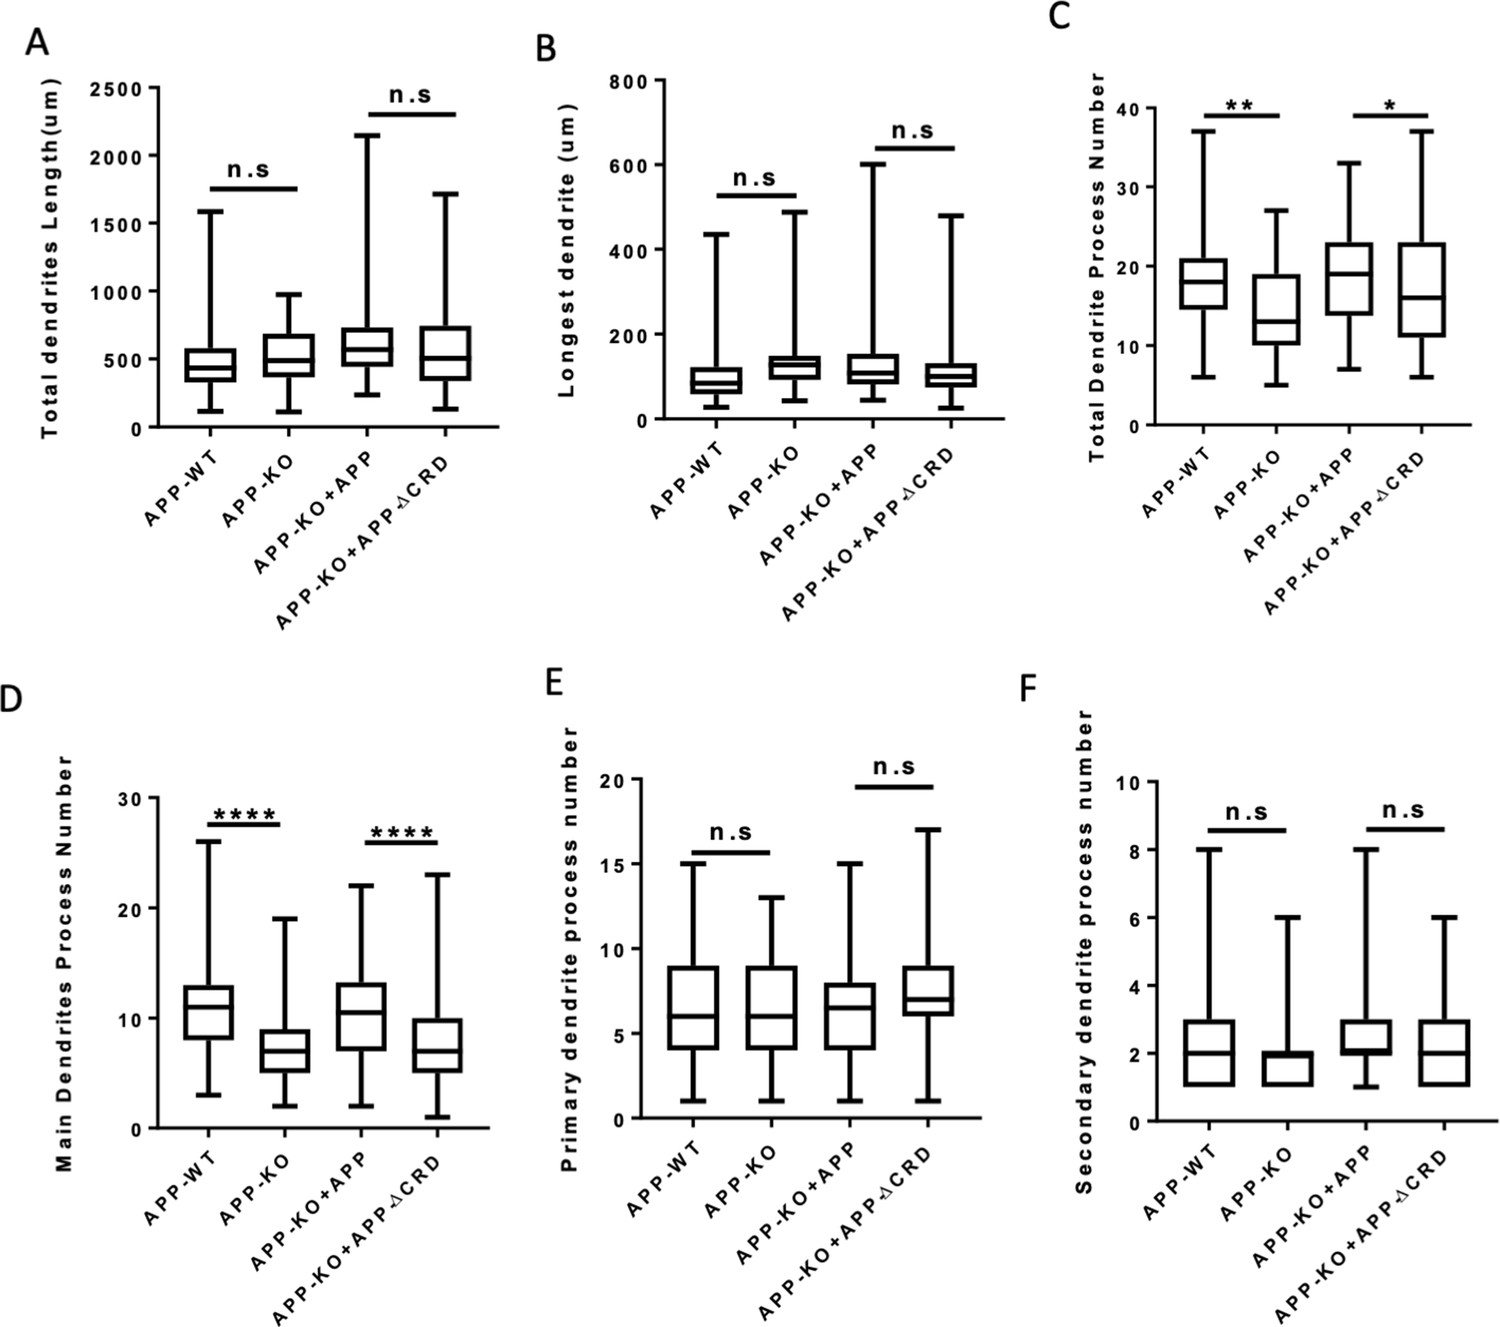
Outgrowth and complexity analysis of neurite at DIV7.
(A–C) Quantification of the total dendrite length (A), the longest dendrite length (B) and dendrite branch tips (C) from DIV7 cultured primary cortical neurons on APP-WT groups, APP-KO groups, APP-KO rescued with APP groups and APP-KO rescued with APP-ΔCRD groups. (n=52 cells, one-way ANOVA). (D–F) Quantification of the main dendrite process (D), the primary (E) and secondary (F) dendrite process numbers from DIV7 cultured primary cortical neurons on each group. (n=52 cells, one-way ANOVA). Bars represent the mean ± S.E.M. Samples collected from at least two independent experiments. *p<0.05, **p<0.01, ****p<0.0001.
Figure 8
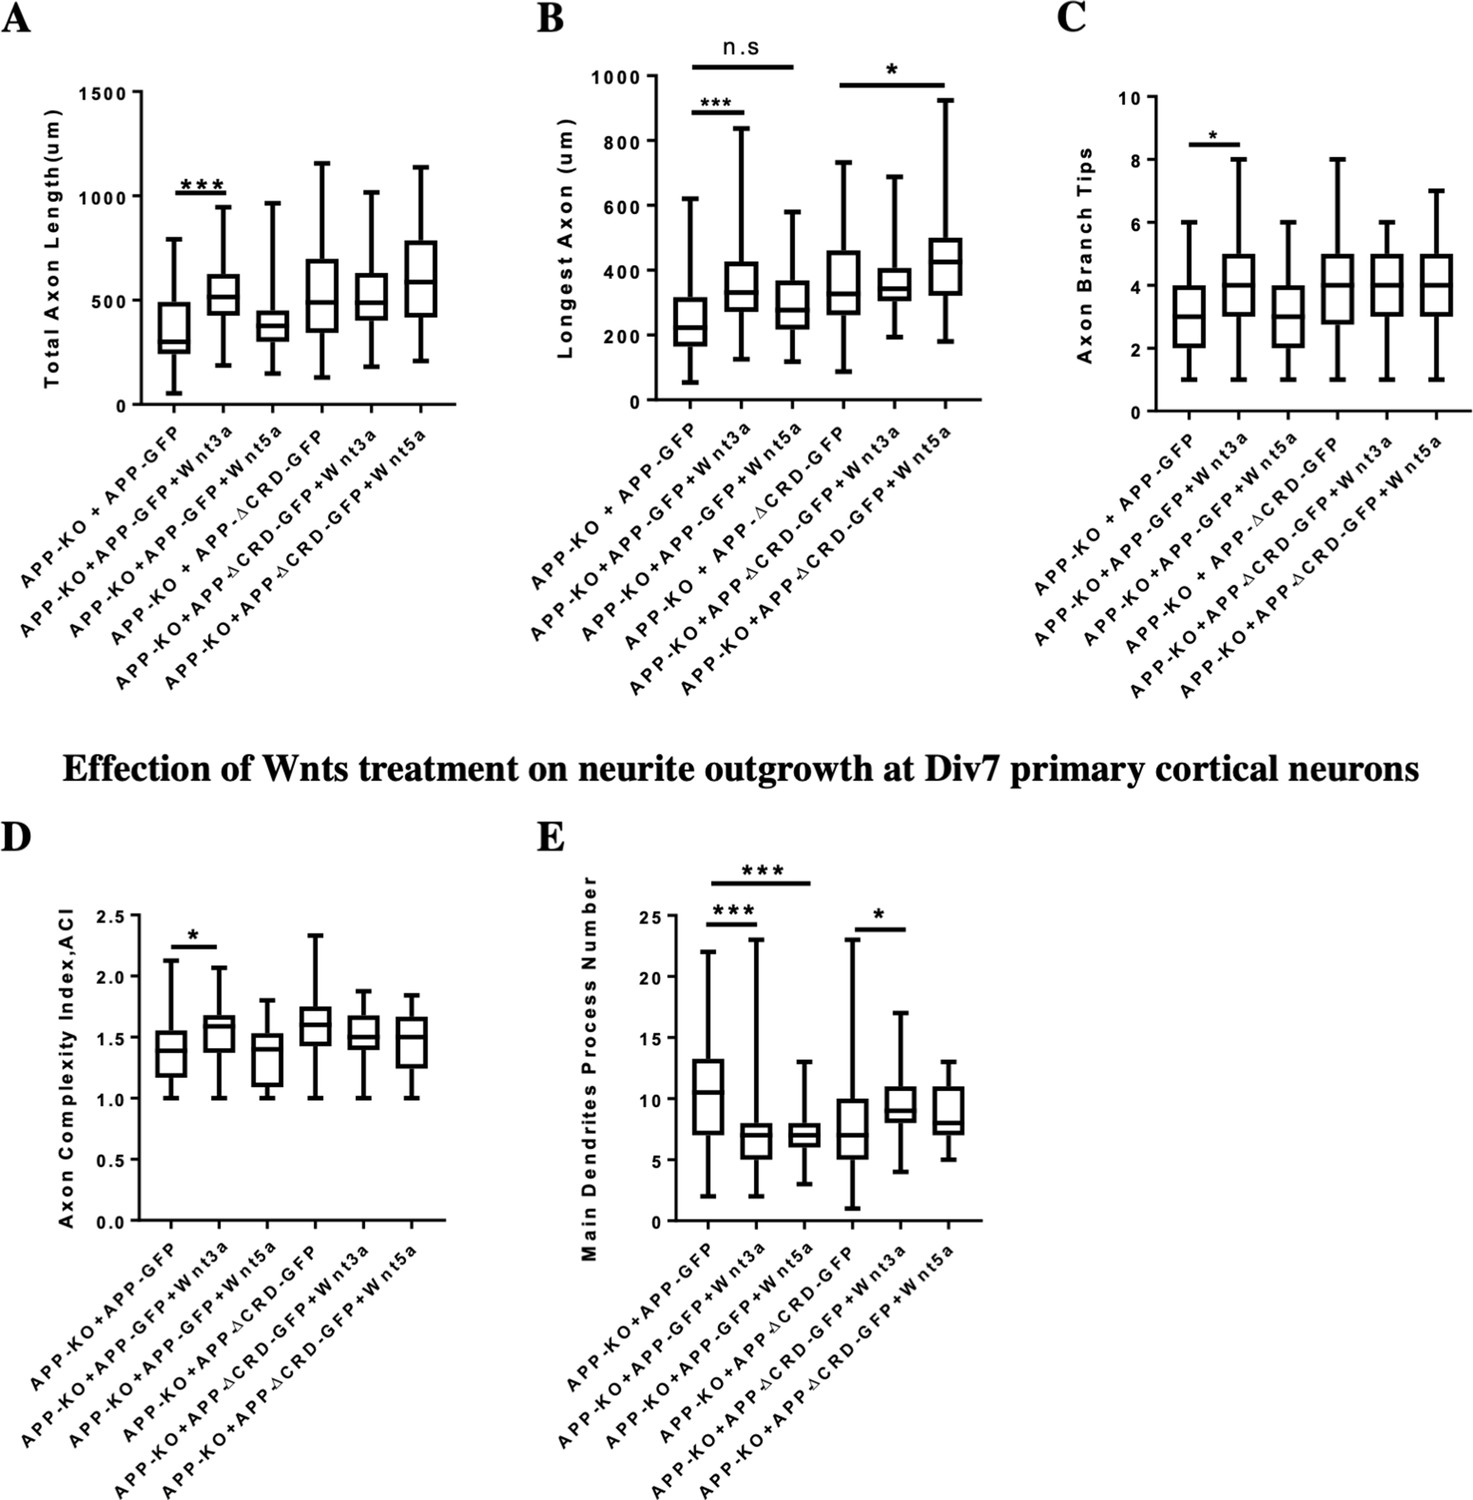
Neurite outgrowth analysis at DIV3 and DIV7 after Wnts treatment.
(A–C) Quantification of total axon length (A), the longest axon length (B), and axon branch tips (C) from DIV3 cultured APP-KO primary cortical neuron after Wnts treatment rescued with APP-WT or APP-ΔCRD, respectively. (n=46–63 cells, one-way ANOVA). (D and E) Analysis of axon complexity (D) and the main dendritic process number (E) from DIV7 cultured APP-KO primary cortical neuron after Wnts treatment rescued with APP-WT or APP-ΔCRD, respectively. (n=47–54 cells, one-way ANOVA). Bars represent the mean ± S.E.M. Samples collected from at least two independent experiments. *P<0.05, ***p<0.001.
Author response image 1
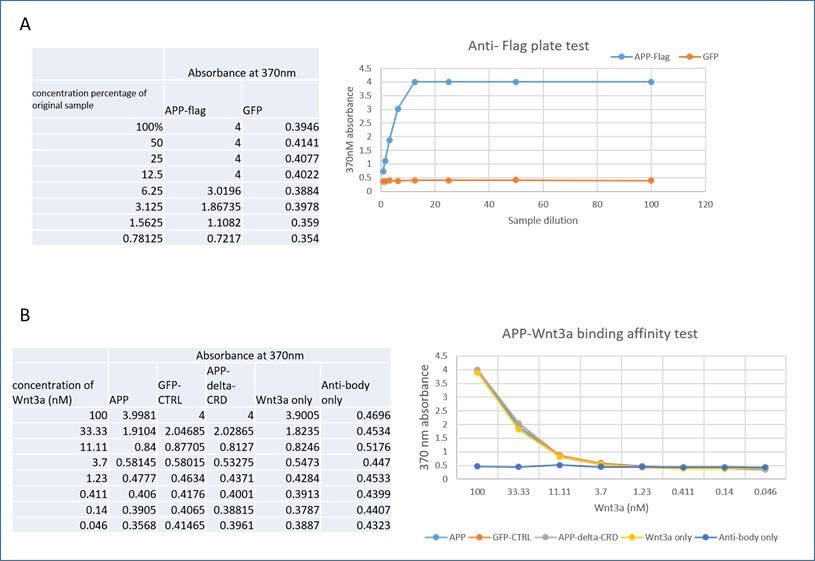
APP-Wnt binding affinity test by solid-phase.
Author response image 2
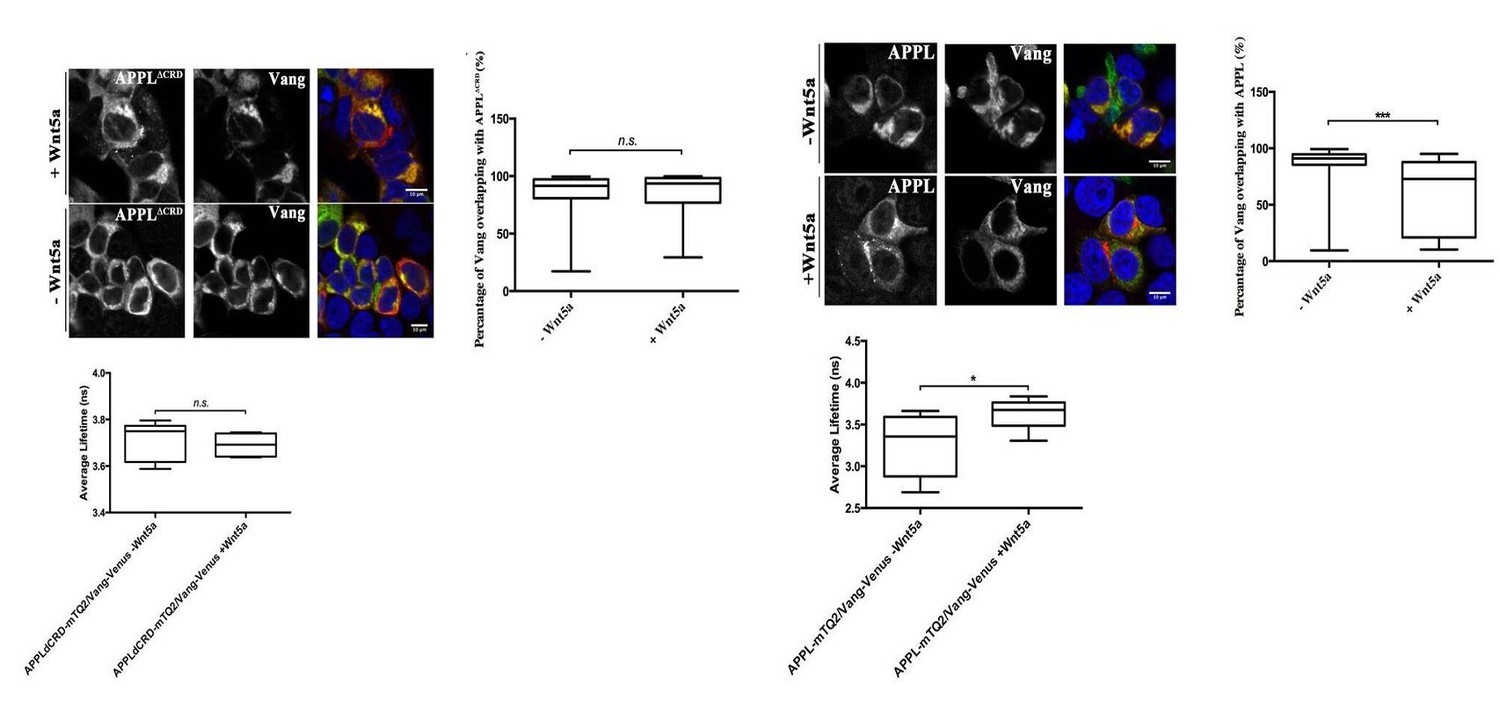
Wnt5a regulates APPL-Vang co-localization.
Author response image 3
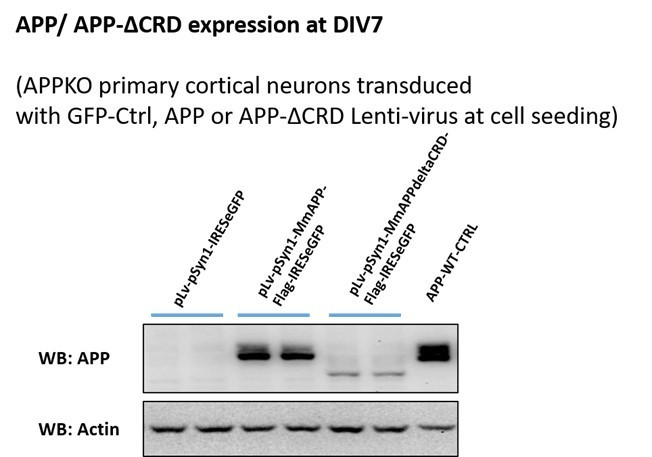
APP and APP-ΔCRD protein expression after virus transduction at DIV7.
Tables
Key resources table
| Reagent type (species) or resource | Designation | Source or reference | Identifiers | Additional information |
|---|---|---|---|---|
| Antibody | Mouse monoclonal anti-FasII (1D4) | Developmental Studies Hybridoma Bank (DSHB) | AB_528235 RRID:AB_528235 | IF (1:50) |
| Antibody | Rabbit polyclonal anti-Wnt5a | Cell Signaling | Cat# 2392 RRID:AB_2304419 | WB (1:1000) |
| Antibody | Rabbit polyclonal anti-GFP | Invitrogen | Cat# A-11122, RRID:AB_221569 | IF (1:500) |
| Antibody | Rabbit polyclonal anti-APP | Synaptic Systems | Cat# 127 003 RRID:AB_2056967 | IF (1:100) WB (1:1000) |
| Antibody | Mouse monoclonal anti-rab5 | Synaptic Systems | Cat# 108 011 RRID:AB_887773 | IF (1:100) WB (1:1000) |
| Antibody | Mouse monoclonal anti-rab11a | Santa Cruz | Cat# sc-166523, RRID:AB_2173466 | IF (1:20) |
| Antibody | Mouse monoclonal anti- Golgin-97 | Invitrogen | Cat# A-21270, RRID:AB_221447 | IF (1:100) WB (1:1000) |
| Antibody | Rat monoclonal anti-Lamp1 | Santa Cruz | Cat# sc-19992, RRID:AB_2134495 | IF (1:20) WB (1:200) |
| Antibody | Chicken polyclonal anti-GFP | Abcam | Cat# ab13970, RRID:AB_300798 | IF (1:200) |
| Antibody | Guinea pig Polyclonal antiserum anti-Ankyrin G | Synaptic Systems | Cat# 386004 RRID:AB_2725774 | IF (1:100) |
| Antibody | Rabbit Polyclonal Anti-V5 | Millipore | Cat# AB3792 RRID:AB_91591 | IP (1:20) WB (1:1000) |
| Antibody | Rat Monoclonal Anti-DYKDDDDK Epitope Tag | Novus | Cat# NBP1-06712 RRID:AB_1625981 | IP (1:20) WB (1:1000) |
| Antibody | Mouse Monoclonal Anti-c-Myc | Sigma-Aldrich | Cat# M4439 RRID:AB_439694 | IP (1:20) WB (1:1000) |
| Antibody | Goat anti-Chicken IgY (H+L), Alexa Fluor488 | Invitrogen | Cat# A-11039, RRID:AB_142924 | IF (1:500) |
| Antibody | Goat anti-Rabbit IgG (H+L), Alexa Fluor488 | Invitrogen | Cat# A-11008, RRID:AB_143165 | IF (1:500) |
| Antibody | Goat anti-Rat IgG (H+L), Alexa Fluor488 | Invitrogen | Cat# A-11006, RRID:AB_141373 | IF (1:500) |
| Antibody | Goat anti- Mouse IgG (H+L), Alexa Fluor488 | Invitrogen | Cat# A-11029, RRID:AB_138404 | IF (1:500) |
| Antibody | Goat anti-Rabbit IgG (H+L), Alexa Fluor555 | Invitrogen | Cat# A-11034, RRID:AB_2576217 | IF (1:500) |
| Antibody | Goat anti-Guinea Pig IgG (H+L), Alexa Fluor555 | Invitrogen | Cat# A-21435, RRID:AB_2535856 | IF (1:500) |
| Antibody | Peroxidase AffiniPure Donkey Anti-Mouse IgG (H+L) | Jackson ImmunoResearch Labs | Cat# 715-035-150, RRID:AB_2340770 | WB (1:4000) |
| Antibody | Peroxidase AffiniPure Donkey Anti-Rabbit IgG (H+L) | Jackson ImmunoResearch Labs | Cat# 711-035-152, RRID:AB_10015282 | WB (1:4000) |
| Antibody | Peroxidase AffiniPure Donkey Anti-Rat IgG (H+L) | Jackson ImmunoResearch Labs | Cat# 712-035-153, RRID:AB_2340639 | WB (1:4000) |
| Chemical compound, drug | Triton X-100 | Sigma | Cat#X100 | In PBS 0.1% |
| Chemical compound, drug | Trizol Reagent | Invitrogen | Cat#15596026 | |
| Chemical compound, drug | L15 medium | Gibco | 11415064 | Medium for embryo brain isolation on ice |
| Chemical compound, drug | Mounting Medium | Vector Laboratories | Cat#H-1000 | |
| Chemical compound, drug | 0.05% trypsin/EDTA | Gibco | 25300–054 | |
| Chemical compound, drug | SVF | Invitrogen | 10270106 | |
| Chemical compound, drug | DNAse | Serlabo | LS002138 | |
| Chemical compound, drug | Neurobasal medium | Gibco | 21103049 | |
| Chemical compound, drug | B27 supplement | Gibco | 17504–044 | |
| Chemical compound, drug | L-glutamax | Gibco | 35050–061 | |
| Chemical compound, drug | Wnt3a | R and D Systems | 645-WN-010 | |
| Chemical compound, drug | Wnt5a | R and D Systems | 1324-WNP-010 | |
| Chemical compound, drug | Bafilomycin A1 | invitrogen | 88899-55-2 | |
| Chemical compound, drug | LY294002 | Sigma | L9908 | |
| Chemical compound, drug | Lipofectamine 3000 | Thermofisher | Cat#L3000008 | |
| Chemical compound, drug | DMEM | Gibco | Cat#10566016 | |
| Chemical compound, drug | Penicillin-Streptomycin | Gibco | Cat#15140122 | |
| Biological sample (M. musculus) | APP-KO mouse | A gift from Bart De Strooper’s lab | N/A | |
| Cell line (Homo-sapiens) | Hek293 | A gift from Marie-Claude Potier’s lab | N/A | |
| Sequence-based reagent | mAPP_F | This paper Ordered from IDT | PCR primers | CATCCAGAACTGGTGCAAGCG |
| Sequence-based reagent | mAPP_R | This paper Ordered from IDT | PCR primers | GACGGTGTGCCAGTGAAGATG |
| Sequence-based reagent | β-actin _F | This paper Ordered from IDT er | PCR primers | TCCATCATGAAGTGTGACGT |
| Sequence-based reagent | β-actin _R | This paper Ordered from IDT r | PCR primers | GAGCAATGATCTTGATCTTCAT |
| Transfected construct (M. musculus) | pLv-pSyn1-mAPP-Flag-IRESeGFP | ICM-institute, Virus facility | N/A | Lentiviral construct to transfect and express the mAPP |
| Transfected construct (M. musculus) | pLv-pSyn1-mAPPΔCRD-Flag-IRESeGFP | ICM-institute, Virus facility | N/A | Lentiviral construct to transfect and express the mAPP-ΔCRD |
| Transfected construct (M. musculus) | pLv-pSyn1- eGFP | ICM-institute, Virus facility | N/A | Lentiviral construct to transfect and express the GFP |
| Transfected construct (M. musculus) | pCDNA3-mApp-FLAG-IRES-eGFP | This paper | N/A | transfected construct |
| Transfected construct (M. musculus) | pCDNA3-mAPPΔCRD-FLAG-IRES-eGFP | This paper | N/A | transfected construct |
| Transfected construct (M. musculus) | pCDNA3-Wnt5a-myc | This paper | N/A | transfected construct |
| Transfected construct (M. musculus) | pCDNA-Wnt3A-V5 | This paper | N/A | transfected construct |
| Transfected construct (human) | pCDNA3-hApp-FLAG-IRES-eGFP | This paper | N/A | transfected construct |
| Transfected construct (human) | pCDNA3-hAPPΔCRD-FLAG-IRES-eGFP | This paper | N/A | transfected construct |
| Commercial assay or kit | QuantiTect Reverse Transcription Kit | Qiagen | Cat# 205311 | |
| Commercial assay or kit | LightCycler480 SYBR Green I Master | Roche | Cat# 04707516001 | |
| Commercial assay or kit | 4–12% polyacrylamide gels (SDS-PAGE) | ThermoFisher | NW04122BOX | |
| Commercial assay or kit | Protein G sepharose beads | ThermoFisher | Ref.10612D Lot.00644644 | |
| Other | Nikon | A1-R | ||
| Other | Olympus | FV-1200 | ||
| Other | DAPI | Sigma | Cat# D9564 | 1 ug/ml |
| Software, algorithm | GraphPad Prism software | GraphPad Prism (https://graphpad.com) | RRID:SCR_015807 | |
| Software, algorithm | ImageJ software | ImageJ (http://imagej.nih.gov/ij/) | RRID:SCR_003070 |
Additional files
-
Supplementary file 1
Genetic interaction between Wnt5 and Vang.
The table lists the penetrance of the phenotype and the number of brains analyzed in the Vang-Wnt5 genetic interaction experiment.
- https://cdn.elifesciences.org/articles/69199/elife-69199-supp1-v1.xlsx
-
Transparent reporting form
- https://cdn.elifesciences.org/articles/69199/elife-69199-transrepform-v1.docx
Download links
A two-part list of links to download the article, or parts of the article, in various formats.
Downloads (link to download the article as PDF)
Open citations (links to open the citations from this article in various online reference manager services)
Cite this article (links to download the citations from this article in formats compatible with various reference manager tools)
The amyloid precursor protein is a conserved Wnt receptor
eLife 10:e69199.
https://doi.org/10.7554/eLife.69199


