GFPT2/GFAT2 and AMDHD2 act in tandem to control the hexosamine pathway
- Max Planck Institute for Biology of Ageing, Germany
- Institute of Biochemistry, University of Cologne, Germany
- JLP Health GmbH, Austria and Acus Laboratories GmbH, Germany
- Department II of Internal Medicine, University of Cologne, Faculty of Medicine and University Hospital Cologne, Germany
- Center for Molecular Medicine Cologne (CMMC) Faculty of Medicine and University Hospital Cologne, University of Cologne, Germany
- CECAD - Cluster of Excellence Faculty of Medicine and University Hospital Cologne, University of Cologne, Germany
- IMBA - Institute of Molecular Biotechnology of the Austrian Academy of Science Vienna Biocenter, Austria
- Altos Labs, United Kingdom
Figures
Figure 1 with 1 supplement
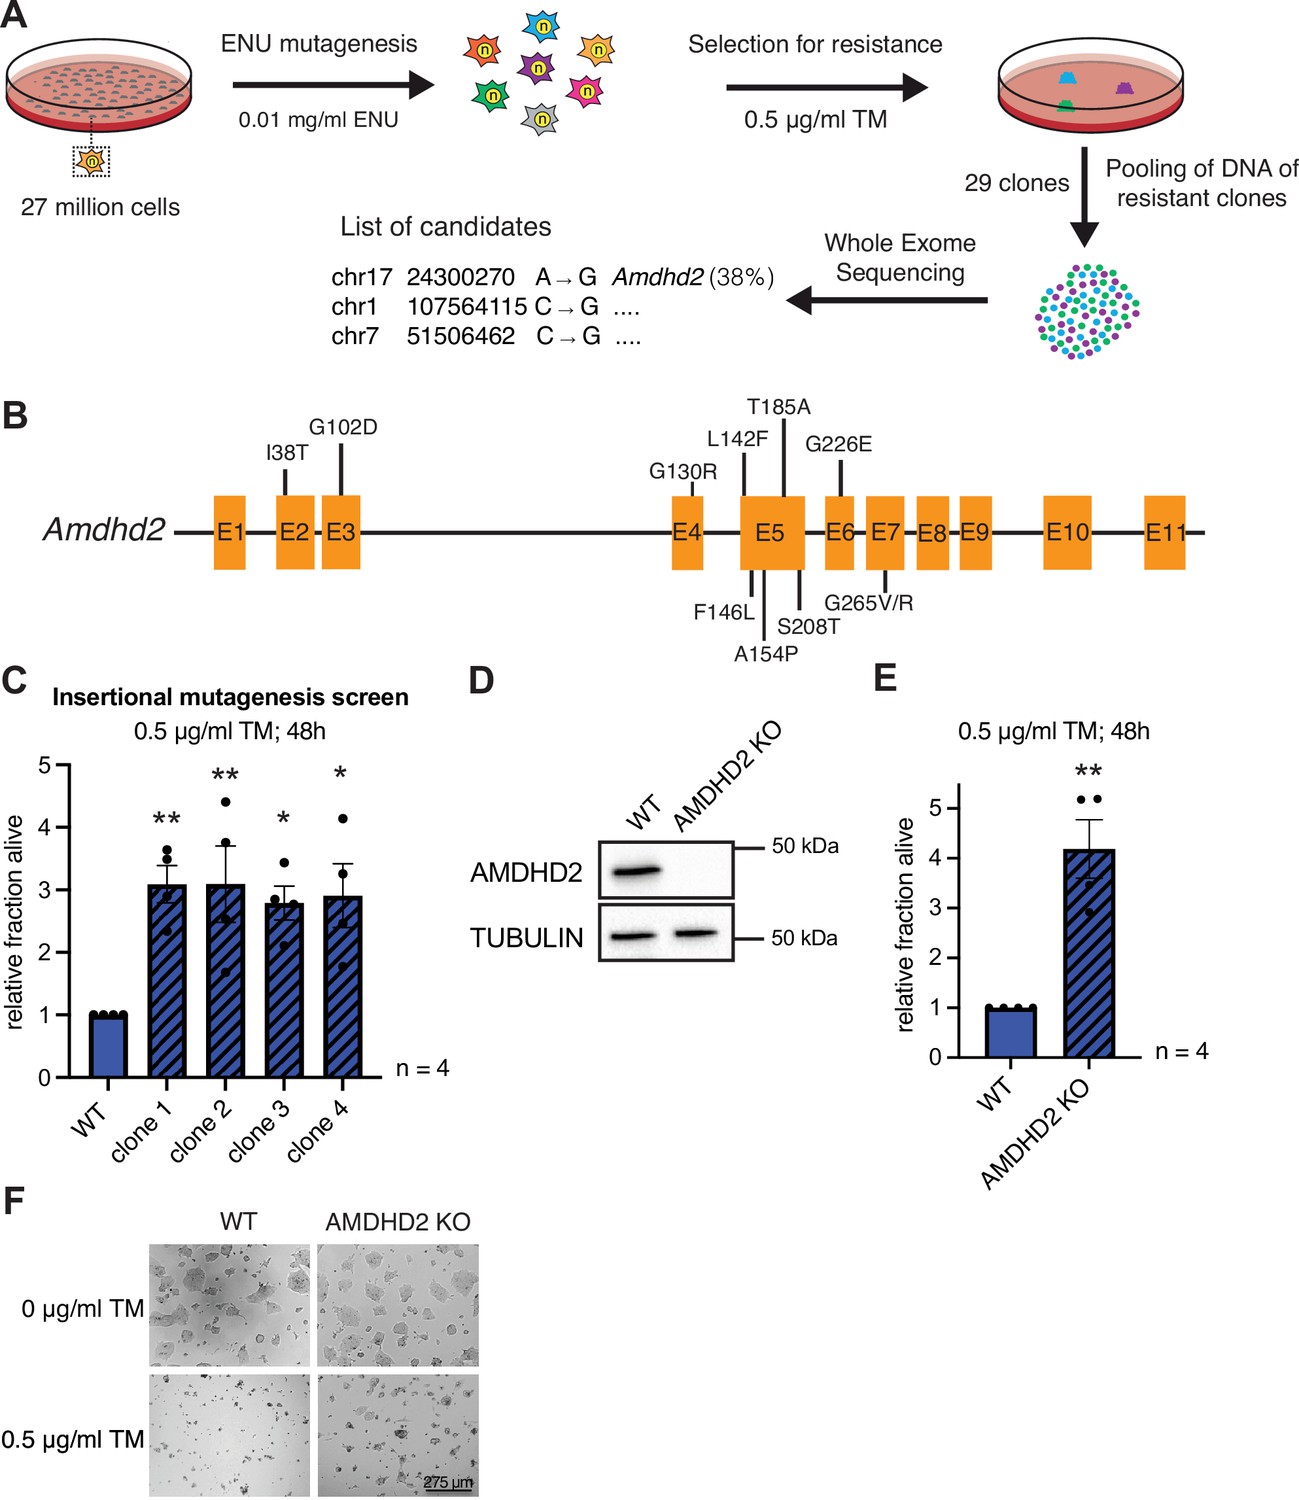
Chemical mutagenesis screen for tunicamycin (TM) resistance in haploid mESCs identifies AMDHD2.
(A) Schematic representation of experimental workflow for TM resistance screen using ENU mutagenesis in combination with whole-exome sequencing. (B) Schematic representation of the mouse Amdhd2 locus. Amino acid substitutions identified in the screen are highlighted. (C) Cell viability (XTT assay) of four TM resistant clones (clones 1–4) identified via insertional mutagenesis compared to control wild-type (WT) AN3-12 mESCs. Cells were treated with 0.5 µg/ml TM for 48 hr (mean ± SEM, n=4, *p<0.05, **p<0.01, one-way ANOVA Dunnett’s posttest). (D) Western blot analysis of CRISPR/Cas9 generated AMDHD2 KO AN3-12 mESCs compared to WT cells. (E) Cell viability (XTT assay) of WT and AMDHD2 KO AN3-12 cells treated with 0.5 µg/ml TM for 48 hr (mean ± SEM, n=4, **p<0.01, unpaired t-test). (F) Representative images of WT and AMDHD2 KO AN3-12 cells treated with 0.5 µg/ml TM for 48 hr or respective control. Scale bar, 275 µm. mESC, mouse embryonic stem cell.
-
Figure 1—source data 1
Raw data.
- https://cdn.elifesciences.org/articles/69223/elife-69223-fig1-data1-v3.zip
Figure 1—figure supplement 1
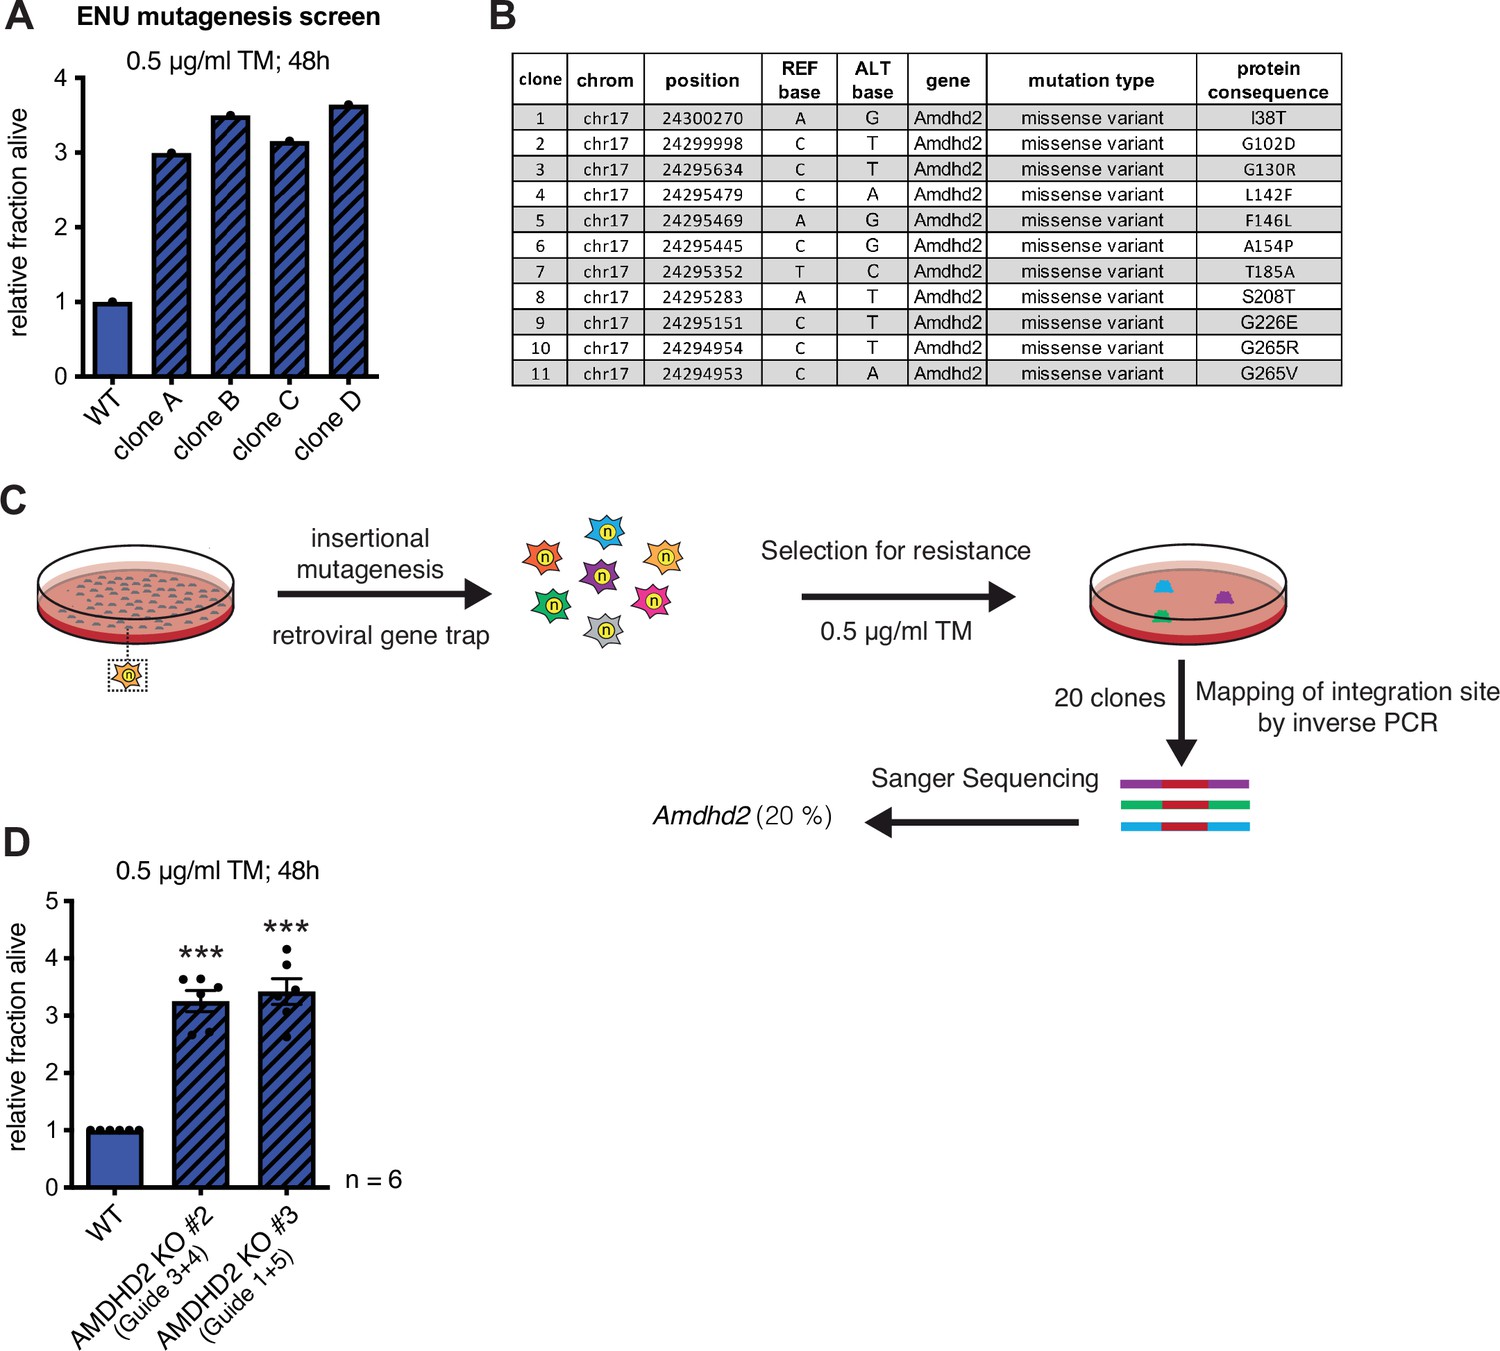
Chemical mutagenesis screen for tunicamycin (TM) resistance in haploid mESCs identifies AMDHD2.
Identification and confirmation of AMDHD2 as the causative gene for mediating TM resistance by elevated UDP-GlcNAc levels. (A) Representative cell viability (XTT assay) of WT AN3-12 mESCs and four TM resistant clones (clones A–D) identified by the chemical (ENU) mutagenesis and that were used for whole-exome sequencing. Cells were treated with 0.5 µg/ml TM for 48 hr. (B) Table listing all mutations in the Amdhd2 locus identified in the TM resistance screen. (C) Schematic representation of experimental workflow for TM resistance screen using retroviral-based gene-trap insertional mutagenesis. (D) Cell viability (XTT assay) of WT and two additional AMDHD2 KO AN3-12 cell lines (#2–3), generated with distinct guide combinations. Cells were treated with 0.5 µg/ml TM for 48 hr (mean ± SEM, n=6, ***p<0.001, one-way ANOVA Dunnett’s posttest). mESC, mouse embryonic stem cell; WT, wild-type.
-
Figure 1—figure supplement 1—source data 1
Raw data.
- https://cdn.elifesciences.org/articles/69223/elife-69223-fig1-figsupp1-data1-v3.zip
Figure 2 with 3 supplements

Disruption of Amdhd2 mediates tunicamycin (TM) resistance via elevated HBP flux.
(A) Schematic overview of the hexosamine pathway (blue box). The intermediate Frc6P from glycolysis is converted to UDP-GlcNAc, which is a precursor for glycosylation reactions. The enzymes are glutamine fructose-6-phosphate amidotransferase (GFPT1/2), glucosamine-6-phosphate N-acetyltransferase (GNA1), phosphoglucomutase (PGM3), UDP-N-acetylglucosamine pyrophosphorylase (UAP1), glucosamine-6-phosphate deaminase (GNPDA1/2), N-acetylglucosamine deacetylase (AMDHD2), UDP-GlcNAc:dolichylphosphate GlcNAc-1-phosphotransferase (GPT), and UDP-galactose-4′-epimerase (GALE). Red line indicates negative feedback inhibition of GFPT by UDP-GlcNAc. UDP-HexNAc is a precursor for various glycosylation reactions including N-glycosylation, O-glycosylation, and O-GlcNAcylation or the synthesis of proteoglycans and other glycoconjugates. N-glycosylation is inhibited by TM. (B) ICMS analysis of UDP-HexNAc levels of four TM resistant clones (clones 1–4) generated in insertional mutagenesis screen compared to control WT and AMDHD2 KO AN3-12 mESCs (mean ± SEM, n=5, **p<0.01, ***p<0.001, one-way ANOVA Dunnett’s posttest). (C) IC-MS analysis of UDP-GlcNAc levels in WT and AMDHD2 KO AN3-12 cells expressing WT FLAGHA-hAMDHD2 (hAMDHD2) and mutant FLAG-HA-hAMDHD2 D294A (hAMDHD2 D294A) (mean ± SEM, n=7, *p<0.05, **p<0.01, ns=not significant, one-way ANOVA Tukey posttest). (D) Cell viability (XTT assay) of WT and AMDHD2 KO AN3-12 mESCs expressing WT FLAG-HA-hAMDHD2 (hAMDHD2) and mutant FLAG-HA-hAMDHD2 D294 (hAMDHD2 D294A). Cells were treated with 0.5 µg/ml TM for 48 hr (mean ± SEM, n=6, **p<0.01, ns=not significant, one-way ANOVA Tukey posttest). (E) Genotyping results for the AMDHD2 deletion in dissected (E7–8) embryos and weaned mice. HBP, hexosamine biosynthetic pathway; mESC, mouse embryonic stem cell; WT, wild-type.
-
Figure 2—source data 1
Raw data.
- https://cdn.elifesciences.org/articles/69223/elife-69223-fig2-data1-v3.zip
Figure 2—figure supplement 1
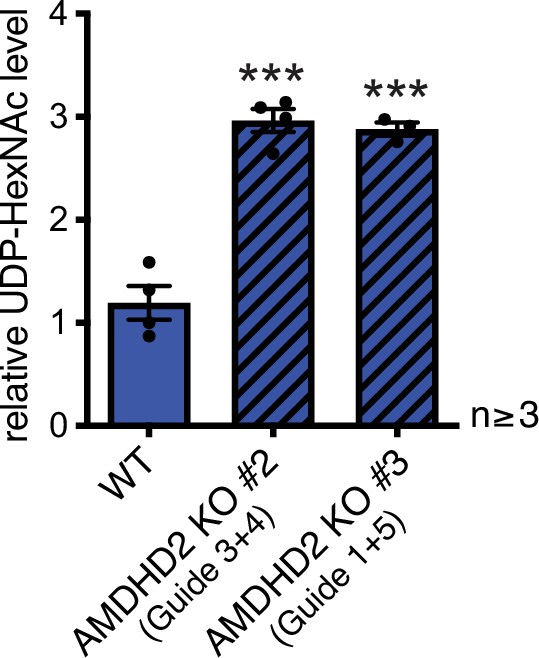
Disruption of Amdhd2 mediates tunicamycin resistance via elevated HBP flux.
AMDHD2 disruption in AN3-12 mESCs increases HBP flux. UDP-HexNAc concentration of the two additional AMDHD2 KO cell lines (#2–3), generated with distinct guide combinations compared to WT AN3-12 mESCs (mean ± SEM, n≥3, ***p<0.001, one-way ANOVA). UDP-HexNAc is the combined pool of the UDP-GlcNAc and UDP-GalNAc epimer pools. HBP, hexosamine biosynthetic pathway; mESC, mouse embryonic stem cell; WT, wild-type.
-
Figure 2—figure supplement 1—source data 1
Raw data.
- https://cdn.elifesciences.org/articles/69223/elife-69223-fig2-figsupp1-data1-v3.zip
Figure 2—figure supplement 2

Generation of different AN3-12 mESC lines stably overexpressing WT FLAG-HA-hAMDHD2 and mutant FLAG-HA-hAMDHD2 D294A protein.
(A) Western blot analysis of AMDHD2 expression in WT and AMDHD2 KO AN3-12 cells expressing WT FLAG-HA-hAMDHD2 (hAMDHD2) and mutant FLAG-HA-hAMDHD2 D294A (hAMDHD2 D294A). The asterisk (*) indicates the band for the recombinant WT FLAG-HA-hAMDHD2 and mutant FLAG-HA-hAMDHD2 D294A protein. The lower band deemed to be a mixture of endogenous mAMDHD2 and recombinant hAMDHD2/hAMDHD2 D294A protein upon cleavage of the N-terminal FLAG-HA-tag. (B) Western blot analysis of FLAG expression in WT and AMDHD2 KO AN3-12 cells expressing WT FLAGHA-hAMDHD2 (hAMDHD2) and mutant FLAG-HA-hAMDHD2 D294A (hAMDHD2 D294A). mESC, mouse embryonic stem cell; WT, wild-type.
-
Figure 2—figure supplement 2—source data 1
Raw data.
- https://cdn.elifesciences.org/articles/69223/elife-69223-fig2-figsupp2-data1-v3.zip
Figure 2—figure supplement 3
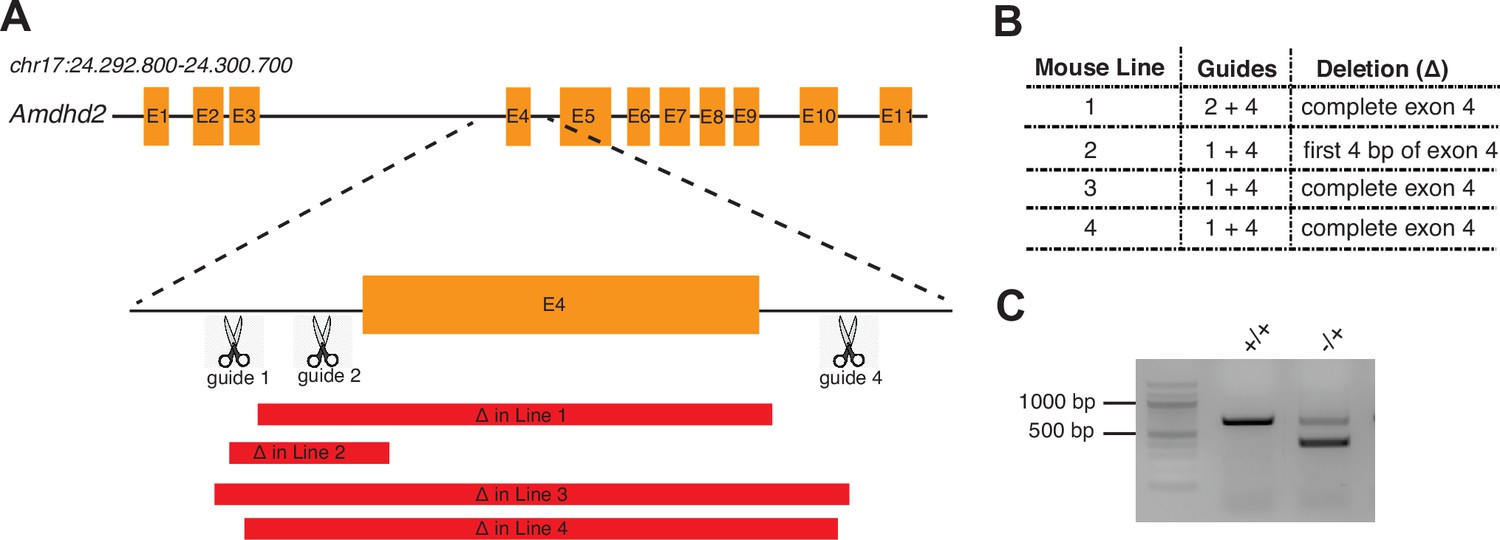
Generation of AMDHD2 KO founder mice.
(A) Schematic representation of the CRISPR/Cas9-targeted exon of the mouse Amdhd2 locus. Deletions in founder lines 1–4 are indicated in red. (B) Table listing used guide combinations and deletion details of the AMDHD2 KO founder lines. (C) Representative genotyping results of heterozygous AMDHD2 KO mice. The WT PCR product is 675 bp and the Amdhd2 KO allele shows a size of 300 bp (mouse line 1). WT, wild-type.
Figure 3 with 9 supplements
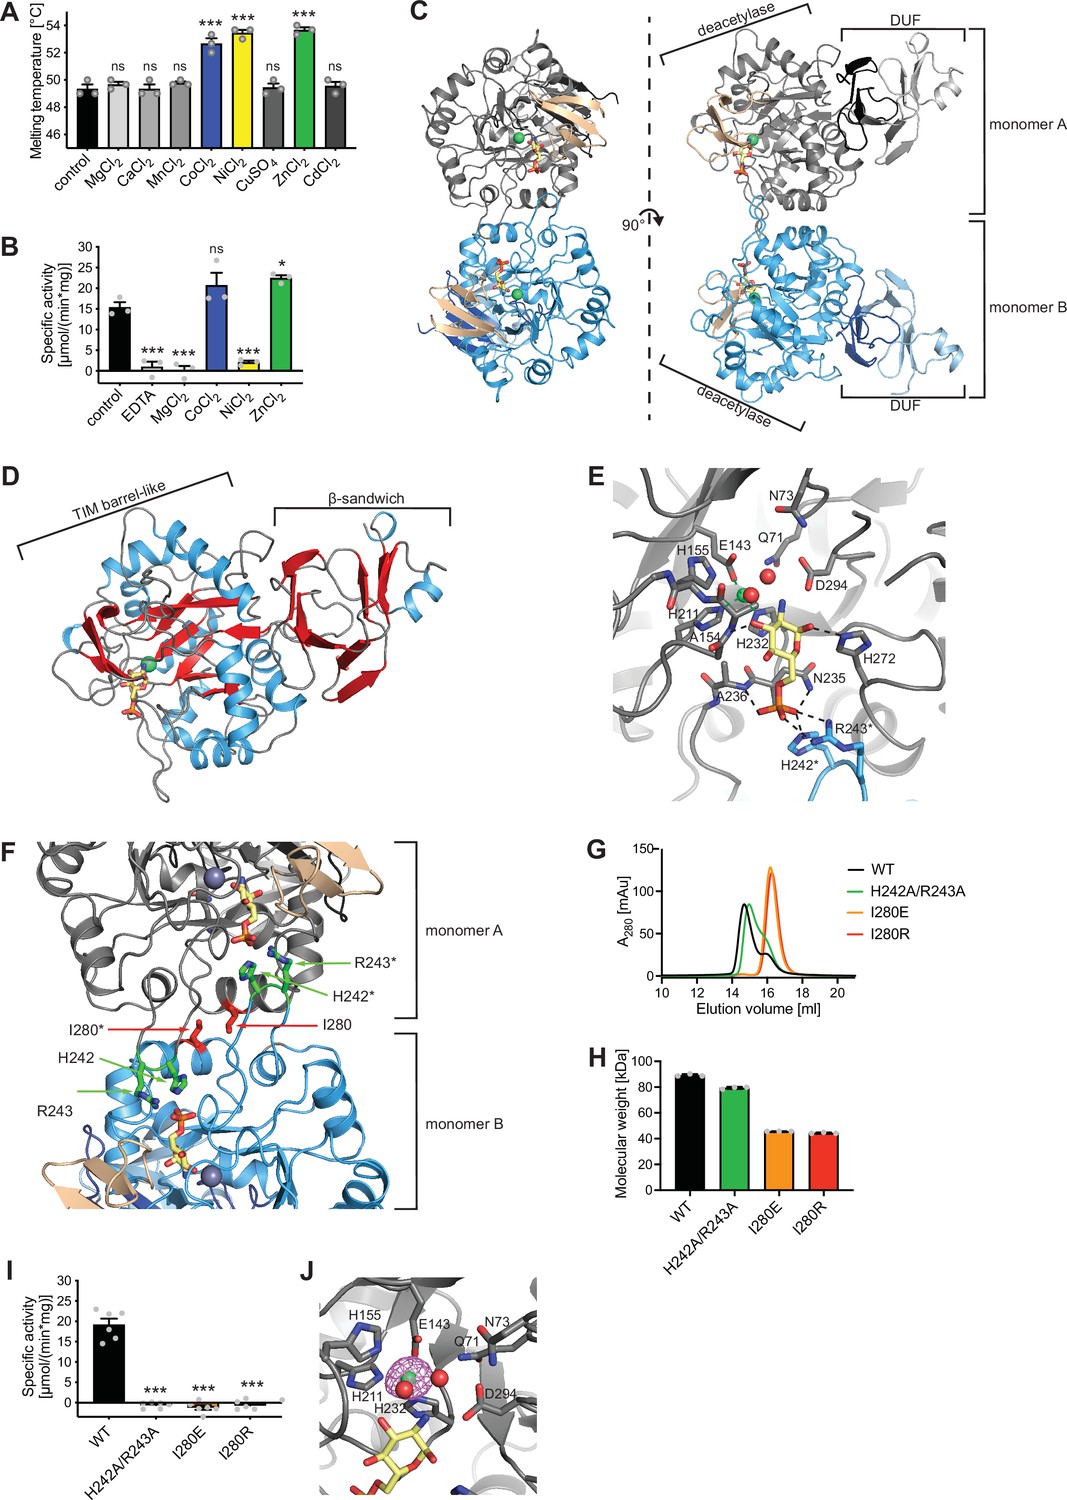
Structural and biochemical characterization of human AMDHD2.
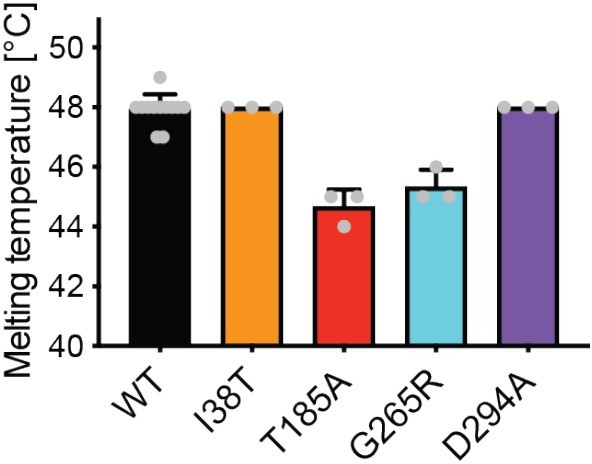
(A) Influence of divalent addition (10 µM) on the stability of AMDHD2 in size-exclusion chromatography (SEC) buffer in thermal shift assays (mean + SEM, n=3, ns=not significant, ***p<0.0001 versus wild-type (WT), one-way ANOVA). (B) Deacetylase activity of AMDHD2 in the presence of EDTA and several indicated divalents (mean + SEM, n=3, ns=not significant, *p<0.05, ***p<0.0001 versus WT, one-way ANOVA). (C) Overview of the human AMDHD2 dimer in cartoon representation. Monomer A is colored in gray and monomer B in blue. The two deacetylase domains are interacting with each other. The DUF domain is formed by residues of the N-terminus (light gray and light blue) and residues of the C-terminus (black and dark blue). GlcN6P (yellow sticks), Zn2+ (green sphere), and the putative active site lid (wheat) are highlighted. (D) Domains and secondary structure elements within one AMDHD2 monomer. The deacetylase domain (left) shows a TIM barrel-like fold, while the small DUF domain (right) is composed of a β-sandwich fold. α-helices are colored in blue, β-strands in red, and loops in gray. GlcN6P (yellow sticks) and Zn2+ (green sphere) are highlighted. (E) Close-up view of the active site in cartoon representation. Residues involved in ligand binding or catalysis are highlighted as sticks, as well as GlcN6P (yellow sticks), Zn2+ (green sphere), and two water molecules (red spheres). The GlcN6P binding site is formed by two deacetylase domains. Black dashed lines indicate key interactions to GlcN6P and green dashed lines the coordination of Zn2+. (F) Close-up view of the dimer interface in cartoon representation. His242, Arg243, and Ile280, which were mutated for further characterization of the dimer, are highlighted as sticks. (G) Representative chromatogram of an analytical SEC of human AMDHD2 variants using a Superdex 200 Increase 10/300 GL column. Absorption at 280 nm (mAU: milli absorbance units) was plotted against the elution volume. (H) Molecular weight of human AMDHD2 based on analytical SEC measurements (mean + SD, n=3.) (I) Deacetylase activity of wild-type (WT) and mutant human AMDHD2 (mean + SEM, n=6, ***p<0.0001 versus WT, one-way ANOVA). (J) Anomalous map of Zn2+ with a contour level of 5.0 RMSD (violet).Figure 3—source data 1
-
Figure 3—source data 1
Raw data.
- https://cdn.elifesciences.org/articles/69223/elife-69223-fig3-data1-v3.zip
Figure 3—figure supplement 1
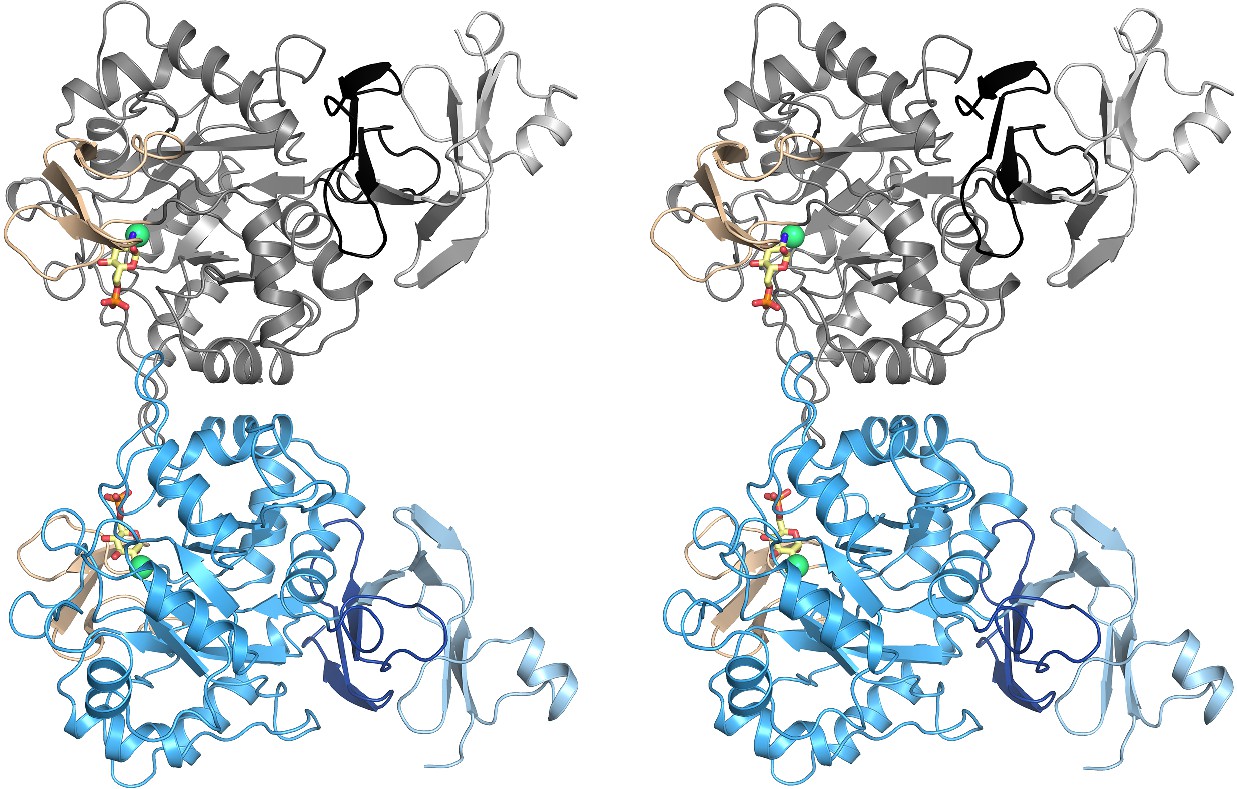
Structural and biochemical characterization of human AMDHD2.
Stereo image of the human AMDHD2 dimer in cartoon representation. Monomer A is colored in gray and monomer B in blue. The two deacetylase domains are interacting with each other. The DUF domain is formed by residues of the N-terminus (light gray and light blue) and residues of the C-terminus (black and dark blue). GlcN6P (yellow sticks), Zn2+ (green sphere), and the putative active site lid (wheat) are highlighted.
Figure 3—figure supplement 2
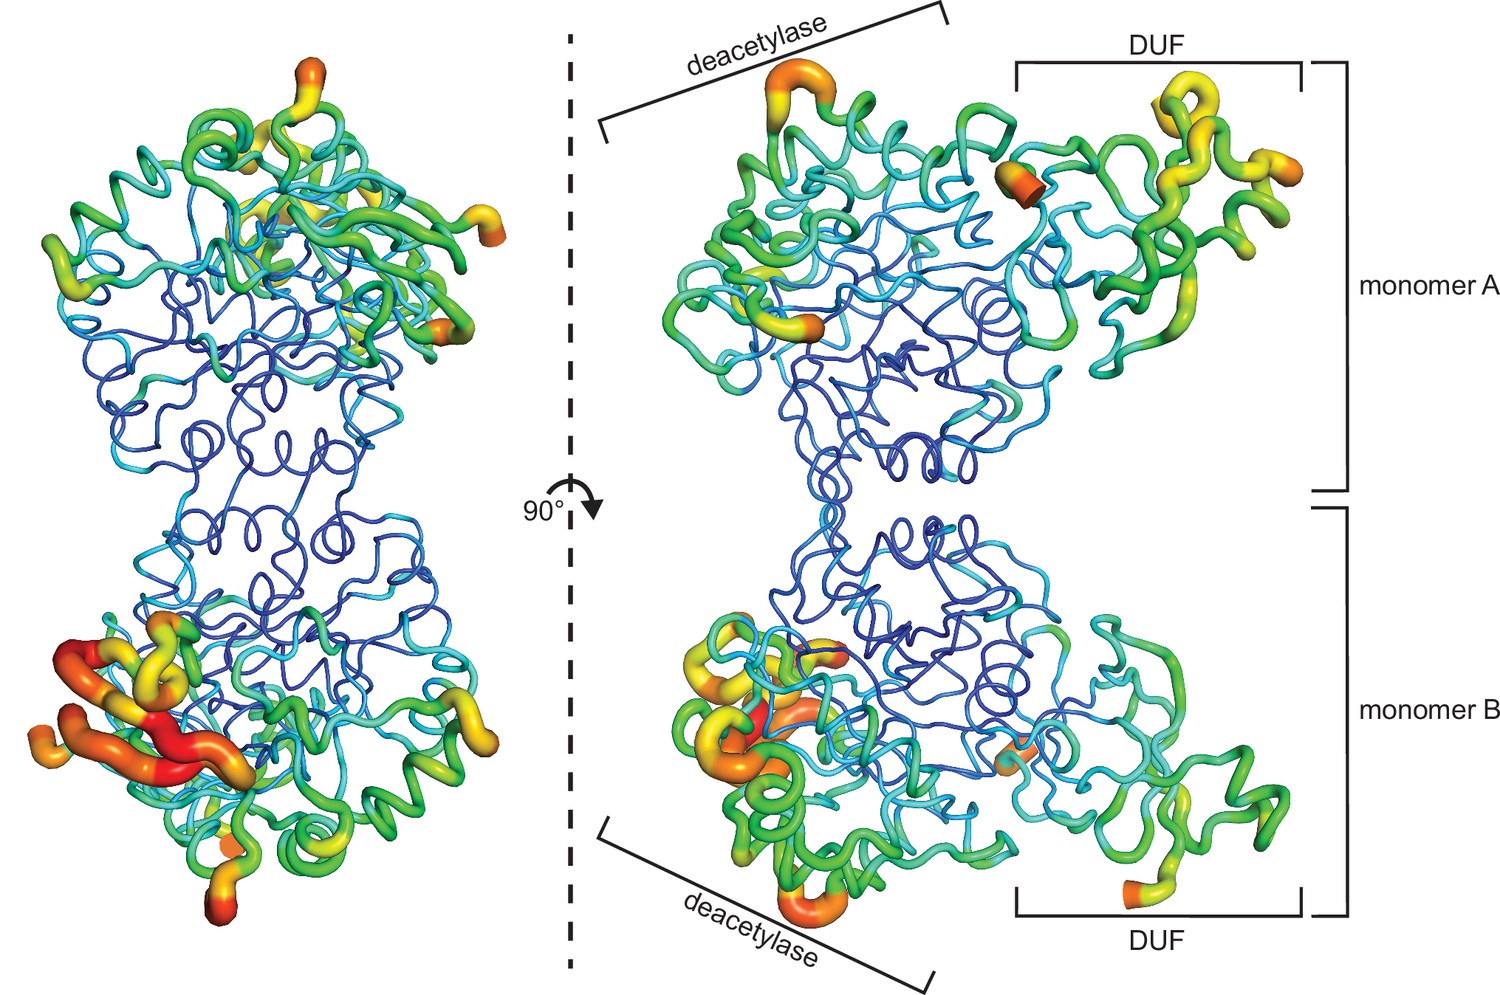
B-factor representation of WT human AMDHD2.
The protein is presented as putty cartoon and colored from low to high B-factors (24–108 A2, blue to red). WT, wild-type.
Figure 3—figure supplement 3
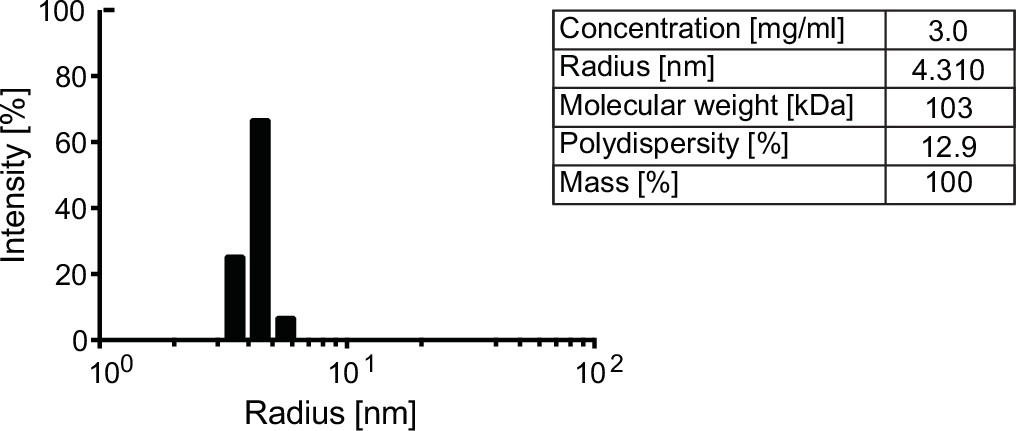
Oligomeric state of human AMDHD2.
Representative DLS measurement of WT AMDHD2. Table: Parameters of the representative DLS measurement showing a dimeric assembly. DLS, dynamic light scattering; WT, wild-type.
-
Figure 3—figure supplement 3—source data 1
Raw data.
- https://cdn.elifesciences.org/articles/69223/elife-69223-fig3-figsupp3-data1-v3.zip
Figure 3—figure supplement 4
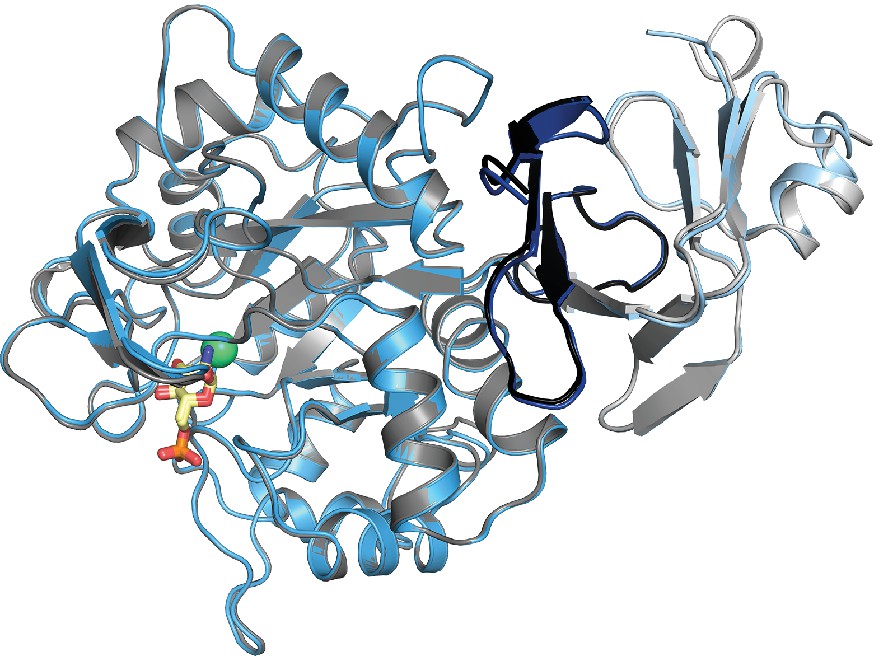
Superposition of GlcN6P-bound AMDHD2 monomer A (gray) and monomer B (blue) in cartoon representation.
GlcN6P (yellow sticks) and Zn2+ (green spheres) are highlighted.
Figure 3—figure supplement 5
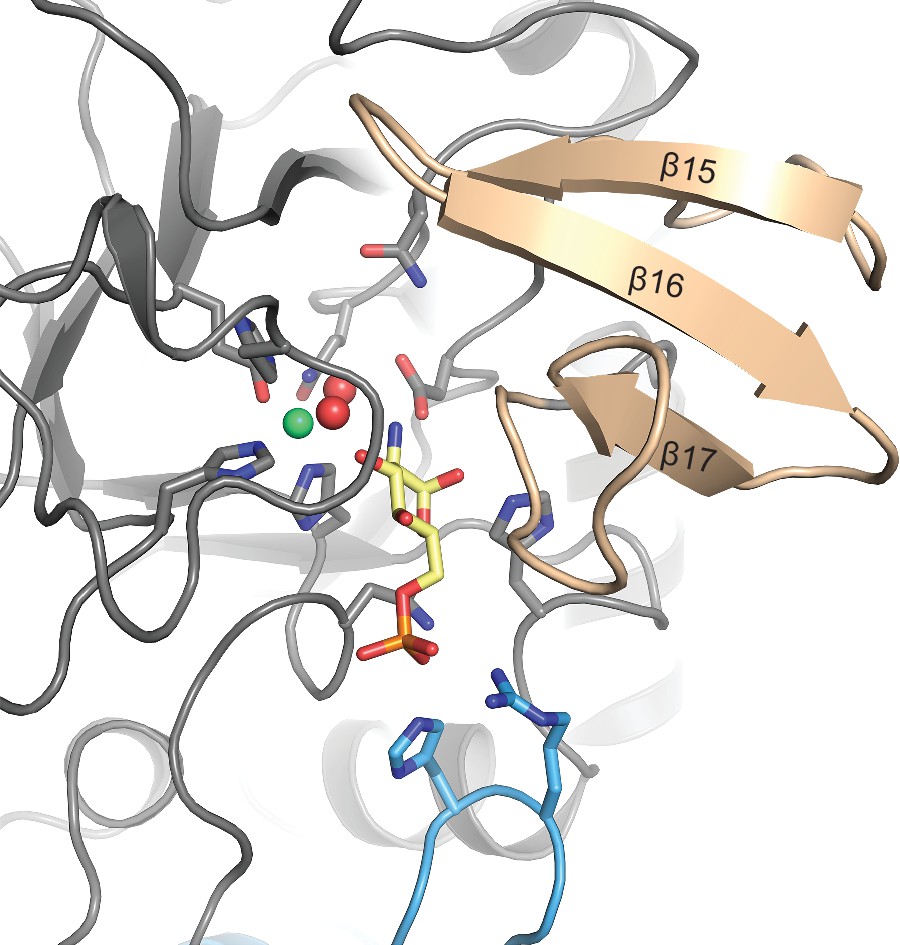
Close-up view of the active site in cartoon representation.
Residues involved in ligand binding or catalysis are highlighted as sticks, as well as GlcN6P (yellow sticks), Zn2+ (green sphere), and two water molecules (red spheres). Three antiparallel β-strands (β15–β17, colored wheat) build a β-sheet close to the active site.
Figure 3—figure supplement 6
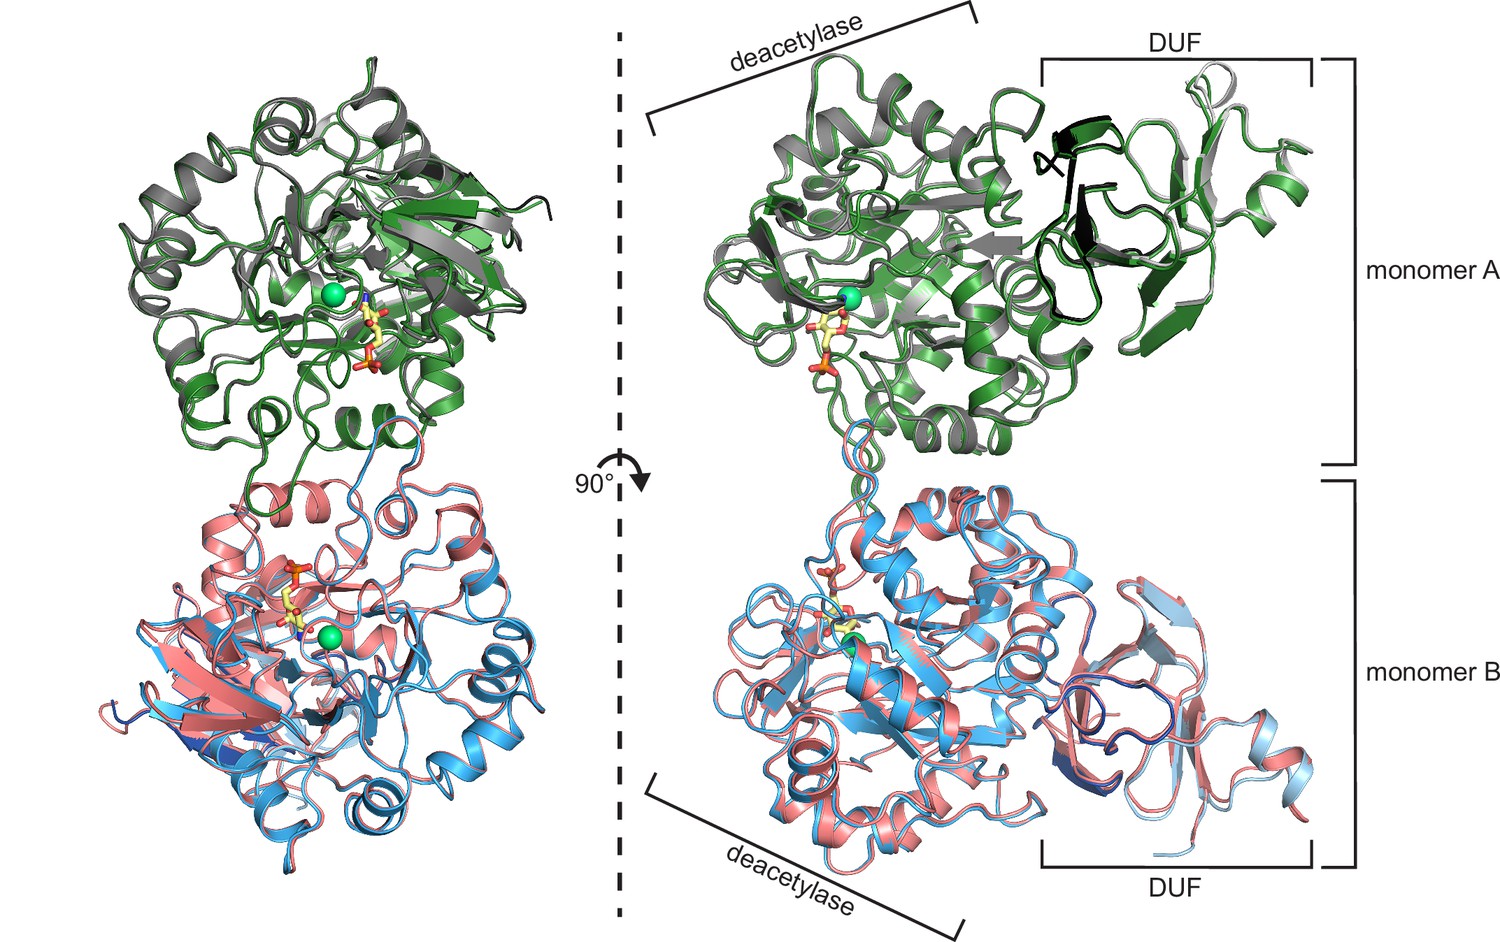
Superposition of the structures of GlcN6P-bound (gray and blue) and GlcN6P-free (green and red) human AMDHD2 with RMSD of 0.67 Å over 792 main chain residues in cartoon representation.
GlcN6P (yellow sticks) and Zn2+ (green spheres) are highlighted.
Figure 3—figure supplement 7
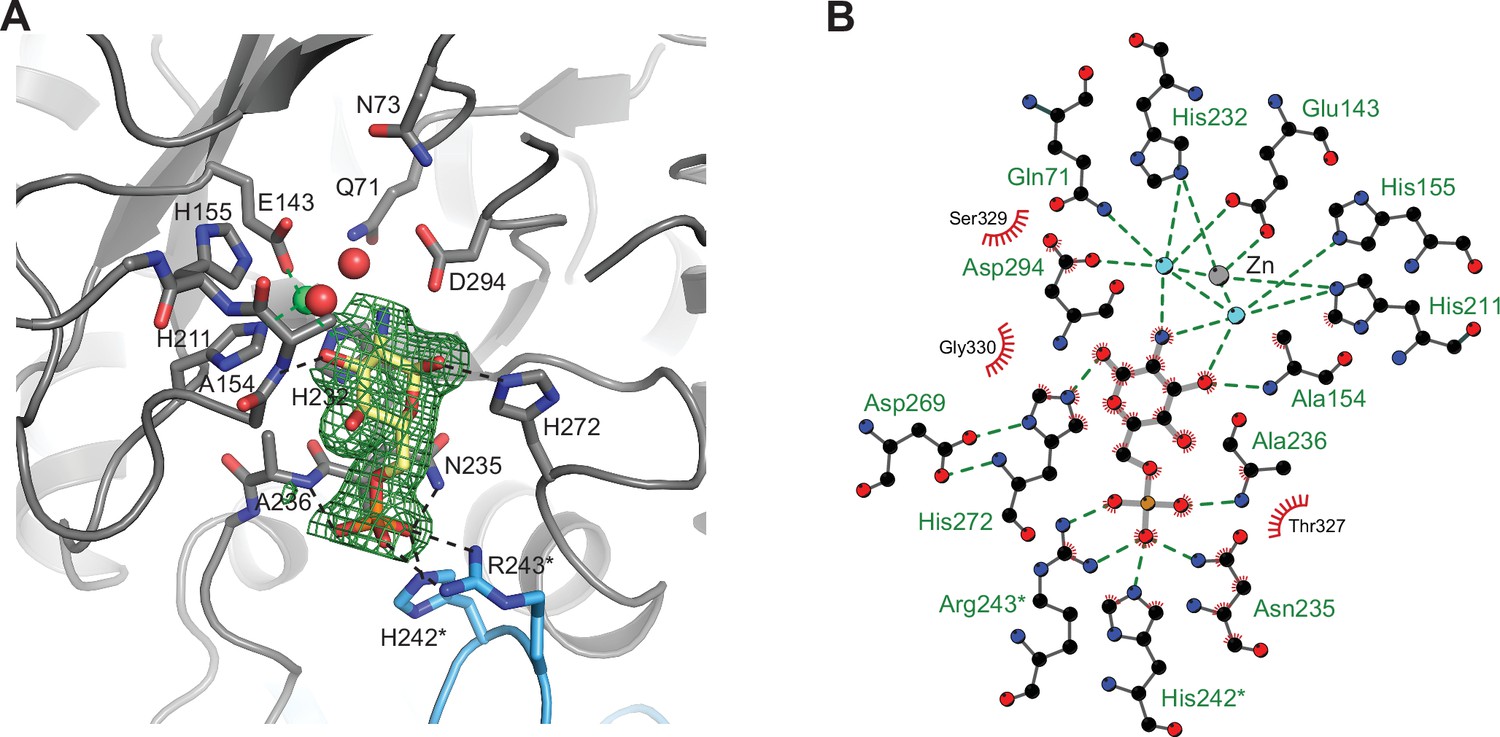
Active site of human AMDHD2.
(A) Omit map of the active site of human AMDHD2 in cartoon representation. Residues involved in ligand binding or catalysis are highlighted as sticks, as well as GlcN6P (yellow sticks). The Fo-Fc omit map is colored in green and its contour level is at 1.5 RMSD. (B) 2D ligand-protein interaction diagram of GlcN6P interacting with human AMDHD2. Ligand bonds are colored in gray and amino acid side chain bonds in black. Green dashed lines indicate hydrogen bonds and red spiked arcs present residues making nonbonded contacts with the ligands.
Figure 3—figure supplement 8
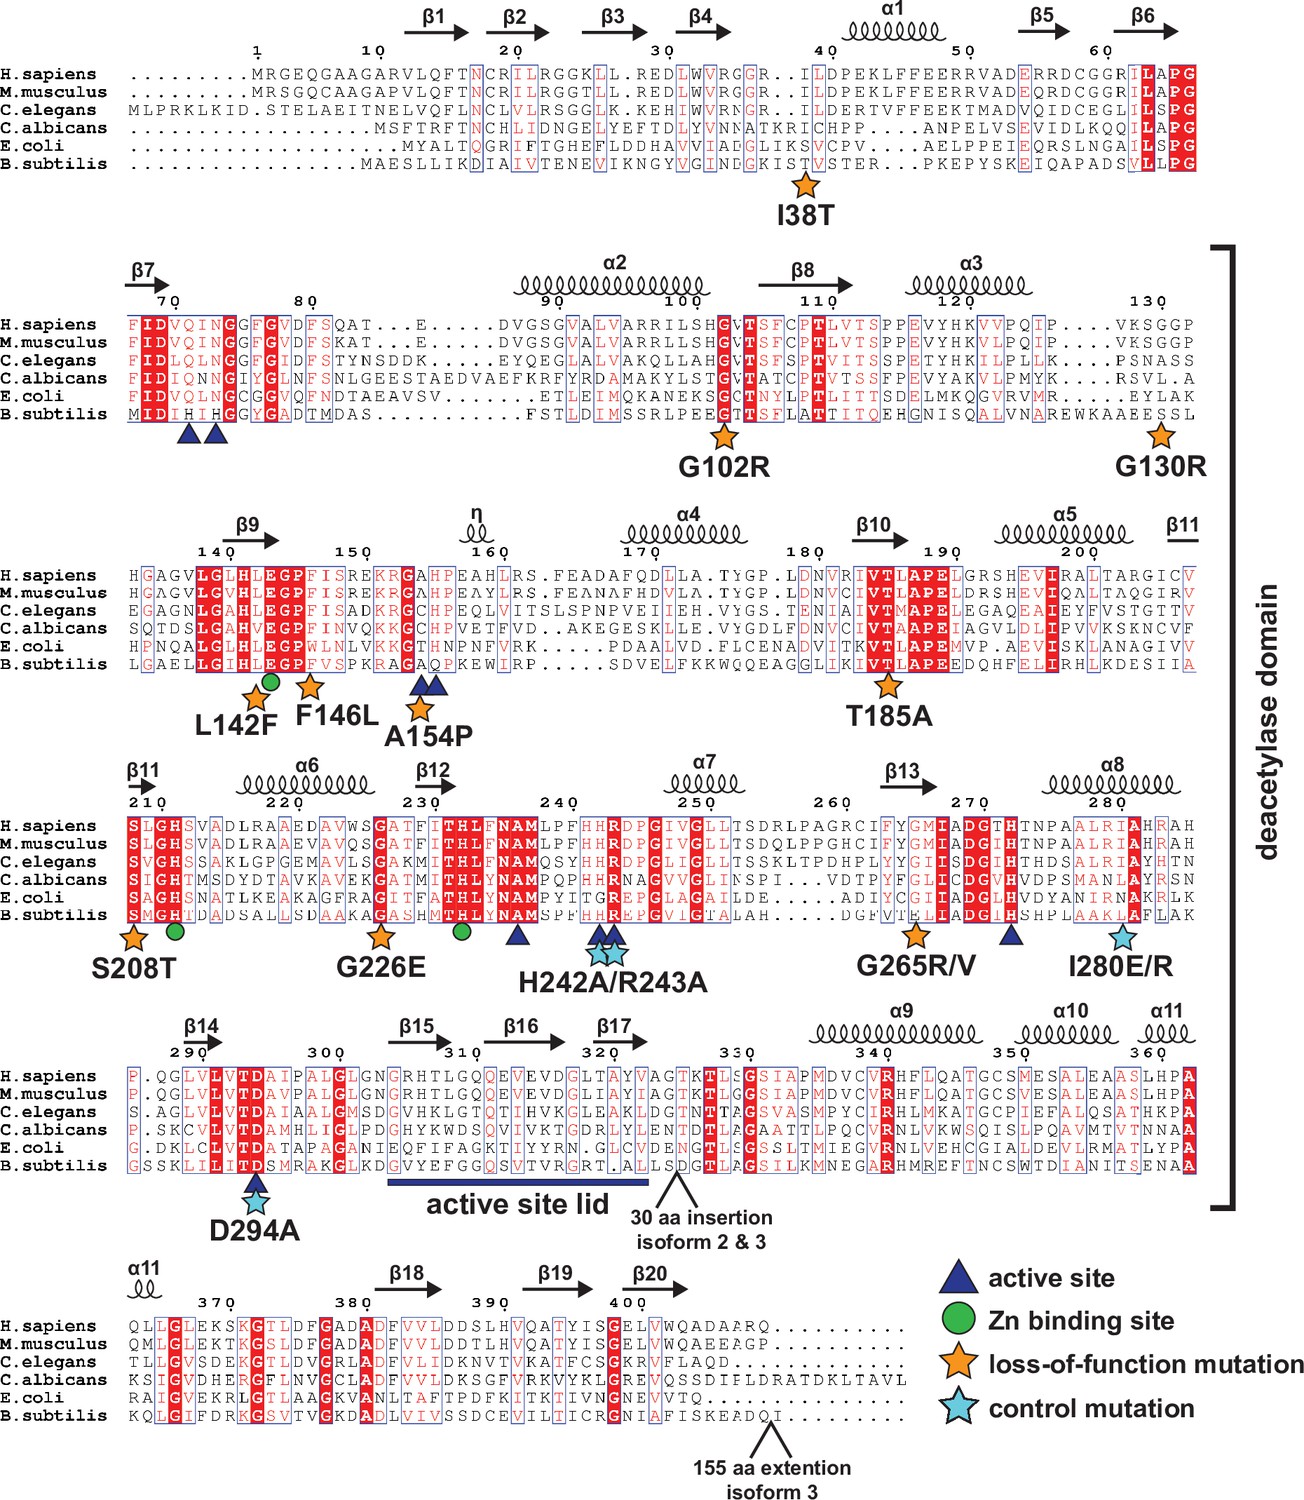
Protein sequence alignment of AMDHD2.
Red boxes indicate identical residues, red letters indicate similar residues. The deacetylase domain and secondary structure elements are annotated, as well as the positions of insertions and extensions in AMDHD2 isoform 2 and isoform 3. Residues involved in product binding, catalysis, or metal binding are highlighted. The putative active site lid is marked. Moreover, the positions of the potential LOF mutations and the control mutations are labeled.
Figure 3—figure supplement 9
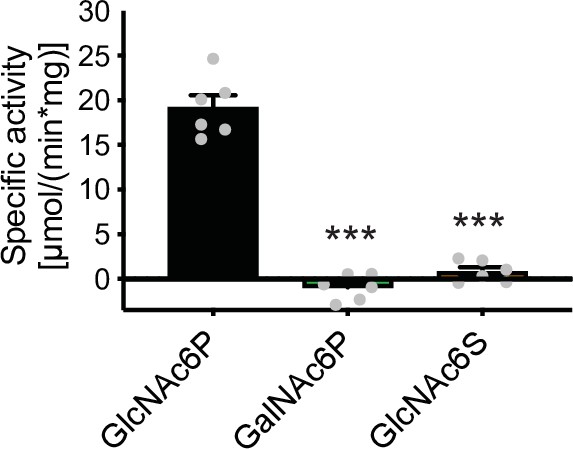
Deacetylase activity of human AMDHD2 toward GlcNAc6P, GalNAc6P, and GlcNAc6S (mean + SEM, n=6, ***p<0.0001 versus GlcNAc6P, one-way ANOVA).
-
Figure 3—figure supplement 9—source data 1
Raw data.
- https://cdn.elifesciences.org/articles/69223/elife-69223-fig3-figsupp9-data1-v3.zip
Figure 4 with 1 supplement
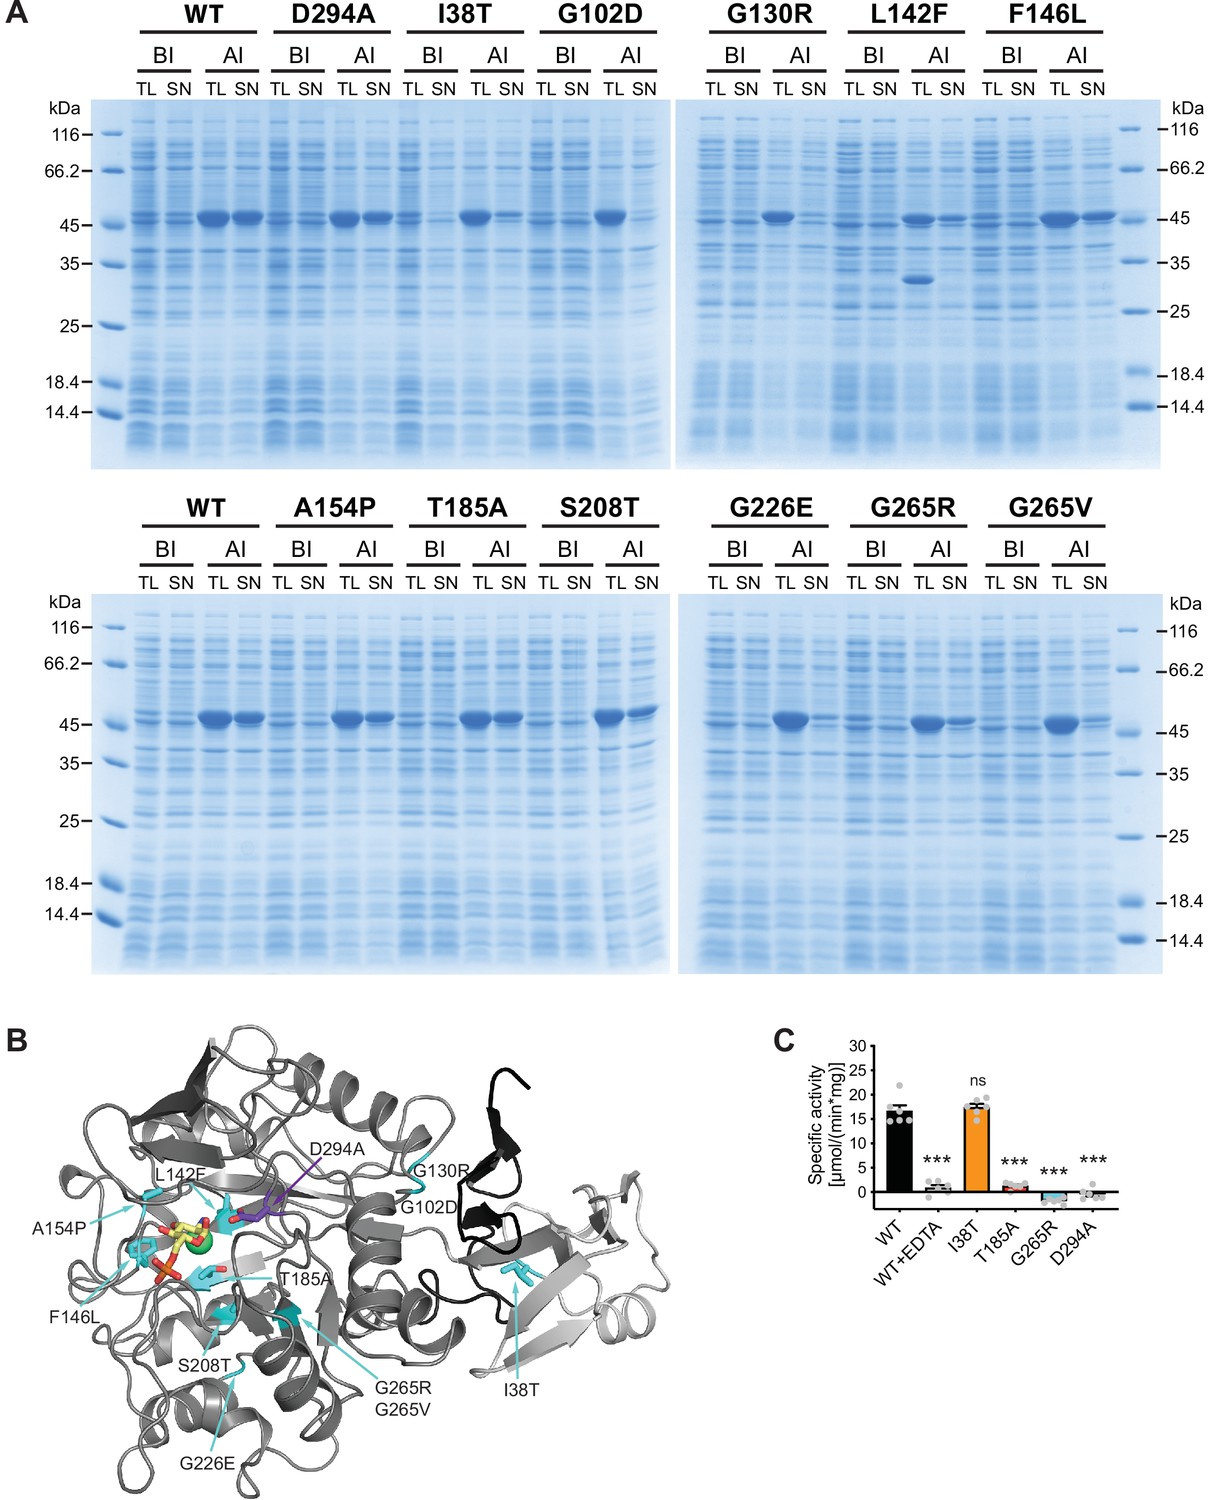
Characterization of AMDHD2 loss-of-function (LOF) mutants.
(A) SDS-gels stained with Coomassie brilliant blue of a representative bacterial test expression of the human AMDHD2 variants. The experiment was repeated three times with similar results. BI: before induction, AI: after induction, TL: total lysate, SN: soluble fraction/supernatant. A band corresponding to the molecular weight of human AMDHD2 with His6-tag (46 kDa) was present in all total lysates after induction. (B) Overview of the position of the potential LOF mutations in human AMDHD2 in cartoon representation. GlcN6P (yellow sticks), the metal co-factor (green spheres), the active site Asp294 (violet sticks), and the 11 putative LOF mutations (cyan sticks) are highlighted. (C) Deacetylase activity of wild-type (WT) and mutant human AMDHD2 (mean + SEM, n=6, ***p<0.0001 versus WT, one-way ANOVA).Figure 4—source data 1
-
Figure 4—source data 1
Raw data.
- https://cdn.elifesciences.org/articles/69223/elife-69223-fig4-data1-v3.zip
Figure 4—figure supplement 1

Characterization of AMDHD2 loss-of-function mutants.
SDS-gels stained with Coomassie brilliant blue of a representative bacterial test expression of the human AMDHD2 variants. The experiment was repeated three times with similar results. BI: before induction, AI: after induction, TL: total lysate, SN: soluble fraction/ supernatant, PL: pellet fraction solubilized in 8 M urea.
-
Figure 4—figure supplement 1—source data 1
Raw data.
- https://cdn.elifesciences.org/articles/69223/elife-69223-fig4-figsupp1-data1-v3.zip
Figure 5 with 3 supplements
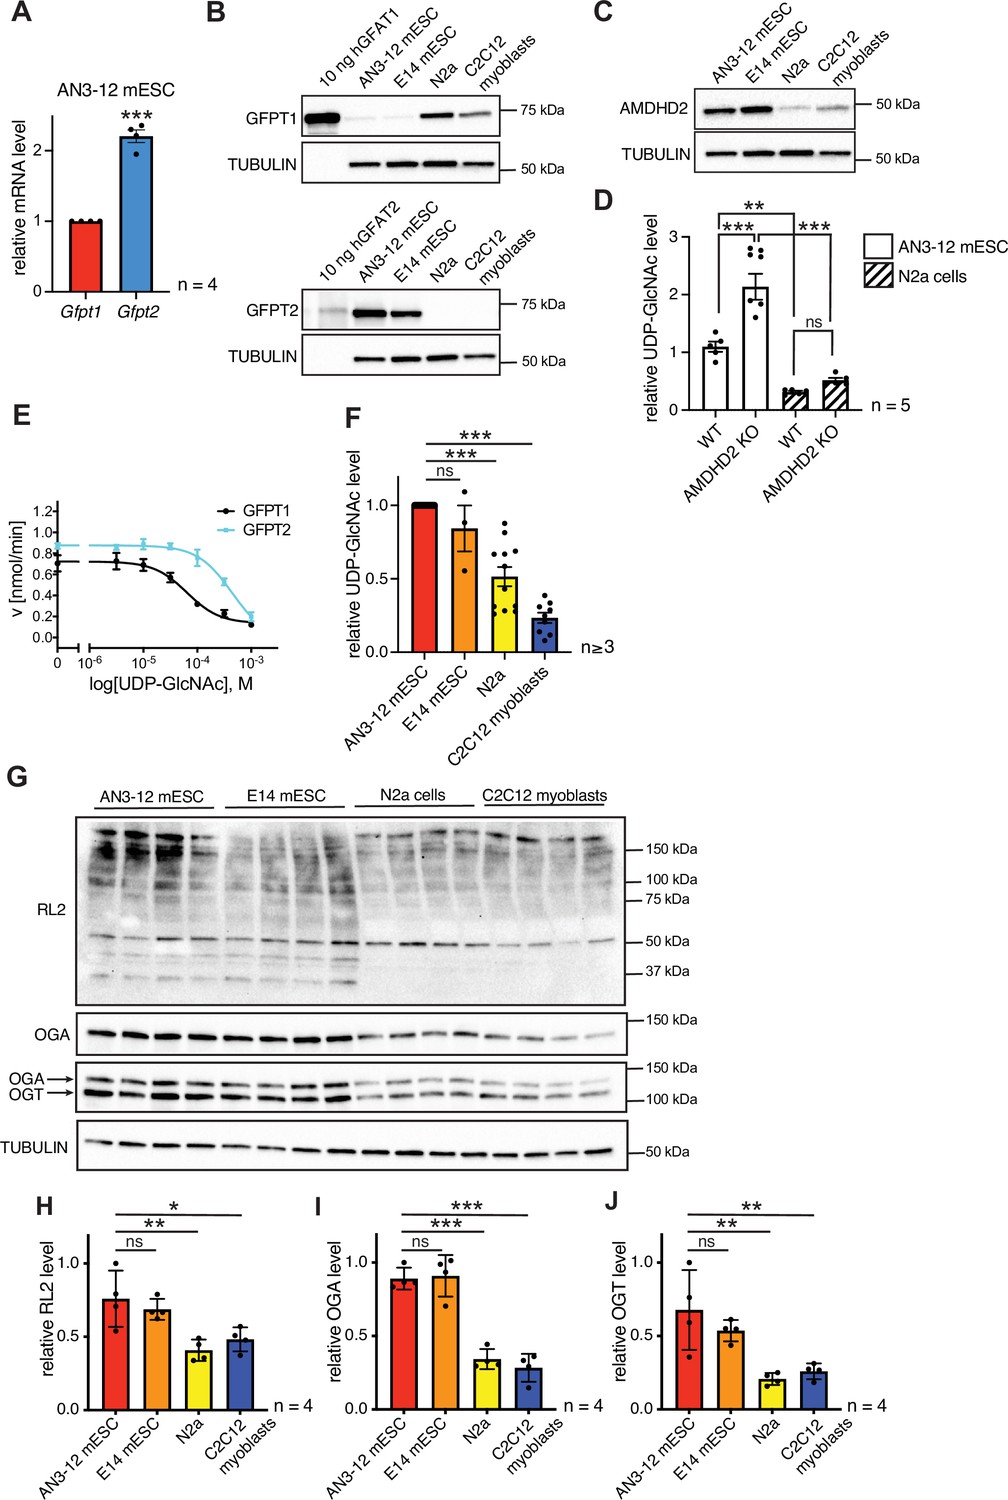
AMDHD2 limits HBP activity when GFPT2 replaces GFPT1 as the first enzyme.
(A) Relative GFPT1 and GFPT2 mRNA levels (qPCR) in WT AN3-12 cells (mean ± SEM, n=4, ***p<0.001, unpaired t-test). (B) Western blot analysis of purified human GFPT1 and GFPT2 protein lysates of indicated cell lines. (C) Western blot analysis of AMDHD2 in indicated cell lines. (D) IC-MS analysis of UDP-GlcNAc levels in WT and AMDHD2 KO AN3-12 mESCs and N2a cells (mean ± SEM, n=5, ***p<0.001, one-way ANOVA). (E) Representative UDP-GlcNAc dose-response assay with hGFPT1 (black circle) and hGFPT2 (teal square) (mean ± SD, n=3). (F) Relative UDP-GlcNAc levels in indicated cell lines measured by IC-MS. Levels are normalized to those in AN3-12 mESCs (mean ± SEM, n≥3, ***p< 0.001, one-way ANOVA). (G) Western blot analysis of O-GlcNAc-modified proteins (RL2), OGA, OGT, and tubulin in the indicated cell lines. (H–J) Quantification of Western blot in (G) (mean ± SD, n=4, *p<0.05, **p<0.01, ***p<0.001, ns=not significant, one-way ANOVA Dunnett’s posttest).Figure 5—source data 1 HBP, hexosamine biosynthetic pathway; WT, wild-type.
-
Figure 5—source data 1
Raw data.
- https://cdn.elifesciences.org/articles/69223/elife-69223-fig5-data1-v3.zip
Figure 5—figure supplement 1

AMDHD2 limits HBP activity when GFPT2 replaces GFPT1 as the first enzyme.
Manipulation of GFPT1 in AN3-12 cells has no influence on UDP-GlcNAc levels. IC-MS analysis of relative UDP-GlcNAc levels of WT, GFPT1 G451E, GFPT1 KO, and AMDHD2 KO AN3-12 cells (mean ± SEM, n=7, ***p<0.001, one-way ANOVA Dunnett’s posttest). HBP, hexosamine biosynthetic pathway; WT, wild-type.
-
Figure 5—figure supplement 1—source data 1
Raw data.
- https://cdn.elifesciences.org/articles/69223/elife-69223-fig5-figsupp1-data1-v3.zip
Figure 5—figure supplement 2
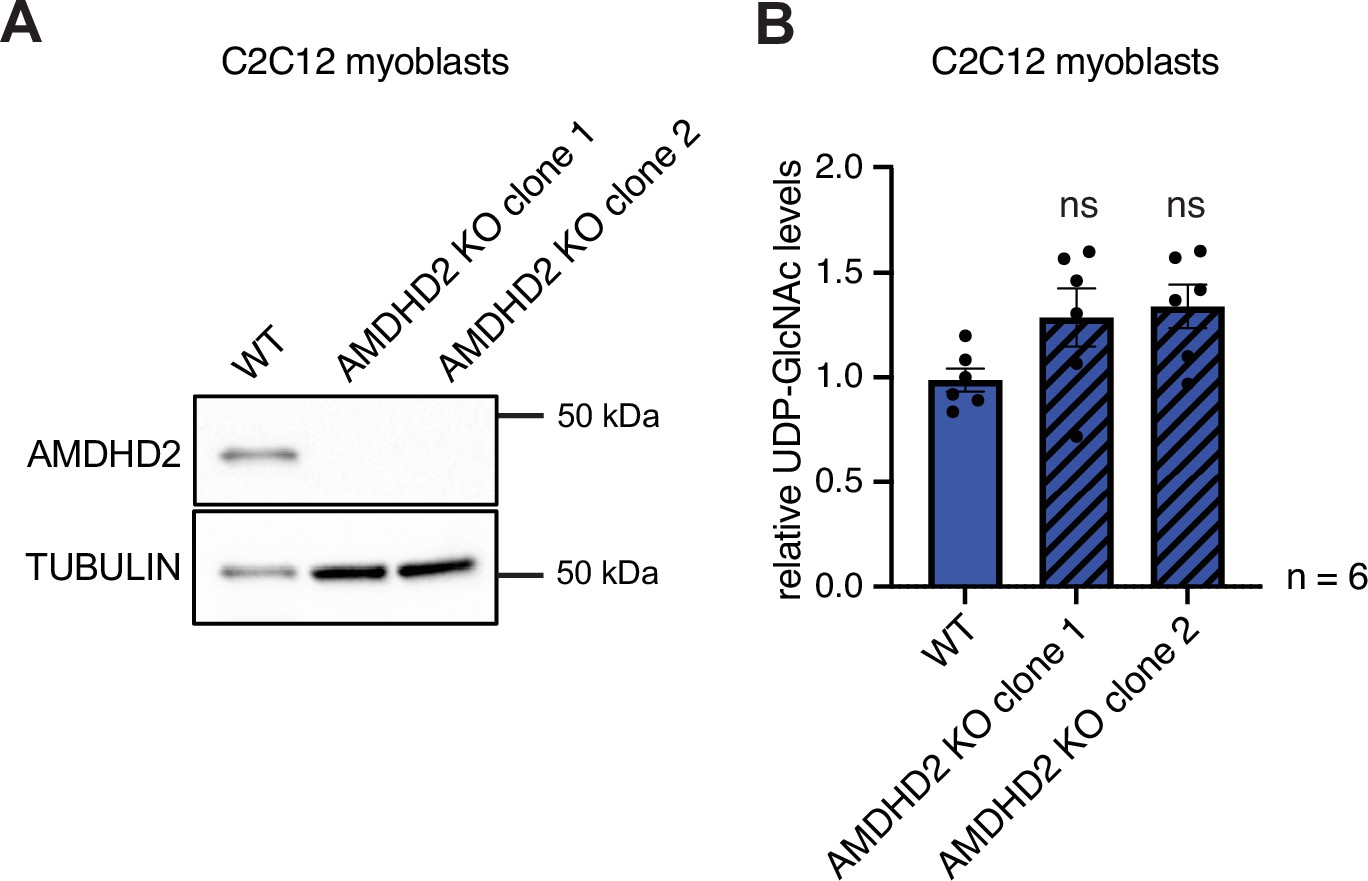
Deletion of AMDHD2 has no effect on HBP flux in C2C12 myoblasts.
(A) Western blot analysis of AMDHD2 expression in two AMDHD2 KO lines (clones 1–2) compared to WT C2C12 myoblasts. (B) IC-MS analysis of relative UDP-GlcNAc levels of two AMDHD2 KO lines (clones 1–2) compared to WT C2C12 myoblasts (mean ± SEM, n=6, ns=not significant, one-way ANOVA Dunnett’s posttest). HBP, hexosamine biosynthetic pathway; WT, wild-type.
-
Figure 5—figure supplement 2—source data 1
Raw data.
- https://cdn.elifesciences.org/articles/69223/elife-69223-fig5-figsupp2-data1-v3.zip
Figure 5—figure supplement 3
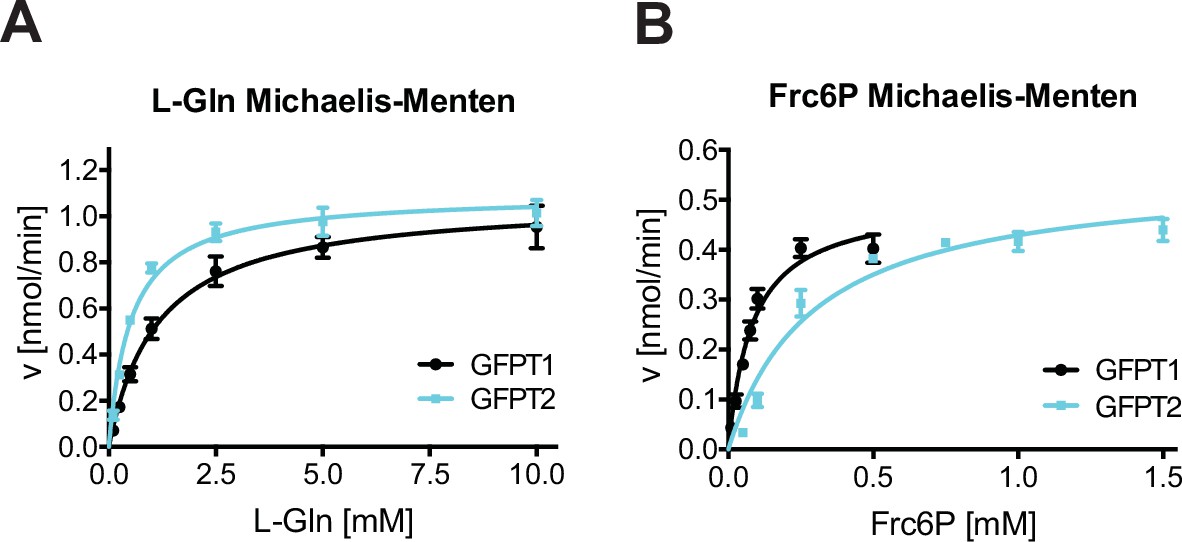
Biochemical characterization of human GFPT2 compared to human GFPT1.
(A) L-Gln kinetic of WT human GFPT1 (black circle) and WT human GFPT2 (teal square) (mean ± SEM, hGFPT1 n=5, hGFPT2 n=4). (B) Frc6P kinetic of WT hGFPT1 (black circle) and WT hGFPT2 (teal square) (mean ± SEM, hGFPT1 n=5, hGFPT2 n=8). WT, wild-type.
-
Figure 5—figure supplement 3—source data 1
Raw data.
- https://cdn.elifesciences.org/articles/69223/elife-69223-fig5-figsupp3-data1-v3.zip
Figure 6 with 1 supplement
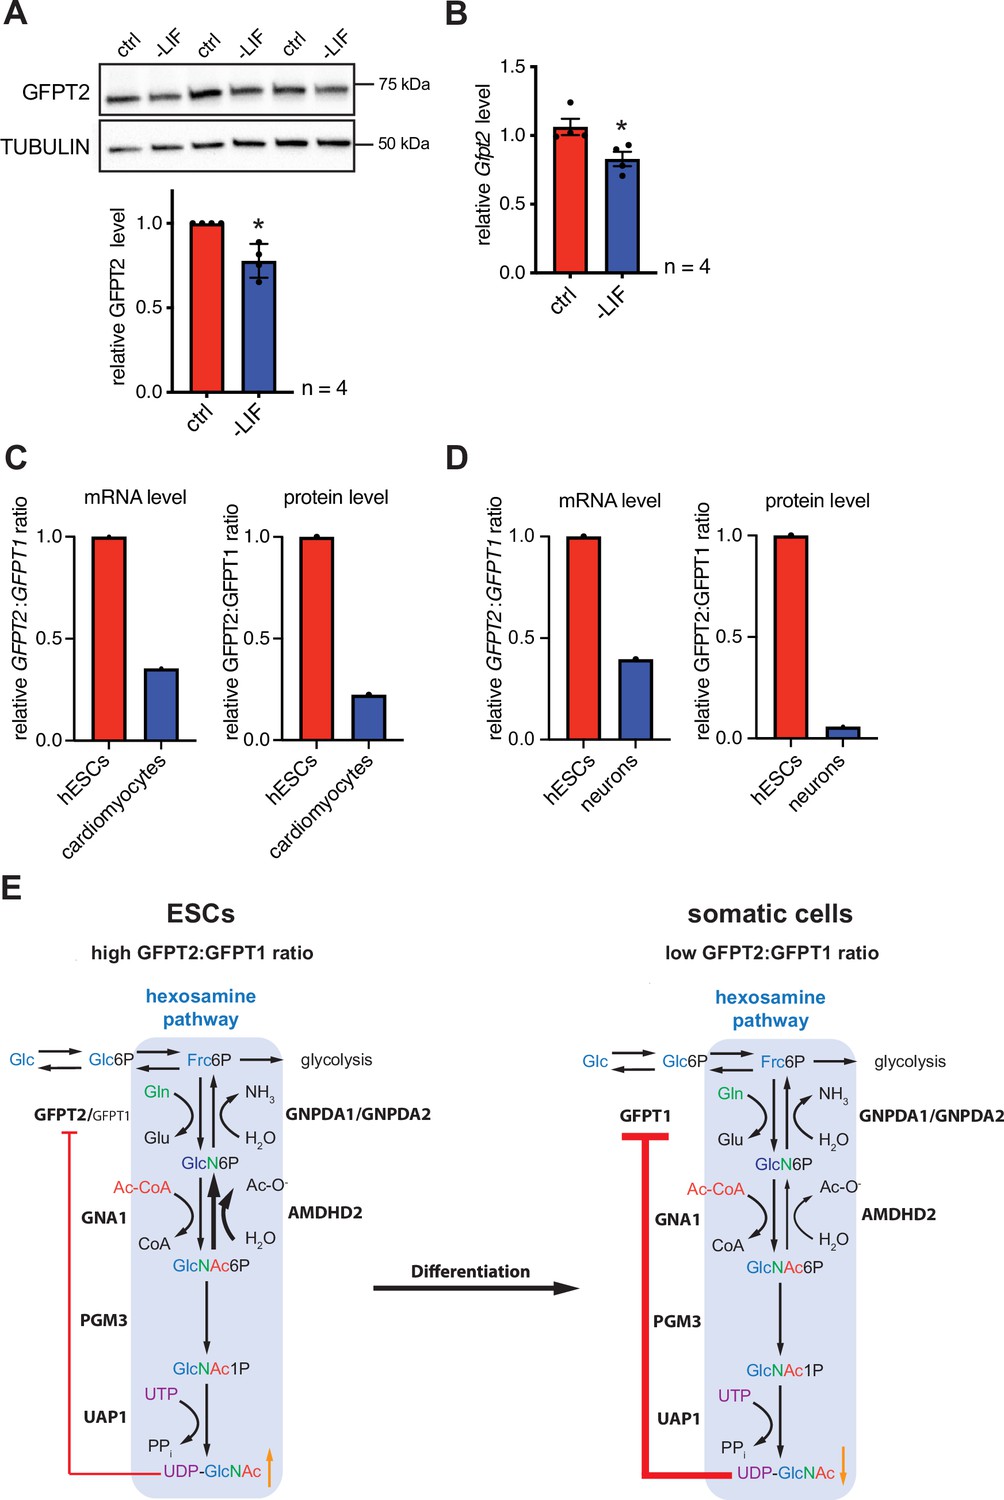
Differentiation of ESCs induces an enzymatic reconfiguration of the HBP by reducing the GFPT2:GFPT1 ratio.
(A) Western blot analysis and quantification (mean ± SD, n=4, *p<0.05, unpaired t-test) of GFPT2 in WT AN3-12 control cells and upon partial differentiation by a 5-day LIF removal. (B) Relative Gfpt2 mRNA level (qPCR) in WT AN3-12 cells and upon partial differentiation by a 5-day LIF removal (mean ± SEM, n=4, *p<0.05, unpaired t-test). (C) Relative GFPT2/GFPT1 mRNA and GFPT2/GFPT1 protein ratios in human ESCs and upon differentiation into cardiomyocytes (data obtained from: Frank et al., 2019; Bartsch et al., 2021). (D) Relative GFPT2/GFPT1 mRNA and GFPT2/GFPT1 protein ratios in human ESCs and upon differentiation into neurons (data obtained from: Saez et al., 2018). (E) Model: enzymatic configuration of the HBP in ESCs and somatic cells. The HBP (blue box) generates UDP-GlcNAc in multiple enzymatic steps. While ESCs mainly rely on GFPT2, more differentiated cells use GFPT1 for HBP entry. GFPT2 is less susceptible to UDP-GlcNAc inhibition than GFPT1 (indicated by red arrow). As an alternative regulatory mechanism ESCs require AMDHD2. Differentiation of ESCs induces an HBP reconfiguration, resulting in a decreased GFPT2:GFPT1 ratio. GFPT: glutamine fructose-6-phosphate amidotransferase, GNPDA: D-glucosamine-6-phosphate deaminase, GNA1: D-glucosamine-6-phosphate-Nacetyltransferase, AMDHD2: N-acetylglucosamine-6-phosphatedeacetylase, PGM3: phosphoglucomutase, UAP1: UDP-N-acetylglucosamine pyrophosphorylase.Figure 6—source data 1 ESC, embryonic stem cell; HBP, hexosamine biosynthetic pathway; LIF, leukemia inhibitory factor; WT, wild-type.
-
Figure 6—source data 1
Raw data.
- https://cdn.elifesciences.org/articles/69223/elife-69223-fig6-data1-v3.zip
Figure 6—figure supplement 1
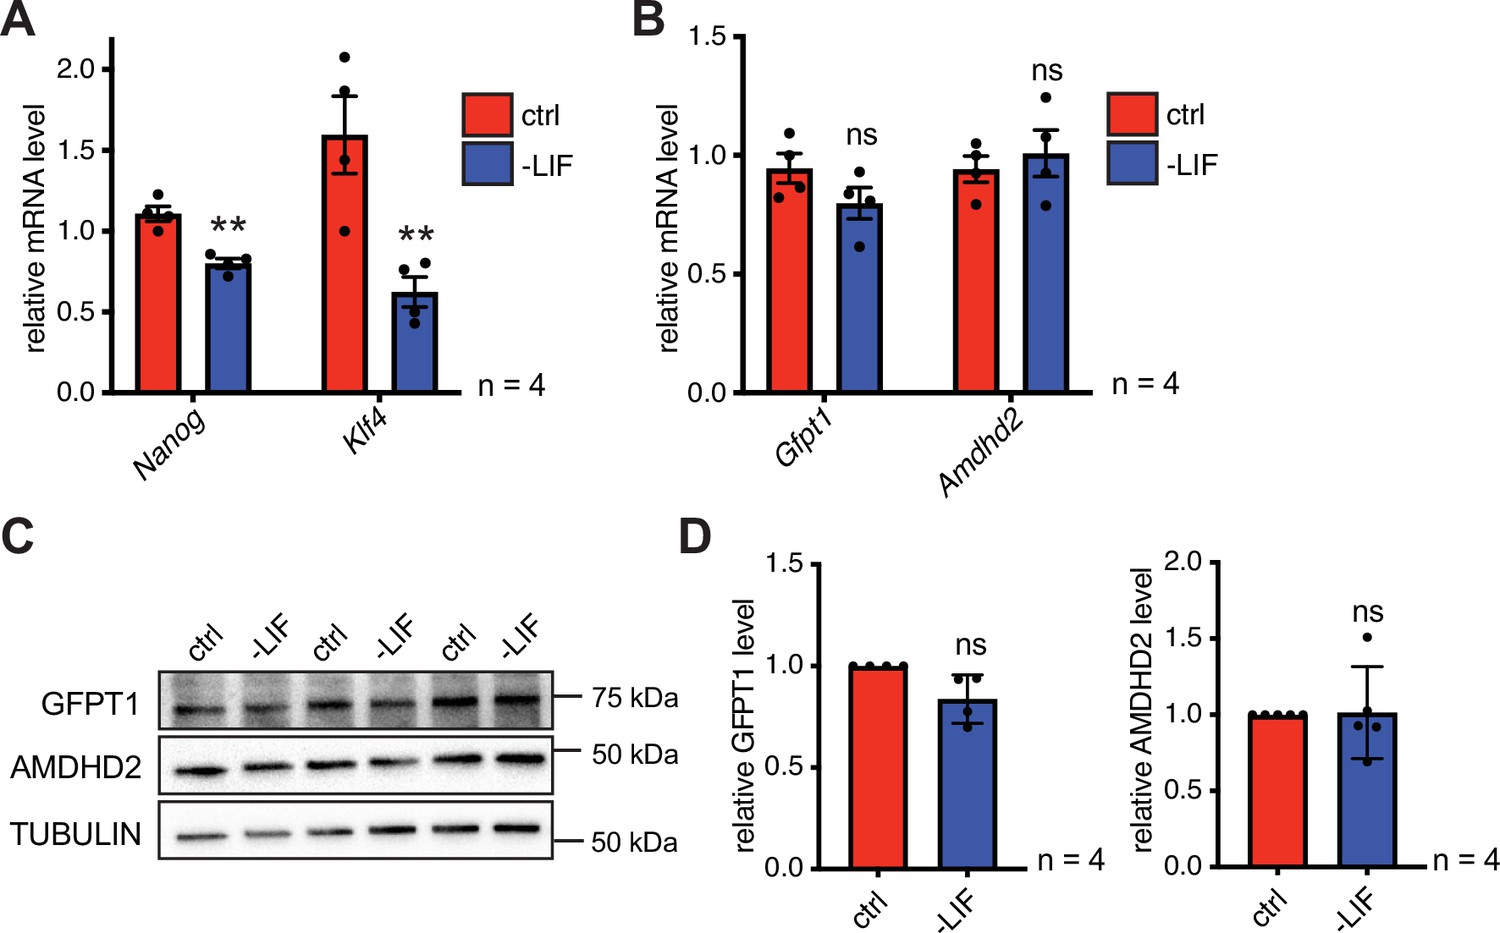
Differentiation of ESCs induces an enzymatic reconfiguration of the HBP by reducing the GFPT2:GFPT1 ratio.
The effect of partial differentiation upon LIF removal in AN3-12 cells on the enzymatic HBP composition. (A) Relative Nanog and Klf4 mRNA-level (qPCR) of WT AN3-12 cells and upon partial differentiation by 5 days of LIF removal (mean ± SEM, n=4, ns=not significant, unpaired t-test). (B) Relative Gfpt1 and Amdhd2 mRNA-level (qPCR) of WT AN3-12 cells and upon partial differentiation by 5 days of LIF removal (mean ± SEM, n=4, ns=not significant, unpaired t-test). (C) Representative Western blot analysis of GFPT1 and AMDHD2 in WT AN3-12 cells and upon partial differentiation by 5 days of LIF removal. (D) Quantification of Western blot as shown in (C) (mean ± SD, n=4, ns=not significant, unpaired t-test). ESC, embryonic stem cell; HBP, hexosamine biosynthetic pathway; LIF, leukemia inhibitory factor; WT, wild-type.
-
Figure 6—figure supplement 1—source data 1
Raw data.
- https://cdn.elifesciences.org/articles/69223/elife-69223-fig6-figsupp1-data1-v3.zip
Author response image 1
Author response image 2
Tables
Table 1
Data collection and refinement statistics of human AMDHD2.
| AMDHD2+Zn+GlcN6P | AMDHD2+Zn | |
|---|---|---|
| Wavelength (Å) | 1.00 | 1.00 |
| Resolution range (Å) | 45.71–1.90(1.97–1.90) | 48.21–1.84(1.90–1.84) |
| Space group | P 212121 | P 212121 |
| a, b, c (Å) | 63.3, 161.4, 86.6 | 61.8, 84.3, 154.2 |
| α, β, γ (°) | 90, 90, 90 | 90, 90, 90 |
| Total reflections | 428,727 (42,693) | 468,961 (46,539) |
| Unique reflections | 70,760 (6907) | 71,036 (6953) |
| Multiplicity | 6.1 (6.2) | 6.6 (6.7) |
| Completeness (%) | 99.7 (98.3) | 99.9 (99.2) |
| Mean I/sigma(I) | 11.46 (1.16) | 12.53 (1.06) |
| Wilson B-factor | 34.7 | 29.7 |
| Rmerge (%) | 9.5 (140.4) | 10.2 (150.6) |
| Rmeas (%) | 10.4 (153.3) | 11.0 (163.3) |
| Rpim (%) | 4.2 (60.9) | 4.3 (62.5) |
| CC1/2 (%) | 99.9 (49.4) | 99.9 (49.9) |
| CC* (%) | 100 (81.3) | 100 (81.6) |
| Reflections used in refinement | 70,751 (6906) | 71,024 (6952) |
| Reflections used for R-free | 1980 (194) | 1992 (195) |
| Rwork (%) | 18.5 (31.7) | 18.2 (31.2) |
| Rfree (%) | 21.3 (29.6) | 20.6 (33.6) |
| CCwork (%) | 96.6 (73.4) | 96.6 (75.7) |
| CCfree (%) | 94.4 (73.1) | 95.4 (72.8) |
| Number of non-hydrogen atoms | 6361 | 6331 |
| Macromolecules | 5997 | 5999 |
| Ligands | 34 | 14 |
| Solvent | 330 | 318 |
| Protein residues | 801 | 798 |
| RMS (bonds) (Å) | 0.005 | 0.004 |
| RMS (angles) (°) | 0.69 | 0.70 |
| Ramachandran favored (%) | 96.9 | 97.1 |
| Ramachandran allowed (%) | 2.9 | 2.7 |
| Ramachandran outliers (%) | 0.25 | 0.25 |
| Rotamer outliers (%) | 0.32 | 0.32 |
| Clashscore | 0.67 | 0.92 |
| Average B-factor | 43.59 | 37.67 |
| Macromolecules | 43.81 | 37.76 |
| Ligands | 40.19 | 41.98 |
| Solvent | 40.10 | 35.72 |
| Number of TLS groups | 4 | 4 |
| PDB ID | 7NUT | 7NUU |
-
Statistics for the highest-resolution shell are shown in parentheses.
Table 2
Kinetic parameters of human GFPT1 and GFPT2.
| L-Glu production | D-GlcN6P production | UDP-GlcNAc inhibition | |||||
|---|---|---|---|---|---|---|---|
| Km L-Gln[mM] | kcat[s–1] | kcat/Km[mM–1 s–1] | Km Frc6P[mM] | kcat[s–1] | kcat/Km[mM–1 s–1] | IC50[µM] | |
| GFPT1 | 1.1±0.19 | 3.6±0.18 | 3.3 | 0.08±0.01 | 1.7±0.09 | 21.3 | 57.0–8.3/+9.7 |
| GFPT2 | 0.5±0.06 | 3.7±0.10 | 7.4 | 0.29±0.05 | 1.8±0.09 | 6.2 | 367.3–43.6/+49.5 |
| Unpaired t-test(two-sided) | **p=0.005 | **p=0.0027 | ***p=0.0002 | ||||
Additional files
-
Transparent reporting form
- https://cdn.elifesciences.org/articles/69223/elife-69223-transrepform1-v3.pdf
-
Supplementary file 1
Primers used in this study.
- https://cdn.elifesciences.org/articles/69223/elife-69223-supp1-v3.docx
Download links
A two-part list of links to download the article, or parts of the article, in various formats.
Downloads (link to download the article as PDF)
Open citations (links to open the citations from this article in various online reference manager services)
Cite this article (links to download the citations from this article in formats compatible with various reference manager tools)
GFPT2/GFAT2 and AMDHD2 act in tandem to control the hexosamine pathway
eLife 11:e69223.
https://doi.org/10.7554/eLife.69223


