Pneumococcal genetic variability in age-dependent bacterial carriage
- Department of Neurology, Amsterdam UMC, University of Amsterdam, Netherlands
- Department of Clinical Epidemiology, Biostatistics and Bioinformatics, University of Amsterdam, Netherlands
- Centre for Infectious Disease Control, National Institute for Public Health and the Environment, Netherlands
- Department of Pediatric Immunology and Infectious D, Wilhelmina Children's Hospital, Netherlands
- Epidemiology of Microbial Diseases, Yale School of Public Health, United States
- Cambodia Oxford Medical Research Unit, Angkor Hospital for Children, Cambodia
- Centre for Tropical Medicine and Global Health, Nuffield Department of Medicine, University of Oxford, United Kingdom
- Department of Medical Microbiology and Infection Prevention, Amsterdam UMC, Netherlands
- The Netherlands Reference Laboratory for Bacterial Meningitis, Netherlands
- Parasites and Microbes, Wellcome Sanger Institute, United Kingdom
- European Molecular Biology Laboratory–European Bioinformatics Institute, United Kingdom
- MRC Centre for Global Infectious Disease Analysis, Department of Infectious Disease Epidemiology, Imperial College London, United Kingdom
Figures
Figure 1 with 1 supplement
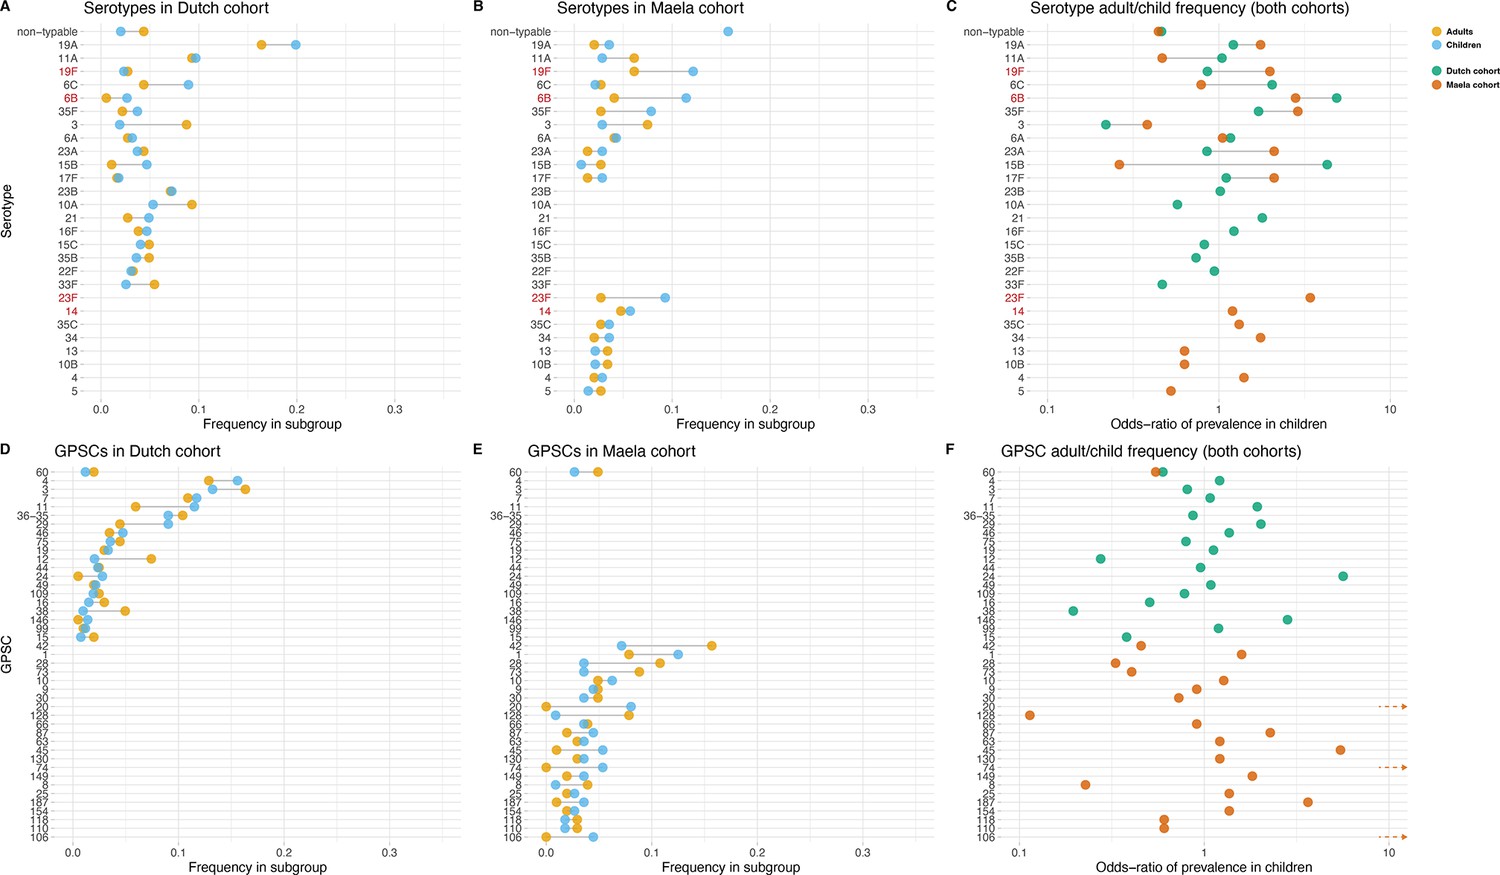
Serotype and strain (global pneumococcal sequence clusters [GPSC]) distribution by age and between cohorts.
Blue dots represent frequency of serotype and strain in child carriage, yellow dots represent frequency in adult carriage. Red and green dots show odds ratio of prevalence in children in the Maela and Dutch cohorts, respectively, on a log scale for serotype. Lines show differences. Top row: dominant serotypes, ordered by presence in cohort, and internally by overall frequency. Vaccine serotypes shown in red. (A) Serotype frequency in the Dutch cohort. (B) Serotype frequency in the Maela cohort. (C) Comparison of adult/child log odds in each cohort for serotype. Second row: dominants strains (GPSCs), ordered by presence in cohort, and internally by overall frequency. (D) Strain frequency in Dutch cohort. (E) Strain frequency in Maela cohort. (F) Comparison of adult/child log odds in each cohort for strain.
Figure 1—figure supplement 1
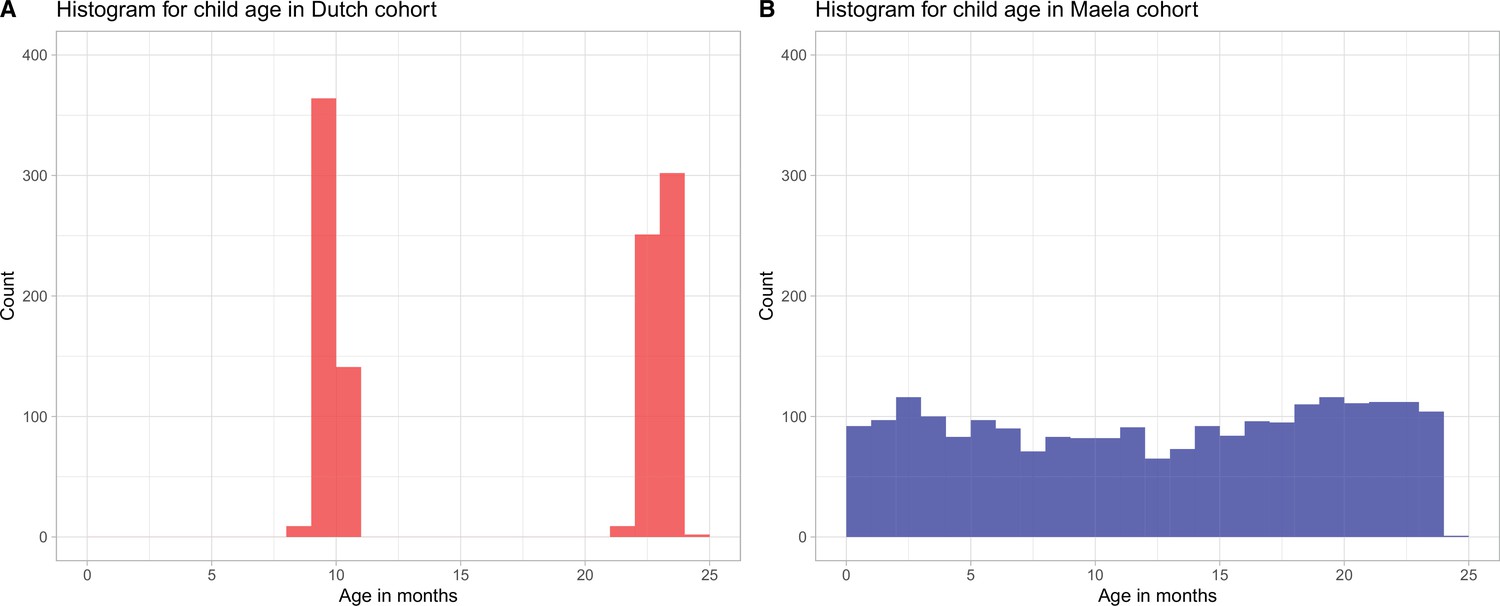
Histogram for child age (in months) in (A) Dutch cohort (red bars) and (B) Maela cohort (blue bars).
Due to the differences in sampling strategies in the studies from which the samples were obtained, children in the Dutch cohort were sampled at ages 9–11 months and 22–24 months, while in the Maela cohort children were sampled in the age range 1–24 months.
Figure 2 with 1 supplement
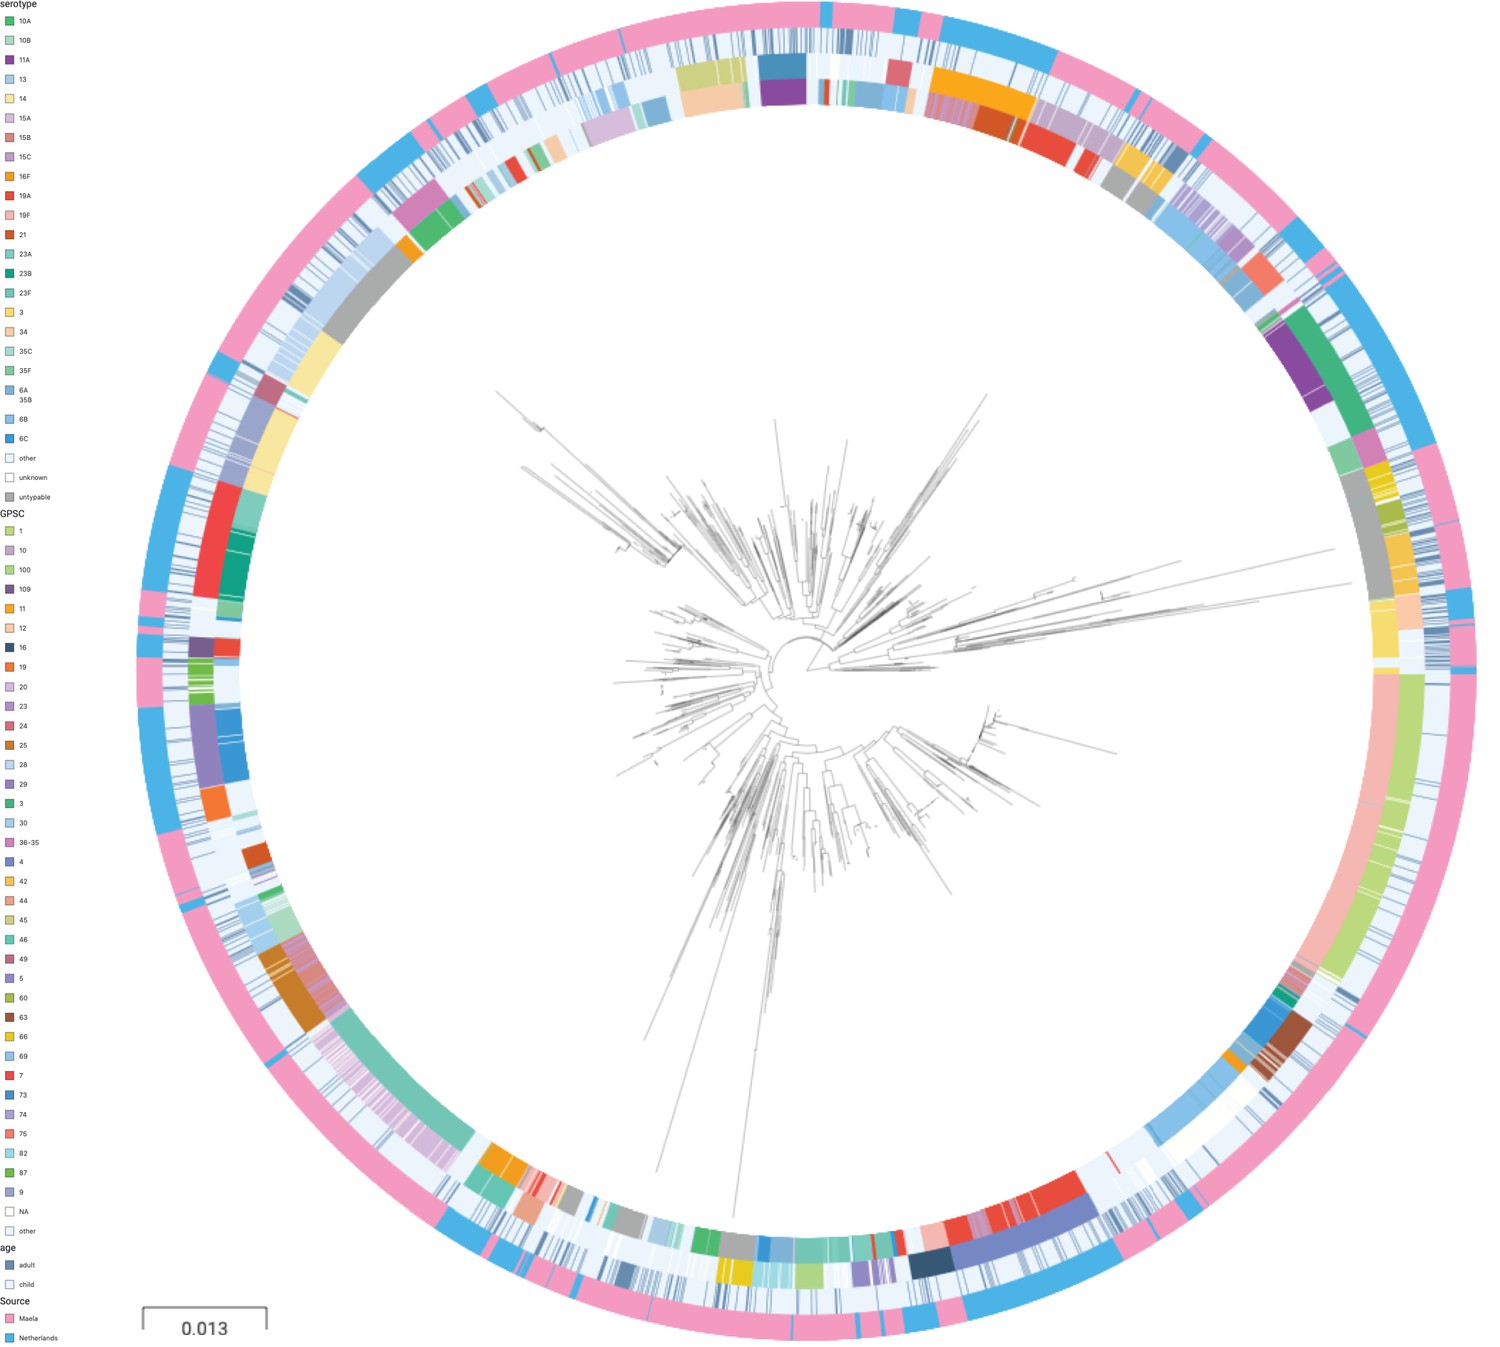
Phylogenetic tree of carriage samples from both cohorts.
The rings show metadata for the samples. Depicted from inside to outside, these are serotype, sequence cluster (global pneumococcal sequence clusters [GPSC]), age, and source (Maela, Netherlands). Scale bar: 0.013 substitutions per site. An interactive version is available at here (project link available here).
Figure 2—figure supplement 1
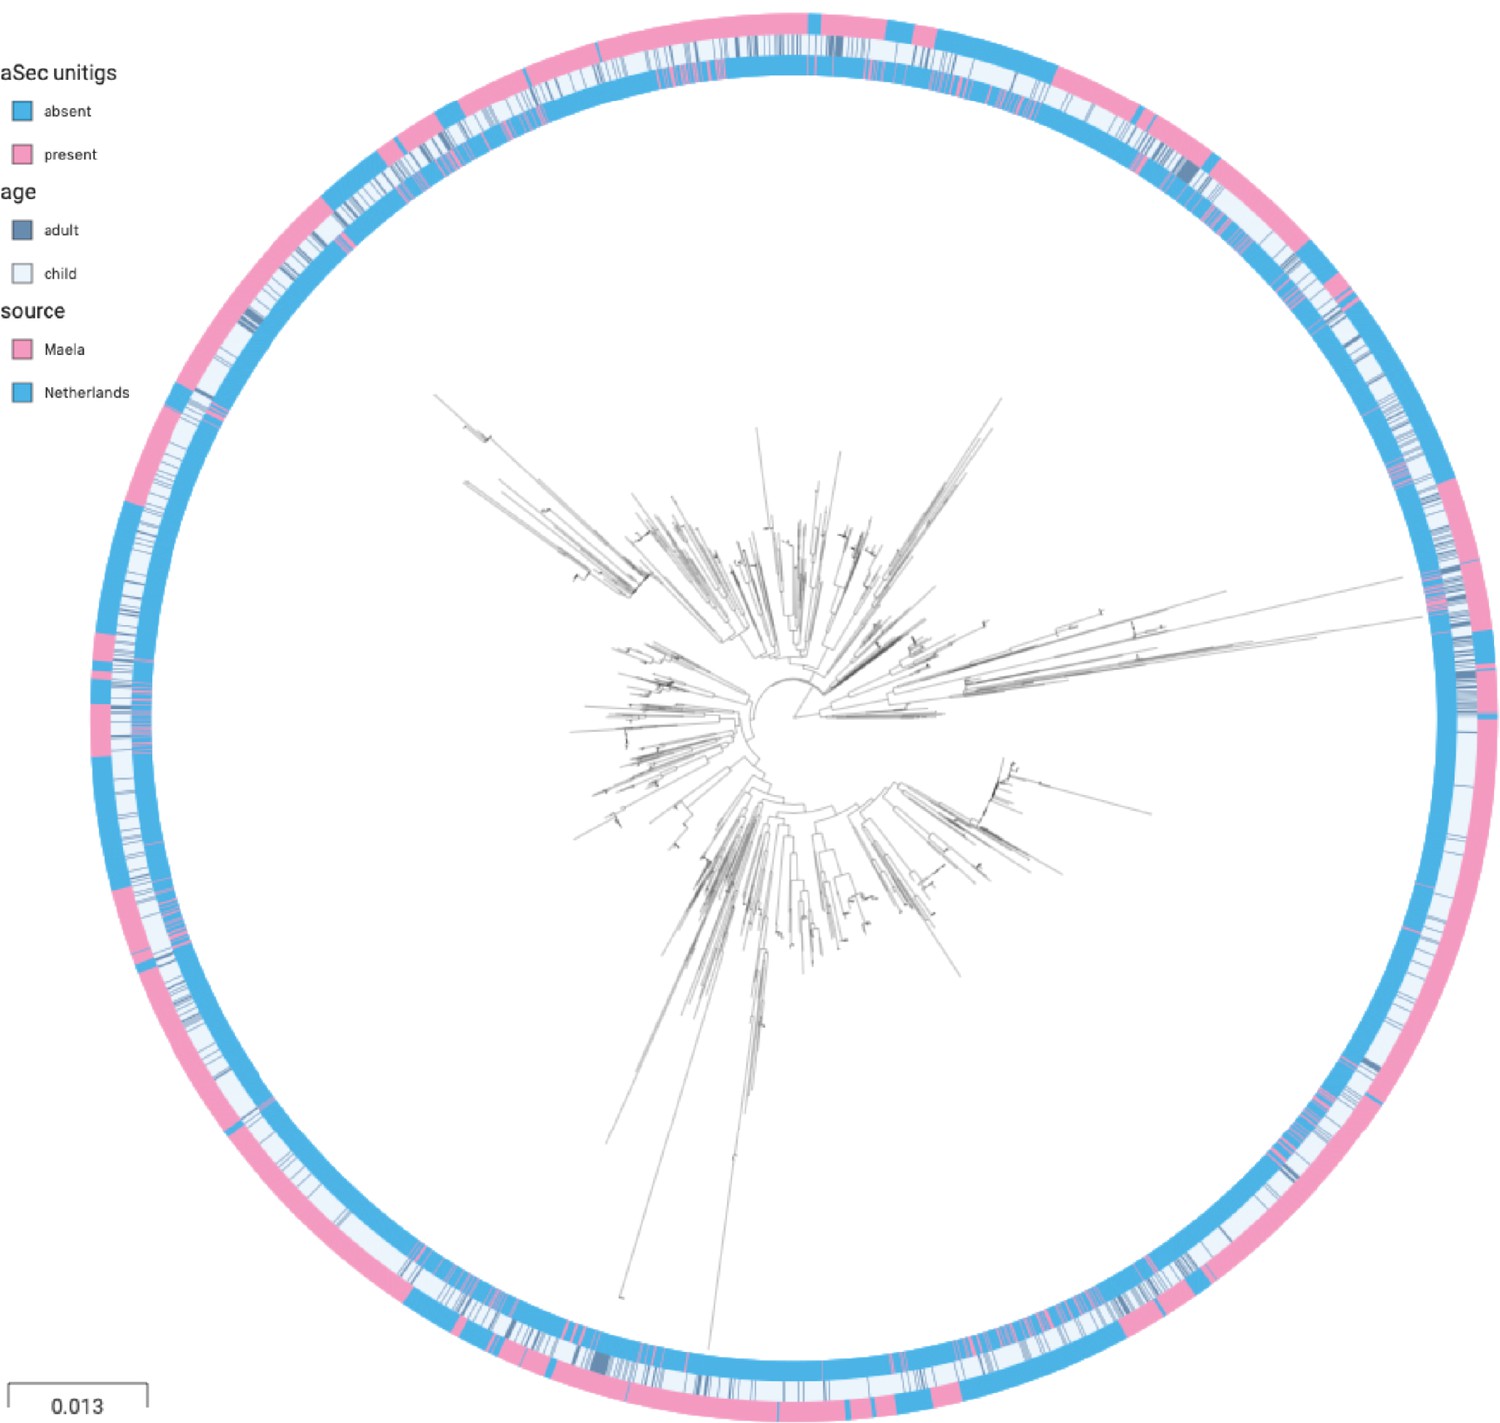
Phylogenetic tree of carriage samples from both cohorts.
The rings show metadata for the samples. Depicted from inside to outside, these are presence or absence of the unitig upstream to the aSec gene, age (adult or child), and source (Maela or Netherlands). Scale bar: 0.013 substitutions per site.
Figure 3
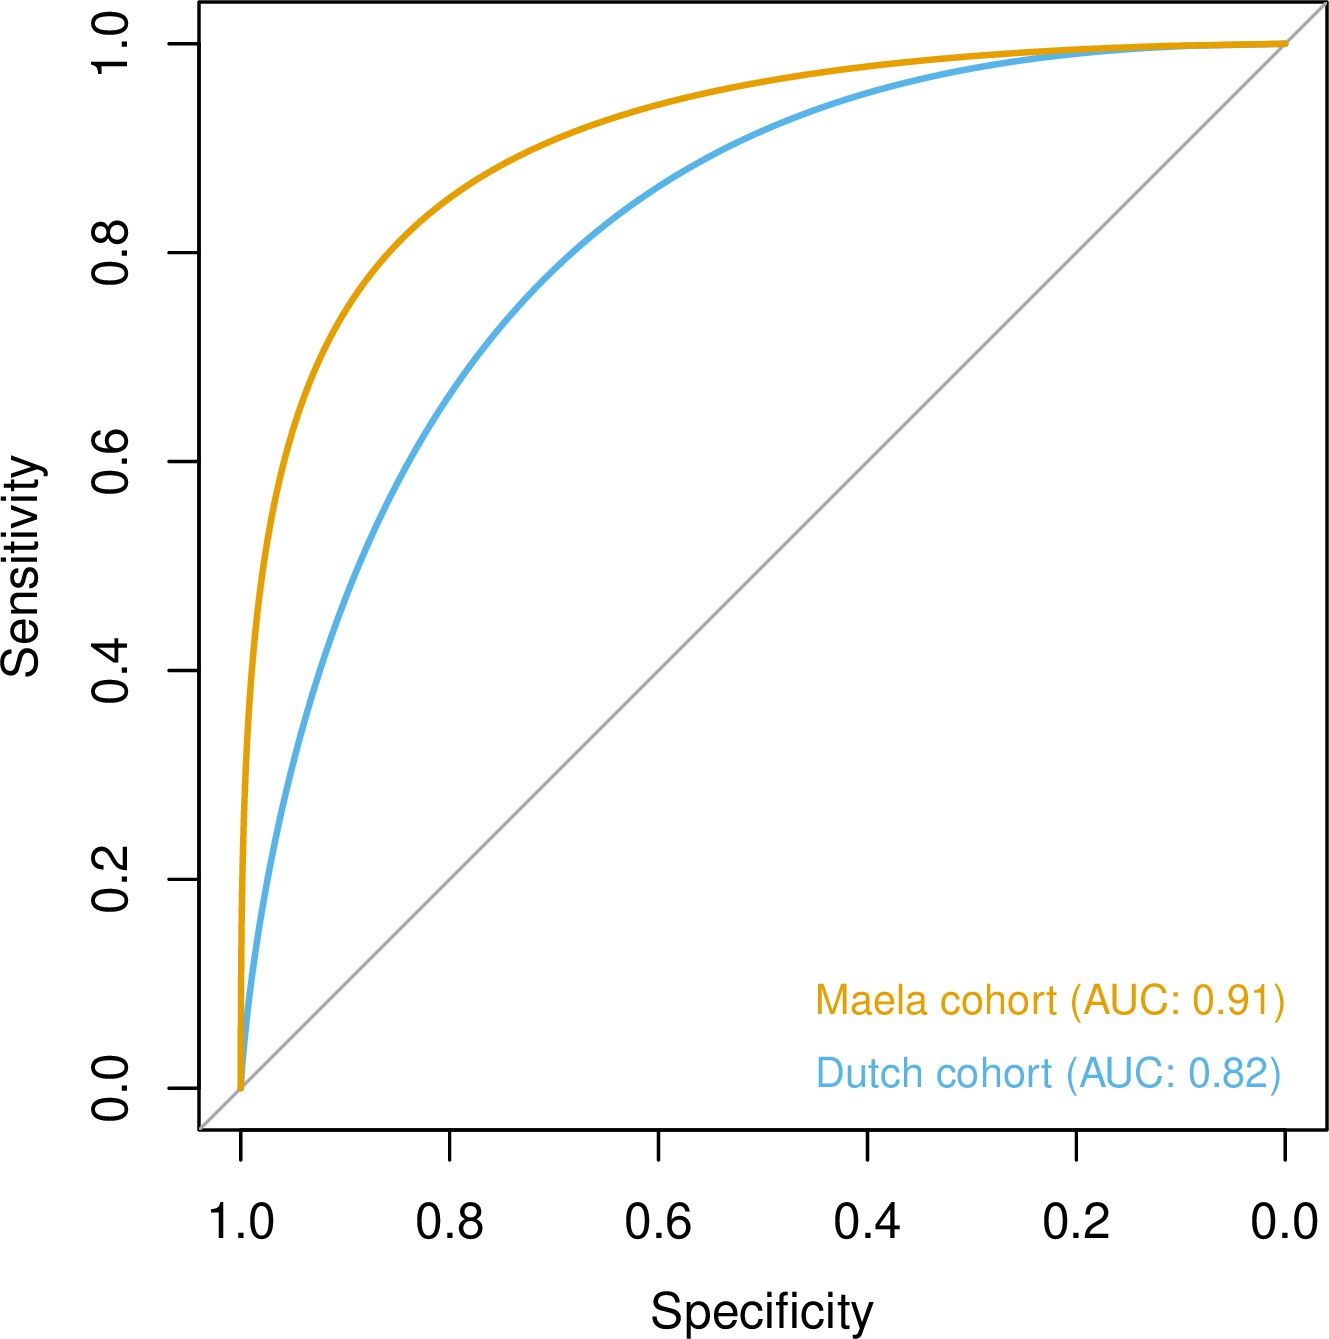
Prediction of host age from pan-genomic variation in each cohort.
The smoothed receiver-operating characteristic (ROC) curve based on a linear predictor (elastic net fitted to unitigs, with strains used as folds for cross-validation) is shown. Area under the curve (AUC) is 0.5 for no predictive ability and 1 for perfect prediction.
Figure 4 with 2 supplements
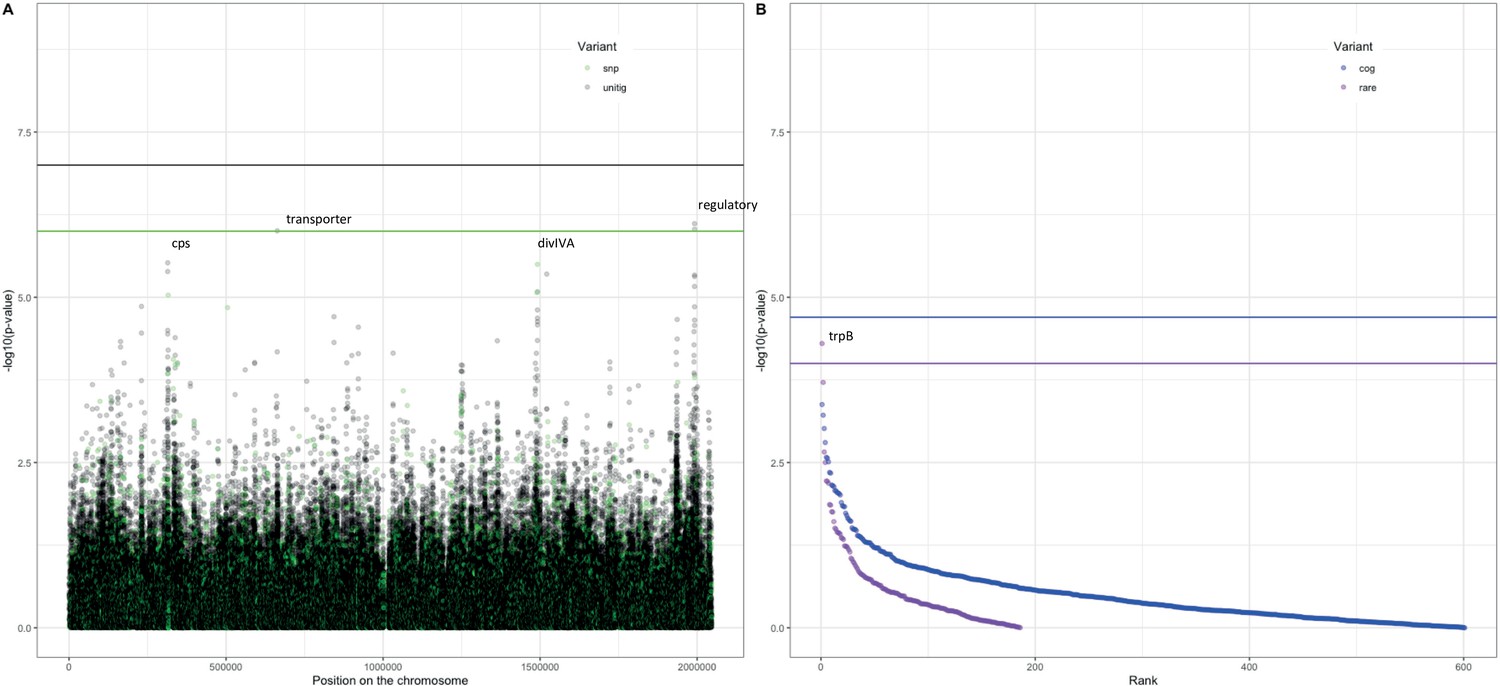
Association of variants after meta-analysis with carriage age 0–24 months.
(A) Minus log-transformed p-value on the y-axis and position of unitig and single-nucleotide polymorphism (SNP) variants on the S. pneumoniae genome on the x-axis (Manhattan plot). (B) Minus log-transformed p-value on the y-axis and sorted lowest to highest p-value for rare variant burden in genes (purple) and clusters of orthologous genes (COGs, blue) on the x-axis.
Figure 4—figure supplement 1
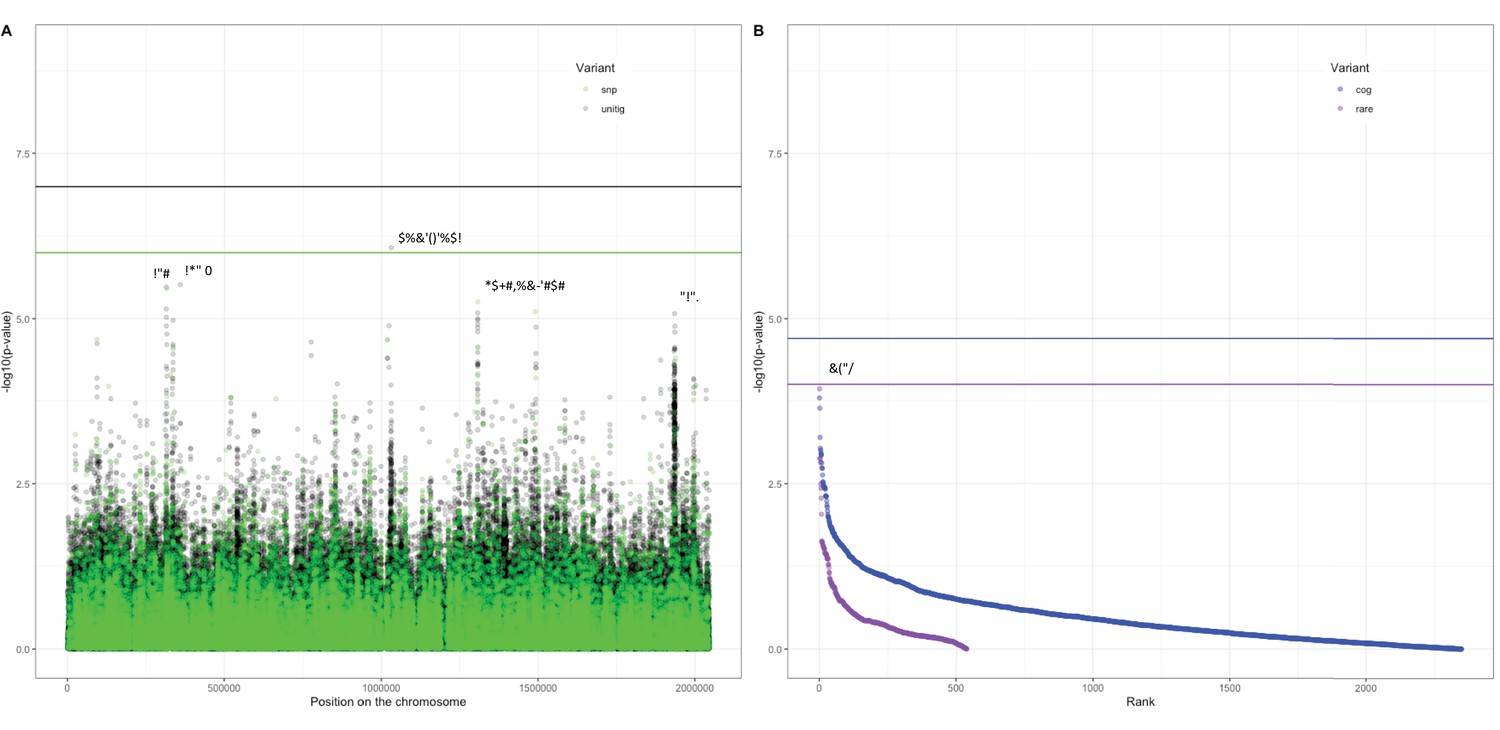
Association of variants in the Dutch cohort with carriage age 0–24 months.
(A) Minus log-transformed p-value on the y-axis and position of unitig and single-nucleotide polymorphism (SNP) variants on the S. pneumoniae genome on the x-axis (Manhattan plot). (B) Minus log-transformed p-value on the y-axis and sorted lowest to highest p-value for rare variant burden in genes (purple) and clusters of orthologous genes (COGs, blue) on the x-axis. Variants of interest have annotations added.
Figure 4—figure supplement 2
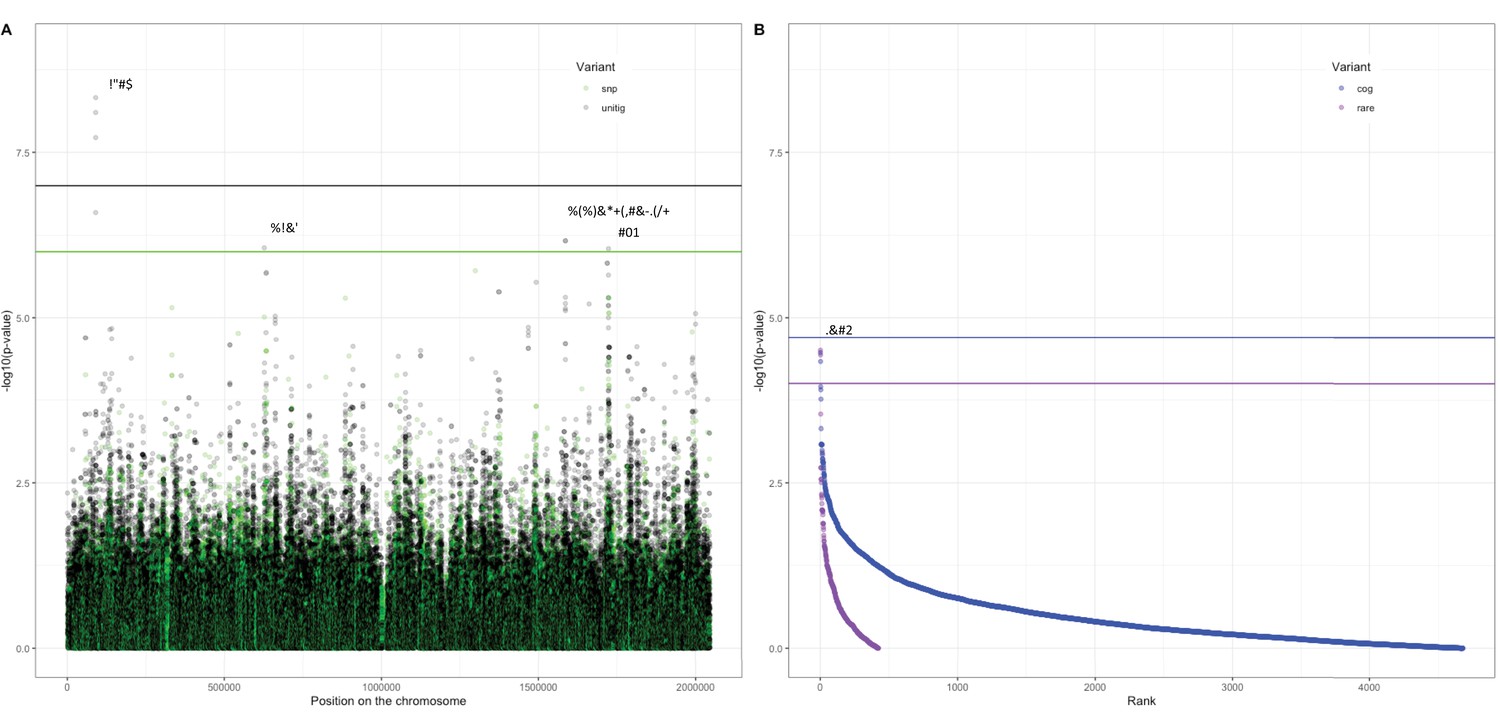
Association of variants in the Maela cohort with carriage age 0–24 months.
(A) Minus log-transformed p-value on the y-axis and position of unitig and single-nucleotide polymorphism (SNP) variants on the S. pneumoniae genome on the x-axis (Manhattan plot). (B) Minus log-transformed p-value on the y-axis and sorted lowest to highest p-value for rare variant burden in genes (purple) and clusters of orthologous genes (COGs, blue) on the x-axis. Variants of interest have annotations added.
Tables
Table 1
Chi-squared values for serotypes in the Dutch and Maela cohorts and the age group that the serotype is affiliated with.
| Serotype | Dutch cohort | Maela cohort | ||
|---|---|---|---|---|
| χ2 p-value | Age group | χ2 p-value | Age group | |
| Non-typeable | 0.188 | Adults | 3.0 × 10⁻⁴ | Adults |
| 19A | 0.089 | Children | 0.690 | Children |
| 11A | 0.591 | Children | 0285 | Adults |
| 19F | 1 | Adults | 0.131 | Children |
| 6C | 0.022 | Children | 1 | Adults |
| 6B | 0.099 | Children | 0.040 | Children |
| 35F | 0.279 | Children | 0.100 | Children |
| 3 | 2.5 × 10⁻⁵ | Adults | 0.129 | Adults |
| 6A | 0.709 | Children | 1 | Children |
| 23A | 1 | Adults | - | - |
| 15B | 0.023 | Children | - | - |
| 17F | 0.943 | Children | - | - |
| 23B | 0.727 | Children | - | - |
| 10A | 0.155 | Adults | - | - |
| 15C | 1.000 | Adults | - | - |
| 35B | 0.775 | Adults | - | - |
| 22F | 1 | Adults | - | - |
| 33F | 0.132 | Adults | - | - |
| 23F | - | - | 0.040 | Children |
| 14 | - | - | 0.949 | Children |
| 35C | - | - | 0.961 | Children |
| 34 | - | - | 0.690 | Children |
| 13 | - | - | 0.756 | Adults |
| 10B | - | - | 0.756 | Adults |
| 4 | - | - | 0.966 | Children |
| 5 | - | - | 0.710 | Adults |
| 33B | - | - | 1 | Children |
| 28F | - | - | 0.652 | Children |
| 19B | - | - | 0.710 | Adults |
| 7F | - | - | 0.971 | Children |
| 20 | - | - | 0.971 | Children |
| 18C | - | - | 1 | Adults |
-
χ2, chi-square; -, not applicable.
Table 2
Chi-squared values for strains in the Dutch and Maela cohorts and the age group that the strain is affiliated with.
| GPSC | Dutch cohort | Maela cohort | ||
|---|---|---|---|---|
| χ2 p-value | Age group | χ2 p-value | Age group | |
| 60 | 0.568 | Adults | 0.727 | Adults |
| 4 | 0.298 | Children | - | - |
| 3 | 0.392 | Adults | - | - |
| 7 | 0.858 | Children | - | - |
| 11 | 0.03 | Children | - | - |
| 35 and 36 | 0.617 | Adults | - | - |
| 29 | 0.049 | Children | - | - |
| 46 | 0.563 | Children | - | - |
| 75 | 0.666 | Adults | - | - |
| 19 | 0.978 | Children | - | - |
| 12 | 1.2 × 10⁻⁴ | Adults | - | - |
| 44 | 1 | Adults | - | - |
| 24 | 0.094 | Children | - | - |
| 49 | 1 | Children | - | - |
| 109 | 0.817 | Adults | - | - |
| 16 | 0.249 | Adults | - | - |
| 38 | 2.1 × 10⁻⁴ | Adults | - | - |
| 146 | 0.489 | Children | - | - |
| 99 | 1 | Children | - | - |
| 15 | 0.22 | Adults | - | - |
| 42 | - | - | 0.134 | Children |
| 1 | - | - | 0.276 | Adults |
| 28 | - | - | 0.110 | Children |
| 73 | - | - | 0.253 | Children |
| 10 | - | - | 0.777 | Adults |
| 9 | - | - | 1 | Children |
| 30 | - | - | 0.993 | Children |
| 20 | - | - | 7.0 × 10⁻³ | Adults |
| 128 | - | - | 0.042 | Children |
| 66 | - | - | 1 | Children |
| 87 | - | - | 0.450 | Adults |
| 63 | - | - | 1 | Adults |
| 45 | - | - | 0.129 | Adults |
| 130 | - | - | 1 | Adults |
| 74 | - | - | 0.040 | Adults |
| 149 | - | - | 0.686 | Adults |
| 8 | - | - | 0.364 | Children |
| 25 | - | - | 1 | Adults |
| 187 | - | - | 0.371 | Adults |
| 154 | - | - | 1 | Adults |
| 118 | - | - | 0995 | Children |
| 110 | - | - | 0.995 | Children |
| 106 | - | - | 0.073 | Adults |
-
χ2, chi-square; -, not applicable; GPSC, global pneumococcal sequence clusters.
Additional files
-
Supplementary file 1
Serotypes in the Dutch cohort, and the number of samples isolated from child or adult.
- https://cdn.elifesciences.org/articles/69244/elife-69244-supp1-v3.xlsx
-
Supplementary file 2
Number of samples for each of the vaccine serotypes found in the Dutch cohort.
- https://cdn.elifesciences.org/articles/69244/elife-69244-supp2-v3.txt
-
Supplementary file 3
Serotypes in the Maela cohort, and the number of samples isolated from child or mother.
- https://cdn.elifesciences.org/articles/69244/elife-69244-supp3-v3.xlsx
-
Supplementary file 4
Strains (global pneumococcal sequence clusters [GPSCs]) in the Dutch cohort, and the number of samples isolated from child or adult.
- https://cdn.elifesciences.org/articles/69244/elife-69244-supp4-v3.xlsx
-
Supplementary file 5
Strains (global pneumococcal sequence clusters [GPSCs]) in the Maela cohort, and the number of samples isolated from child or mother.
- https://cdn.elifesciences.org/articles/69244/elife-69244-supp5-v3.xlsx
-
Supplementary file 6
Serotypes and strains (global pneumococcal sequence clusters [GPSCs]) in the subset of the Maela cohort with unique samples only, and the number of samples isolated from child or mother for each, including percentages.
- https://cdn.elifesciences.org/articles/69244/elife-69244-supp6-v3.xlsx
-
Supplementary file 7
Serotypes and strains (global pneumococcal sequence clusters [GPSCs]) in the subset of the Maela cohort with unique paired (mother–child) samples only, and the number of samples isolated from child or mother for each, including percentages.
- https://cdn.elifesciences.org/articles/69244/elife-69244-supp7-v3.xlsx
-
Supplementary file 8
Unitigs associated with carriage age in the Dutch cohort when not corrected for population structure of the bacterial population (lrt-p-value).
The other columns provide parameters of the regression line for the unitig. The final column (annotation) provides the location of the unitig in the Streptococcus_pneumoniae_D39V genome.
- https://cdn.elifesciences.org/articles/69244/elife-69244-supp8-v3.txt
-
Supplementary file 9
Unitigs associated with carriage age in the Maela cohort when not corrected for population structure of the bacterial population (lrt-p-value).
The other columns provide parameters of the regression line for the unitig. The final column (annotation) provides the location of the unitig in the Streptococcus_pneumoniae_D39V genome.
- https://cdn.elifesciences.org/articles/69244/elife-69244-supp9-v3.txt
-
Supplementary file 10
Unitigs represent the top hits for carriage age after meta-analysis of both cohorts.
These unitigs are not found in any currently available reference genome, but are found to be upstream of an accessory Sec-dependent serine-rich glycoprotein adhesin in a subset of samples from these cohorts.
- https://cdn.elifesciences.org/articles/69244/elife-69244-supp10-v3.txt
-
Supplementary file 11
Statistics on the assembly of the sequences from the Dutch cohort.
- https://cdn.elifesciences.org/articles/69244/elife-69244-supp11-v3.txt
-
Supplementary file 12
Sample name, sample accession, lane name, and lane accession in the European Nucleotide Archive for the sequences from the Dutch cohort.
- https://cdn.elifesciences.org/articles/69244/elife-69244-supp12-v3.txt
-
Supplementary file 13
Sample name, sample accession, lane name, and lane accession in the European Nucleotide Archive for the sequences from the Maela cohort.
- https://cdn.elifesciences.org/articles/69244/elife-69244-supp13-v3.txt
-
Transparent reporting form
- https://cdn.elifesciences.org/articles/69244/elife-69244-transrepform1-v3.docx
Download links
A two-part list of links to download the article, or parts of the article, in various formats.
Downloads (link to download the article as PDF)
Open citations (links to open the citations from this article in various online reference manager services)
Cite this article (links to download the citations from this article in formats compatible with various reference manager tools)
Pneumococcal genetic variability in age-dependent bacterial carriage
eLife 11:e69244.
https://doi.org/10.7554/eLife.69244


