Mechanical overstimulation causes acute injury and synapse loss followed by fast recovery in lateral-line neuromasts of larval zebrafish
- Department of Otolaryngology, Washington University School of Medicine, United States
- Eaton-Peabody Laboratory, Massachusetts Eye and Ear, United States
- Department of Otolaryngology–Head and Neck Surgery, Harvard Medical School, United States
- Department of Neuroscience, Washington University School of Medicine, United States
- Department of Developmental Biology, Washington University School of Medicine, United States
Figures
Figure 1
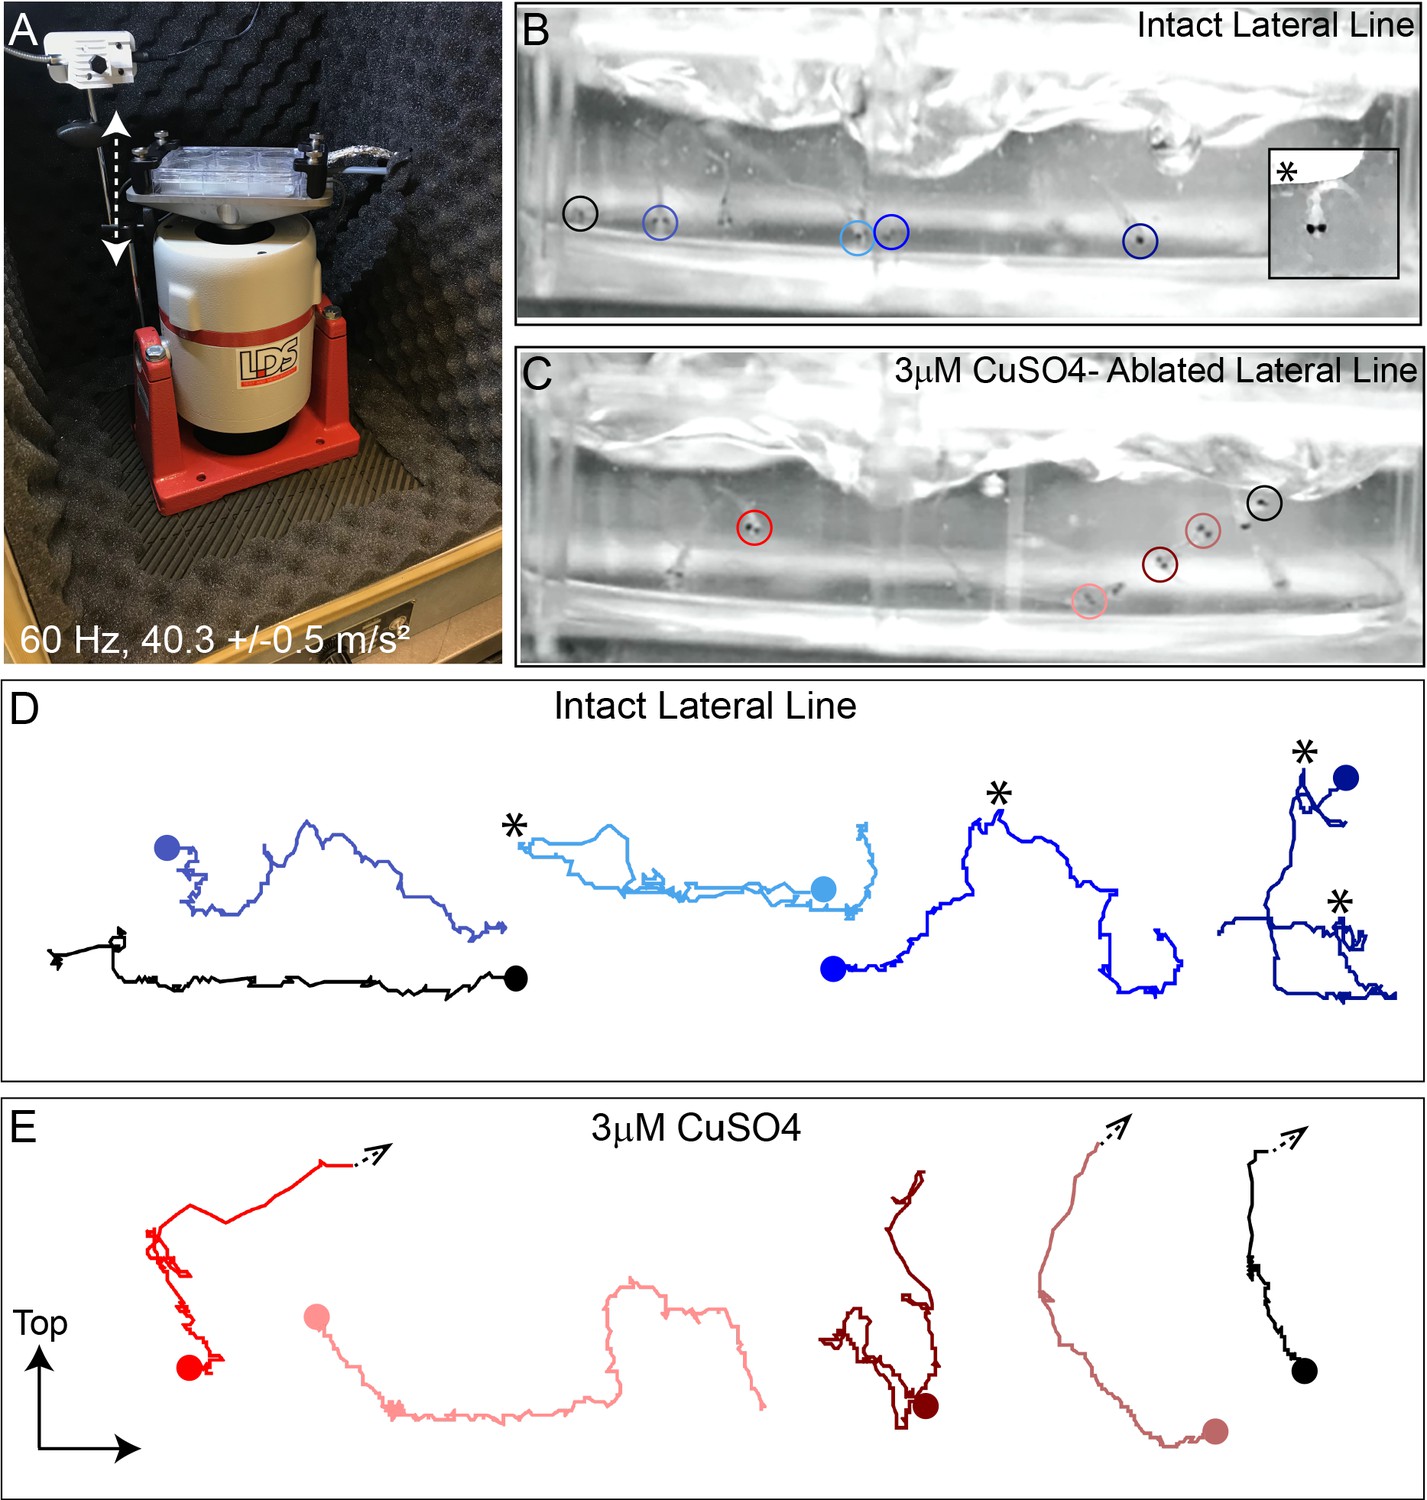
Intense water wave produced by shaker apparatus stimulates lateral-line hair cells and evokes a relevant behavior response.
(A) The apparatus: a magnesium head expander holding a 6-well dish mounted on a vertically oriented electrodynamic shaker housed inside a sound-attenuation chamber. The stimulus consisted of a 60 Hz vertical displacement of the plate (hatched arrows) driven by an amplifier and controlled by a modified version of the Eaton-Peabody Laboratory Cochlear Function Test Suite. (B,D) Swimming behavior of 7-day-old larvae during exposure to the wave stimulus. Traces in (D) represent tracking of corresponding circled fish over 500 ms (1000 fps/ 500 frames). Asterisks indicate a ‘fast escape’ response (B; inset). (C,E) Swimming behavior of larvae whose lateral-line neuromasts were ablated with low-dose CuSO4. Arrows in (E) indicate where a larva was swept into the waves and could no longer be tracked.
Figure 2 with 2 supplements
Morphological changes in pLL neuromast hair cells exposed to strong water wave stimulus.
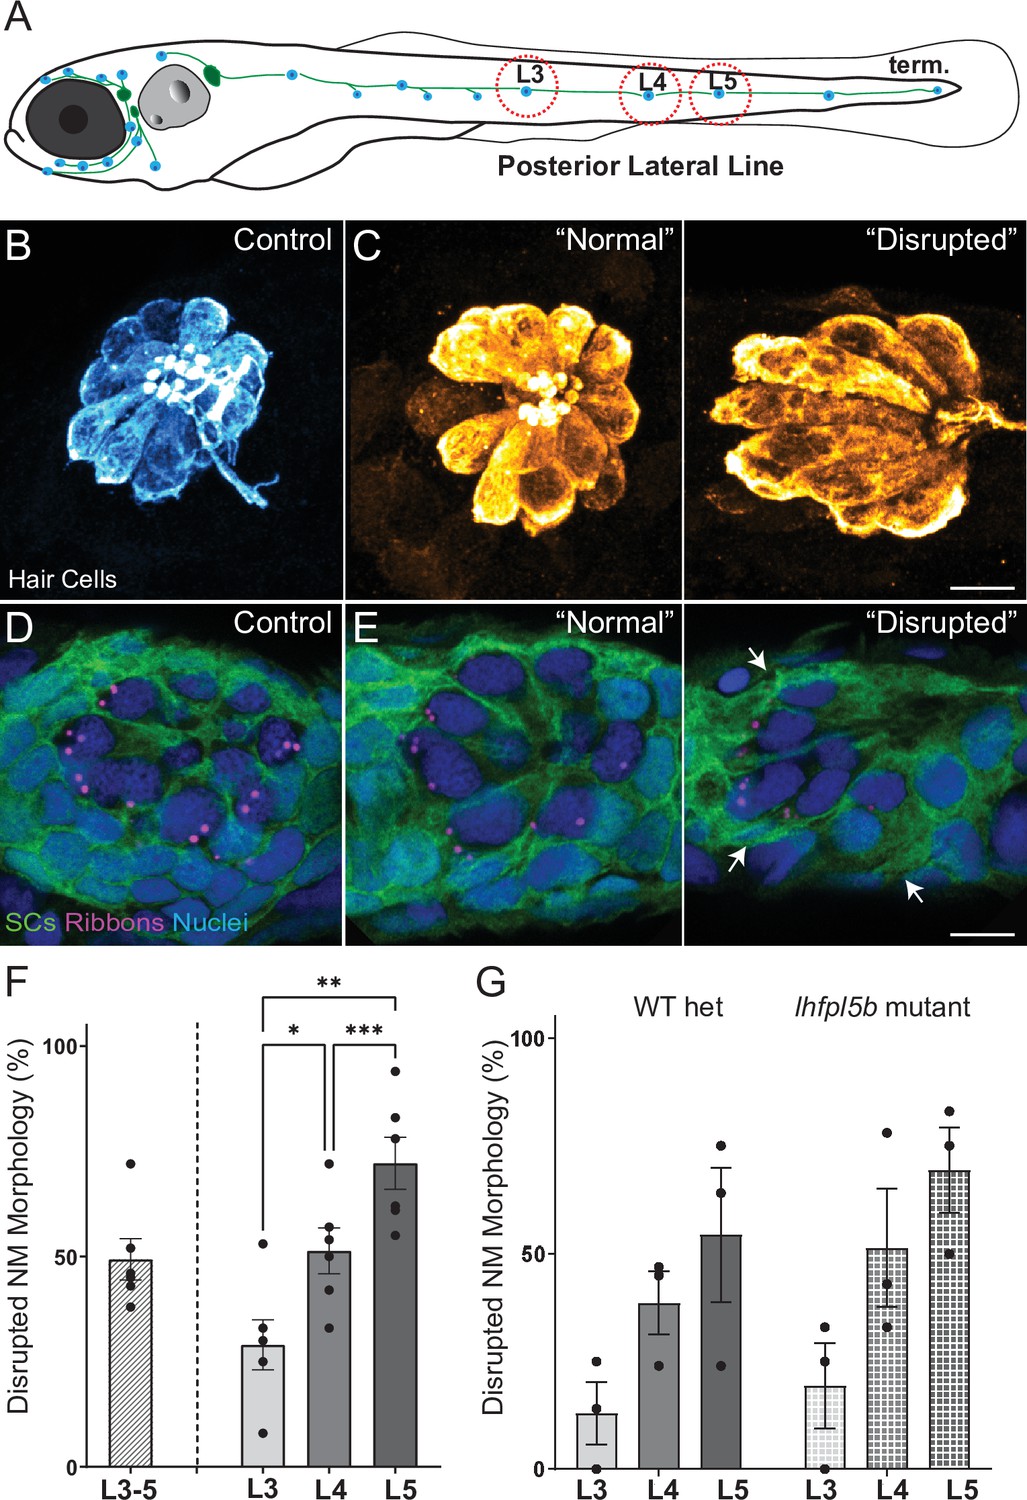
(A) Schematic of a larval zebrafish. Blue dots indicate neuromasts of the lateral-line organs; green lines indicate innervating afferent lateral-line nerves. pLL neuromasts L3, L4, and L5 were analyzed (dashed circles). (B–C) Maximum intensity dorsal top-down 2D projections of confocal images of control or stimulus-exposed neuromast hair cells (blue (B) or orange (C); Parvalbumin immunolabel). Exposed neuromast hair-cell morphology was categorized as ‘normal’ i.e. radial hair-cell organization indistinguishable from control or ‘disrupted’ i.e. asymmetric organization with the hair-cell apical ends oriented posteriorly. (D) Maximum intensity projections of supporting cells (SCs) expressing GFP (green), immunolabeled synaptic ribbons (magenta; Ribeye b) and all cell nuclei (blue; DAPI). Note that SCs underlying displaced hair cells also appear physically disrupted (indicated by white arrows). Scale bars: 5 µm (F) Average percentage of neuromasts with ‘disrupted’ morphology following mechanical stimulation. Each dot represents the percentage of disrupted neuromasts (NM) in a single experimental trial. Disrupted hair-cell morphology was place dependent, with neuromasts more frequently disrupted following sustained stimulus and when localized toward the posterior end of the tail (*p = 0.0386, **p = 0.0049, ***p = 0.0004) (G) Average percentage of exposed neuromasts (NM) with ‘disrupted’ morphology in lhfpl5b mutants, which lack mechanotransduction specifically in lateral-line hair cells, vs. heterozygous WT. lhfpl5b mutants show a similar gradient of neuromast disruption following mechanical injury as WT siblings. Error Bars = SEM.
-
Figure 2—source data 1
Summary of normal and disrupted neuromast counts following sustained and periodic stimulus exposures.
- https://cdn.elifesciences.org/articles/69264/elife-69264-fig2-data1-v2.xlsx
-
Figure 2—source data 2
ummary of normal and disrupted neuromast counts in lhfpl5b mutants and wildtype siblings following sustained stimulus exposure.
- https://cdn.elifesciences.org/articles/69264/elife-69264-fig2-data2-v2.xlsx
Figure 2—figure supplement 1
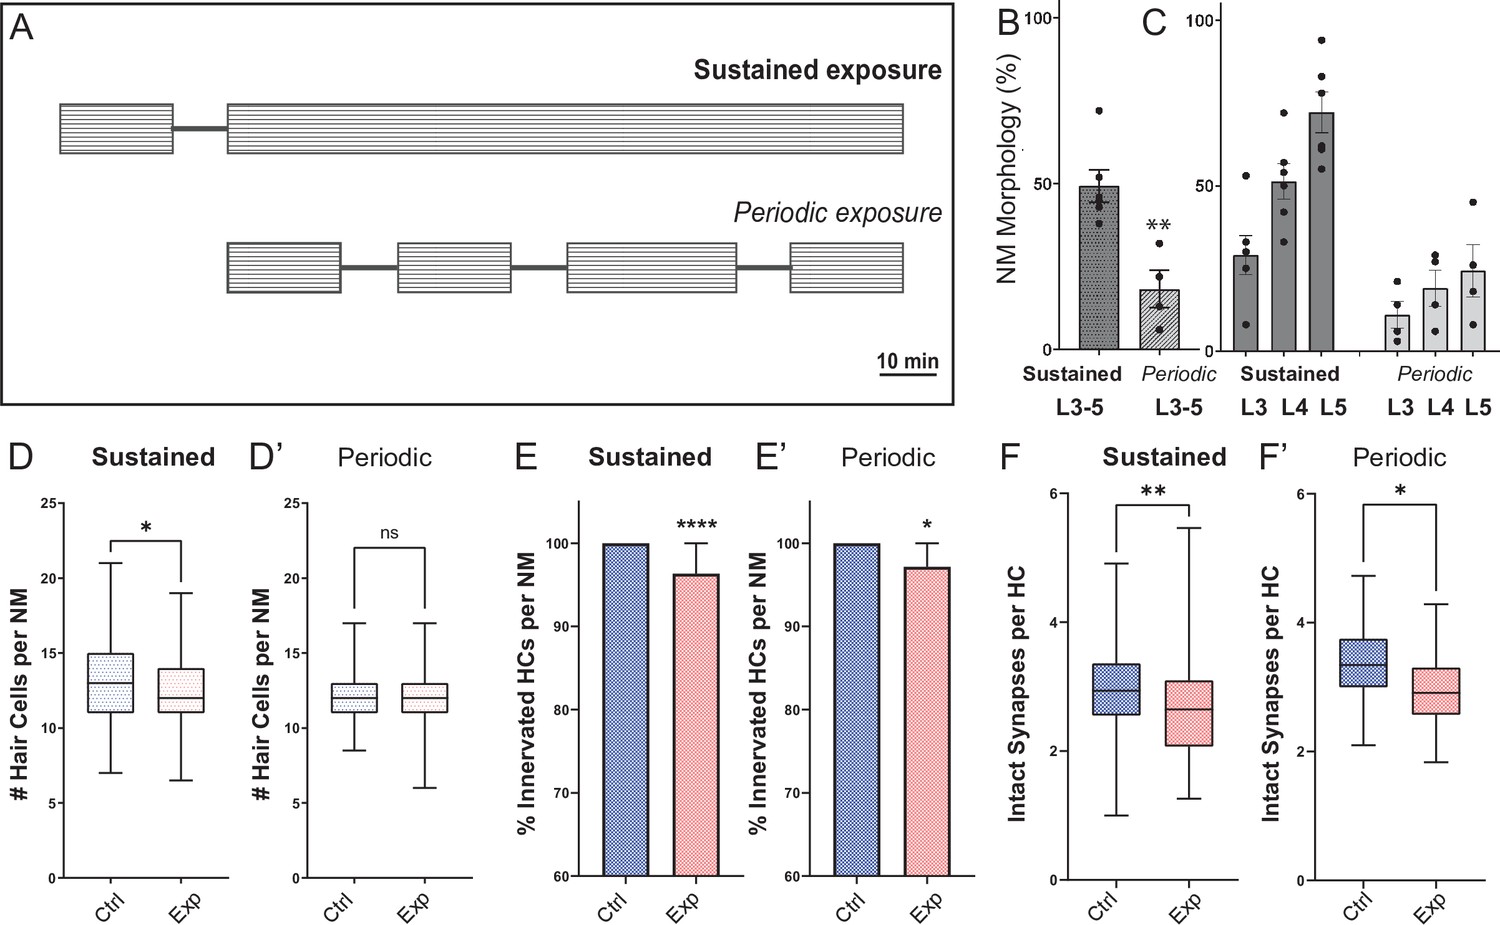
Fish exposed to periodic stimulus have less mechanical damage to neuromasts, but still show synapse loss.
(A) Schematic of the two exposure protocols. Sustained exposure was a 20 min pulse followed by 120 min uninterrupted mechanical overstimulation; periodic exposure was 90 min exposure with intermittent 10 min breaks totaling 120 min. (B) Periodic stimulus causes less neuromast disruption. Immediately following sustained exposure, 46 % of exposed neuromasts showed a ’disrupted’ phenotype, whereas following a periodic exposure only 17 % of the neuromasts appeared ‘disrupted’ (Unpaired t-test **p = 0.0034). (C) Position of the neuromast along the tail was also associated with vulnerability to disruption with both sustained and periodic stimulation. (D-F’) Measurements of hair-cell number, innervation, and synapse number averaged from individual fish (neuromasts L3-L5). (D-D’) Average hair cell number per neuromast following exposure. With periodic exposure, the number of hair cells was comparable to control (*p = 0.108 sustained, p = 0.7233 periodic). (E-E’) % of neuromast hair cells innervated (****p < 0.0001 sustained, p = 0.0156 periodic). (F-F’) Average number of intact synapses per neuromast. There is significant loss of synapses with both periodic and sustained exposures (**p = 0.0045 sustained, *p = 0.0236 periodic).
Figure 2—figure supplement 2
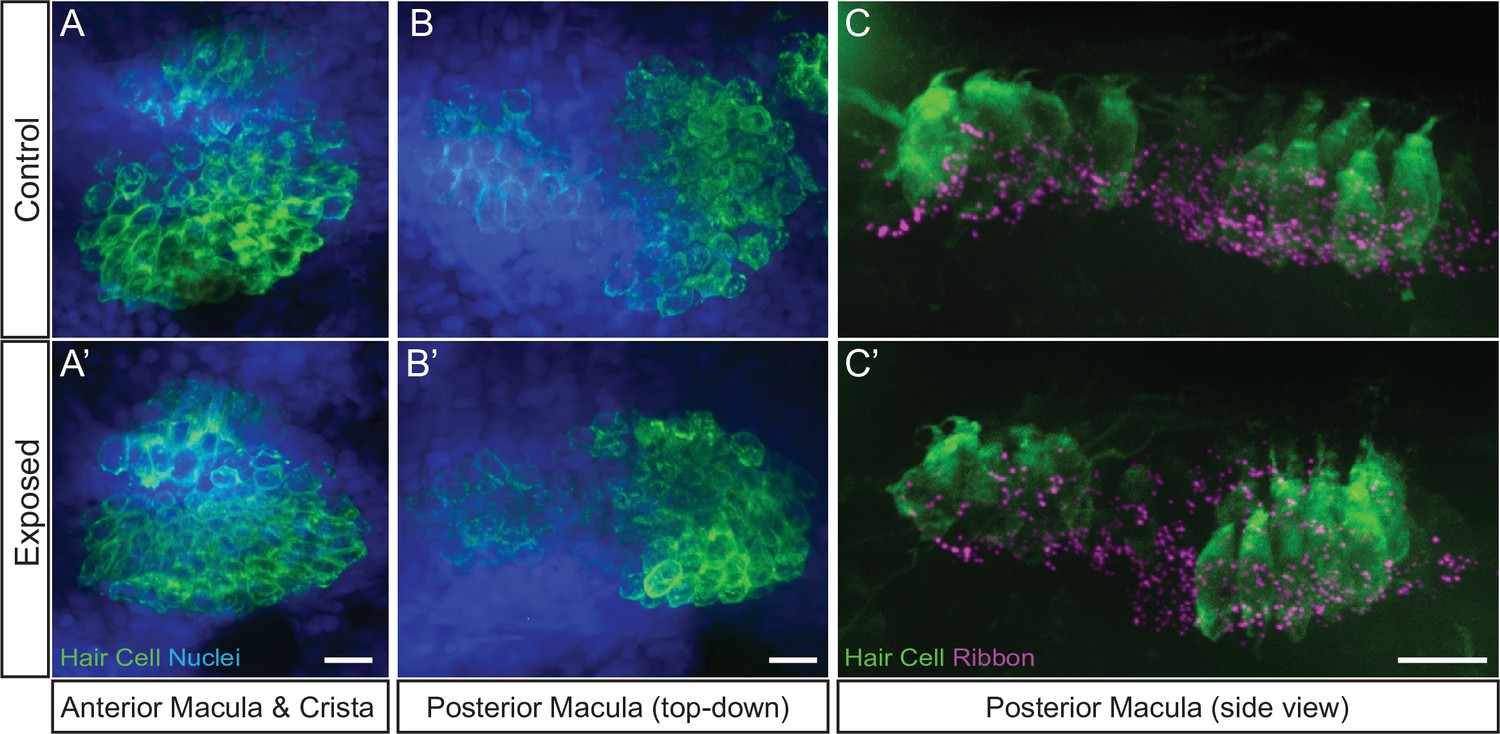
Hair-cell organs of the ear appeared undamaged in larvae exposed to sustained stimulus.
Representative maximum intensity images of hair cell organs in the ears of control (A–C) and larvae exposed to sustained strong water wave stimulus (A’)(-C’). Hair cells in A-B were immunolabeled with an antibody against Otoferlin; posterior macula in C were immunolabled with antibodies against Parvalbumin to label hair cells and CtBP to label synaptic ribbons. Scale bars: 10 µm.
Figure 3

Hair-cell loss and de-innervation is specific to ‘disrupted’ neuromasts.
(A–C) Representative maximum intensity projection images of control (A) or exposed lateral line neuromasts with ‘normal’ (B) or ‘disrupted’ (C) morphology immediately following sustained strong wave exposure (0 hr). Synaptic ribbons (magenta; Ribeye b) and hair cells (blue; Parvalbumin) were immunolabled. Afferent neurons were expressing GFP. Scale bar: 5 µm (D) Hair-cell number per neuromast immediately post exposure. A significant reduction in hair-cell number was observed (**Adj p = 0.0019) and was specific to ‘disrupted’ neuromasts (Adj p = 0.3859 normal, ****Adj p < 0.0001 disrupted). Pink box plot (Exp) represents pooled exposed neuromasts, while gray (Norm) and red (Dis) plots represent neuromasts parsed into normal and disrupted groups. Numbers beneath each plot indicate the number of neuromasts per group. Whiskers = min to max (E) Differences of least squares means in hair-cell number per neuromast between groups. Bars represent 95 % confidence interval (CI). (F) Percentage of neuromast hair cells innervated by afferent nerves. Numbers within each bar indicate the number of neuromasts per group. A significant portion of neuromast hair cells lacked afferent innervation following exposure (****Adj p < 0.0001). Hair cells lacking afferent innervation were specifically observed in disrupted neuromasts (Adj p = 0.7503 normal, ****Adj p < 0.0001 disrupted). (G) Differences of least squares means in % hair cells innervated per neuromast between groups. Bars represent 95% CI.
-
Figure 3—source data 1
Raw data and statistical analysis of hair-cell counts and innervation immediately following sustained stimulus exposure.
- https://cdn.elifesciences.org/articles/69264/elife-69264-fig3-data1-v2.xlsx
Figure 4
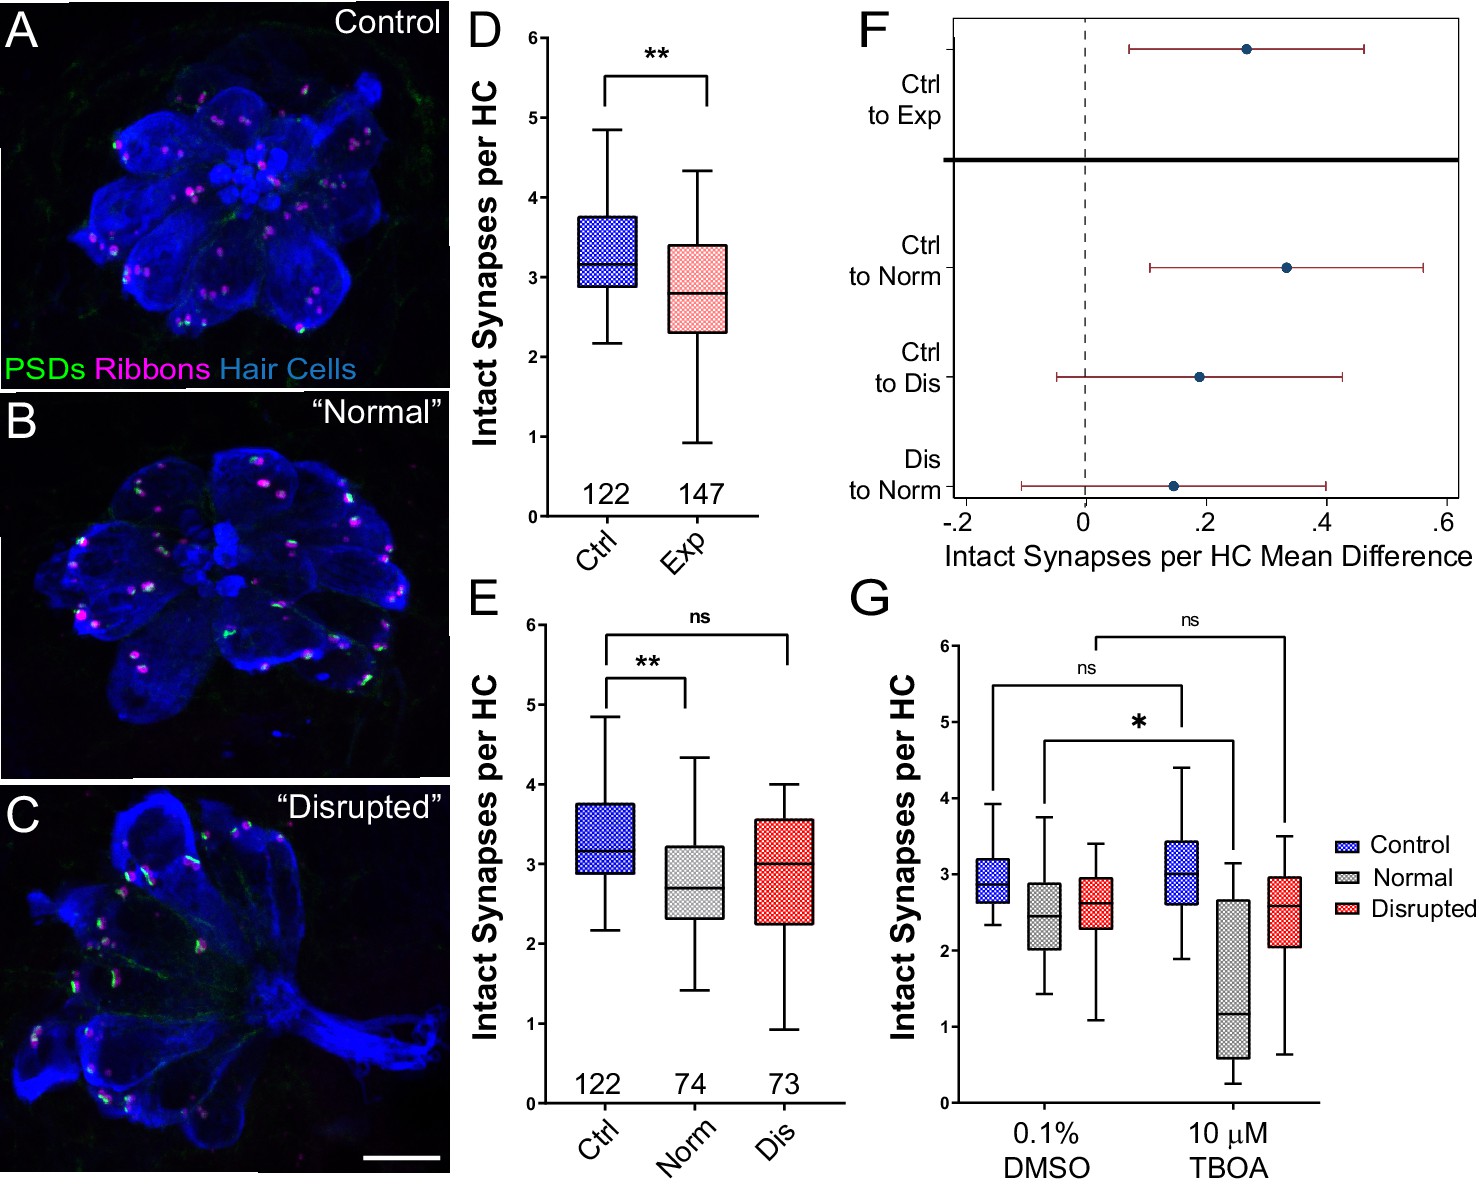
Significant hair-cell synapse loss is observed in ‘normal’ neuromasts following mechanical overstimulation and exacerbated by blocking glutamate uptake.
(A–C) Representative maximum intensity projection images of unexposed (A), or stimulus exposed lateral-line neuromast with ‘normal’ (B) or ‘disrupted’ (C) morphology. Synaptic ribbons (magenta; Ribeye b), PSDs (green; MAGUK) and hair cells (blue; Parvalbumin) were immunolabled. Scale bar: 5 µm (D–E) Intact synapses per neuromast hair cell. Pink box plot in D (Exp) represents pooled exposed neuromasts while, in E, gray (Norm) and red (Dis) plots represent neuromasts parsed into normal and disrupted groups. Whiskers = min to max. The average number of intact synapses per hair cell was significantly reduced in exposed neuromasts (D; **Adj p = 0.0078); when parsed, this reduction was significant in the ‘normal’ exposure group relative to control (E; **Adj p = 0.0043 normal, Adj p = 0.1207 disrupted). (F) Differences of least squares means in number of intact synapses per hair cell between groups. Bars represent 95% CI. (G) The number of intact synapses per hair cell in larvae co-treated with TBOA, to block glutamate clearance, or drug carrier alone during exposure. Synapse loss was significantly greater in ‘normal’ neuromasts co-exposed to TBOA compared to fish co-exposed to the drug carrier alone (Two-way ANOVA. *p < 0.0187).
-
Figure 4—source data 1
Raw data and statistical analysis of synapse counts immediately following sustained stimulus exposure.
- https://cdn.elifesciences.org/articles/69264/elife-69264-fig4-data1-v2.xlsx
Figure 5
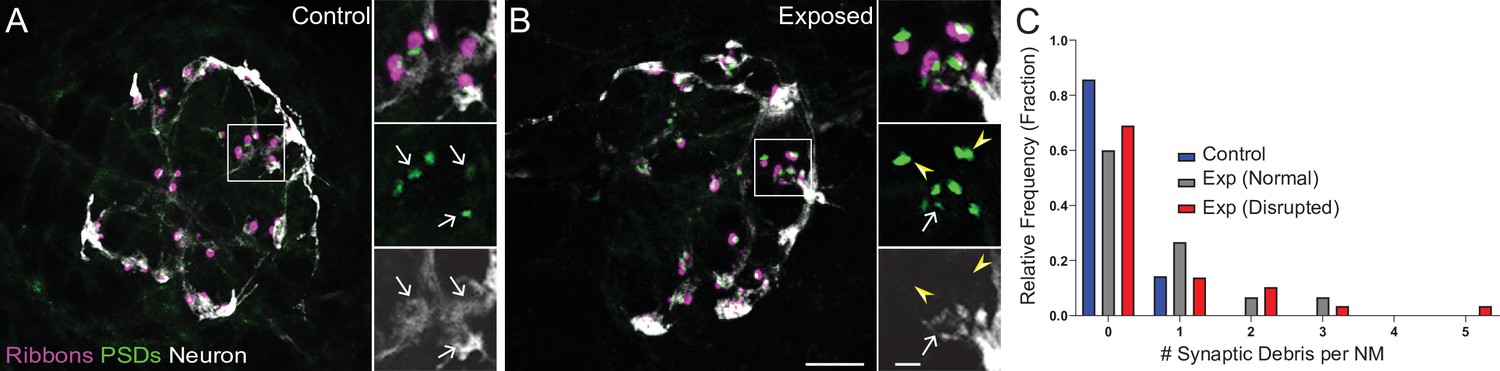
Mechanically overstimulated neuromasts showed retracted neurites and detached synaptic debris.
(A–B) Representative images of control (A) and exposed (B) neuromasts. Synaptic ribbons (magenta; Ribeye b) and PSDs (green; MAGUK) were immunolabeled; hair cells were also immunolabeled, but not shown for clarity. Afferent neurons (white) were labeled with GFP. Insets: Arrows indicate intact synapses adjacent to afferent neurons; arrowheads (B) indicate synaptic debris. Scale bars: 5 µm (main panels), 1 µm (insets). (C) Frequency histogram of observed synaptic debris per neuromast (NM). While control neuromasts occasionally had one detached synapse, exposed neuromasts were observed that had up to five detached synapses.
Figure 6
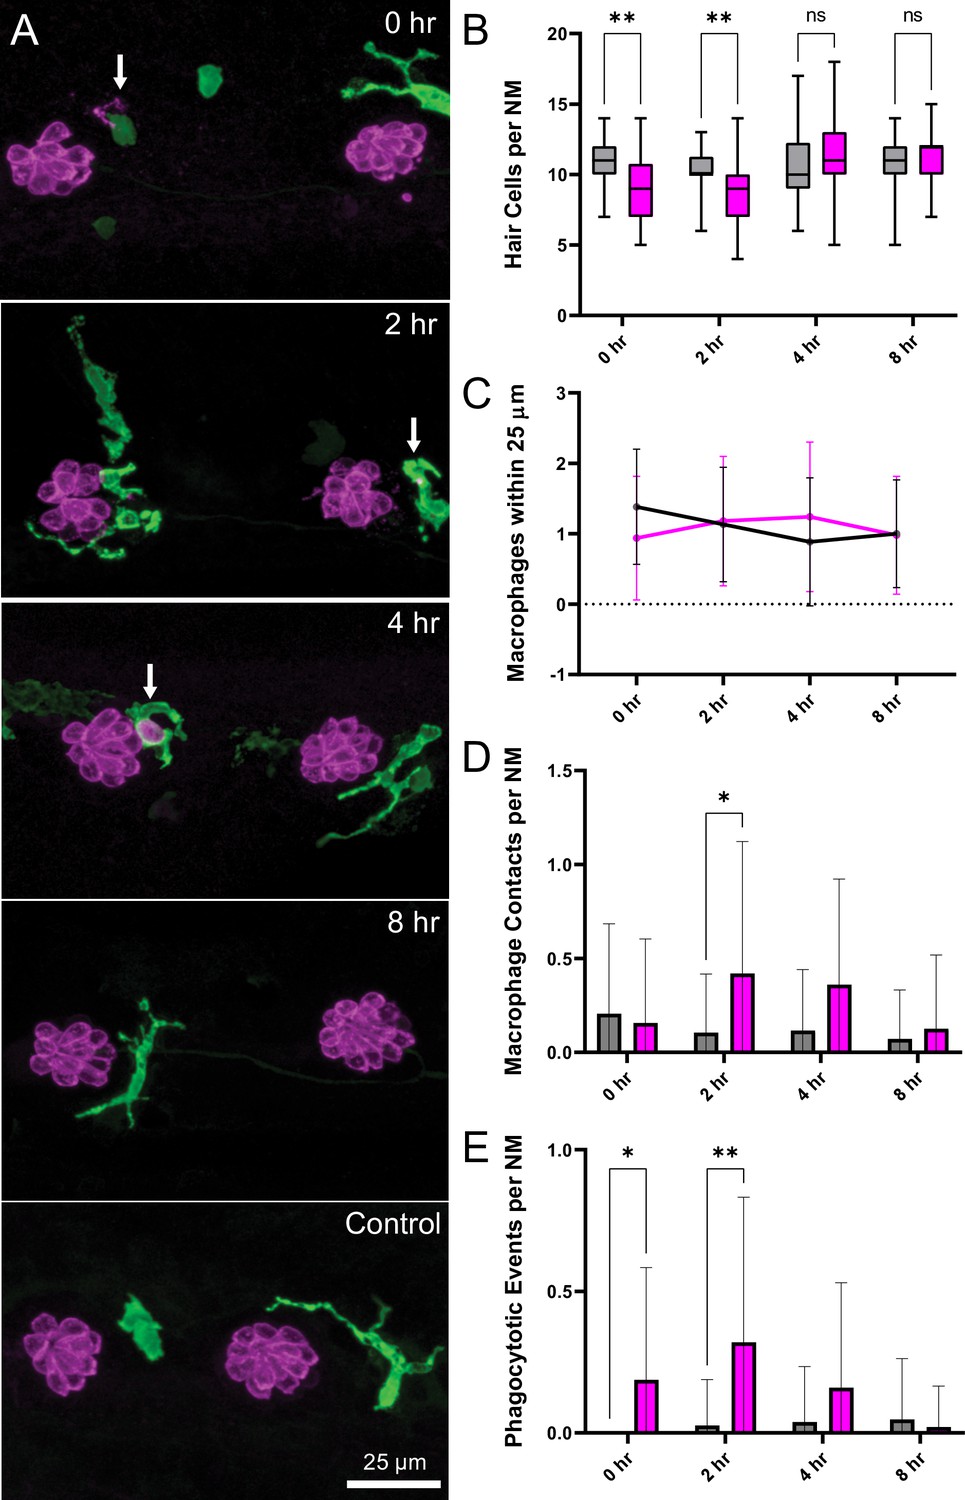
Macrophage response to mechanical overstimulation of lateral line hair cells.
Experiments used Tg(mpeg1:yfp) fish that express YFP under regulation of the macrophage-specific mpeg1 promoter. All images and data were collected from the two distal-most neuromasts of the posterior lateral line (Figure 2A; term). (A) Macrophages (green) responded to mechanical injury by entering neuromasts, contacting hair cells and internalizing Otoferlin-immunolabeled debris (arrows, magenta). Images show examples of macrophage behavior at different time points after noise trauma. (B) Quantification of hair-cell number in the terminal neuromasts. Hair-cell number was significantly reduced at 0–2 hr after noise exposure (Mixed-effects analysis: **p < 0.003). (C) Quantification of macrophages within a 25 µm radius of the neuromasts at 0–8 hr after noise injury. Most neuromasts possessed 1–2 nearby macrophages and this number was not changed by noise exposure. (D) Quantification of direct contacts between macrophages and hair cells. The number of macrophage-hair cell contacts was counted at each survival time after noise exposure and normalized to the total number of sampled neuromasts. Increased levels of contact were observed at 2 and 4 hr after noise (*p = 0.0243). (E) Quantification of phagocytosis as a function of post-noise survival time. The numbers of macrophages that had internalized otoferlin-labeled material were counted at each time point and normalized to the total number of sampled neuromasts. The percentage of macrophages that contained such debris was significantly increased at 0–2 hr after strong water wave stimulus (*p = 0.0465; **p = 0.0013). Data were obtained from 26 to 50 neuromasts/time point. Error Bars = SD.
Figure 7
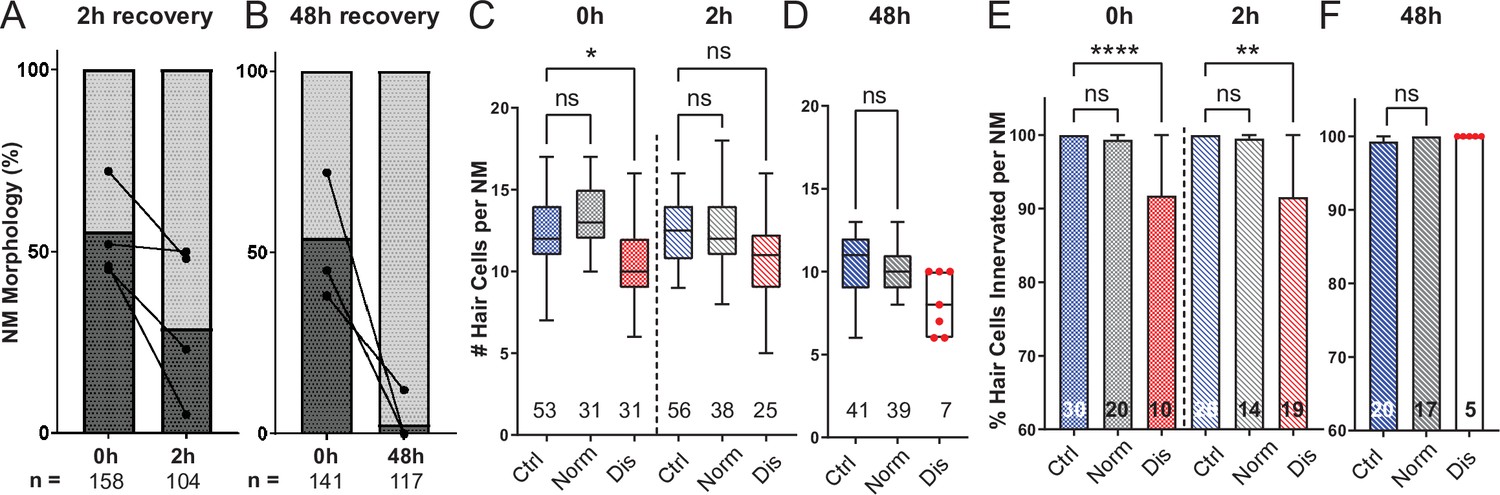
Mechanically overstimulated neuromasts recover hair-cell morphology, hair-cell number, and innervation.
(A,B) Average percentage of exposed neuromasts with ‘normal’ vs. ‘disrupted’ morphology following exposure. Each dot represents the percentage of disrupted neuromasts (L3–L5) in a single experimental trial; lines connect data points from the same cohort of exposed fish following 2 hr (A) or 48 hr (B) recovery. (C,D) Multilevel analysis of hair-cell number per neuromast immediately (0 hr) post-exposure or after 2 or 48 hr recovery. Numbers beneath each plot indicate the number of neuromasts per group. Whiskers = min to max. Morphologically ‘disrupted’ neuromasts have significantly fewer hair cells at 0 hr but not 2 hr following exposure C; *Adj p = 0.0321 (0h disrupted), Adj p = 0.1875 (2h disrupted). Most exposed neuromasts were morphologically ‘normal’ following 48 hr recovery and had a comparable number of hair cells relative to control (D; Adj p = 0.4443). (E,F) The percentage of ‘disrupted’ neuromast hair cells lacking afferent innervation was significant following 0 hr and 2 hr recovery (E; ****Adj p < 0.0001 (0h disrupted), **Adj p = 0.0016 (2h disrupted)). All hair cells were fully innervated following 48 hr recovery, including the few neuromasts with ‘disrupted’ morphology (F; aligned red dots).
-
Figure 7—source data 1
Summary of normal and disrupted neuromast counts following sustained exposure with 0, 2, or 48 hr recovery.
- https://cdn.elifesciences.org/articles/69264/elife-69264-fig7-data1-v2.xlsx
-
Figure 7—source data 2
Raw data and statistical analysis of hair-cell counts and innervation following sustained stimulus exposure with 0 and 2 hr recovery.
- https://cdn.elifesciences.org/articles/69264/elife-69264-fig7-data2-v2.xlsx
-
Figure 7—source data 3
Raw data and statistical analysis of hair-cell counts and innervation following sustained stimulus exposure with 0 and 48 hr recovery.
- https://cdn.elifesciences.org/articles/69264/elife-69264-fig7-data3-v2.xlsx
Figure 8
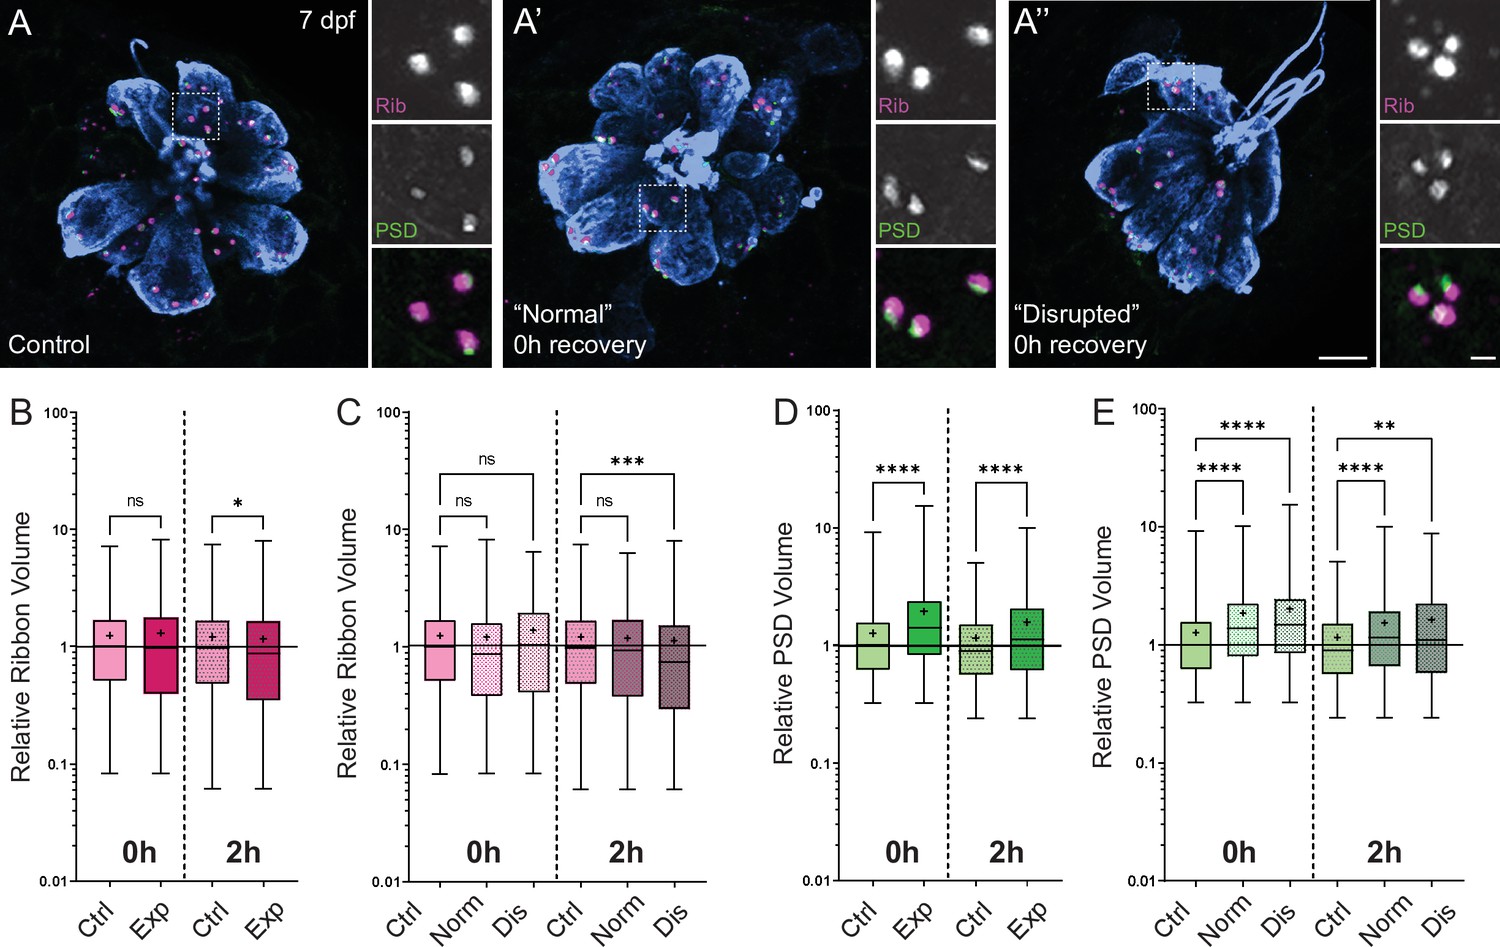
Changes in synaptic ribbon and PSD sizes following sustained mechanical overstimulation.
(A-A’’) Representative images of control (A) and exposed (A’, A”) neuromasts. Synaptic ribbons (magenta; Ribeye b), PSDs (green; MAGUK), and hair cells (blue, Parvalbumin) were immunolabeled. Scale bars: 5 µm (main panels), 1 µm (insets). (B–E) Box and whisker plots of relative synapse volumes normalized to 0 hr control. Whiskers indicate the min. and max. values; ‘+’ indicates the mean value, horizontal lines indicate the relative median value of the control. (B) Ribbon volume appeared comparable to control immediately following exposure but was reduced 2 hr after exposure (*p = 0.0195). (C) Significant reduction in ribbon size relative to control was specific to disrupted neuromasts (Kruskal-Wallis test: ***p = 0.0004 (2h)). (D) Significantly larger PSDs were observed both immediately and 2 hr following exposure (****p < 0.0001). (E) Enlarged PSDs were present in both ‘normal’ and ‘disrupted’ exposed neuromasts, with a greater enlargement observed 0 hr post-exposure (Kruskal-Wallis test: ****p < 0.0001 (0h); ***p = 0.0001, **p = 0.0024 (2h)).
Figure 9 with 2 supplements
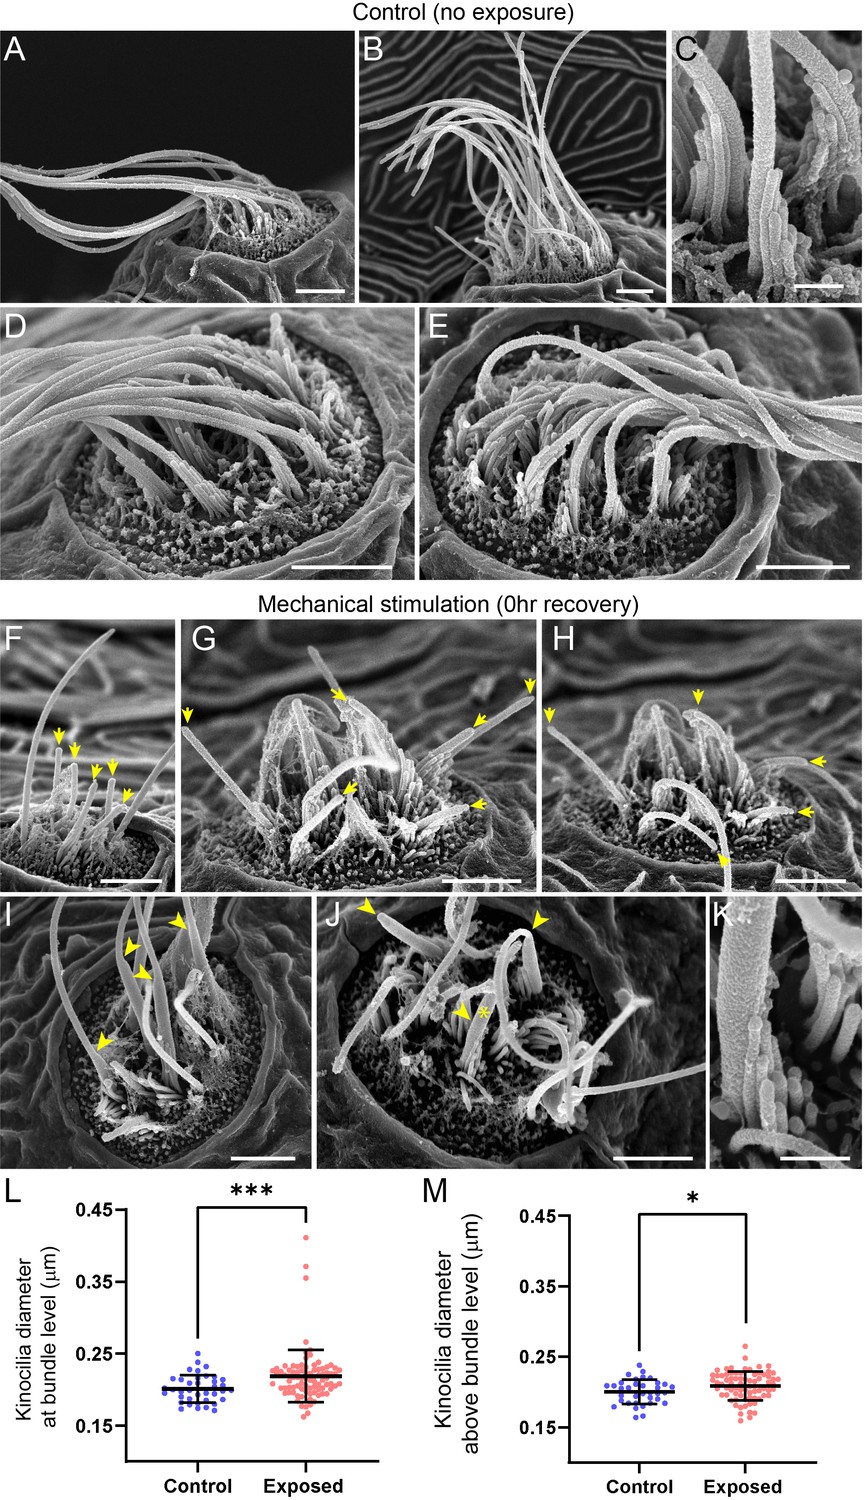
Scanning electron microscopy imaging of neuromasts following mechanical injury reveals disorganized hair-cell stereocilia bundles and damaged kinocilia.
(A–E) Representative images of tail neuromasts of control fish larvae. Each hair cell carries a kinocilium, which is visibly thicker than its neighboring actin-filled, mechanosensitive stereocilia: see panel C featuring both structures at higher magnification (the kinocilium diameter is 220 nm, while stereocilia measured 90–110 nm). The kinocilia of control neuromasts are long (10–15 µm) and bundled together, while the stereocilia bundles have an apparent staircase arrangement. (F–K) Representative images of damaged tail neuromasts immediately following noise exposure featuring short (F-H, yellow arrows), disorganized (G, H), and swollen (I-K, yellow arrowheads) kinocilia, and disorganized stereocilia. (K) Same stereocilia bundle as in J marked with an asterisk at higher magnification to highlight the difference in the diameter of the kinocilium (360 nm) and neighboring stereocilia (85–100 nm) for noise exposed hair cells, as compared to the control hair cells in C. Scale bars: A, B, D-J – 2 µm; C, K – 500 nm. (L–M) Kinocilia diameter at bundle level (L; Mann Whitney test ***p = 0.0007) and 3–5 µm above bundle level (M; Welch’s t test *p = 0.0243). Exposed NM data in L were not normally distributed (D'Agostino-Pearson test ****p < 0.0001). Error Bars = SD.
Figure 9—figure supplement 1
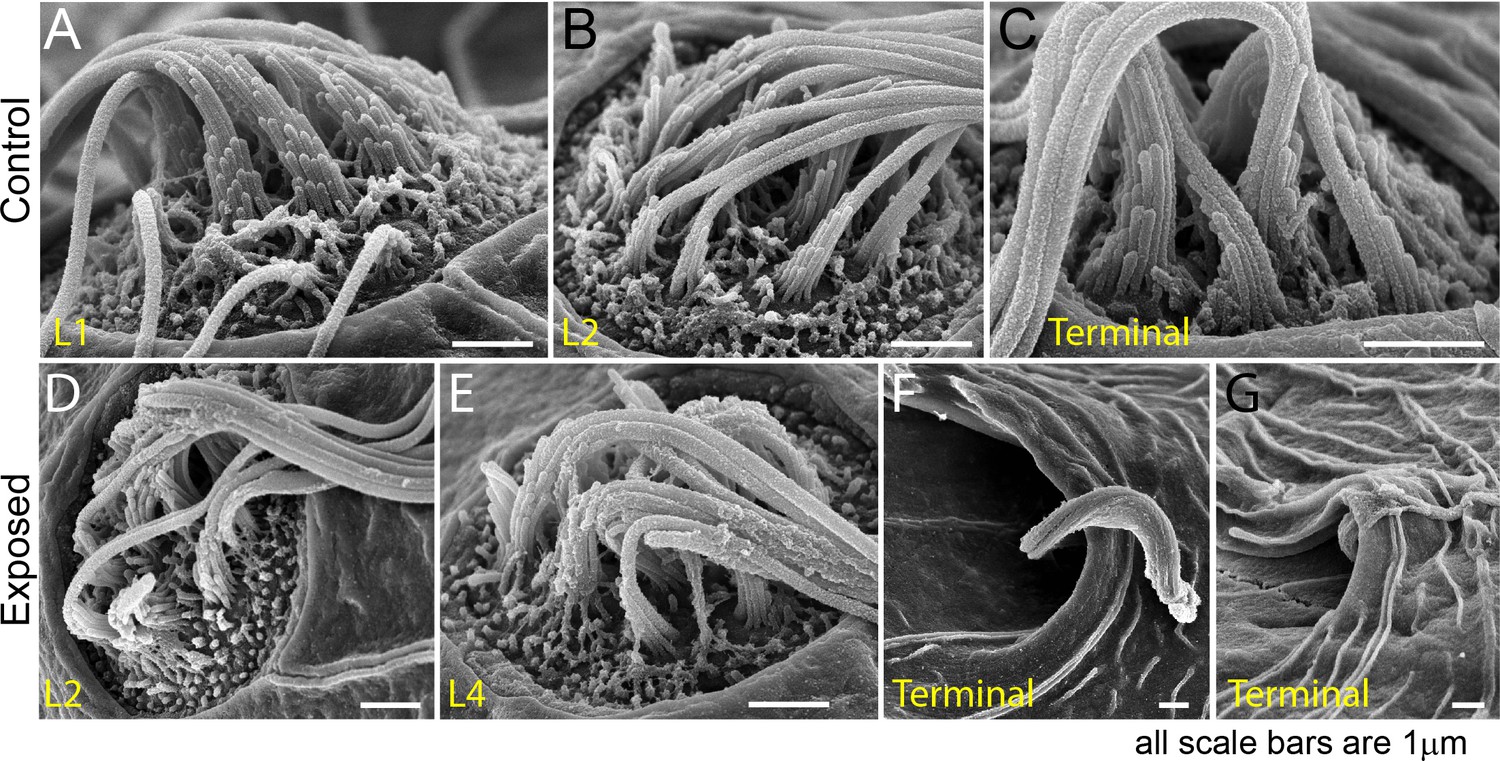
Scanning electron microscopy imaging of tail neuromasts following mechanical injury confirms the damage is more prominent for posterior neuromasts.
(A–C) Representative images of tail neuromasts of control fish larvae, presented as they are positioned on the larva: L1, L2 and terminal neuromasts. Each hair cell carries a tubulin-based primary cilium (kinocilium), which is thicker than the multiple mechanosensitive stereocilia arranged in a staircase. (D–G) Examples of tail neuromasts immediately following sustained stimulus exposure, presented as they are positioned on the larva: L2, L4, and two terminal neuromasts highlighting different levels of damage, with much more pronounced damage evident on terminal neuromasts. Scale bars: 1 µm.
Figure 9—figure supplement 2
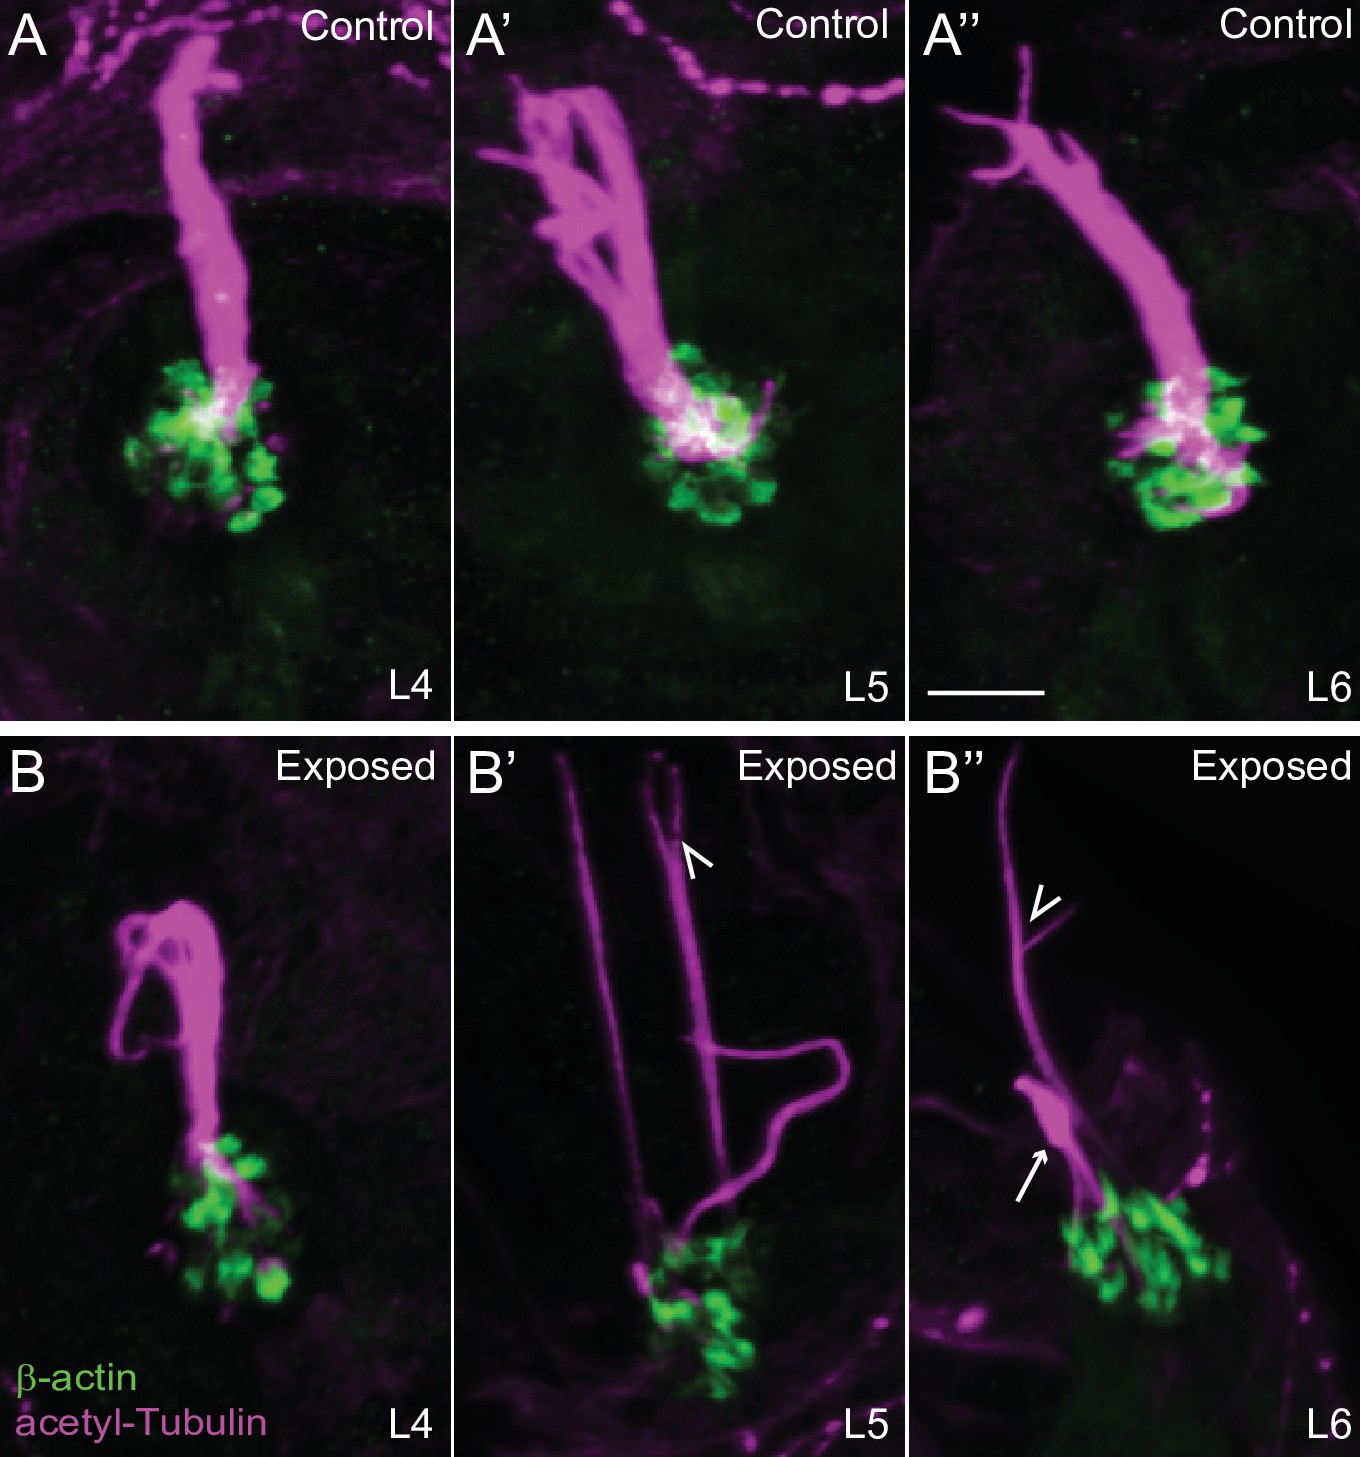
Confocal images show damaged kinocilia following mechanical injury.
Representative confocal images of hair cell kinocilia (acetylated tubulin immunolabel; magenta) and stereocilia (βactin-GFP; green) in control (A-A’’) and exposed (B-B’’) larval neuromast L4-6 immediately following sustained strong water wave stimulus. Kinocilia appear as intact bundles in the control neuromasts. Arrow indicated kinocilial swelling, arrowheads indicate split kinocilia in the exposed neuromasts. Scale bar: 5 µm.
Figure 10
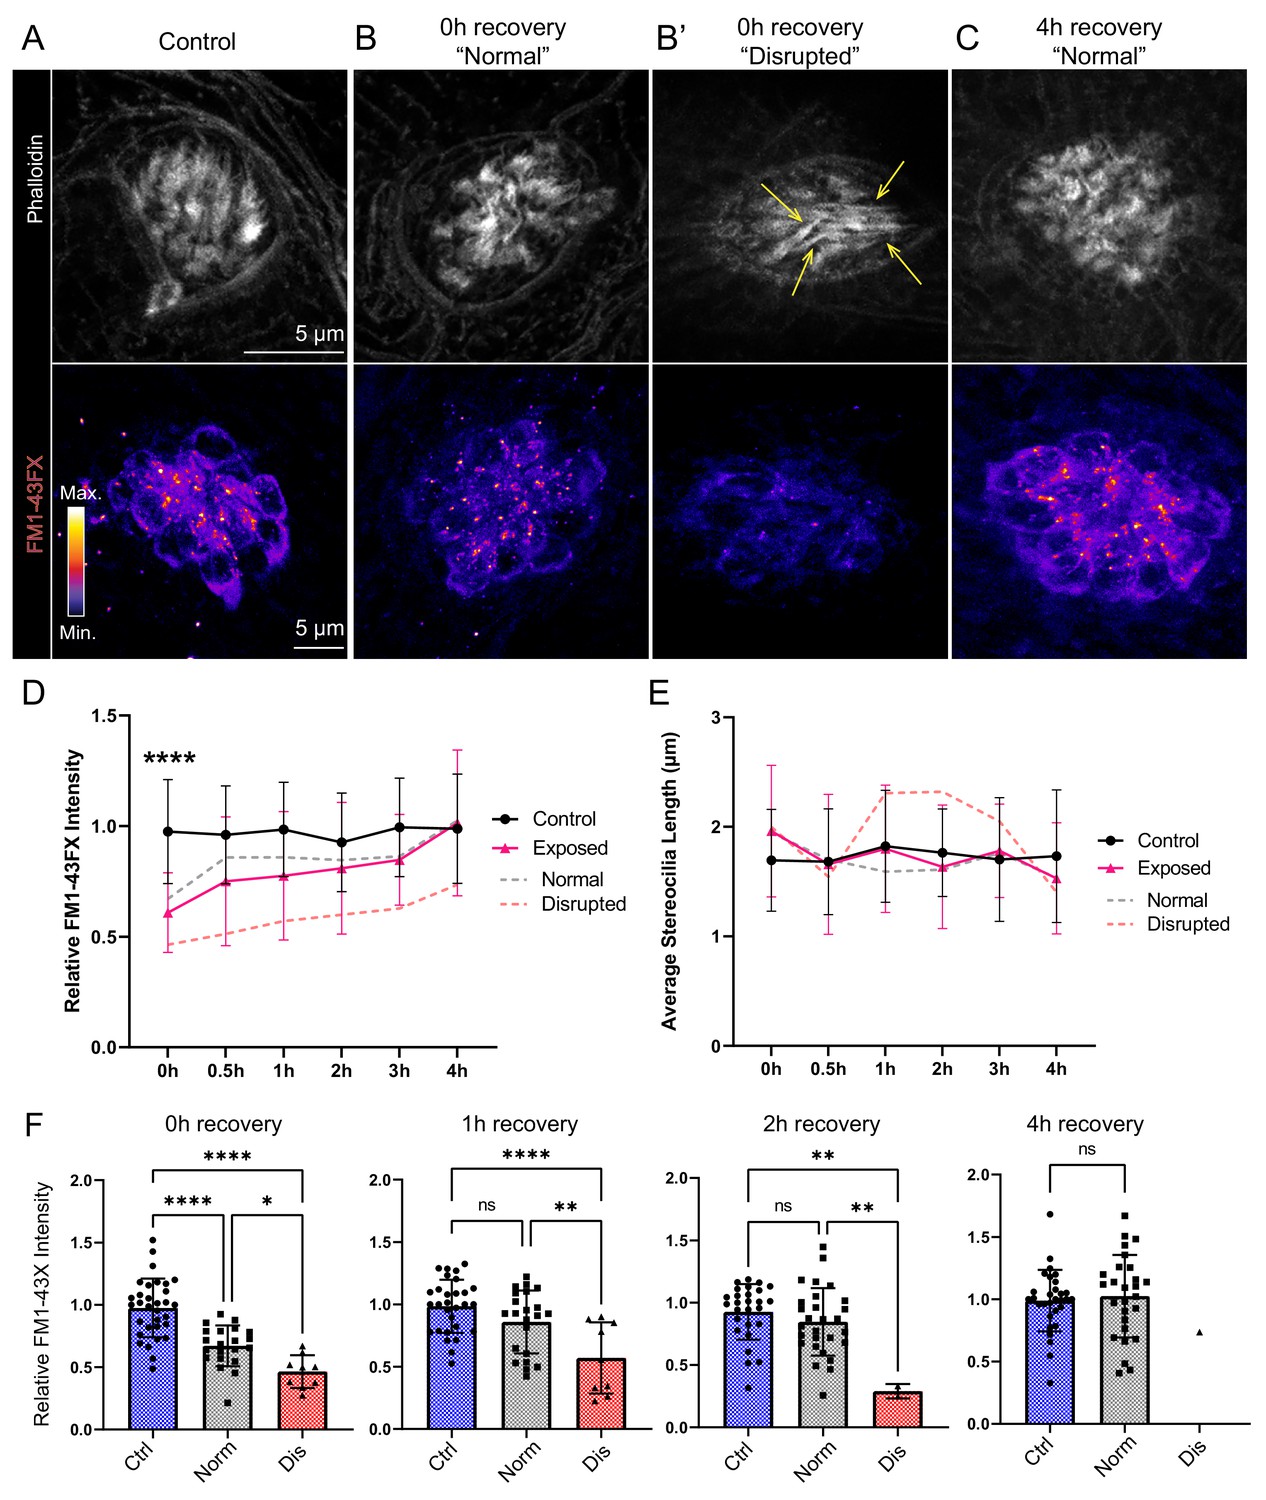
Hair-cell mechanotransduction was significantly reduced but rapidly recovered following mechanical overstimulation.
(A–C) Representative images of hair-cell stereocilia (conjugated phalloidin, gray) and FM1-43FX fluorescence intensity of the corresponding neuromast in representative control (A) or mechanically overstimulated fish immediately (B, B’) or 4 hr (C) following exposure. Yellow arrows in (B’) indicate phalloidin labeling that appeared tapered. (D) Average relative FM1-43FX fluorescence intensity measurements in control and exposed neuromasts over 4 hr of recovery. FM1-43FX uptake was significantly reduced in exposed neuromasts immediately following mechanical overstimulation but appear to completely recover by 4 hr (Tukey’s multiple comparisons test ****p < 0.0001 (0h), p = 0.0579 (1 h), p = 0.8387 (2h), p = 0.8387 (4h)). Dashed lines indicate FM1-43FX fluorescence intensity measurements in exposed neuromasts parsed into ‘normal’ and ‘disrupted’ morphologies. (E) Average stereocilia length of centrally localized hair bundles in control and exposed neuromasts. Dashed lines indicate measurements in exposed neuromasts parsed into ‘normal’ and ‘disrupted’ morphologies. Error Bars = SD (F) Relative FM1-43FX fluorescence in both ‘normal’ and ‘disrupted’ exposed neuromasts was significantly reduced immediately following exposure but recovered over time (Tukey’s multiple comparisons test ****p < 0.0001, *p = 0.0328 (0h); ****p < 0.0001, **p = 0.0098 (1h); **p = 0.0025 control vs. dis, **p = 0.0089 normal vs. dis (2 h)). Each point represents an individual neuromast. Nearly all observed exposed neuromasts appeared morphologically normal following 4 hr; note only one neuromast data point in the disrupted category of the 4 hr recovery graph. Data were obtained from 26 to 32 neuromasts per condition over three trials.
Figure 11
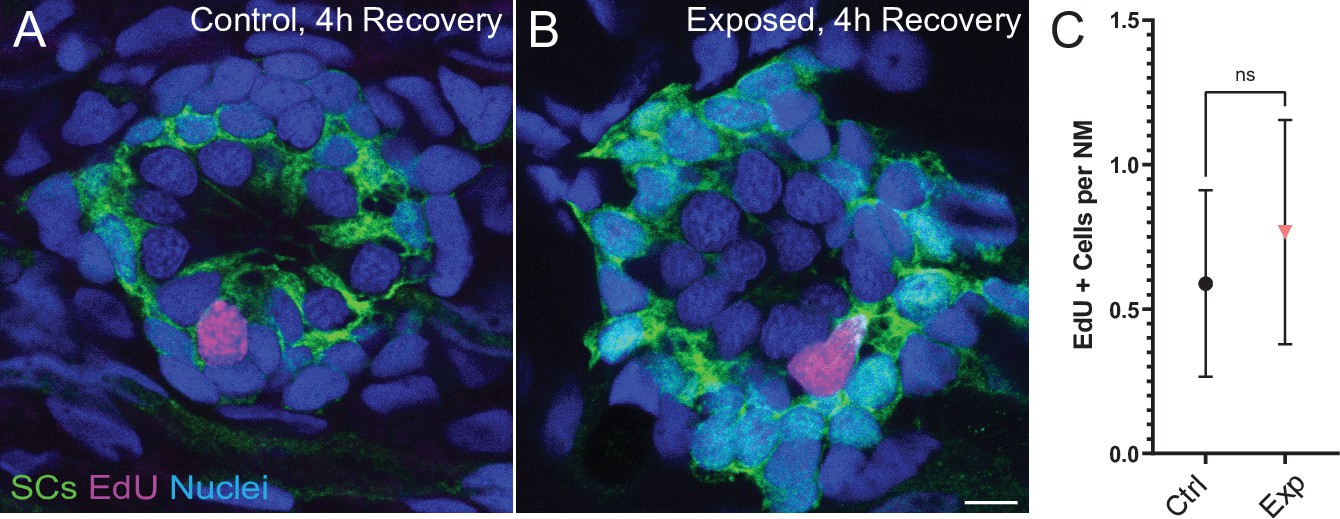
Neuromasts show no change in cell proliferation following mechanical overstimulation.
(A,B) Representative cross-section images of EdU (magenta) labeling of proliferating neuromast cells. Fish were exposed to EdU for 4 hr following stimulus exposure. Supporting cells (SC) were expressing GFP. Scale bars: 5 µm (C) Average number of EdU + cells per neuromast were comparable in control and exposed larvae. Data were obtained from 33 to 34 neuromasts per condition over three trials (Two-way ANOVA. p = 0.4193). Bars represent 95% CI.
Videos
Video 1
Swimming behavior of control fish with intact lateral line organs.
Magenta circle indicates a fish prior to a ‘fast escape’ response.
Video 2
Swimming behavior of larvae whose lateral-line neuromasts were ablated with CuSO4.
Magenta circles indicate larvae that were swept into the waves and could no longer tracked.
Tables
Key resources table
| Reagent type (species) or resource | Designation | Source or reference | Identifiers | Additional information |
|---|---|---|---|---|
| Strain, strain background (Danio rerio) | AB | ZIRC | RRID: ZL1ZFIN ID: ZDB-GENO-960809–7 | |
| Strain, strain background (Danio rerio) | Tübingen | ZIRC | RRID: ZIRC_ZL57ZFIN ID: ZDBGENO-990623–3 | |
| Genetic reagent (Danio rerio) | lhfpl5bvo35/vo35 | Erickson et al., 2019 | RRID:ZIRC_ZL13656.05ZFIN ID: ZDB-GENO-200824–4 | |
| Genetic reagent (Danio rerio) | TgBAC(neurod1:EGFP) | Obholzer et al., 2008 | ZFIN ID: ZDB-ALT-080701–1 | |
| Genetic reagent (Danio rerio) | Tg(myo6b:actb1-EGFP) | Kindt et al., 2012 | ZFIN ID: ZDB-TGCONSTRCT-120926–1 | |
| Genetic reagent (Danio rerio) | Tg(mpeg1:YFP) | Roca and Ramakrishnan, 2013 | ZFIN ID: ZDB-ALT-130130–3 | |
| Sequence-based reagent | lhfpl5b_ F | Erickson et al., 2019 | PCR primer | GCGTCATGTGGGCAGTTTTC; Made by IDT |
| Sequence-based reagent | lhfpl5b_R | Erickson et al., 2019 | PCR primer | TAGACACTAGCGGCGTTGC; Made by IDT |
| Antibody | (Ribbon label: Mouse monoclonal anti-Ribeye b IgG2a) | Sheets et al., 2011 | N/A | (1:10,000) |
| Antibody | (Ribbon label: Mouse monoclonal anti-panCtBP IgG2a) | Santa Cruz | Cat. No. sc-55502 | (1:1000) |
| Antibody | (PSD label: Mouse monoclonal anti-panMAGUK IgG1) | NeuroMab | K28/86, #75–029 | (1:500) |
| Antibody | (Chicken polyclonal anti-GFP) | Aves Labs | Cat. No. GFP-1020 | (1:500) |
| Antibody | (Hair cell label: Rabbit polyclonal anti-Parvalbumin) | Thermo Fisher | Cat. No. PA1-933 | (1:500) |
| Antibody | (Hair cell label: Rabbit polyclonal anti-Parvalbumin) | Abcam | Cat. No. ab11427 | (1:2000) |
| Antibody | (Hair cell label: Mouse anti-Otoferlin IgG2a) | Developmental Studies Hybridoma Bank | HCS-1 | (1:500) |
| Antibody | (Goat anti-Rabbit IgG Secondary Antibody, Pacific Blue) | Thermo Fisher | Cat. No. P-10994 | (1:400) |
| Antibody | (Goat anti- Mouse IgG1 Antibody, Alexa Fluor 488) | Thermo Fisher | Cat. No. A-21121 | (1:1000) |
| Antibody | (Goat anti-Chicken IgY Antibody, Alexa Fluor 488) | Thermo Fisher | Cat. No. A-11039 | (1:1000) |
| Antibody | (Goat anti-Rabbit IgG Antibody, Dylight 549) | Vector Laboratories | Cat. No. DI-1549–1.5 | (1:1000) |
| Antibody | (Goat anti-Rabbit IgG Antibody, Alexa Fluor 555) | Thermo Fisher | Cat. No. A27039 | (1:1000) |
| Antibody | (Goat anti- Mouse IgG2a Antibody, Alexa Fluor 647) | Thermo Fisher | Cat. No. A-21241 | (1:1000) |
| Peptide, recombinant protein | MluCI | New England Biolabs | Cat. No. R0538 | |
| Chemical compound, drug | DL-TBOA | Tocris | Cat. No.1223 | |
| Chemical compound, drug | Copper(II) sulfate (CuSO4) | Millipore Sigma | Cat. No. 451,657 | |
| Chemical compound, drug | 2.5 % Glutaraldehyde in 0.1 M Sodium Cacodylate Buffer, pH 7.4: SEM | Electron Microscopy Sciences | Cat. No. 15,960 | |
| Chemical compound, drug | Paraformaldehyde; IHC | Millipore Sigma | Cat. No. 158,127 | |
| Commercial assay or kit | Click-iT EdU Cell Proliferation Kit for Imaging, Alexa Fluor 555 dye | Thermo Fisher | Cat. No. C10338 | |
| Software, algorithm | FIJI is just ImageJ | NIH | https://imagej.net/software/fiji/ | |
| Software, algorithm | Volocity | Quorum Technologies | https://quorumtechnologies.com/index.php/component/content/category/31-volocity-software | |
| Software, algorithm | Prism (v9) | Graphpad Software | https://www.graphpad.com/ | |
| Software, algorithm | Adobe Illustrator | Adobe | https://www.adobe.com/ | |
| Other | FM1-43X; fixable analog of FM 1–43 | Thermo Fisher | Cat. No. F35355 | 3 µM for 20 seconds |
| Other | DAPI nuclear stain | Thermo Fisher | Cat. No. Cat. No. F35355 | 5 mg/ml stock; diluted (1:2000) |
Additional files
Download links
A two-part list of links to download the article, or parts of the article, in various formats.
Downloads (link to download the article as PDF)
Open citations (links to open the citations from this article in various online reference manager services)
Cite this article (links to download the citations from this article in formats compatible with various reference manager tools)
Mechanical overstimulation causes acute injury and synapse loss followed by fast recovery in lateral-line neuromasts of larval zebrafish
eLife 10:e69264.
https://doi.org/10.7554/eLife.69264


