The mechanism of MICU-dependent gating of the mitochondrial Ca2+uniporter
- Department of Physiology, University of California San Francisco, United States
- Department of Physiology, University of Maryland, United States
- Department of Biology, University of Maryland, United States
Figures
Figure 1 with 3 supplements
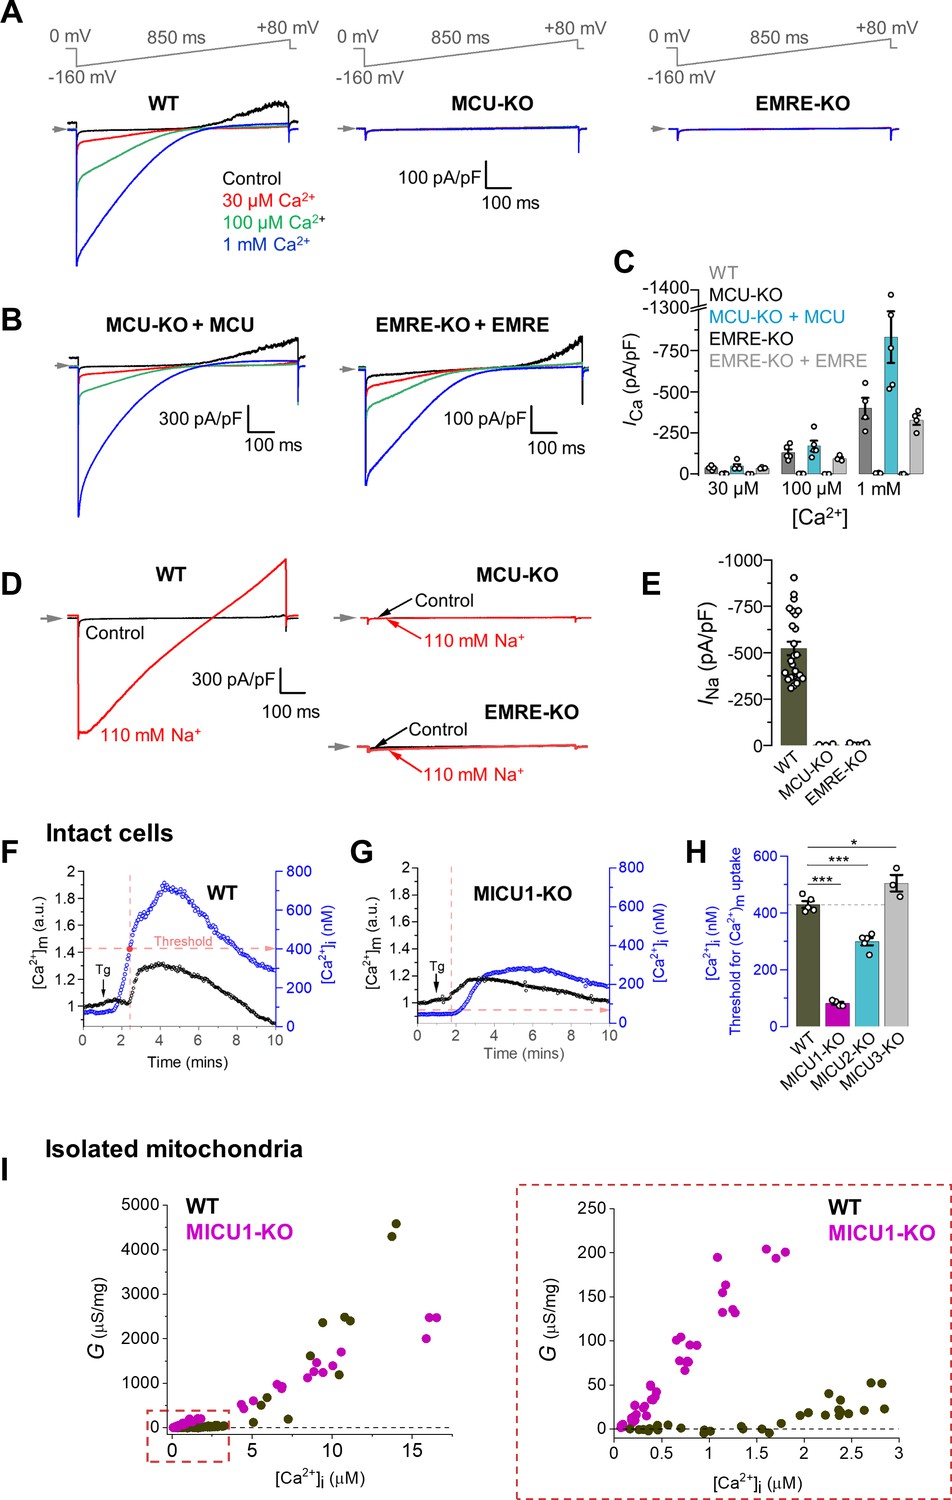
Characterization of MCUcx properties in isolated mitoplasts, intact cells, and isolated mitochondria from MEFs.
(A) Inward ICa elicited by a voltage ramp in WT, MCU-KO and EMRE-KO mitoplasts exposed to [Ca2+]i of 30 μM, 100 μM, and 1 mM. In WT, also note an outward Na+ current via MCU at positive voltages in Ca2+-free bath solution (Control). Voltage protocol is indicated on the top. All superimposed current traces in a single panel are from the same mitoplast. (B) ICa is rescued by the recombinant expression of MCU and EMRE in their respective knockout cell lines. (C) ICa density measured at −160 mV at different [Ca2+]i in indicated cell lines; n = 4–5. (D) Representative INa in WT, MCU-KO and EMRE-KO mitoplasts at 110 mM [Na+]i. (E) INa density measured at −80 mV in WT, MCU-KO, and EMRE-KO mitoplasts; n = 3–20. (F and G) Representative [Ca2+]m (black, left ordinate) and [Ca2+]i (blue, right ordinate) in an individual cell with (F) WT MCUcx, and (G) MICU1 knockout before and after application of 300 nM thapsigargin (Tg, arrow). Dashed red lines indicate the [Ca2+]i at which the [Ca2+]m starts to increase (‘Threshold’). (H) [Ca2+]i threshold for [Ca2+]m elevation in WT and indicated knockout cell lines; n = 3–4 dishes, total cells = ~150 each group. Data shown as mean ± SEM; one-way ANOVA with post-hoc Tukey test. Statistics was run on number of dishes. (I) Ca2+ conductance (G) of the IMM plotted as a function of [Ca2+]i. Right panel shows the zoomed-in region for [Ca2+]i between 0 and 3 μM; n = 64–75 independent experiments, N = 4–7 independent preparations, all data is shown. All superimposed current traces in a single panel are from the same mitoplast. Data shown as mean ± SEM.
-
Figure 1—source data 1
Dataset values for Figure 1.
- https://cdn.elifesciences.org/articles/69312/elife-69312-fig1-data1-v2.xlsx
Figure 1—figure supplement 1
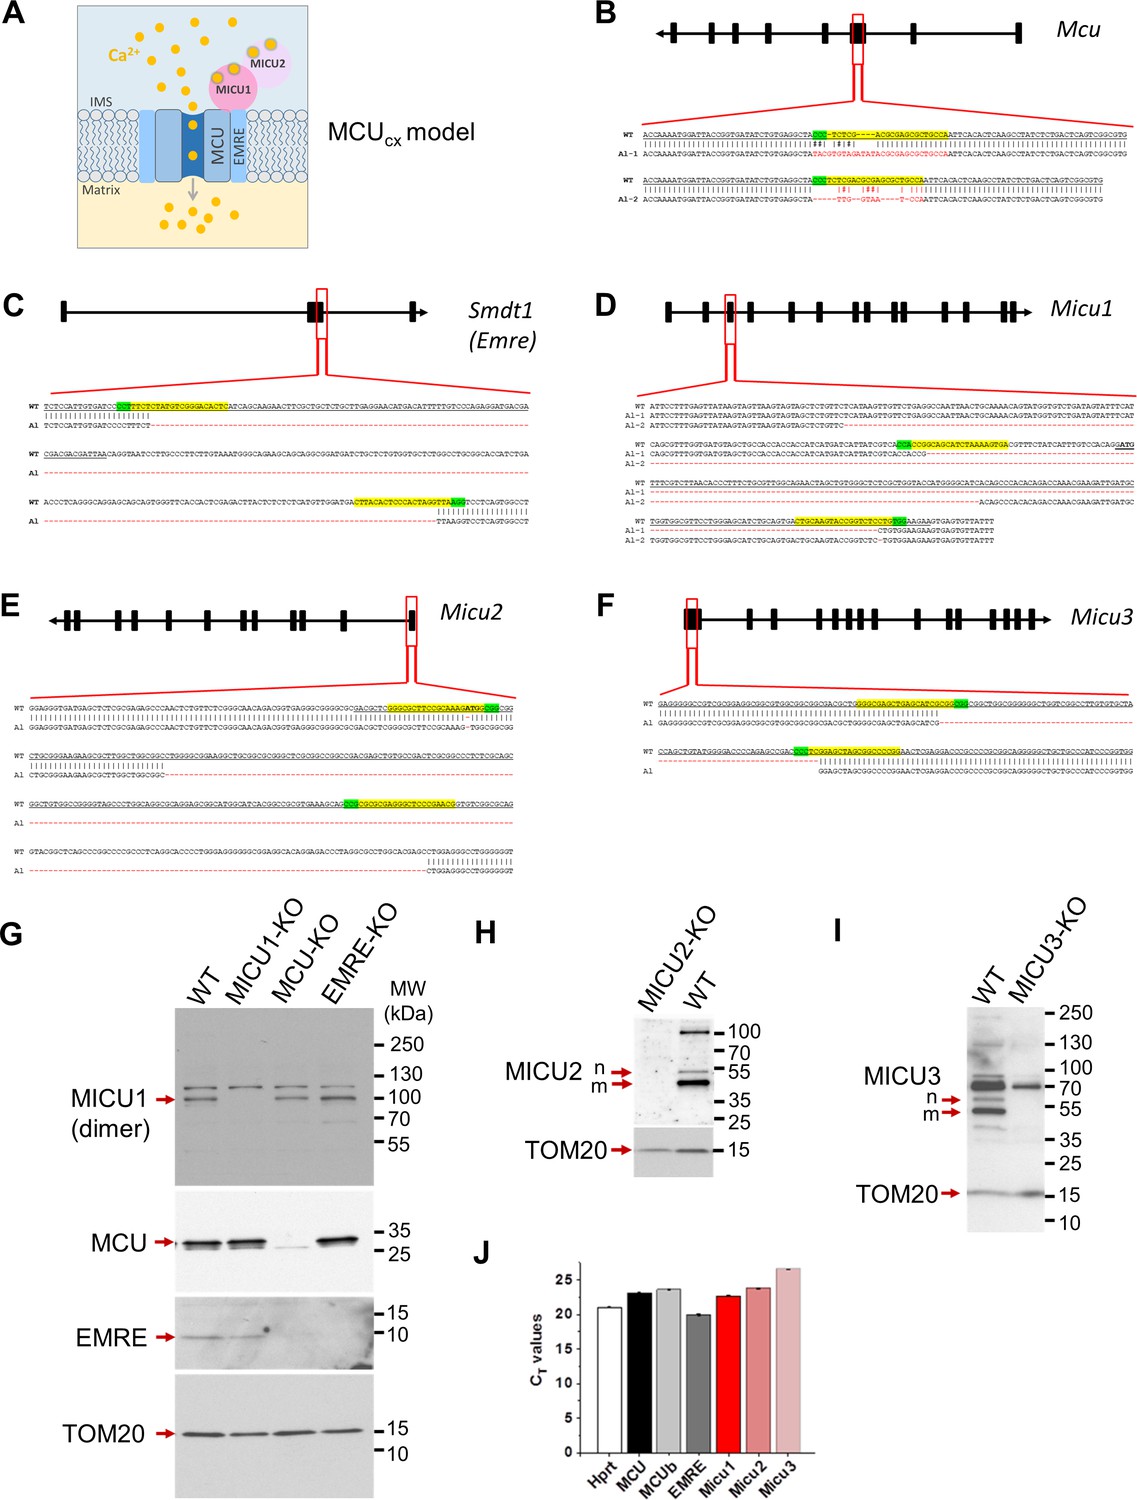
Generation of knockouts for various MCUcx subunits.
(A) A schematic arrangement of various subunits in the MCUcx. Four MCU and four EMRE subunits form the pore of the MCUcx (only two MCU and two EMRE subunits are shown for simplicity). EMRE also tethers MICU1 subunit to the pore on the cytosolic side of the IMM. MICU1 forms homodimers or hetero-dimerizes with MICU2. Each MICU subunit has two EF hands that bind cytosolic Ca2+. (B–F) CRISPR-mediated indels in various MCUcx genes and the resulting mutant alleles. The CRISPR binding sites (for sgRNA) are highlighted in yellow, and their PAM sequences are highlighted in green. The translational initiation codon (ATG) is shown in bold where applicable. (B) Overview of the Mcu gene and indels in the knockout. A sgRNA was used to target exon 3. The sequence of targeted region in Mcu gene is shown; exon 3 is underlined. Targeted sequencing indicates frame-shift indels (red) in both alleles (Al-1 and Al-2). (C) Overview of the Smdt1 gene and the truncated region in the knockout. Two sgRNAs were used for CRISPR-Cas9–mediated deletion in the exon-2 (underlined) and the flanking region. Targeted sequencing indicates same 259 bp deletion (red) in both alleles. (D) Overview of the Micu1 gene and the truncated region in the knockout. Two sgRNAs were used for CRISPR-Cas9–mediated deletion in the exon-3 (underlined) and the flanking region. Targeted sequencing indicates that almost all of exon-3 is deleted along with a portion of the flanking region (red) in both alleles (Al-1 and Al-2). (E) Overview of the Micu2 gene and the truncated region in the knockout. Two sgRNAs were used for CRISPR-Cas9–mediated deletion in the exon-1 (underlined) and the flanking region. Targeted sequencing indicates that almost all of exon-1 is deleted (red) in both alleles. (F) Overview of the Micu3 gene and the truncated region in the knockout. Two sgRNAs were used for CRISPR-Cas9-mediated deletion in the exon-1 (underlined). Targeted sequencing indicates a 73 bp deletion in the expected cut area (red) in both alleles. (G–I) Western blots show expression of various MCUcx subunits in the respective knockout cells. For MICU1 (G), samples were prepared without reducing agent, β-mercaptoethanol. The MICU1 band is near the expected molecular weight (~100 kDa) for the homo- or heterodimer (with MICU2 or 3). Multiple bands were observed with anti-MICU2 (H) and anti-MICU3 (I) antibodies, which were absent in knockout cell lines. This is likely due to the presence of different oligomeric states of the protein, as well as the mature and nascent (before truncation of the mitochondrial targeting signal) forms of the protein. Arrows mark the mature (m) and nascent (n) proteins near the expected molecular weight. (J) PCR showing the mRNA expression of various MCU subunits in Dnm1l-/- MEFs. Hprt was used as the reference.
-
Figure 1—figure supplement 1—source data 1
Raw western blot image for panel G.
- https://cdn.elifesciences.org/articles/69312/elife-69312-fig1-figsupp1-data1-v2.pdf
-
Figure 1—figure supplement 1—source data 2
Raw western blot image for panel H.
- https://cdn.elifesciences.org/articles/69312/elife-69312-fig1-figsupp1-data2-v2.pdf
-
Figure 1—figure supplement 1—source data 3
Raw western blot image for panel I.
- https://cdn.elifesciences.org/articles/69312/elife-69312-fig1-figsupp1-data3-v2.pdf
-
Figure 1—figure supplement 1—source data 4
Real time PCR (Ct) values for different genes.
- https://cdn.elifesciences.org/articles/69312/elife-69312-fig1-figsupp1-data4-v2.xlsx
Figure 1—figure supplement 2
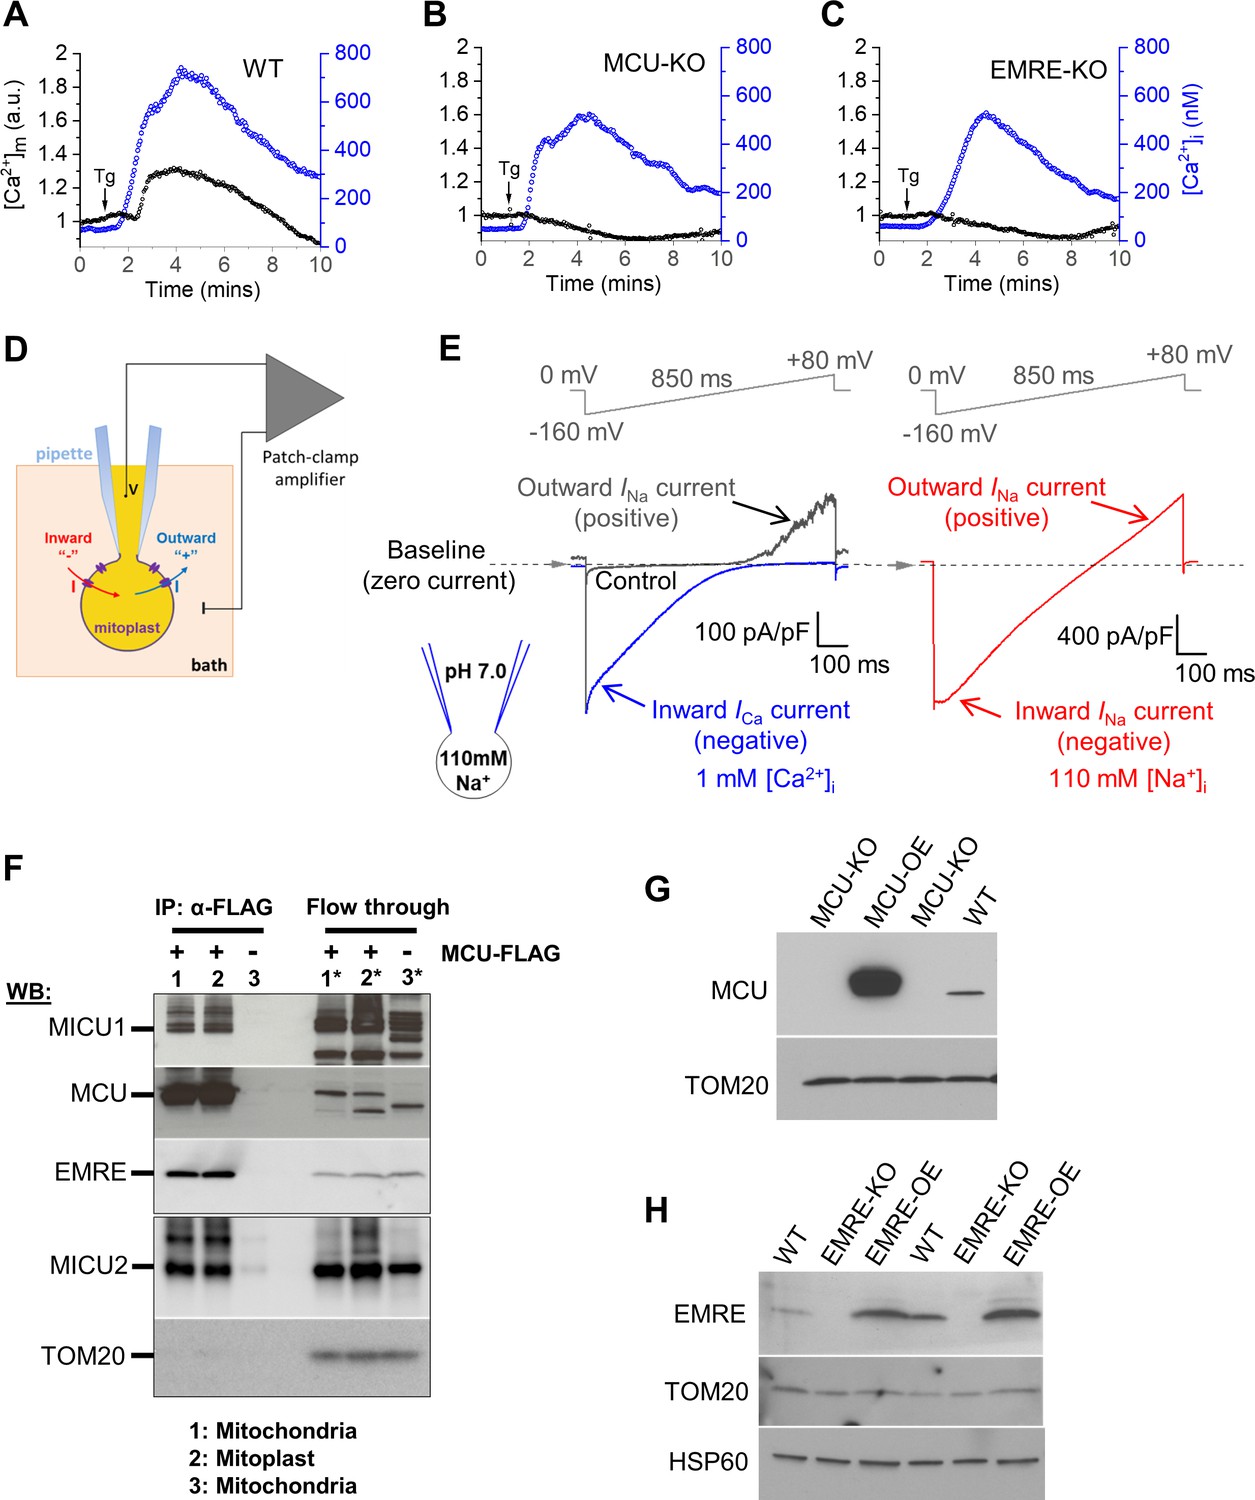
[Ca2+]m phenotype in cells deficient for various MCUcx subunits, patch clamp methodology, and protein expression of various MCUcx subunits in isolated mitoplasts and MEFs.
(A–C) Representative [Ca2+]m (black, left ordinate) and [Ca2+]i (blue, right ordinate) in an individual cell with WT MCUcx (A), MCU-KO (B), and EMRE-KO (C) before and after application of 300 nM Tg (arrow). (D) Diagram of patch-clamp recording from a vesicle of the whole IMM (mitoplast). After formation of a gigaohm seal between the patch pipette and the mitoplast, the IMM patch under the pipette is broken by applying short pulses of high voltage (200–500 mV, 2–8 ms), to gain access into the mitoplast through the pipette. In this configuration, called the ‘whole-IMM’ configuration, the interior of the mitoplast (mitochondrial matrix) is perfused with the pipette solution. The bath is also perfused to control the experimental solution on the cytosolic side of the IMM. The voltage across the IMM is set to the desired value (V), and the currents (I) are measured using the patch-clamp amplifier. Directions of currents flowing across the IMM: inward currents (flowing into the mitoplast) are negative, while outward currents are positive. (E) Left panel: Example MCUcx current traces recorded in the whole-IMM configuration. The voltage protocol used to elicit the currents is shown above. All indicated voltages are within the mitochondrial matrix relative to the bath (cytosol). The voltage of the bath solution is defined to be zero. The zero current level is shown by the dashed line and an arrow. The directions of the currents are indicated as negative (inward) and positive (outward). Control current (Ca2+-free bath solution) is shown in grey. In Control, the outward current at positive voltages is mediated by Na+ ions permeating through MCUcx channel in the Ca2+-free bath solution (INa, pipette solution contains Na-gluconate). After application of 1 mM Ca2+ on the cytosolic face of the IMM (bath), we observe an inward Ca2+ current (ICa, blue) via MCUcx, while the outward INa is inhibited by the bath Ca2+. Right panel, When [Ca2+]i is brought to virtual zero by addition of Ca2+ chelators (1 mM EGTA and 5 mM EDTA), we observe INa via MCUcx (red) in both inward and outward directions (both bath and pipette solution contain Na-gluconate). (F) Co-immunoprecipitation of the MCUcx proteins from mitochondrial and mitoplast fractions. Anti-FLAG beads were used to immunoprecipitate MCU-FLAG (expressed in MCU-KO cells) from mitochondrial and mitoplast fractions. Mitochondria isolated from WT cells (No FLAG tag) were used as negative control. Left three lanes are protein-complexes immunoprecipitated with anti-FLAG beads. Lane-1: immunoprecipitate (IP) from MCU-FLAG mitochondrial lysate, lane-2: IP from MCU-FLAG mitoplast lysate, lane-3: IP from WT mitochondrial lysate. Right three lanes correspond to samples from the flow-through fraction after immunoprecipitation. Lane-1*: mitochondrial lysate from MCU-FLAG, lane-2*: mitoplast lysate from MCU-FLAG, lane-3*: mitochondrial lysate from WT. Upper (MICU1, MCU, and EMRE) and lower (MICU2 and TOM20) boxes are from the same samples run on different gels. (G) Western blots of protein lysates from cells with WT MCUcx (WT), MCU-KO cells, and MCU-KO cells overexpressing MCU (MCU-OE) using anti-MCU and anti-TOM20 (the mitochondrial loading control) antibodies. (H) Western blots of protein lysates from WT cells, EMRE-KO cells, and EMRE-KO cells overexpressing EMRE (EMRE-OE) using anti-EMRE, anti-TOM20 and anti-HSP60 (the mitochondrial loading controls) antibodies.
-
Figure 1—figure supplement 2—source data 1
Raw western blot image for panel F.
- https://cdn.elifesciences.org/articles/69312/elife-69312-fig1-figsupp2-data1-v2.pdf
-
Figure 1—figure supplement 2—source data 2
Raw western blot image for panel G.
- https://cdn.elifesciences.org/articles/69312/elife-69312-fig1-figsupp2-data2-v2.pdf
-
Figure 1—figure supplement 2—source data 3
Raw western blot image for panel H.
- https://cdn.elifesciences.org/articles/69312/elife-69312-fig1-figsupp2-data3-v2.pdf
Figure 1—figure supplement 3
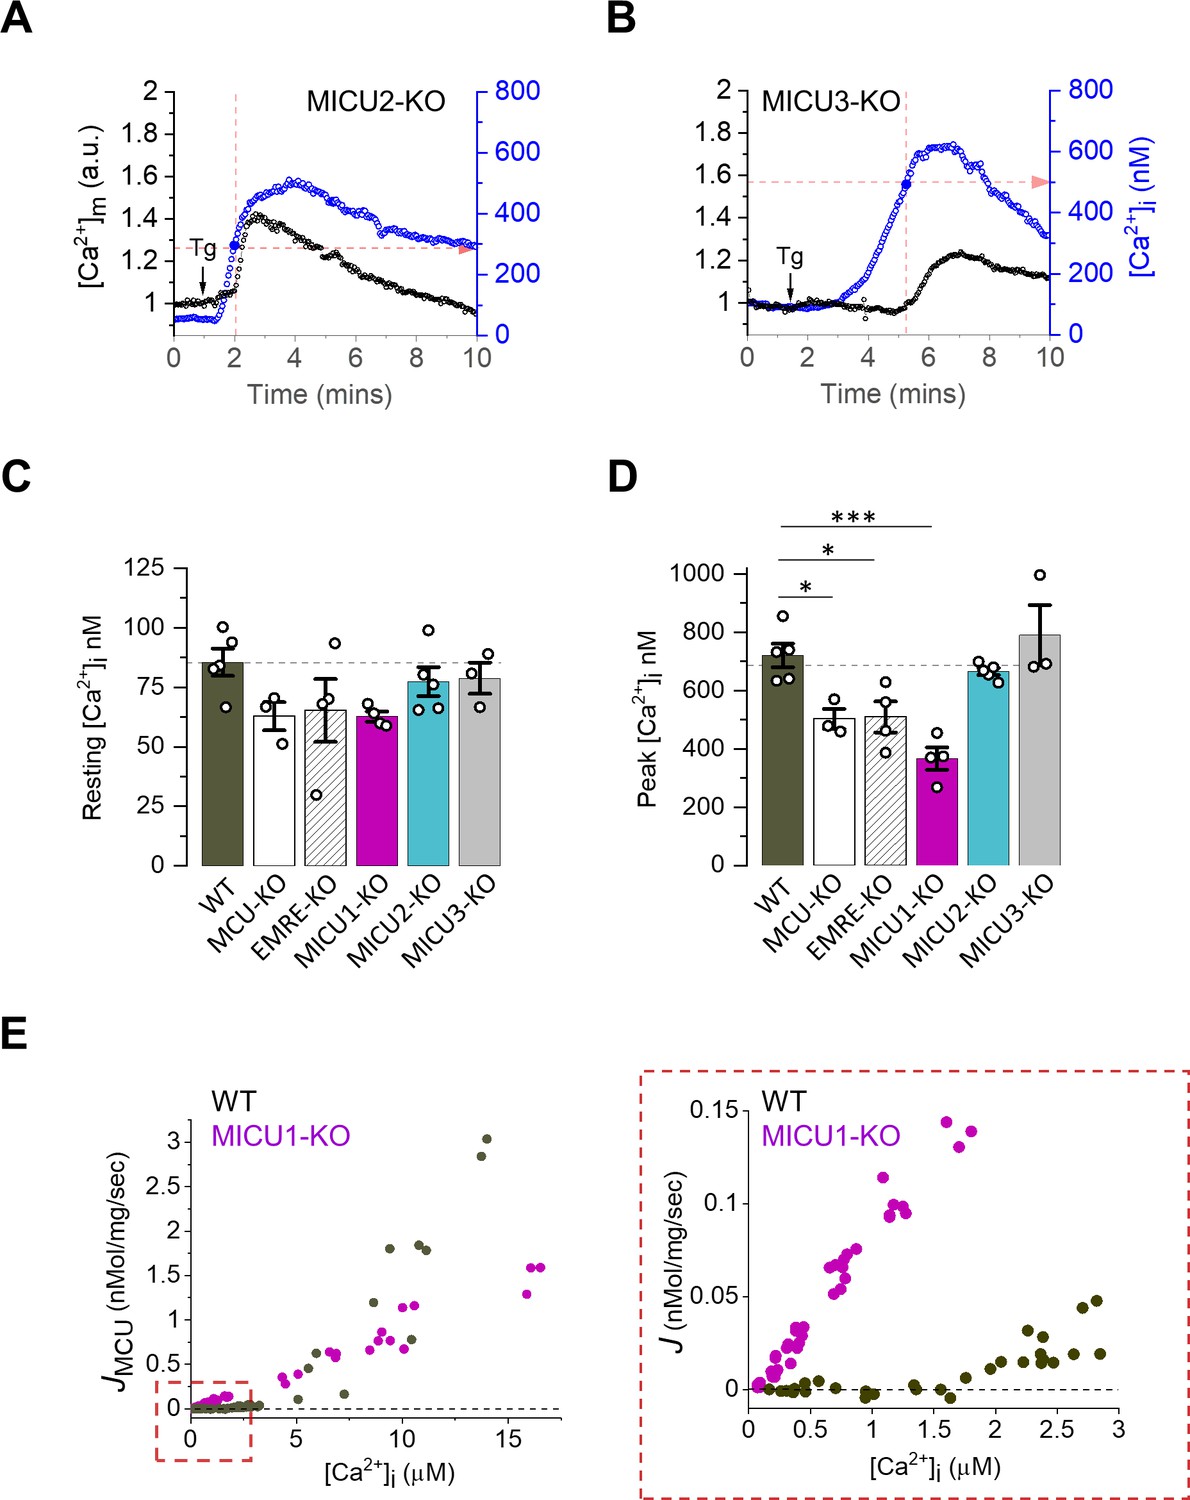
Mitochondrial Ca2+ uptake phenotype in cells and mitochondria deficient for MICU subunits.
(A and B) Representative [Ca2+]m (black, left ordinate) and [Ca2+]i (blue, right ordinate) in an individual cell with MICU2 (A) and MICU3 (B) knockouts before and after application of 300 nM Tg (arrow). Dashed red lines indicate the [Ca2+]i at which [Ca2+]m starts to increase (‘Threshold’). (C and D), Resting [Ca2+]i (C) and peak [Ca2+]i after addition of Tg (D) in WT and indicated knockout cell lines. Data shown as mean ± SEM; one-way ANOVA with post-hoc Tukey test, n = 3–5 dishes, total = ~150 cells per group. (E) Net Ca2+ flux (J) into mitochondria isolated from MEFs plotted as a function of [Ca2+]i. Right panel shows the zoomed-in region for [Ca2+]i between 0 and 3 μM; n = 64–75 independent experiments, N = 4–7 independent preparations, all data is shown.
-
Figure 1—figure supplement 3—source data 1
Dataset values for Figure 1—figure supplement 3.
- https://cdn.elifesciences.org/articles/69312/elife-69312-fig1-figsupp3-data1-v2.xlsx
Figure 2 with 3 supplements
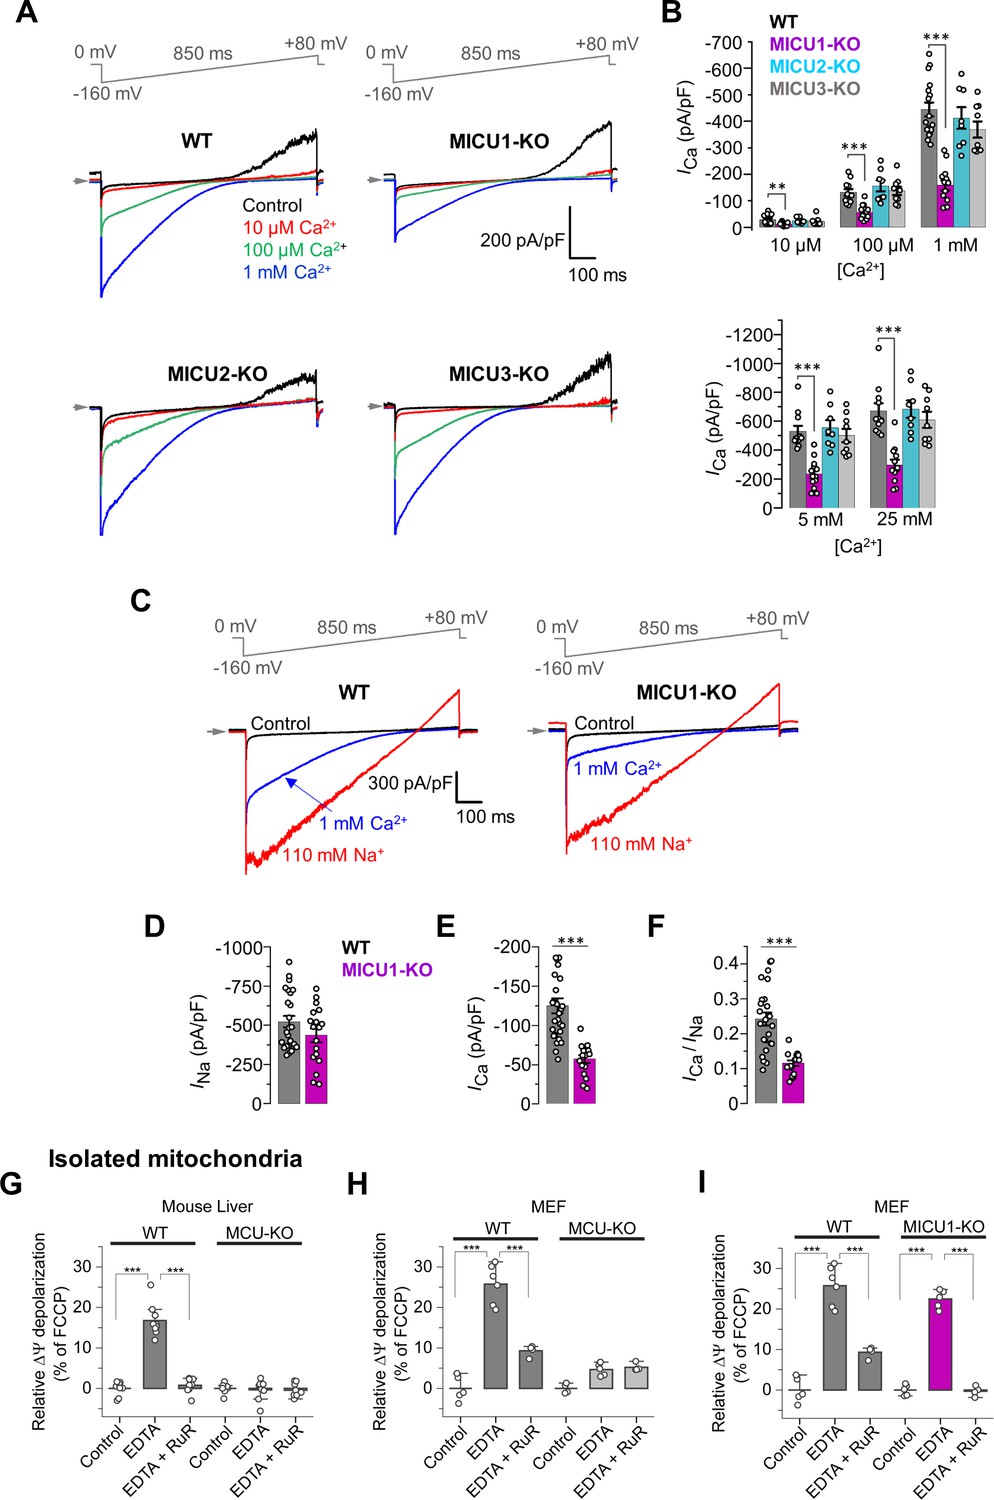
MICUs are [Ca2+]i-dependent MCUcx potentiators.
(A) Inward ICa in WT, MICU1-KO, MICU2-KO, and MICU3-KO mitoplasts exposed to 10 μM, 100 μM and 1 mM [Ca2+]i. (B) ICa densities measured at −160 mV and [Ca2+]i of 10 μM, 100 μM, and 1 mM (upper), as well as 5 mM and 25 mM (lower). Data shown as mean ± SEM; one-way ANOVA with post-hoc Tukey test, n = 8–17. (C) Representative ICa (blue) and INa (red) recorded from the same WT and MICU1-KO mitoplasts exposed to 1 mM [Ca2+]i or 110 mM [Na+]i in the absence of Ca2+. (D–F) Amplitudes of INa (D) and ICa (E), as well as the ICa/INa ratio (F) in the same WT and MICU1-KO mitoplasts. Currents were measured at −80 mV. Data shown as mean ± SEM; unpaired t-test, two-tailed, n = 18–27. (G and H) ΔΨ depolarization induced by application of 5 mM EDTA in suspension of isolated mitochondria from mouse liver (G) and MEF (H). The degree of depolarization is expressed as percentage of the full depolarization induced by 1 µM FCCP. Both WT and MCU-KO mitochondria were assessed. Data shown as mean ± SEM; one-way ANOVA with Tukey test, n = 4–9. (I) ΔΨ depolarization induced by application of 5 mM EDTA in suspension of isolated mitochondria from MEF with WT and MICU1-deficient MCUcx. WT data in panel I is the same as in panel H. The degree of depolarization is expressed as percentage of the full depolarization induced by 1 µM FCCP. Data shown as mean ± SEM; one-way ANOVA with Tukey test, n = 4–5. All superimposed current traces in a single panel are from the same mitoplast.
-
Figure 2—source data 1
Dataset values for Figure 2.
- https://cdn.elifesciences.org/articles/69312/elife-69312-fig2-data1-v2.xlsx
Figure 2—figure supplement 1
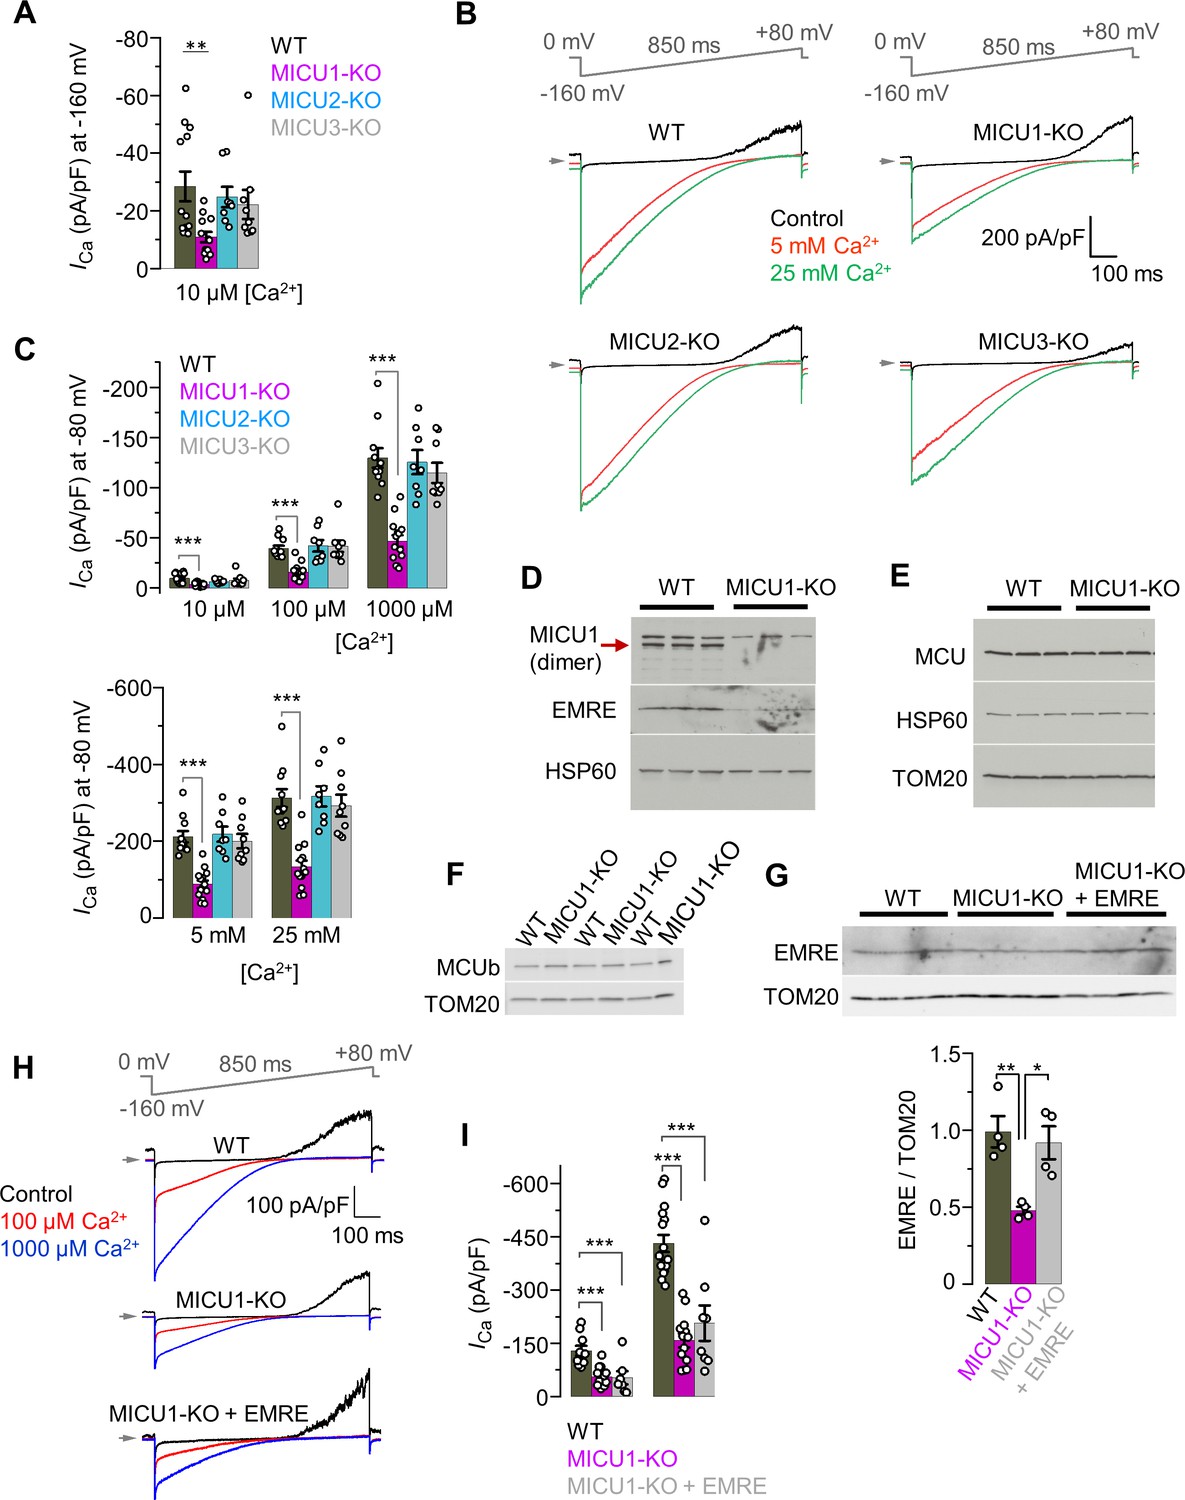
ICa in MICU1‒3 knockouts, and expression levels of various MCU subunits in MICU1-KO.
(A) ICa amplitude in WT and MICU1–3 knockouts measured at −160 mV using 10 μM [Ca2+]i. The data is same as in Figure 3B, but presented with an enlarged Y-axis. Data shown as mean ± SEM; one-way ANOVA with post-hoc Tukey test, n = 8–13. (B) Representative inward ICa in WT, MICU1-KO, MICU2-KO, and MICU3-KO mitoplasts exposed to 5 mM, and 25 mM [Ca2+]i. All superimposed current traces in a single panel are from the same mitoplast. (C) ICa amplitude measured at −80 mV in WT, MICU1-KO, MICU2-KO, and MICU3-KO mitoplasts at 10 μM, 100 μM, and 1000 μM [Ca2+]i (Upper panel, for ICa traces see Figure 3A) and at 5 mM and 25 mM [Ca2+]i (Lower panel, for ICa traces see B). Data shown as mean ± SEM; one-way ANOVA with post-hoc Tukey test, n = 8–14. (D–F) Western blots showing the expression levels of EMRE (D), MCU (E), and MCUb (F) in cells with WT MCU complex and MICU1-KO (n = three independent samples each). (G) Upper panel: Western blots showing EMRE protein level in WT and MICU1-KO (before and after EMRE overexpression). Lower panel: Bar-graph shows the quantification of EMRE protein levels normalized to TOM20. Data shown as mean ± SEM, one-way ANOVA with post-hoc Tukey test, n = four independent samples each. (H) Representative inward ICa in WT, MICU1-KO, and MICU1-KO with EMRE overexpression (MICU1-KO + EMRE) upon exposure to 100 μM and 1000 μM [Ca2+]i. All superimposed current traces in a single panel are from the same mitoplast. (I) ICa amplitudes measured at −160 mV in MICU1-KO with EMRE overexpression (MICU1-KO + EMRE) as well as in MICU1-KO and WT. WT and MICU1-KO data are the same as in Figure 3B. Data shown as mean ± SEM, one-way ANOVA with post-hoc Tukey test, n = 7–16.
-
Figure 2—figure supplement 1—source data 1
Raw western blot image for panel D.
- https://cdn.elifesciences.org/articles/69312/elife-69312-fig2-figsupp1-data1-v2.pdf
-
Figure 2—figure supplement 1—source data 2
Raw western blot image for panel E.
- https://cdn.elifesciences.org/articles/69312/elife-69312-fig2-figsupp1-data2-v2.pdf
-
Figure 2—figure supplement 1—source data 3
Raw western blot image for panel F.
- https://cdn.elifesciences.org/articles/69312/elife-69312-fig2-figsupp1-data3-v2.pdf
-
Figure 2—figure supplement 1—source data 4
Raw western blot image for panel G.
- https://cdn.elifesciences.org/articles/69312/elife-69312-fig2-figsupp1-data4-v2.pdf
-
Figure 2—figure supplement 1—source data 5
Dataset values for Figure 2—figure supplement 1.
- https://cdn.elifesciences.org/articles/69312/elife-69312-fig2-figsupp1-data5-v2.xlsx
Figure 2—figure supplement 2

The sensitivity of INa to [Ca2+]i remains unchanged in MICU1-KO.
(A) Inward INa recorded in the absence of cytosolic Ca2+ (blue) and subsequently at 2 nM [Ca2+]i (red) in WT (left) and MICU1-KO (right) mitoplasts exposed to 110 mM [Na+]i. All superimposed current traces in a single panel are from the same mitoplast. (B) Inhibition of INa by 2 nM [Ca2+]i in WT and MICU1-KO. Data shown as mean ± SEM, n = 4 each.
-
Figure 2—figure supplement 2—source data 1
Dataset values for Figure 2—figure supplement 2.
- https://cdn.elifesciences.org/articles/69312/elife-69312-fig2-figsupp2-data1-v2.xlsx
Figure 2—figure supplement 3
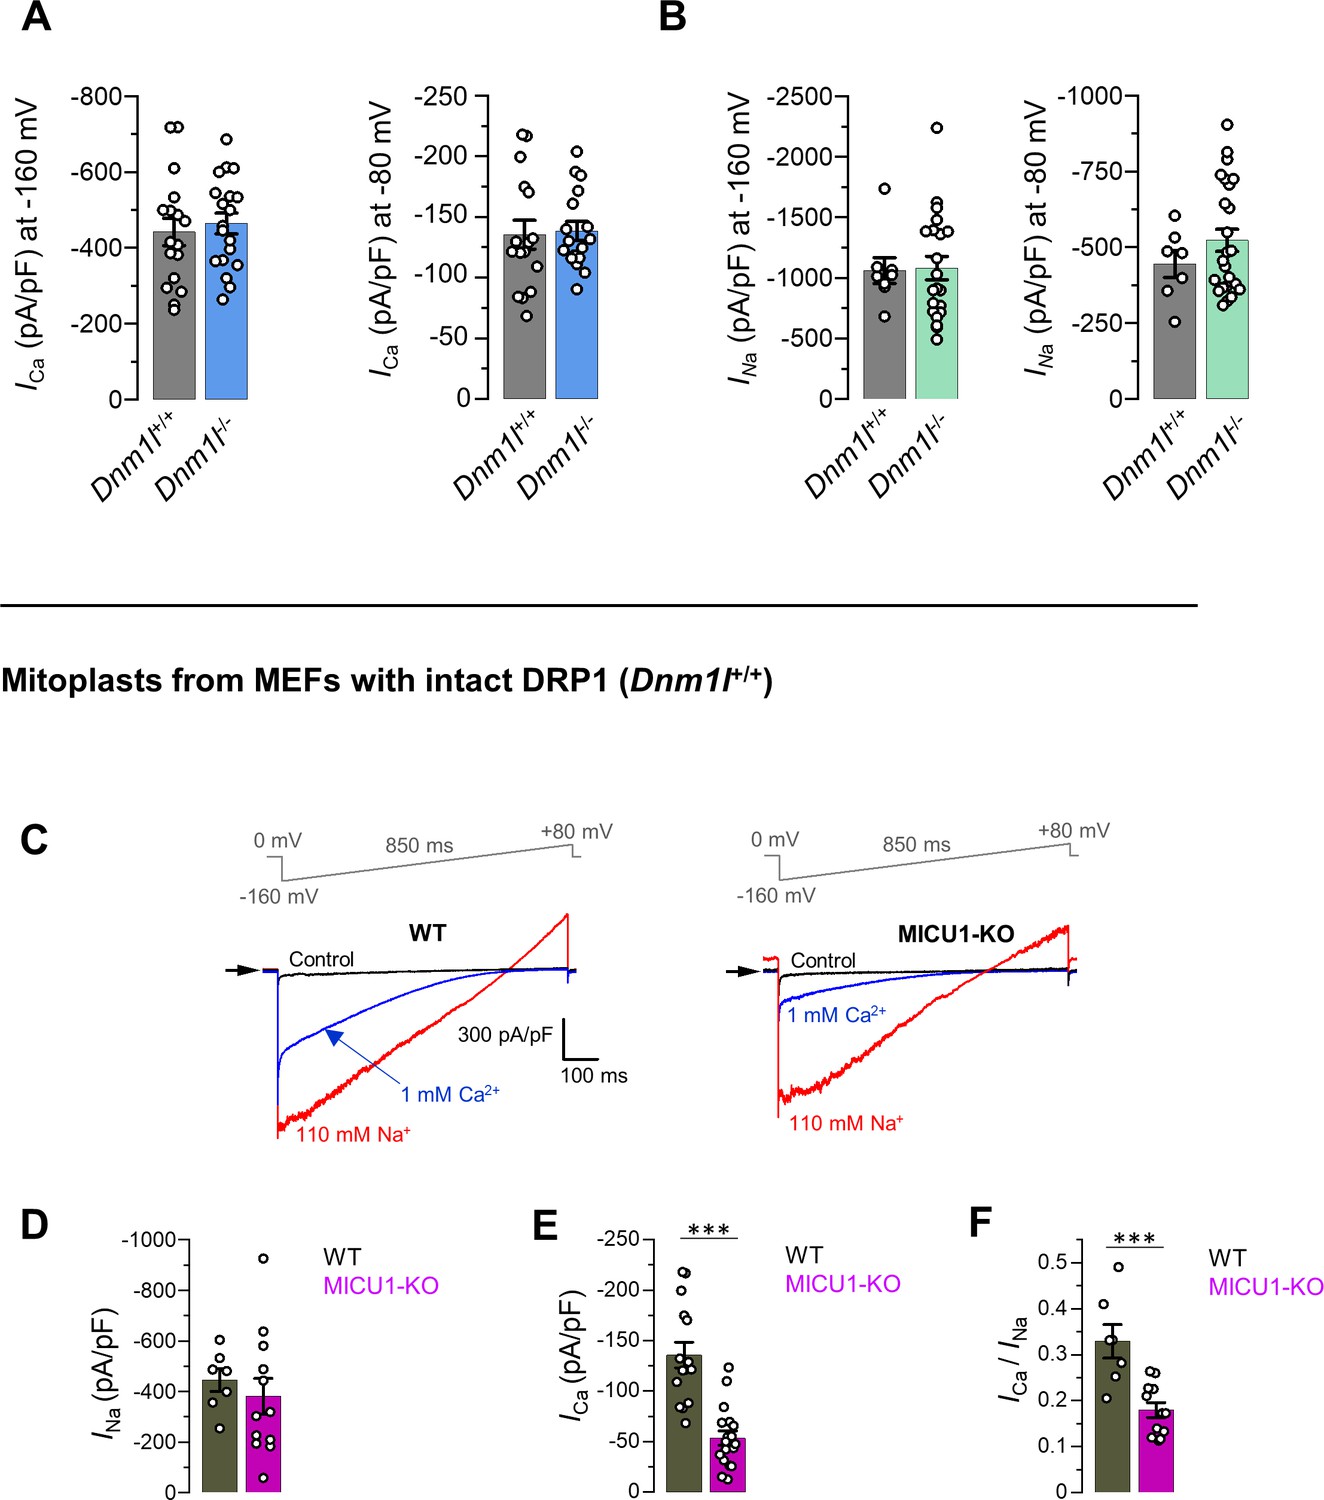
DRP1 does not affect the currents mediated by the MCUcx or their phenotype in MICU1-KO.
(A) ICa amplitudes at −160 mV (left) and −80 mV (right) in mitoplasts from MEFs with DRP1 (Dnm1l+/+) and without DRP1 (Dnm1l-/-). Data shown as mean ± SEM, n = 17–19. (B) INa amplitudes at −160 mV (left) and −80 mV (right) in mitoplasts from MEFs with DRP1 (Dnm1l+/+) and without DRP1 (Dnm1l-/-). Data shown as mean ± SEM, n = 7–25. (C–F) Current phenotypes of MICU1-KO in mitoplasts isolated from MEFs with an intact DRP1. (C) Representative ICa (blue) and INa (red) recorded in the same WT and MICU1-KO mitoplasts exposed to 1 mM [Ca2+]i or 110 mM [Na+]i. All superimposed current traces in a single panel are from the same mitoplast. Amplitudes of INa (D) and ICa (E) measured at −80 mV. (F) Ratio between ICa and INa measured in the same mitoplast. Data shown as mean ± SEM; unpaired t-test, two-tailed, n = 7–12.
-
Figure 2—figure supplement 3—source data 1
Dataset values for Figure 2—figure supplement 3.
- https://cdn.elifesciences.org/articles/69312/elife-69312-fig2-figsupp3-data1-v2.xlsx
Figure 3 with 2 supplements
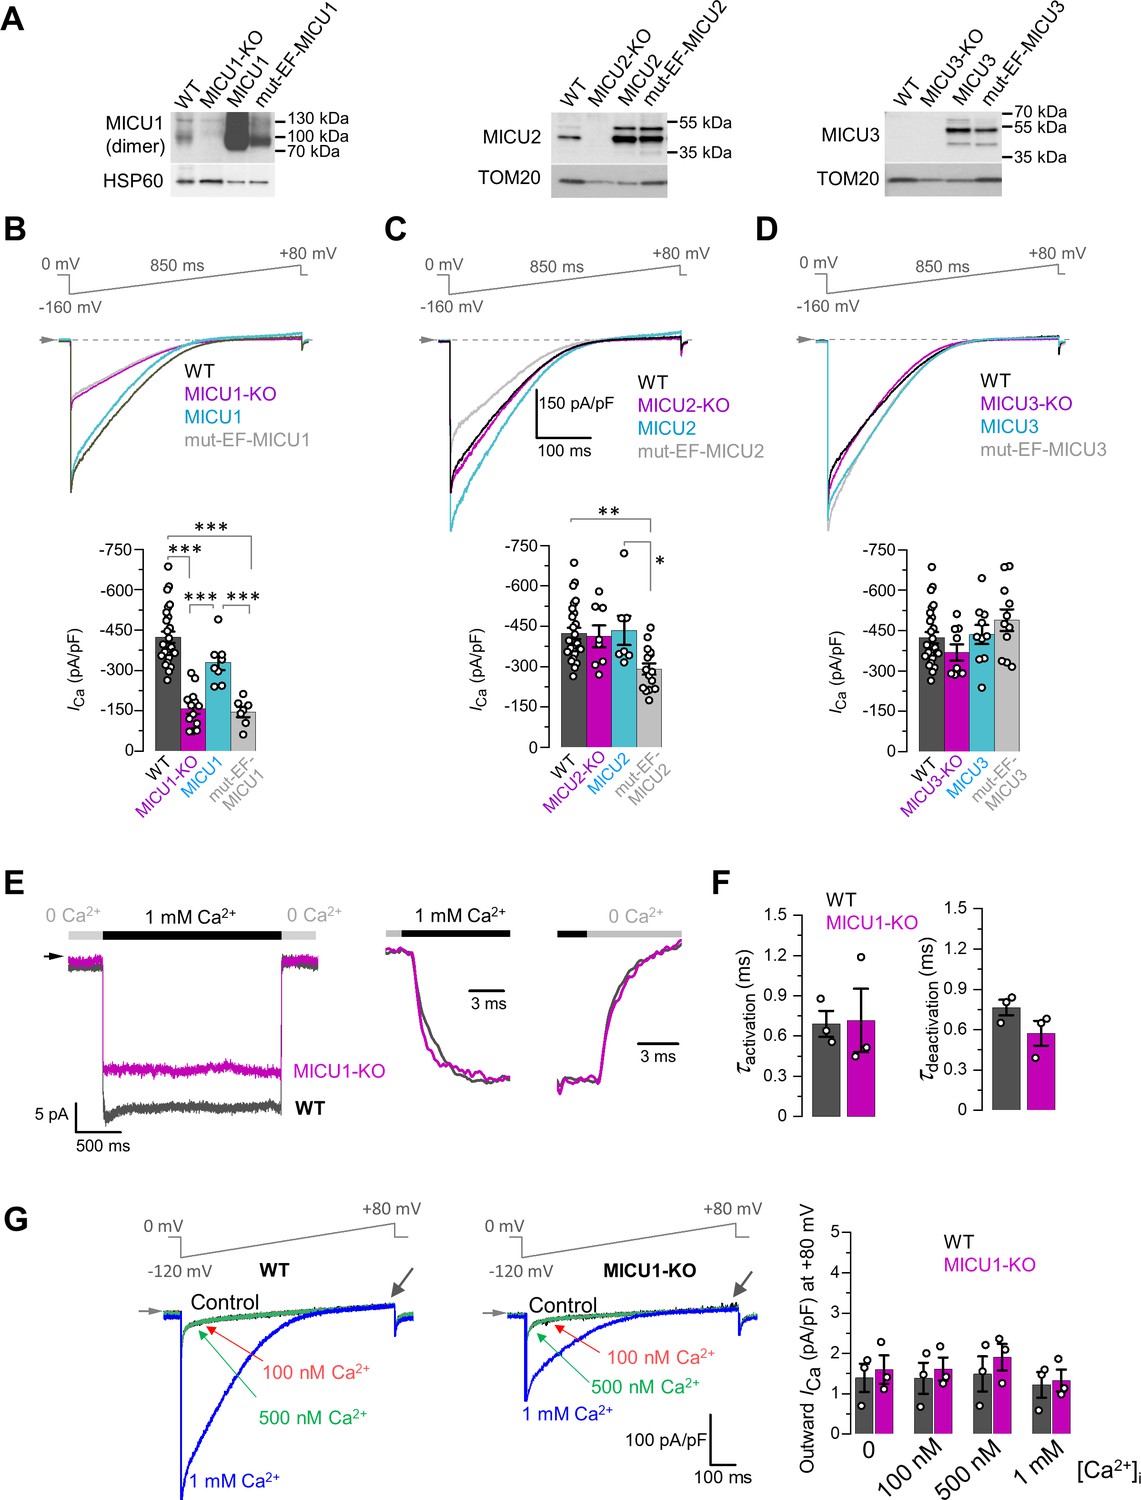
Effects of MICU subunits and their EF hands on the amplitude, kinetics and rectification of ICa.
(A) Western blots showing overexpression of MICU subunits or MICU subunits with non-functional EF hands (mut-EF-MICU) in their respective knockout background (left, MICU1-KO; middle, MICU2-KO and; right, MICU3-KO). For MICU1 (left panel), samples were prepared without reducing agent, β-mercaptoethanol. The MICU1 band is near the expected molecular weight for the homo- or heterodimer (with MICU2 or 3). (B–D) Upper panels: ICa in MICU1-KO (B), MICU2-KO (C), and MICU3-KO (D) before and after overexpression of a corresponding MICU subunit or its EF hand mutant, as compared to WT. Representative ICa traces recorded from the mitoplasts of different backgrounds in 1 mM [Ca2+]i are shown together in a single panel. Lower panels: quantification of ICa amplitudes from the upper panel at −160 mV. The same WT and knockout data were used as in Figure 2B. All superimposed current traces in a panel are compiled from multiple mitoplasts. Data shown as mean ± SEM; one-way ANOVA with post-hoc Tukey test. n = 7–26. (E) Left panel: ICa measured at a holding voltage of −100 mV while [Ca2+]i was rapidly (τ ~0.4 ms, see Materials and methods) switched from virtual zero to 1 mM and then back to virtual zero in WT (gray) and MICU1-KO (purple) mitoplasts. Right panel, ICa kinetics within ~10 ms after the fast [Ca2+]i elevation and subsequent decrease in WT (gray) and MICU1-KO (purple) mitoplasts from the left panel. ICa traces were normalized to the maximal amplitude to facilitate comparison of kinetics in WT and MICU1-KO. (F) Left: ICa activation time constant (τactivation) in WT and MICU1-KO; Right: ICa deactivation time constant (τdeactivation) in WT and MICU1-KO. Data shown as mean ± SEM, n = 3. (G) ICa at [Ca2+]m = 2 mM and indicated [Ca2+]i in WT and MICU1-KO. Black arrows point out where the amplitude of outward ICa was measured. Bar-graph shows the amplitude of outward ICa measured at +80 mV. All superimposed current traces in a single panel are from the same mitoplast. Data shown as mean ± SEM, n = 3, each [Ca2+]i.
-
Figure 3—source data 1
Raw western blot image for panel A.
- https://cdn.elifesciences.org/articles/69312/elife-69312-fig3-data1-v2.pdf
-
Figure 3—source data 2
Dataset values for Figure 3.
- https://cdn.elifesciences.org/articles/69312/elife-69312-fig3-data2-v2.xlsx
Figure 3—figure supplement 1
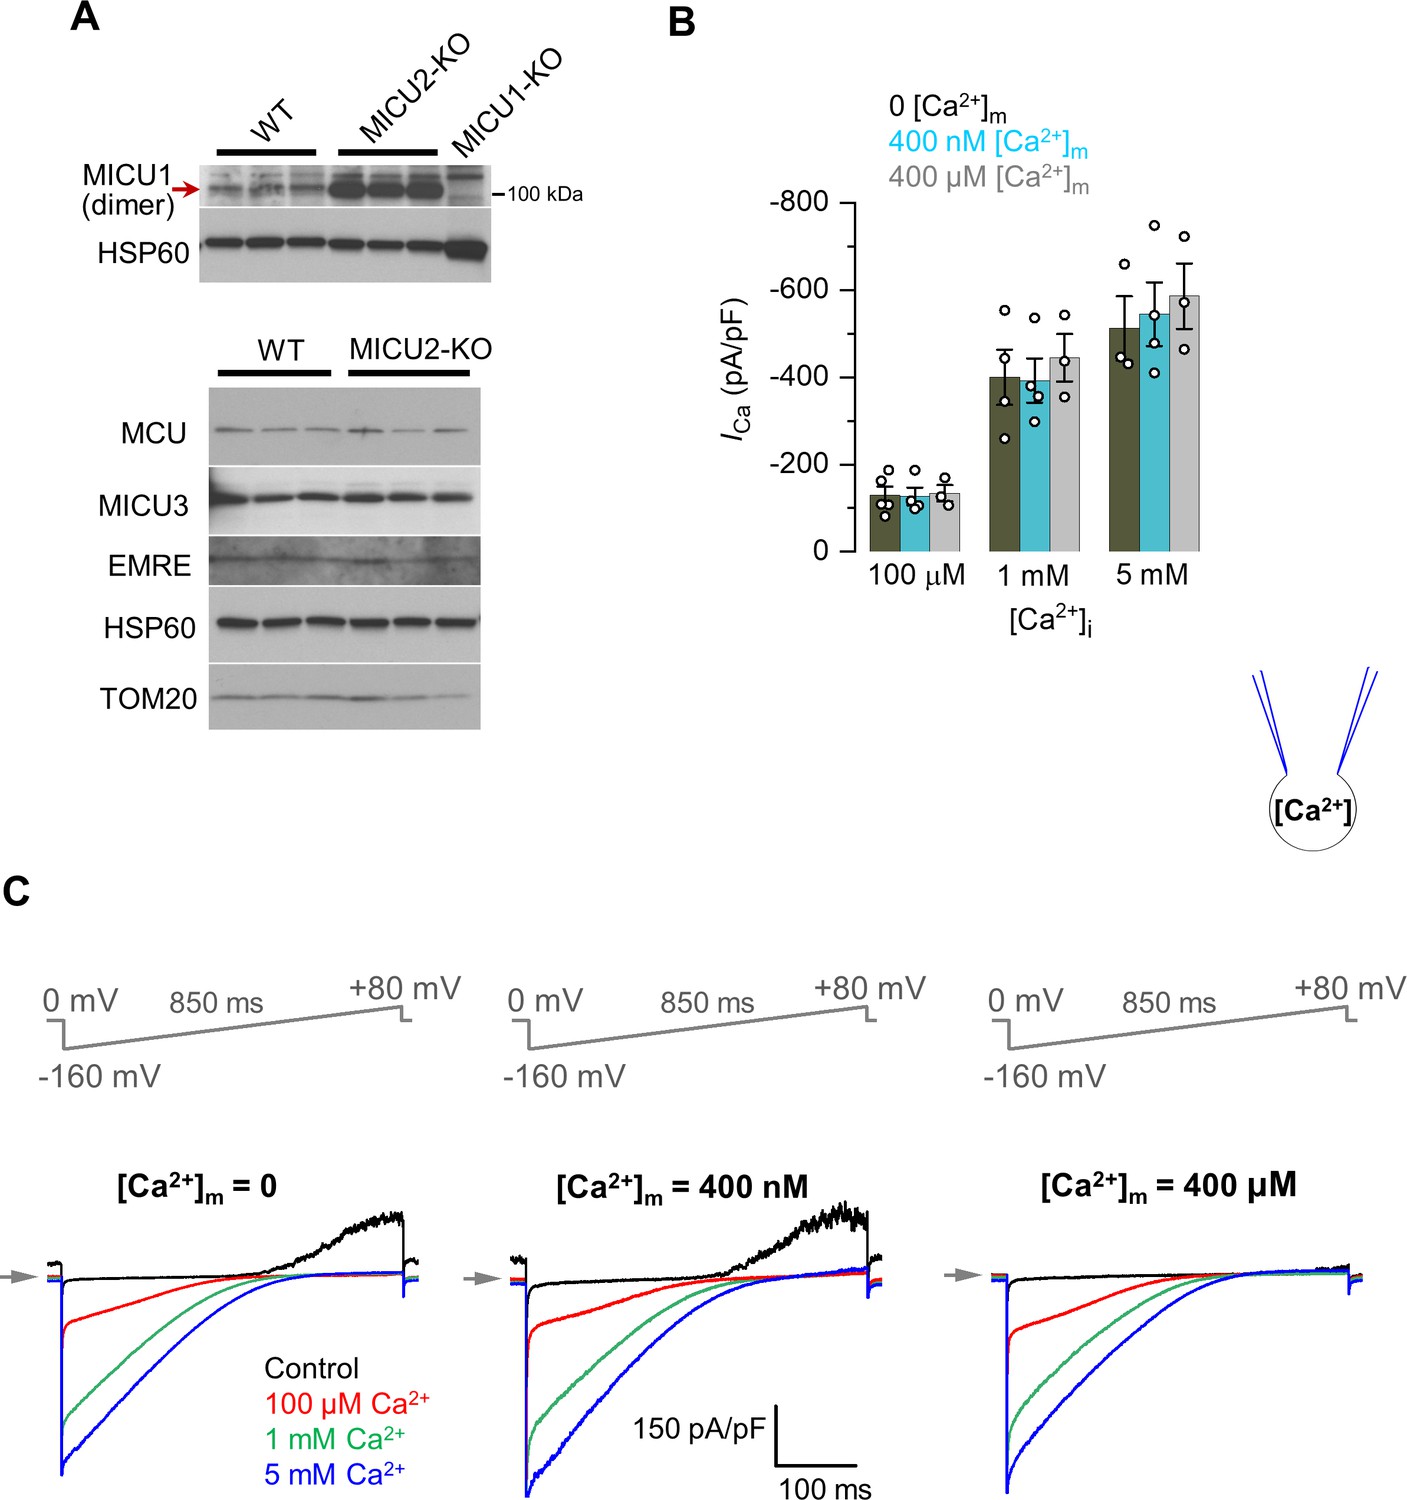
Matrix Ca2+ does not regulate ICa.
(A) Western blots showing the expression levels of MICU1 (upper panel), as well as MCU, MICU3, and EMRE (lower panel) in WT and MICU2-KO cells. For detection of MICU1 near the expected molecular weight for a dimer (with or without MICU2), samples were prepared in Laemmli buffer without β-mercaptoethanol. n = 3–6 independent samples. (B) ICa amplitudes at 0, 400 nM or 400 μM [Ca2+]m. ICa was measured at −160 mV, and in different [Ca2+]i as indicated. Data shown as mean ± SEM; one-way ANOVA with post-hoc Tukey test, n = 3–5. (C) Inward ICa in the presence of 0 (left), 400 nM (middle), and 400 μM (right) [Ca2+]m (pipette solution). [Ca2+]i was 100 μM, 1 mM, or 5 mM. All superimposed current traces in a single panel are from the same mitoplast.
-
Figure 3—figure supplement 1—source data 1
Raw western blot image for panel A (Upper).
- https://cdn.elifesciences.org/articles/69312/elife-69312-fig3-figsupp1-data1-v2.pdf
-
Figure 3—figure supplement 1—source data 2
Raw western blot image for panel A (Lower).
- https://cdn.elifesciences.org/articles/69312/elife-69312-fig3-figsupp1-data2-v2.pdf
-
Figure 3—figure supplement 1—source data 3
Dataset values for Figure 3—figure supplement 1.
- https://cdn.elifesciences.org/articles/69312/elife-69312-fig3-figsupp1-data3-v2.xlsx
Figure 3—figure supplement 2

Fast solution stepping with the solution exchange system.
Changes in current when the solution perfusing the mouth of an open patch pipette (filled with 1M KCl) is switched from 20 mM NaCl (low ionic strength) to a solution with 100 mM NaCl (high ionic strength). These solutions were perfused via adjacent barrels of a thinly pulled theta style capillary tubing. The time constant for the change in current amplitude is of the order of 0.4 ms.
Figure 4
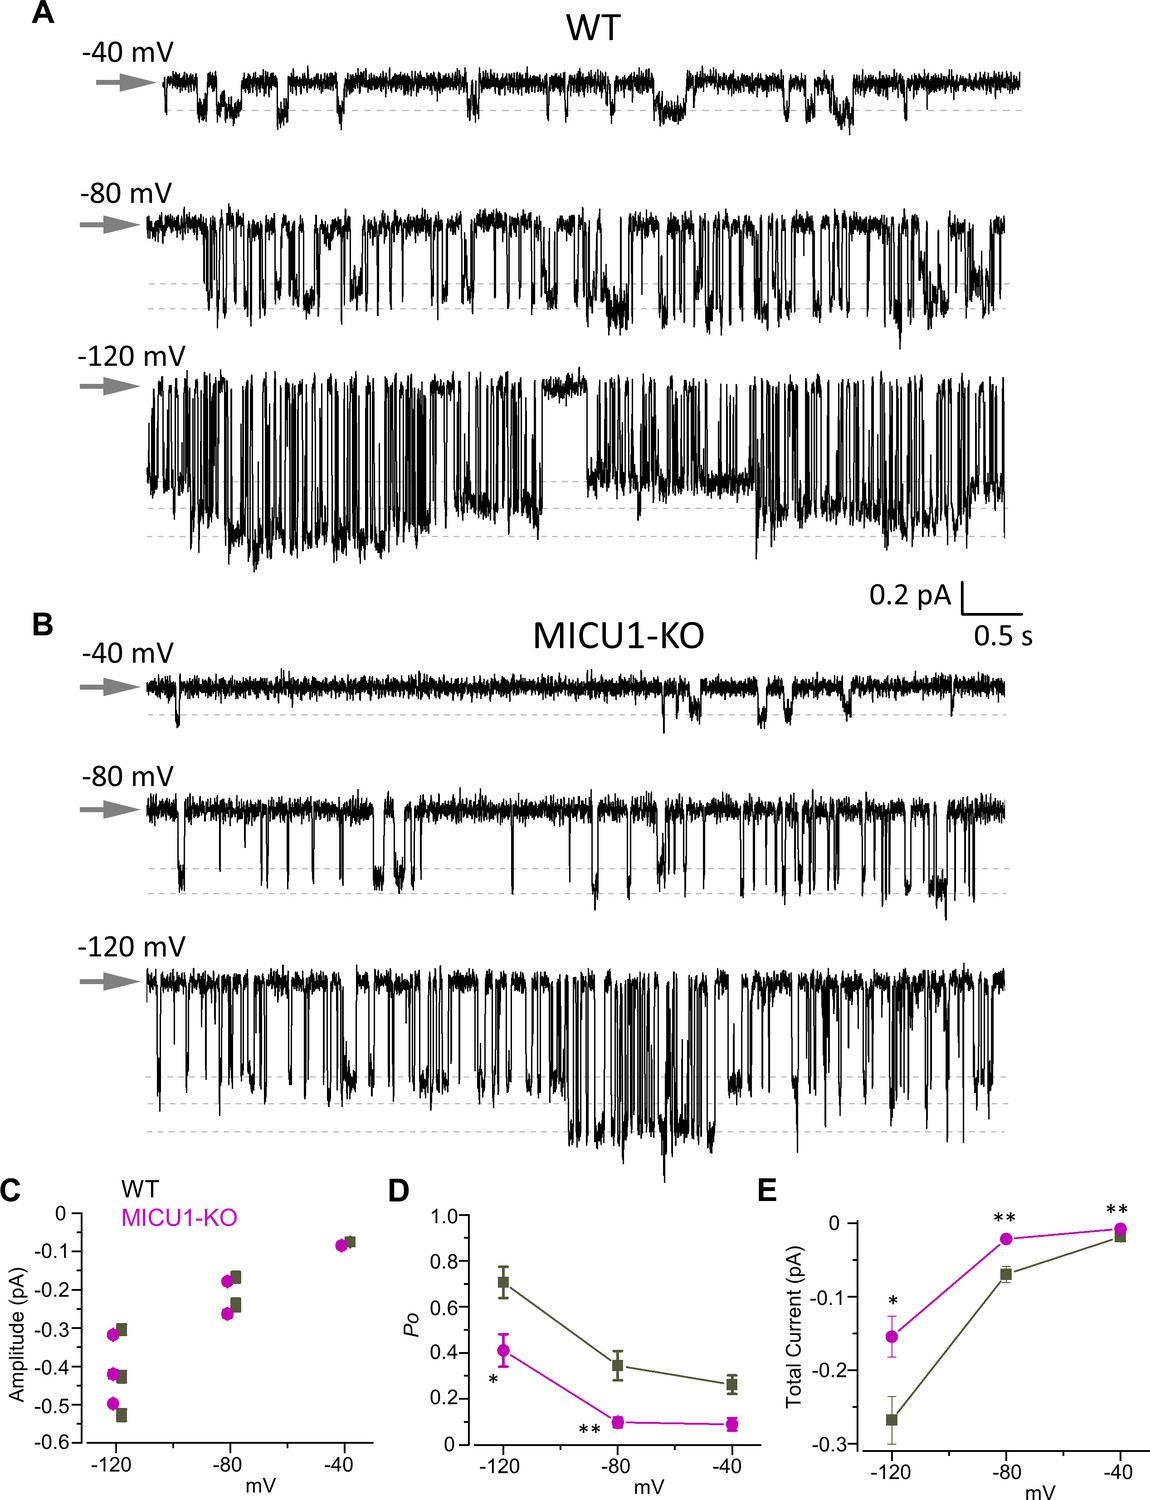
Open probability of the MCU channel in the presence of cytosolic Ca2+ is decreased in MICU1-KO.
(A and B) MCU single-channel Ca2+ currents (iCa) from inside-out IMM patches in WT (A) and MICU1-KO (B), recorded at indicated potentials in symmetrical 105 mM Ca2+, and low-pass filtered at 0.3 kHz for display purposes. Arrows indicate closed-state level, and downward deflections are the open-state events. Multiple subconductance levels are clearly visible at −80 and −120 mV. (C–E) Single-channel amplitudes (C), open probability (Po) (D), and time-averaged unitary current (E) (see Methods) in WT and MICU1-KO at indicated potentials. Data shown as mean ± SEM; unpaired t-test, two-tailed, n = 5–6.
-
Figure 4—source data 1
Dataset values for Figure 4.
- https://cdn.elifesciences.org/articles/69312/elife-69312-fig4-data1-v2.xlsx
Figure 5
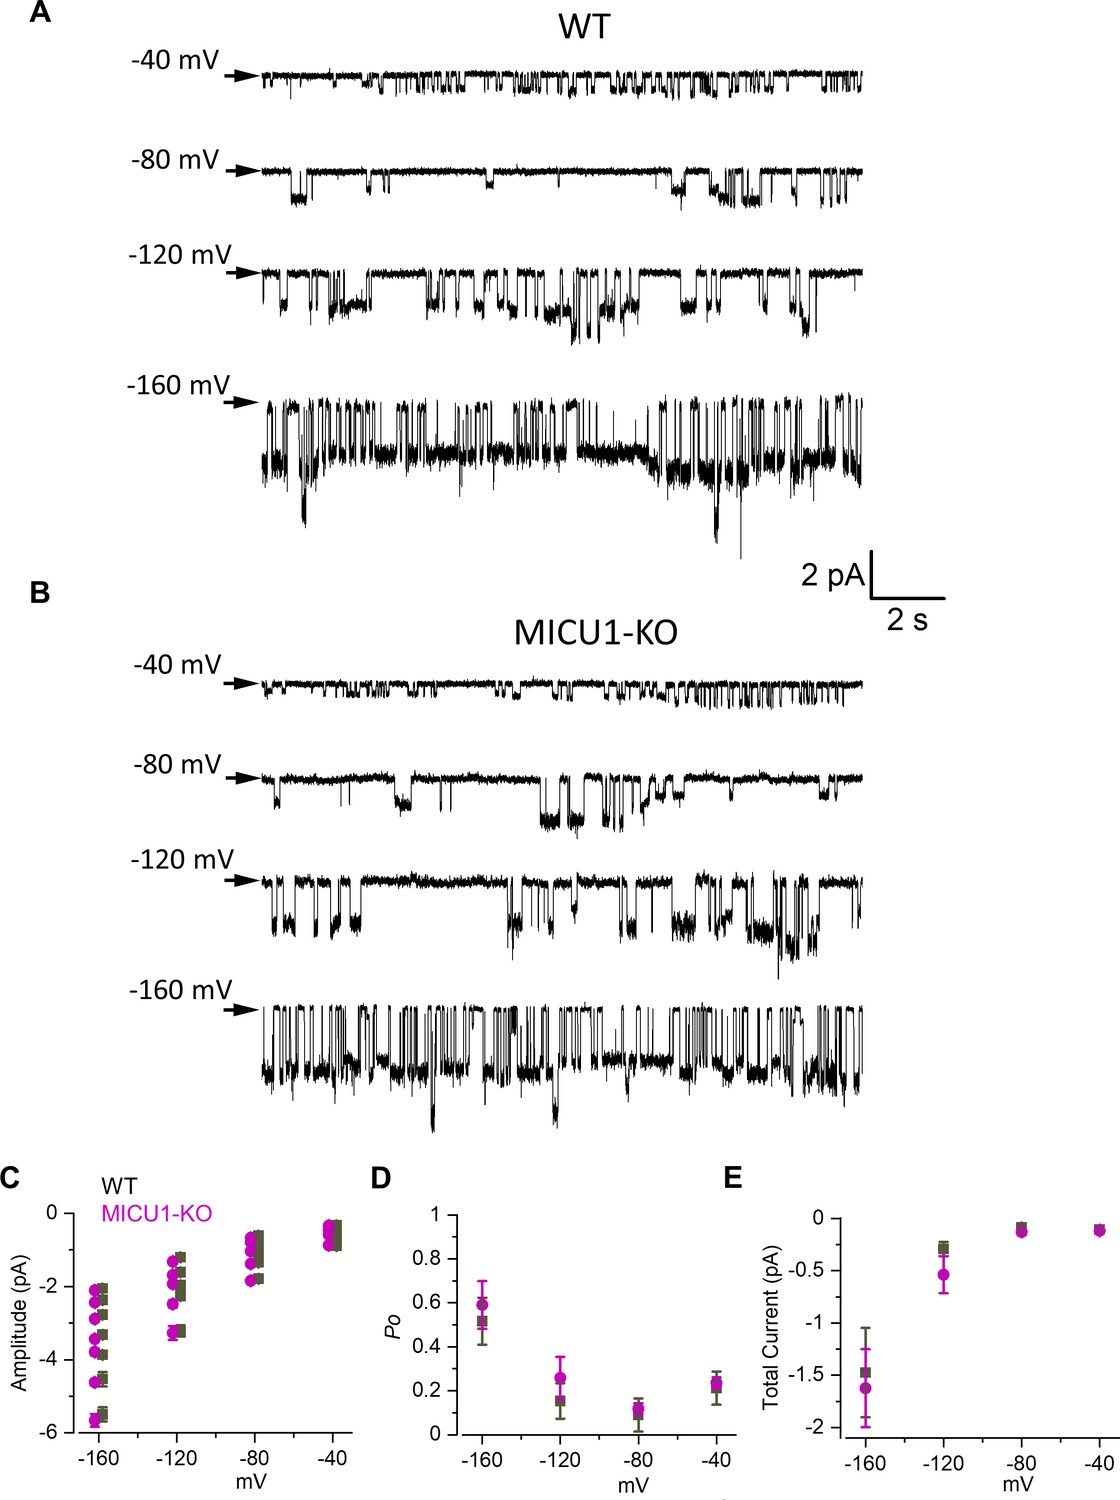
Open probability of the MCU channel in the absence of Ca2+ remains unchanged in MICU1-KO.
(A and B) MCU single-channel Na+ currents (iNa) from inside-out IMM patches in WT (A) and MICU1-KO (B), recorded at indicated potentials in symmetrical 150 mM Na+, and low-pass filtered at 0.3 kHz for display purposes. Arrows indicate closed-state level, and downward deflections are the open-state events. Multiple subconductance levels are clearly visible at all potentials. (C–E) Single-channel amplitudes (C), open probability (Po) (D), and time-averaged unitary current (E) (see Methods) in WT and MICU1-KO at indicated potentials. Data shown as mean ± SEM; unpaired t-test, two-tailed, n = 6–7.
-
Figure 5—source data 1
Dataset values for Figure 5.
- https://cdn.elifesciences.org/articles/69312/elife-69312-fig5-data1-v2.xlsx
Figure 6

IMn is reduced in MICU1-KO to the similar extent as ICa.
(A and B) Representative inward IMn in WT (A), MCU-KO (upper panel) and EMRE-KO (lower panel, B) mitoplasts at 5 mM [Mn2+]i. All superimposed current traces in a single panel are from the same mitoplast. (C) IMn measured at −160 mV from WT, MCU-KO and EMRE-KO mitoplasts. Data shown as mean ± SEM. (n = 3–6). (D) MCU current amplitude (IMCU) in the presence of 5 mM [Ca2+]i and 5 mM [Mn2+]i in WT mitoplasts. Currents were measured at −160 mV. Data shown as mean ± SEM; unpaired t-test, two-tailed. n = 6–14. (E and F) Representative ICa (blue, [Ca2+]I = 1 mM), IMn (green, [Mn2+]I = 5 mM) and inhibition of ICa by Mn2+ (red, [Ca2+]I = 1 mM and [Mn2+]I = 1 mM) as recorded from the same mitoplast in WT (E) and MICU1-KO (F). All superimposed current traces in a single panel are from the same mitoplast. (G–J) IMn (G), ICa (H), IMn/ICa ratio (I, measured in the same mitoplast), and inhibition of ICa by 1 mM [Mn2+]i (J) in WT and MICU1-KO. Data shown as mean ± SEM; unpaired t-test, two-tailed, n = 3–11. (K) Proposed model of the MCU complex gating and the role of MICU subunits in Ca2+-dependent potentiation of the MCU current. The MCU complex is a constitutively active channel and the level of its activity is determined by the probability of open state (Po). At resting [Ca2+]i, Po is low. As [Ca2+]i is increased and Ca2+ binds to the EF hands of MICU subunits, MICUs increase Po, resulting in the increase in the MCU activity.
-
Figure 6—source data 1
Dataset values for Figure 6.
- https://cdn.elifesciences.org/articles/69312/elife-69312-fig6-data1-v2.xlsx
Figure 7
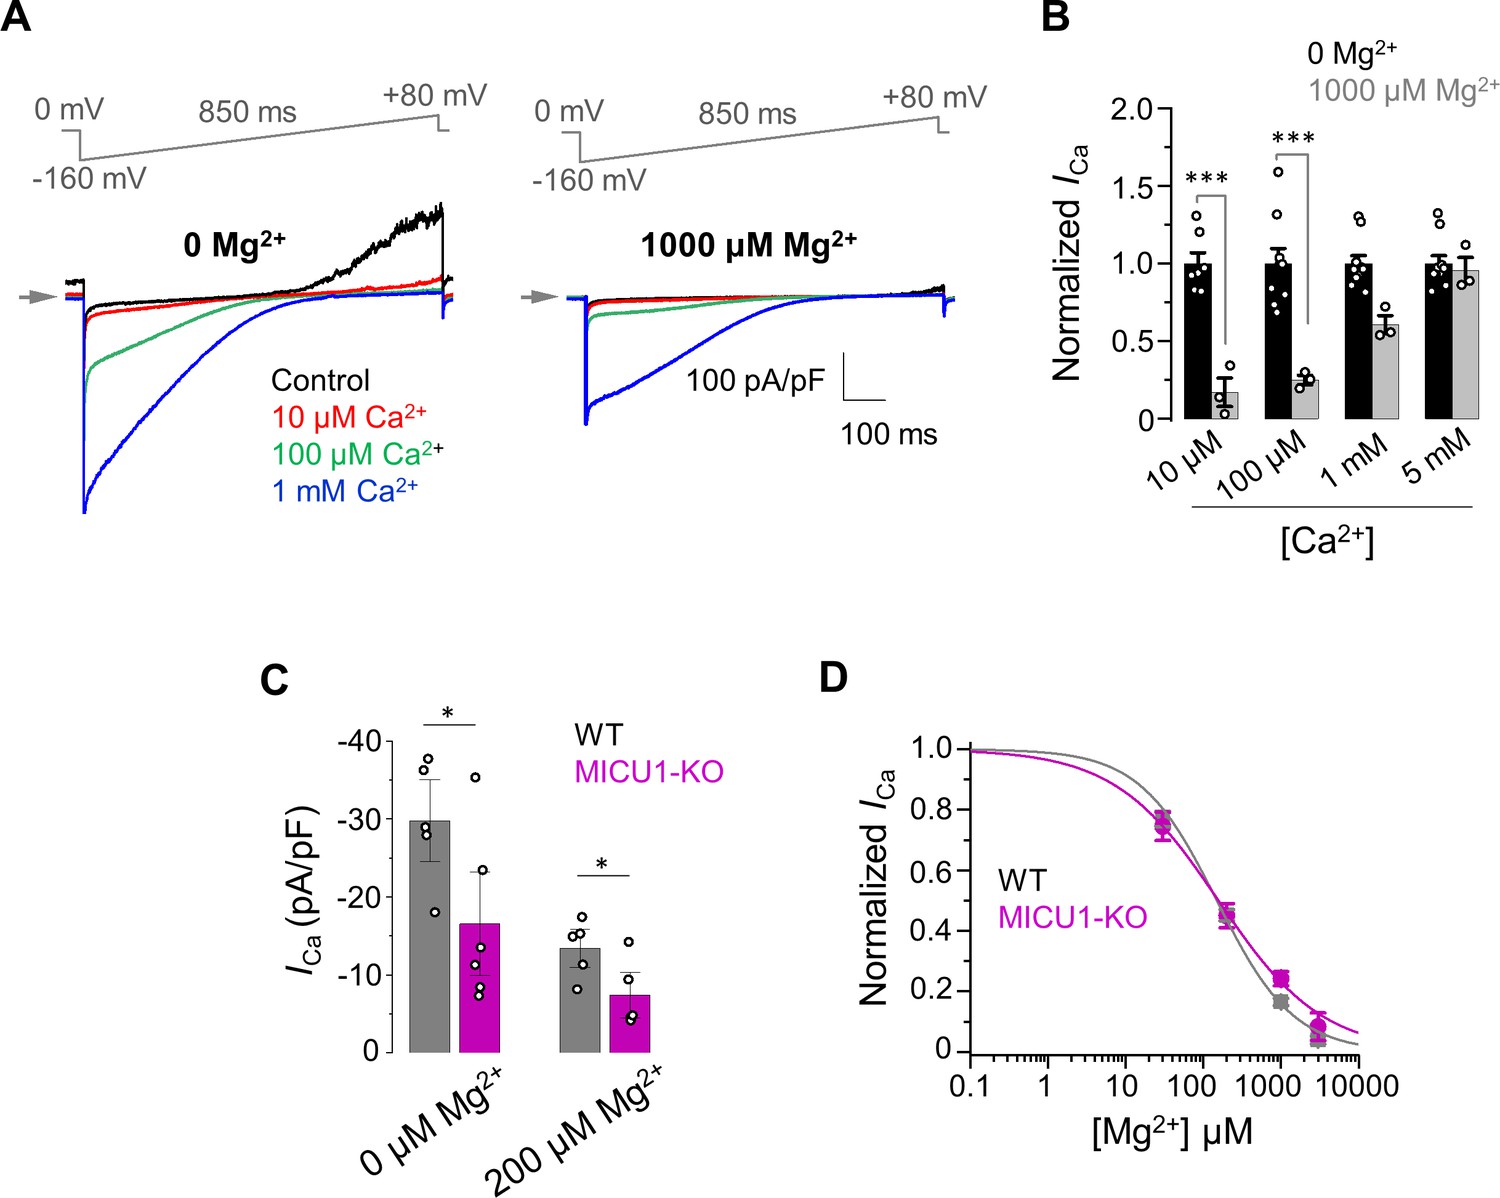
The inhibitory effect of Mg2+ on MCUcx does not depend on MICU1.
(A) Inward ICa elicited at indicated [Ca2+]i in the presence of 0 (left) and 1000 μM (right) [Mg2+]i in WT mitoplasts. (B) ICa elicited at indicated [Ca2+]i in the presence of 0 and 1000 μM [Mg2+]i. ICa amplitudes were measured at −160 mV in WT mitoplasts and normalized per ICa at [Mg2+]i = 0. Mean ± SEM; unpaired t-test, two-tailed. (C) Quantification of ICa elicited at 30 μm [Ca2+]i in the presence of 0 and 200 μM [Mg2+]i in WT and MICU1-KO. Currents were measured at −160 mV. Data shown as mean ± SEM; unpaired t-test, two-tailed, n = 5–6. (D) Dose-response curve of ICa inhibition by [Mg2+]i in WT (IC50 = 149 ± 20 μM, nH = 0.9 ± 0.1; n = 5) and MICU1-KO (IC50 = 156 ± 21 μM, nH = 0.7 ± 0.1; n = 4). Mean ± SEM; unpaired t-test, two-tailed.
-
Figure 7—source data 1
Dataset values for Figure 7.
- https://cdn.elifesciences.org/articles/69312/elife-69312-fig7-data1-v2.xlsx
Tables
Key resources table
| Reagent type (species) or resource | Designation | Source or reference | Identifiers | Additional information |
|---|---|---|---|---|
| Cell line (M. musculus) | DRP1-KO (Dnm1l-/-) (Mouse embryonic fibroblast) | Ishihara et al., 2009 | Cell line maintained in D. Chan and K. Mihara lab; Dnm1l-/- background | |
| Cell line (M. musculus) | WT (Dnm1l+/+) (Mouse embryonic fibroblast) | Liu et al., 2016 | Cell line maintained in T. Finkel lab; Dnm1l+/+ background | |
| Cell line (M. musculus) | MICU1-KO (Micu1-/-) (Mouse embryonic fibroblast) | Liu et al., 2016 | Cell line maintained in T. Finkel lab; Dnm1l+/+ background | |
| Cell line (M. musculus) | MCU-KO (Mcu-/-) (Mouse embryonic fibroblast) | This paper | Cell line maintained in Y. Kirichok and V. Garg lab. Dnm1l-/- background | |
| Cell line (M. musculus) | EMRE-KO (Smdt1-/-) (Mouse embryonic fibroblast) | This paper | Cell line maintained in Y. Kirichok and V. Garg lab. Dnm1l-/- background | |
| Cell line (M. musculus) | MICU1-KO (Micu1-/-) (Mouse embryonic fibroblast) | This paper | Cell line maintained in Y. Kirichok and V. Garg lab. Dnm1l-/- background | |
| Cell line (M. musculus) | MICU2-KO (Micu2-/-) (Mouse embryonic fibroblast) | This paper | Cell line maintained in Y. Kirichok and V. Garg lab. Dnm1l-/- background | |
| Cell line (M. musculus) | MICU3-KO (Micu3-/-) (Mouse embryonic fibroblast) | This paper | Cell line maintained in Y. Kirichok and V. Garg lab. Dnm1l-/- background | |
| Strain, strain background (M. musculus) | MCU-KO (Mcu-/-) mouse | This paper | Mouse line maintained in T. Finkel lab | |
| Recombinant DNA Reagent | Mcu (plasmid) | This paper | Lentiviral Construct (Y. Kirichok and V. Garg lab) | |
| Recombinant DNA Reagent | Smdt1 (alias Emre) (plasmid) | This paper | Lentiviral Construct (Y. Kirichok and V. Garg lab) | |
| Recombinant DNA Reagent | Micu1 (plasmid) | This paper | Lentiviral Construct (Y. Kirichok and V. Garg lab) | |
| Recombinant DNA Reagent | Micu2 (plasmid) | This paper | Lentiviral Construct (Y. Kirichok and V. Garg lab) | |
| Recombinant DNA Reagent | Micu3 (plasmid) | This paper | Lentiviral Construct (Y. Kirichok and V. Garg lab) | |
| Recombinant DNA Reagent | mut-EF-Micu1 (plasmid) | This paper | Lentiviral Construct (Y. Kirichok and V. Garg lab) | |
| Recombinant DNA Reagent | mut-EF-Micu2 (plasmid) | This paper | Lentiviral Construct (Y. Kirichok and V. Garg lab) | |
| Recombinant DNA Reagent | mut-EF-Micu3 (plasmid) | This paper | Lentiviral Construct (Y. Kirichok and V. Garg lab) | |
| Recombinant DNA Reagent | Cepia2mt (plasmid) | Suzuki et al., 2014. Lentiviral construct was made in this paper. | Lentiviral construct | |
| Antibody | MCU antibody (rabbit polyclonal) | Sigma | HPA016480; RRID:AB_2071893 | WB (1:2000) |
| Antibody | EMRE antibody (mouse monoclonal) | Santa Cruz | sc-86337; RRID:AB_2250685 | WB (1:200) |
| Antibody | MICU1 antibody (rabbit polyclonal) | Cell Signalling | D4P8Q (12524S); RRID:AB_2797943 | WB (1:2000) |
| Antibody | MICU2 antibody (mouse monoclonal) | Bethyl laboratories | A300-BL19212 | WB (1:500) |
| Antibody | MICU3 antibody (mouse monoclonal) | Sigma | HPA024779; RRID:AB_1848023 | WB (1:1000) |
| Antibody | VDAC antibody (rabbit monoclonal) | Santa Cruz | ab15895; RRID:AB_2214787 | WB (1:1000) |
| Antibody | TOM20 antibody (rabbit polyclonal) | Santa Cruz | sc-11415; RRID:AB_2207533 | WB (1:2000) |
| Antibody | HSP60 antibody (rabbit polyclonal) | Santa Cruz | sc-1052; RRID:AB_631683 | WB (1:3000) |
| Chemical compound, drug | ANTI-FLAG M2 Affinity Gel | Sigma-Aldrich | Cat# A2220; RRID:AB_10063035 | |
| Software, algorithm | PClamp 10 | Molecular Devices | https://www.moleculardevices.com/systems/conventional-patch-clamp/pclamp-10-software | |
| Software, algorithm | Origin 7.5 | OriginLab | http://www.originlab.com/ | |
| Software, algorithm | ImageJ Software | ImageJ | https://imagej.net/ | |
| Software, algorithm | [Ca2+]m threshold detection algorithm | Custom-made | https://github.com/ishanparanjpe/upstroke (Paranjpe et al., 2019) |
Additional files
-
Supplementary file 1
MICU1 effect on MCUcx.
(a) MICU1 effect on MCUcx as determined by previous electrophysiological experiments. (b) MICU1 effect on MCUcx as determined by previous Ca2+ imaging experiments.
- https://cdn.elifesciences.org/articles/69312/elife-69312-supp1-v2.docx
-
Transparent reporting form
- https://cdn.elifesciences.org/articles/69312/elife-69312-transrepform-v2.pdf
Download links
A two-part list of links to download the article, or parts of the article, in various formats.
Downloads (link to download the article as PDF)
Open citations (links to open the citations from this article in various online reference manager services)
Cite this article (links to download the citations from this article in formats compatible with various reference manager tools)
The mechanism of MICU-dependent gating of the mitochondrial Ca2+uniporter
eLife 10:e69312.
https://doi.org/10.7554/eLife.69312


