The mechanism of MICU-dependent gating of the mitochondrial Ca2+uniporter
- Department of Physiology, University of California San Francisco, United States
- Department of Physiology, University of Maryland, United States
- Department of Biology, University of Maryland, United States
Abstract
Ca2+ entry into mitochondria is through the mitochondrial calcium uniporter complex (MCUcx), a Ca2+-selective channel composed of five subunit types. Two MCUcx subunits (MCU and EMRE) span the inner mitochondrial membrane, while three Ca2+-regulatory subunits (MICU1, MICU2, and MICU3) reside in the intermembrane space. Here, we provide rigorous analysis of Ca2+ and Na+ fluxes via MCUcx in intact isolated mitochondria to understand the function of MICU subunits. We also perform direct patch clamp recordings of macroscopic and single MCUcx currents to gain further mechanistic insights. This comprehensive analysis shows that the MCUcx pore, composed of the EMRE and MCU subunits, is not occluded nor plugged by MICUs during the absence or presence of extramitochondrial Ca2+ as has been widely reported. Instead, MICUs potentiate activity of MCUcx as extramitochondrial Ca2+ is elevated. MICUs achieve this by modifying the gating properties of MCUcx allowing it to spend more time in the open state.
Introduction
Mitochondrial Ca2+ uptake regulates ATP production by modulating the activities of several dehydrogenases in the mitochondrial matrix primarily the pyruvate dehydrogenase and likely other control systems (Glancy and Balaban, 2012; McCormack et al., 1990; McCormack and Denton, 1993; Wescott et al., 2019). Matrix Ca2+ ([Ca2+]m) also plays a crucial role in influencing cell fate (Bernardi, 1999; Berridge et al., 2003; Glancy and Balaban, 2012; Gunter et al., 2010). Physiological and pathological Ca2+ signaling in mitochondria depend on Ca2+ entry into the matrix (Holmström et al., 2015; Kwong et al., 2015; Luongo et al., 2017) and its extrusion through the mitochondrial sodium-calcium exchanger (Boyman et al., 2013; Luongo et al., 2015; Palty et al., 2010) and other mechanisms (Bernardi, 1999; Gunter et al., 2010). Ca2+ entry is mediated by the mitochondrial Ca2+ uniporter holocomplex (MCUcx) (Bernardi, 1999; Deluca and Engstrom, 1961; Gunter et al., 2010), a Ca2+-selective channel that is regulated by the intracellular (extra-mitochondrial) [Ca2+] level ([Ca2+]i) (Fieni et al., 2012; Kirichok et al., 2004). The MCUcx is composed of five distinct subunits types, two of which span the inner mitochondrial membrane (IMM) - MCU and EMRE - and two of the three MICU subunits (MICU1, MICU2, and MICU3) which reside in the intermembrane space (Baughman et al., 2011; De Stefani et al., 2011; Sancak et al., 2013). MICU1 connects an EMRE subunit in the MCUcx with a second MICU subunit. Recent structural discoveries (Wang et al., 2019; Fan et al., 2020; Wang et al., 2020b; Zhuo et al., 2021) suggest that the functioning channel is a dimer composed of two MCU/EMRE pores joined through the N-terminal of MCU subunits in the matrix, and MICU subunits in the intermembrane space.
For Ca2+ to enter the matrix, Ca2+ must first permeate the outer mitochondrial membrane (OMM) through the largely open VDAC (voltage-dependent ‘anion’ channel), a beta-barrel channel into the intermembrane space (IMS). From the IMS, Ca2+ crosses the nearly impermeant inner mitochondrial membrane (IMM) in a highly regulated manner into the mitochondrial matrix through the small conductance, highly selective MCUcx (Kirichok et al., 2004; Williams et al., 2013). The recent dynamic and exciting body of work investigating Ca2+ movement through the MCUcx has led to a number of controversial and perplexing reports (Csordás et al., 2013; Tomar et al., 2019; Foskett and Madesh, 2014; Gottschalk et al., 2019; Hoffman et al., 2013; Mallilankaraman et al., 2012b; Nemani et al., 2018; Perocchi et al., 2010; Tufi et al., 2019; Supplementary file 1a and b). These publications also provoke the possibility that the molecular components of MCUcx have additional broad actions in mitochondria which could complicate our understanding (Tomar et al., 2019; Gottschalk et al., 2019; Tufi et al., 2019). Here, we use an array of quantitative tools to directly examine the conductance of the MCUcx channel and how it is gated by MICU subunits. Our investigation provides reasons to question some of the published working hypotheses and suggest a new view of the molecular gating of MCUcx.
Results
Quantitative assessment of the MCUcx and its subunits
A whole mitoplast patch clamp method was used to measure whole IMM current to assess MCUcx function (Fieni et al., 2012; Garg and Kirichok, 2019; Kirichok et al., 2004) and determine how the subunits contribute to the measured MCUcx current. Mitochondria were isolated from DRP1 knockout (KO) mouse embryonic fibroblasts (MEFs) (Ishihara et al., 2009). DRP1 is encoded by the Dnm1l. The DRP1-KO MEFs were used to prepare mitoplasts using a French Press. This cell line was chosen as the source for many experiments because it provided a significantly higher proportion of large isolated mitoplasts and enabled the recording of stable MCUcx currents with a favorable signal-to-noise ratio. We confirmed that this cell line expresses all principal subunits of the MCU complex (Figure 1—figure supplement 1). Importantly, the MCUcx was intact in isolated mitoplasts, and its composition was the same as in intact mitochondria (Figure 1—figure supplement 2F). We also generated gene knockouts for all principal subunits of the MCU complex (MCU, EMRE, and MICU1−3) using CRISPR-Cas9 in this cell line (Figure 1—figure supplement 1). MCU, EMRE, and MICU1−3 are encoded by the Mcu, Smdt1 and Micu1−3 genes, respectively.
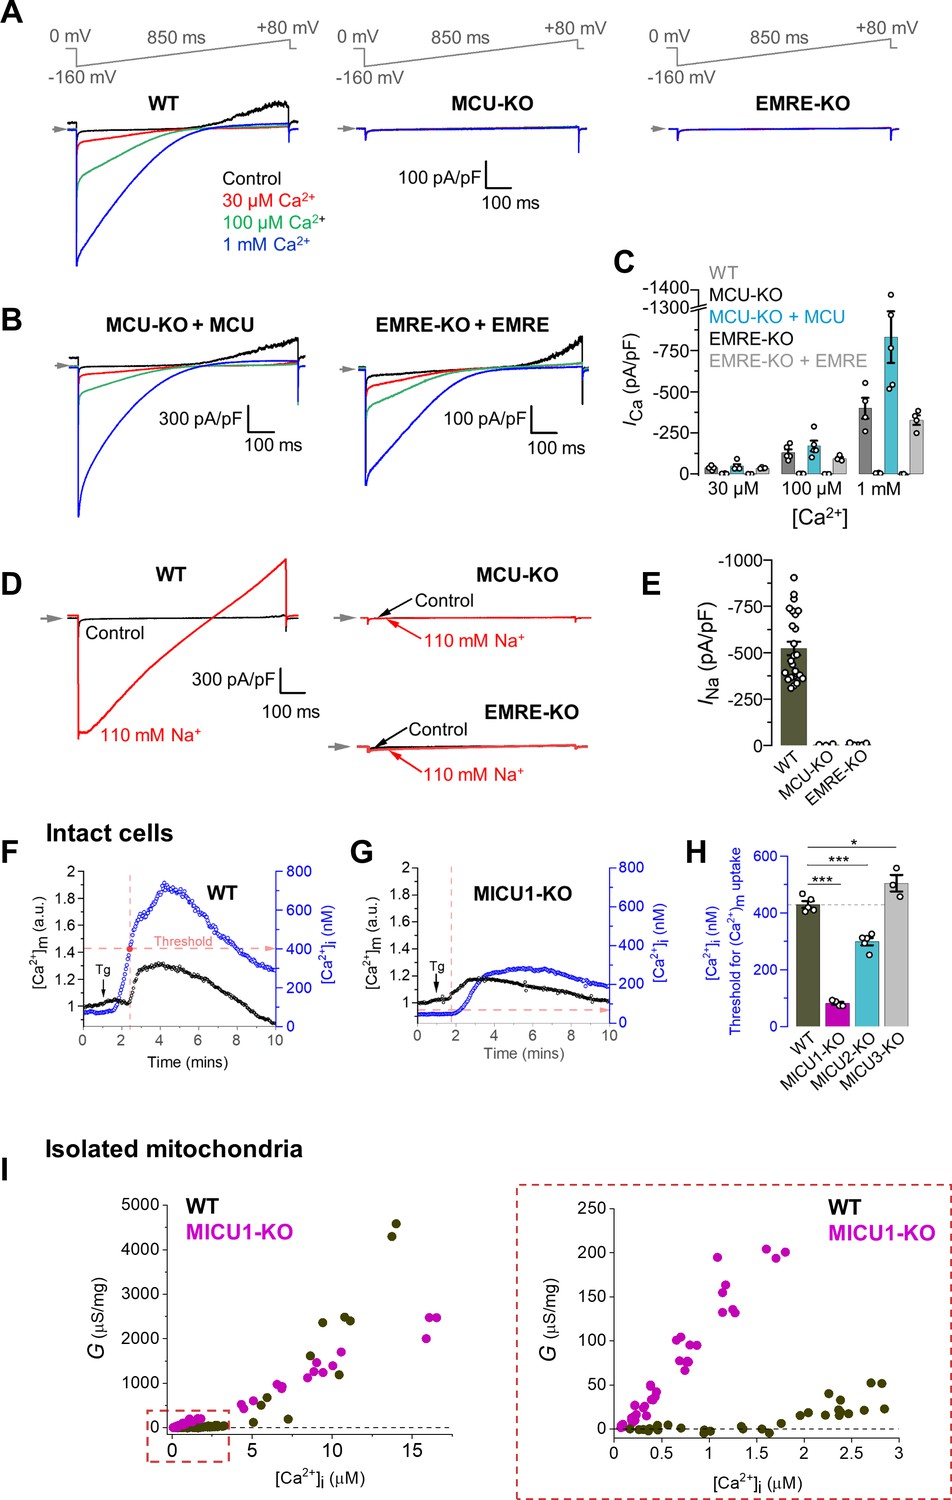
Figure 1A shows the [Ca2+]i dependence of the MCUcx current in mitoplasts from WT DRP1-KO MEFs, and shows the absence of Ca2+ current (ICa) in MCU-KO or EMRE-KO. Additionally, it shows an important feature of the MCUcx; in the absence of extramitochondrial Ca2+ (control trace), there is outward current at positive potentials resulting from the efflux of Na+ through the MCUcx due to the 110 mM Na+ gluconate in the matrix from the patch pipette (Figure 1A, Figure 1—figure supplement 2D and E). When extramitochondrial Ca2+ is present, Ca2+ enters the selectivity filter of the MCUcx channel to block Na+ permeation (Fieni et al., 2012; Garg and Kirichok, 2019; Kirichok et al., 2004) and no outward current is seen. Importantly, MCUcx currents can be rescued by the ectopic expression of the MCU and EMRE subunits in their corresponding knockout cell lines (Figure 1B and C, Figure 1—figure supplement 2G and H). From these results, the DRP1-KO MEFs recapitulate key findings in previous publications (Chaudhuri et al., 2013; Fieni et al., 2012; Kirichok et al., 2004; Sancak et al., 2013). We show an additional novel observation, important to our later experiments, that when Na+ is used to replace Ca2+ in the cytosolic compartment (i.e. the bath solution), an MCU-mediated Na+ current (INa) is observed, and this current also depends on the presence of MCU and EMRE (Figure 1D and E, Figure 1—figure supplement 2D and E).
Figure 1 with 3 supplements see all
Characterization of MCUcx properties in isolated mitoplasts, intact cells, and isolated mitochondria from MEFs.
(A) Inward ICa elicited by a voltage ramp in WT, MCU-KO and EMRE-KO mitoplasts exposed to [Ca2+]i of 30 μM, 100 μM, and 1 mM. In WT, also note an outward Na+ current via MCU at positive voltages in Ca2+-free bath solution (Control). Voltage protocol is indicated on the top. All superimposed current traces in a single panel are from the same mitoplast. (B) ICa is rescued by the recombinant expression of MCU and EMRE in their respective knockout cell lines. (C) ICa density measured at −160 mV at different [Ca2+]i in indicated cell lines; n = 4–5. (D) Representative INa in WT, MCU-KO and EMRE-KO mitoplasts at 110 mM [Na+]i. (E) INa density measured at −80 mV in WT, MCU-KO, and EMRE-KO mitoplasts; n = 3–20. (F and G) Representative [Ca2+]m (black, left ordinate) and [Ca2+]i (blue, right ordinate) in an individual cell with (F) WT MCUcx, and (G) MICU1 knockout before and after application of 300 nM thapsigargin (Tg, arrow). Dashed red lines indicate the [Ca2+]i at which the [Ca2+]m starts to increase (‘Threshold’). (H) [Ca2+]i threshold for [Ca2+]m elevation in WT and indicated knockout cell lines; n = 3–4 dishes, total cells = ~150 each group. Data shown as mean ± SEM; one-way ANOVA with post-hoc Tukey test. Statistics was run on number of dishes. (I) Ca2+ conductance (G) of the IMM plotted as a function of [Ca2+]i. Right panel shows the zoomed-in region for [Ca2+]i between 0 and 3 μM; n = 64–75 independent experiments, N = 4–7 independent preparations, all data is shown. All superimposed current traces in a single panel are from the same mitoplast. Data shown as mean ± SEM.
-
Figure 1—source data 1
Dataset values for Figure 1.
- https://cdn.elifesciences.org/articles/69312/elife-69312-fig1-data1-v2.xlsx
In intact WT cells, the [Ca2+]i increase (elicited by SERCA inhibitor thapsigargin) was followed, after a short delay, by [Ca2+]m elevation as detected by a genetically-encoded Ca2+ indicator Cepia targeted to mitochondria (Suzuki et al., 2014; Figure 1—figure supplement 2A). However, as expected, in MCU-KO or EMRE-KO cell lines that have no functional MCUcx (Baughman et al., 2011; De Stefani et al., 2011; Sancak et al., 2013), no significant [Ca2+]m elevation was observed (Figure 1—figure supplement 2B and C).
One of the controversial elements in previously published experiments is the explanation of the cause of the ‘threshold’ of the MCUcx Ca2+ influx into the matrix (Csordás et al., 2013; Tomar et al., 2019; Foskett and Madesh, 2014; Hoffman et al., 2013; Mallilankaraman et al., 2012b; Perocchi et al., 2010; Tufi et al., 2019). It was noted initially (Mallilankaraman et al., 2012b) that there is a cytosolic concentration of Ca2+ ([Ca2+]i) below which there is no MCUcx-medicated Ca2+ influx. Figure 1F shows that such a threshold for DRP1-KO WT MEF is indeed found at around 400 nM Ca2+. This threshold is largely gone in MICU1-KO cells (Figure 1G). In MICU2-KO and MICU3-KO cells, the changes in the threshold levels are shown in Figure 1H, and Figure 1—figure supplement 3A–D. Past studies of other investigators have used similar information from their MICU1-KO cells to argue that MICU1 forms a ‘plug’ or an occlusion in the channel pore. This implies that in MICU1-KO cells, the MCUcx conductance should be greater due to the removal of the plug. This conclusion, however, is challenged by the Ca2+ conductance studies shown here in isolated mitochondria from WT MEFs shown in Figure 1I and Figure 1—figure supplement 3E. While the Figure shows increased conductance of MCUcx at low [Ca2+]i in the MICU1-KO mitochondria consistent with the removal of a putative MCUcx‘plug’, there is decreased conductance at high [Ca2+]i (~8 μM or higher), an observation that is inconsistent with the plug hypothesis (Mallilankaraman et al., 2012b). Additional recent modifications of this hypothesis add the prediction that allosteric actions of MICU1 on MCUcx account for any inconsistencies or contradictions of the plug hypothesis (Csordás et al., 2013). Moreover, new findings suggest that there may be broad actions of MICU1 on non-MCUcx targets within the mitochondria (Tomar et al., 2019; Gottschalk et al., 2019; Tufi et al., 2019). These findings and the unrefined and untested modifications of the plug hypothesis motivate additional investigations. We have carried out new quantitative experiments and analysis that may help us better understand how MICU1 works in the context of the MCUcx as is shown in Figure 2.
Figure 2 with 3 supplements see all
MICUs are [Ca2+]i-dependent MCUcx potentiators.
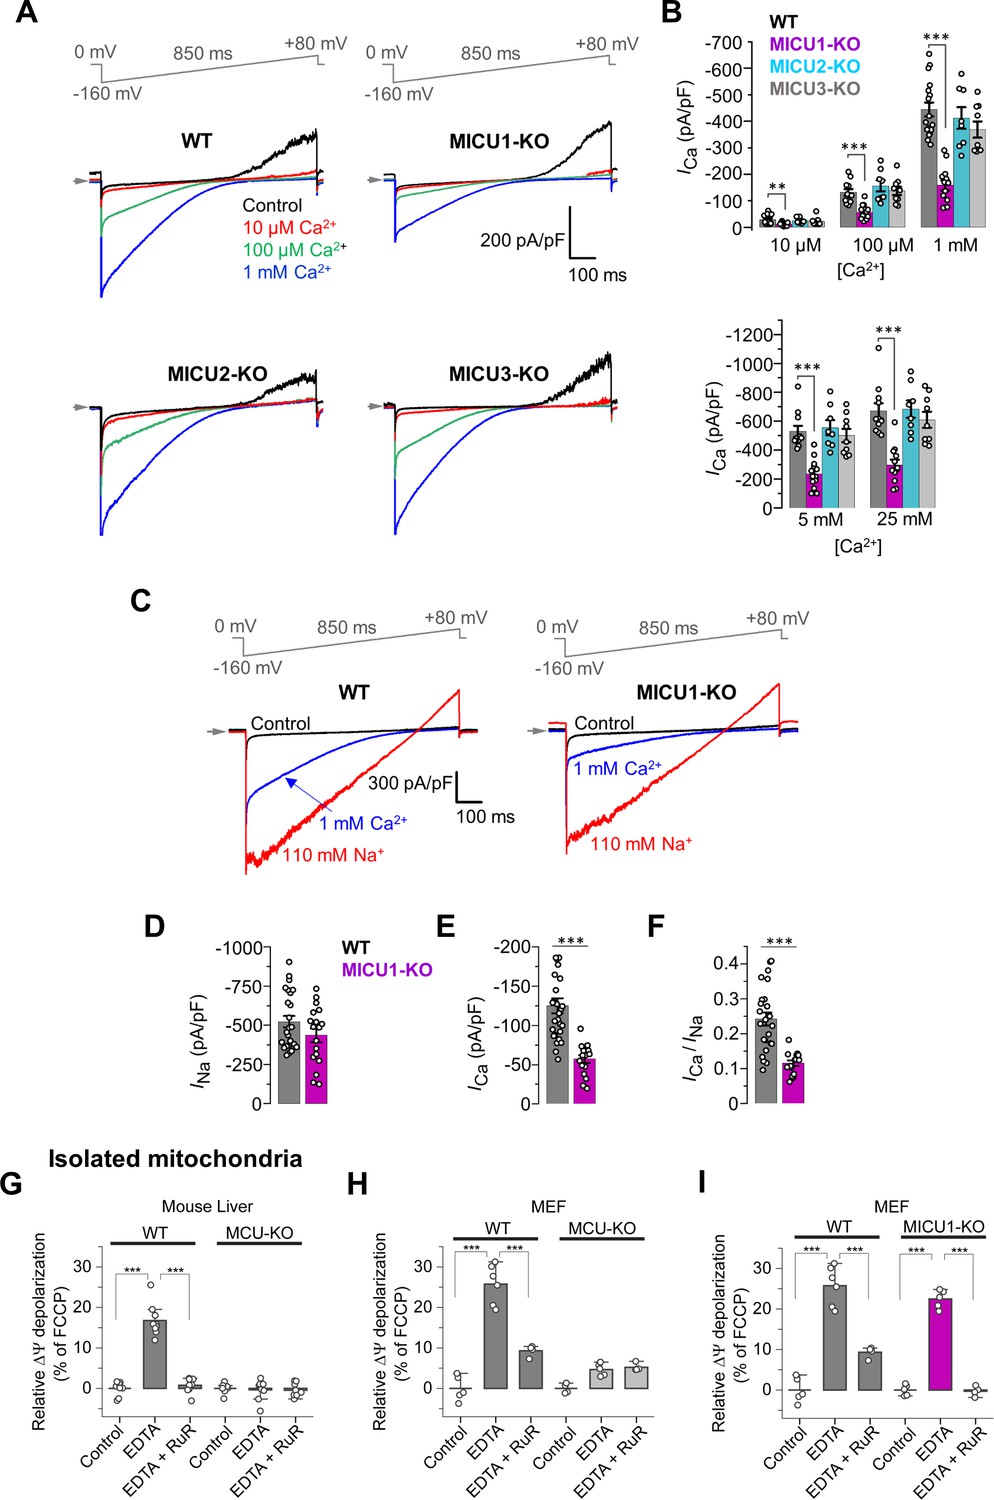
(A) Inward ICa in WT, MICU1-KO, MICU2-KO, and MICU3-KO mitoplasts exposed to 10 μM, 100 μM and 1 mM [Ca2+]i. (B) ICa densities measured at −160 mV and [Ca2+]i of 10 μM, 100 μM, and 1 mM (upper), as well as 5 mM and 25 mM (lower). Data shown as mean ± SEM; one-way ANOVA with post-hoc Tukey test, n = 8–17. (C) Representative ICa (blue) and INa (red) recorded from the same WT and MICU1-KO mitoplasts exposed to 1 mM [Ca2+]i or 110 mM [Na+]i in the absence of Ca2+. (D–F) Amplitudes of INa (D) and ICa (E), as well as the ICa/INa ratio (F) in the same WT and MICU1-KO mitoplasts. Currents were measured at −80 mV. Data shown as mean ± SEM; unpaired t-test, two-tailed, n = 18–27. (G and H) ΔΨ depolarization induced by application of 5 mM EDTA in suspension of isolated mitochondria from mouse liver (G) and MEF (H). The degree of depolarization is expressed as percentage of the full depolarization induced by 1 µM FCCP. Both WT and MCU-KO mitochondria were assessed. Data shown as mean ± SEM; one-way ANOVA with Tukey test, n = 4–9. (I) ΔΨ depolarization induced by application of 5 mM EDTA in suspension of isolated mitochondria from MEF with WT and MICU1-deficient MCUcx. WT data in panel I is the same as in panel H. The degree of depolarization is expressed as percentage of the full depolarization induced by 1 µM FCCP. Data shown as mean ± SEM; one-way ANOVA with Tukey test, n = 4–5. All superimposed current traces in a single panel are from the same mitoplast.
-
Figure 2—source data 1
Dataset values for Figure 2.
- https://cdn.elifesciences.org/articles/69312/elife-69312-fig2-data1-v2.xlsx
MICUs are [Ca2+]i-dependent MCUcx potentiators
To investigate how MICU1 works, ICa was measured in mitoplasts at five extramitochondrial [Ca2+]i levels, 10 μM, 100 μM, 1 mM, 5 mM, and 25 mM (Figure 2A and B, and Figure 2—figure supplement 1A–C). WT mitoplasts show ICa records similar to the current density measurements from MICU2-KO and MICU3-KO mitoplasts. In contrast, WT mitoplasts have ICa current densities that are roughly twice the size of the current densities from the MICU1-KO mitoplasts. This finding is like the conductance measurements at elevated [Ca2+]i in Figure 1I and thus inconsistent with the plug hypothesis that posits that MICU1 is an obstructing plug of MCUcx.
The expression of EMRE protein (but not MCU) was significantly reduced in MICU1-KO (Figure 2—figure supplement 1D–F), as was also shown previously (Liu et al., 2016). However, the lower EMRE expression in MICU1-KO was not a limiting factor for ICa, because EMRE overexpression in MICU1-KO cells did not rescue the ICa reduction (Figure 2—figure supplement 1G–I). Therefore, the ICa reduction in MICU1-KO was not caused by reduction in MCU or EMRE.
To better understand the role played by the MICU1 subunit in the function of the MCUcx, we used a novel test to characterize the MCUcx channel properties independent of Ca2+ conductance. We used Na+ current via MCUcx (INa) in the absence of both Ca2+ and Mg2+ (using EDTA) (Fieni et al., 2012; Garg and Kirichok, 2019; Kirichok et al., 2004), to calibrate ICa and characterize MCUcx as shown in Figure 2C–D. Here, it is shown that the Na+ current through MCUcx is indistinguishable in magnitude when it is measured in WT and MICU1-KO mitoplasts (Figure 2D). This provides evidence that the MCUcx conductance pathway is the same in WT and MICU1-KO. Nevertheless, when Ca2+ permeates MCUcx, the ICa in WT is roughly twice that of the current through MICU1-KO mitoplasts (Figure 2E). Also, the ICa/INa ratio as measured in the same mitoplast decreased approximately twice in MICU1-KO in comparison to WT (Figure 2F). Importantly, the reduction in ICa/INa ratio in MICU1-KO could not be explained by altered relative affinities for Ca2+ and Na+ binding in the selectivity filter, because INa was inhibited to the same extent by 2 nM [Ca2+]i in both WT and MICU1-KO mitoplasts (Figure 2—figure supplement 2A and B). From this we conclude that the MICU1 subunit enhances the MCU current at high [Ca2+]i and does not occlude the MCUcx channel when [Ca2+]i is low.
We also reproduced these results in MEFs with intact DRP1 (Dnm1l+/+). In these cells, the amplitudes of ICa and INa were the same as in Dnm1l-/- MEFs (Figure 2—figure supplement 3A and B). Similar to MICU1 knockout in Dnm1l-/- MEFs, MICU1 knockout in Dnm1l+/+ MEFs did not affect INa while markedly reduced ICa (Figure 2—figure supplement 3C–E). Additionally, MICU1-KO reduced the ICa/INa ratio, as measured in the same mitoplast, to the similar extent in Dnm1l+/+ MEFs (Figure 2—figure supplement 3F). Thus, as expected, Drp1 presence or absence does not affect currents mediated by the MCU complex or the MICU1-KO phenotypes.
The lack of the MCUcx occlusion by MICU1 at low [Ca2+]i was further tested in intact isolated mitochondria as shown in Figure 2G–I. In these experiments, we found that depletion of Ca2+ and Mg2+ using EDTA enables a Na+ influx via MCUcx that depolarizes ΔΨm (Figure 2G and H). As shown in Figure 2I, this influx depolarizes ΔΨm to the same extent whether MICU1 was expressed or not, again showing the lack of MCUcx occlusion by MICUs.
Since in MICU1-KO, all MICUs are removed from the MCUcx complex, we conclude that MICUs do not plug the MCUcx channel when [Ca2+]i is low. Instead, the function of MICUs is to potentiate MCUcx activity at elevated [Ca2+]i.
Role of the Ca2+-binding EF hands of MICUs
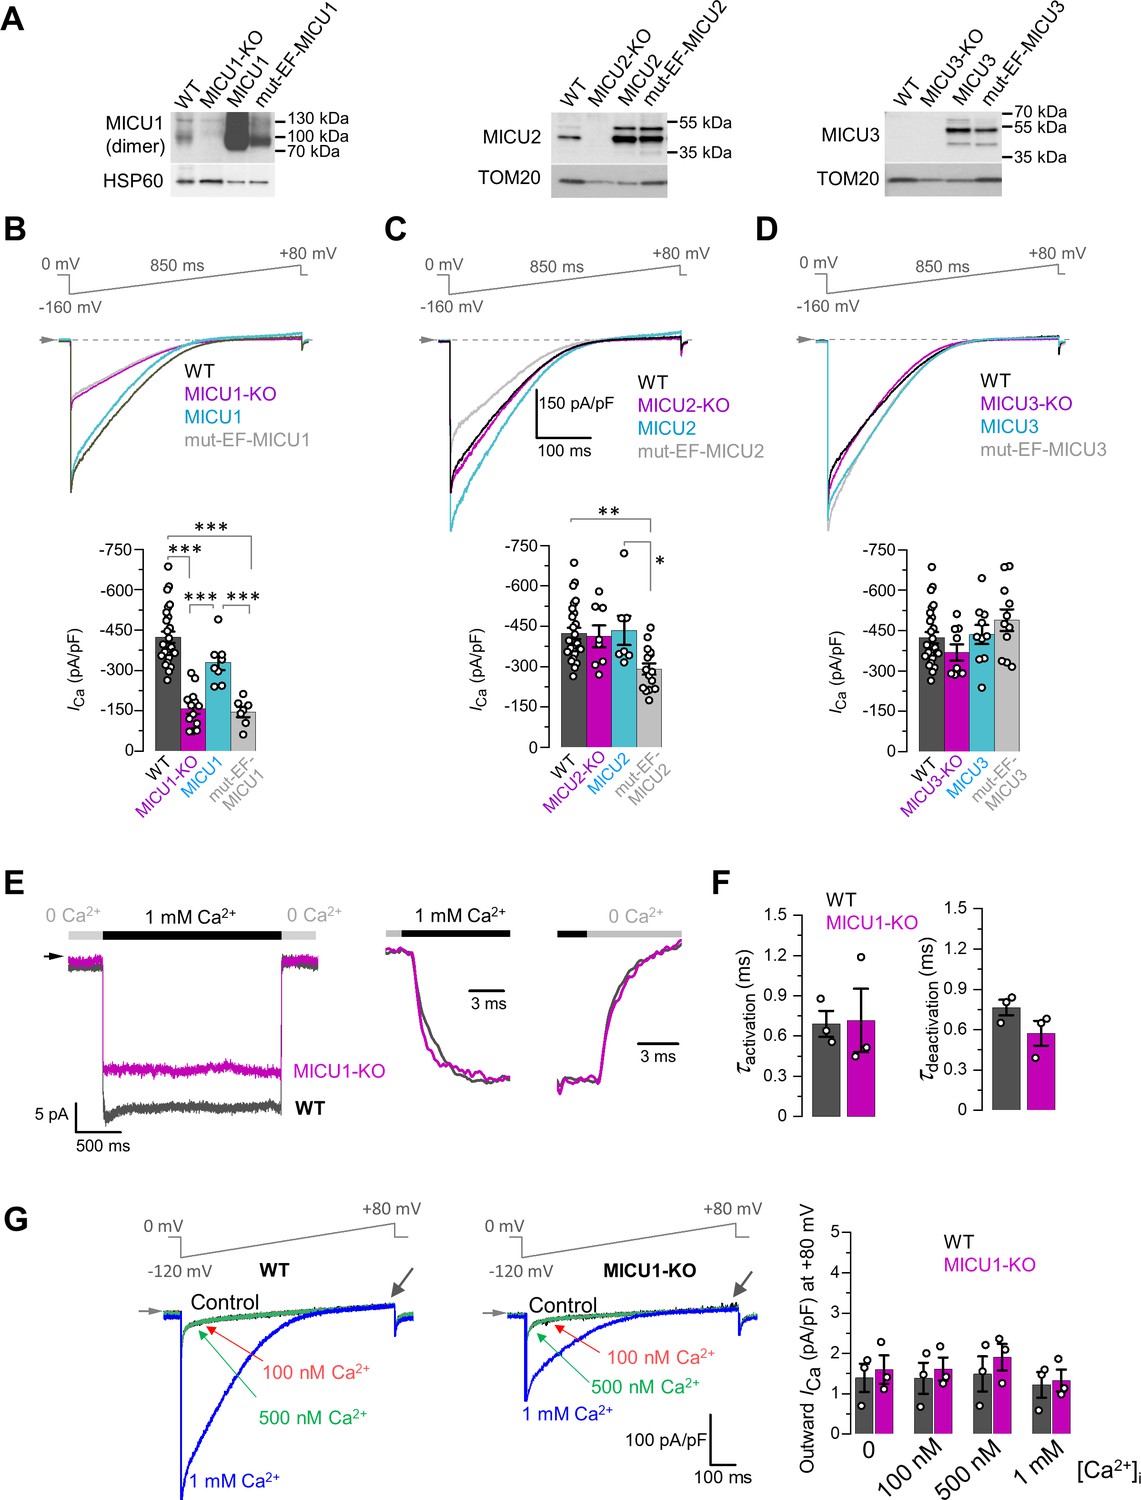
The Ca2+-dependent potentiation of MCUcx imparted by the MICU subunits is likely to be mediated by Ca2+ binding to their EF hands. To test this hypothesis, we recombinantly expressed MICU1–3 or MICU1–3 with mutated EF hands (mut-EF-MICU, to disable Ca2+ binding Kamer et al., 2017) in their respective knockout cell lines [Figure 3A] and examined the changes in ICa. Expression levels of both the recombinant WT and mut-EF-MICU proteins were significantly higher as compared to endogenous MICUs expression in each case (Figure 3A).
Figure 3 with 2 supplements see all
Effects of MICU subunits and their EF hands on the amplitude, kinetics and rectification of ICa.
(A) Western blots showing overexpression of MICU subunits or MICU subunits with non-functional EF hands (mut-EF-MICU) in their respective knockout background (left, MICU1-KO; middle, MICU2-KO and; right, MICU3-KO). For MICU1 (left panel), samples were prepared without reducing agent, β-mercaptoethanol. The MICU1 band is near the expected molecular weight for the homo- or heterodimer (with MICU2 or 3). (B–D) Upper panels: ICa in MICU1-KO (B), MICU2-KO (C), and MICU3-KO (D) before and after overexpression of a corresponding MICU subunit or its EF hand mutant, as compared to WT. Representative ICa traces recorded from the mitoplasts of different backgrounds in 1 mM [Ca2+]i are shown together in a single panel. Lower panels: quantification of ICa amplitudes from the upper panel at −160 mV. The same WT and knockout data were used as in Figure 2B. All superimposed current traces in a panel are compiled from multiple mitoplasts. Data shown as mean ± SEM; one-way ANOVA with post-hoc Tukey test. n = 7–26. (E) Left panel: ICa measured at a holding voltage of −100 mV while [Ca2+]i was rapidly (τ ~0.4 ms, see Materials and methods) switched from virtual zero to 1 mM and then back to virtual zero in WT (gray) and MICU1-KO (purple) mitoplasts. Right panel, ICa kinetics within ~10 ms after the fast [Ca2+]i elevation and subsequent decrease in WT (gray) and MICU1-KO (purple) mitoplasts from the left panel. ICa traces were normalized to the maximal amplitude to facilitate comparison of kinetics in WT and MICU1-KO. (F) Left: ICa activation time constant (τactivation) in WT and MICU1-KO; Right: ICa deactivation time constant (τdeactivation) in WT and MICU1-KO. Data shown as mean ± SEM, n = 3. (G) ICa at [Ca2+]m = 2 mM and indicated [Ca2+]i in WT and MICU1-KO. Black arrows point out where the amplitude of outward ICa was measured. Bar-graph shows the amplitude of outward ICa measured at +80 mV. All superimposed current traces in a single panel are from the same mitoplast. Data shown as mean ± SEM, n = 3, each [Ca2+]i.
-
Figure 3—source data 1
Raw western blot image for panel A.
- https://cdn.elifesciences.org/articles/69312/elife-69312-fig3-data1-v2.pdf
-
Figure 3—source data 2
Dataset values for Figure 3.
- https://cdn.elifesciences.org/articles/69312/elife-69312-fig3-data2-v2.xlsx
In MICU1-KO, expression of MICU1 was able to restore ICa to the WT level, but mut-EF-MICU1 expression failed to do so (Figure 3B). This confirms our hypothesis that Ca2+ binding to the EF hands of MICU1 is indispensable for the ICa potentiation.
In MICU2-KO, ICa was not significantly affected (Figure 3C, and Figure 2A and B), because the loss of MICU2 appeared to be compensated with increased MICU1 expression and formation of MICU1 homodimers (Patron et al., 2014; Figure 3—figure supplement 1A). Therefore, overexpression of recombinant MICU2 in the knockout background only reverted the MICU1 homodimer back to heterodimer without any change in the ICa amplitude (Figure 3C). In contrast, mut-EF-MICU2 overexpression displaced MICU1 from the homodimers in favor of MICU1/mut-EF-MICU2 heterodimer, leading to a decrease in the total number of functional EF hands in the heterodimer. This results in a significant decrease in MICU-dependent ICa potentiation (Figure 3C). These functional data, combined with biochemical/structural evidence for preferential formation of MICU1/MICU2 heterodimers (Fan et al., 2020; Patron et al., 2014; Petrungaro et al., 2015; Wang et al., 2019; Wang et al., 2020a; Wang et al., 2020b; Xing et al., 2019; Zhuo et al., 2021), suggest that MICU2, along with MICU1, is responsible for allosteric potentiation of MCU upon binding of cytosolic Ca2+ to their EF hands.
The composition of MICU dimers can also be affected by MICU3 that, similar to MICU2, was proposed to interact and form heterodimers with MICU1 (Patron et al., 2019; Plovanich et al., 2013). MICU3 is a minor protein as compared to MICU1 and 2 in the majority of tissues and cell lines (Patron et al., 2019), which also appears to be the case in our system (Figure 3A). Accordingly, ICa was not affected in MICU3-KO mitoplasts, and overexpression of recombinant MICU3 or mut-EF-MICU3 in MICU3-KO also had no effect on ICa (Figure 3D). MICU3 is profoundly expressed in neurons where it was shown to increase the efficiency of mitochondrial Ca2+ uptake in axons (Ashrafi et al., 2020).
Ca2+ binding to the EF hands of MICU subunits and a subsequent conformational change that potentiates the MCUcx activity require a finite time and may delay ICa activation/deactivation in response to rapid changes in [Ca2+]i. Therefore, we examined ICa activation and deactivation kinetics in response to rapid changes in [Ca2+]i and tested whether they depend on MICUs. ICa activation upon rapid elevation of [Ca2+]i from virtually Ca2+-free to 1 mM was immediate, with kinetics comparable to the rate of solution exchange (τ ~0.4 ms) achieved by our fast application system (Figure 3E, and Figure 3—figure supplement 2). Importantly, the kinetics of the ICa rapid response was not altered in MICU1-KO (Figure 3E and F). The deactivation kinetics was similarly fast and not dependent on MICU1 (Figure 3E and F). The result of these experiments correspond to the previous observation that EF hands of calmodulin bind Ca2+ with a µs time constant (Faas et al., 2011). The conclusion from these experiments is that the kinetics of Ca2+ binding to the MICU’s EF hands, and the resultant conformational change in the MCUcx, are fast enough that MICUs and mitochondria will rapidly track changes in [Ca2+]i.
The MCUcx is an inward rectifying Ca2+ channel (Kirichok et al., 2004). However, it remains unclear if the MICUs contribute to this feature. To examine this possibility, we measured ICa in the presence of 2 mM [Ca2+]m (pipette solution). Under these conditions, no outward ICa was observed either before or after [Ca2+]i elevation in either WT or MICU1-KO. However, as expected, 1 mM [Ca2+]i induced a robust inward ICa (Figure 3G). Thus, the MICUs do not appear to be responsible for the inward rectification of MCUcx, and the inward rectification is an inherent property of the pore proteins.
Recently published work suggested that MCUcx might be inhibited by matrix [Ca2+] (Vais et al., 2016; Vais et al., 2020), specifically at [Ca2+]m ~400 nM. However, as shown in Figure 3—figure supplement 1B–C, ICa amplitude is unchanged when [Ca2+]m was set at either Ca2+-free, or 400 nM, or 400 µM. Thus, the MCUcx is not regulated by matrix Ca2+, and MICUs only impart the regulation of the MCUcx by cytosolic Ca2+.
Taken together, these data indicate that binding of cytosolic Ca2+ to EF hands of MICU subunits allosterically potentiates MCUcx currents.
MICUs regulate the open state probability of MCUcx channel
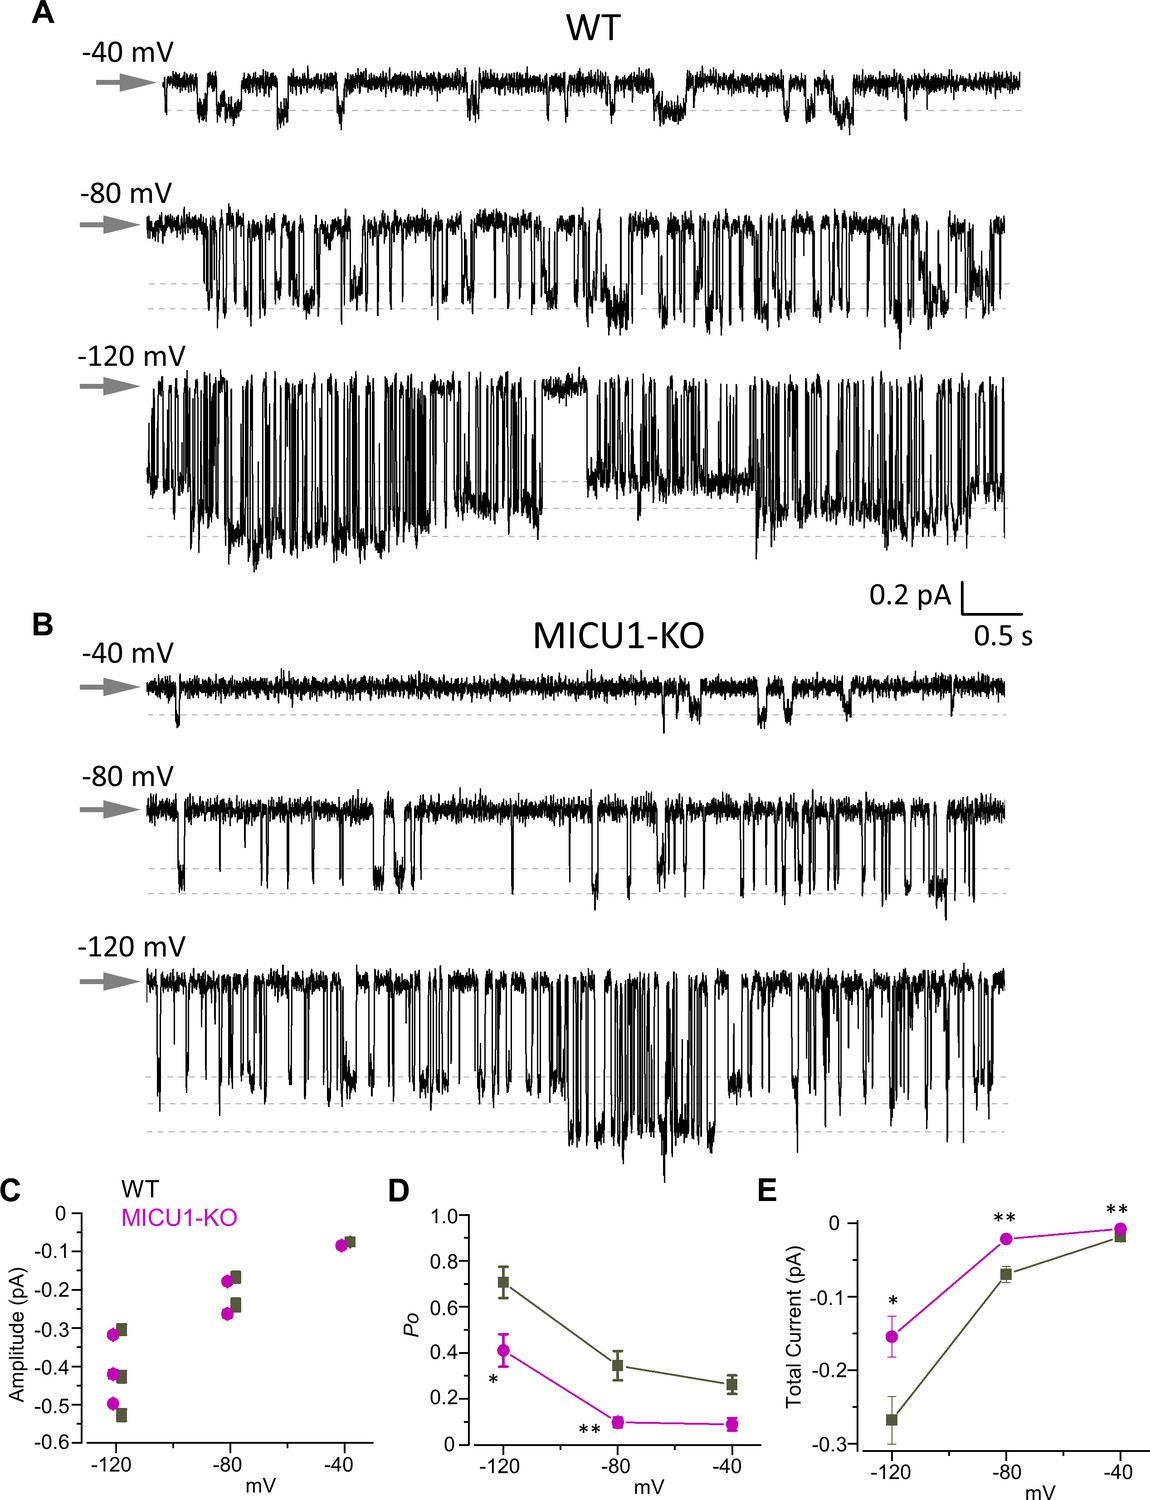
To investigate the mechanism by which Ca2+-bound MICU subunits potentiate ICa, we examined the activity of single MCUcx channels in inside-out (matrix-side out) IMM patches (Figure 4). Because the unitary MCUcx current (iCa via a single MCUcx channel) is very small if measured in physiological [Ca2+]i, it must be recorded at high [Ca2+]i = 105 mM to enable proper resolution (Kirichok et al., 2004). As desired for this experiment, using this [Ca2+]i, the EF hand domains of the MICU subunits are fully saturated with Ca2+.
Figure 4
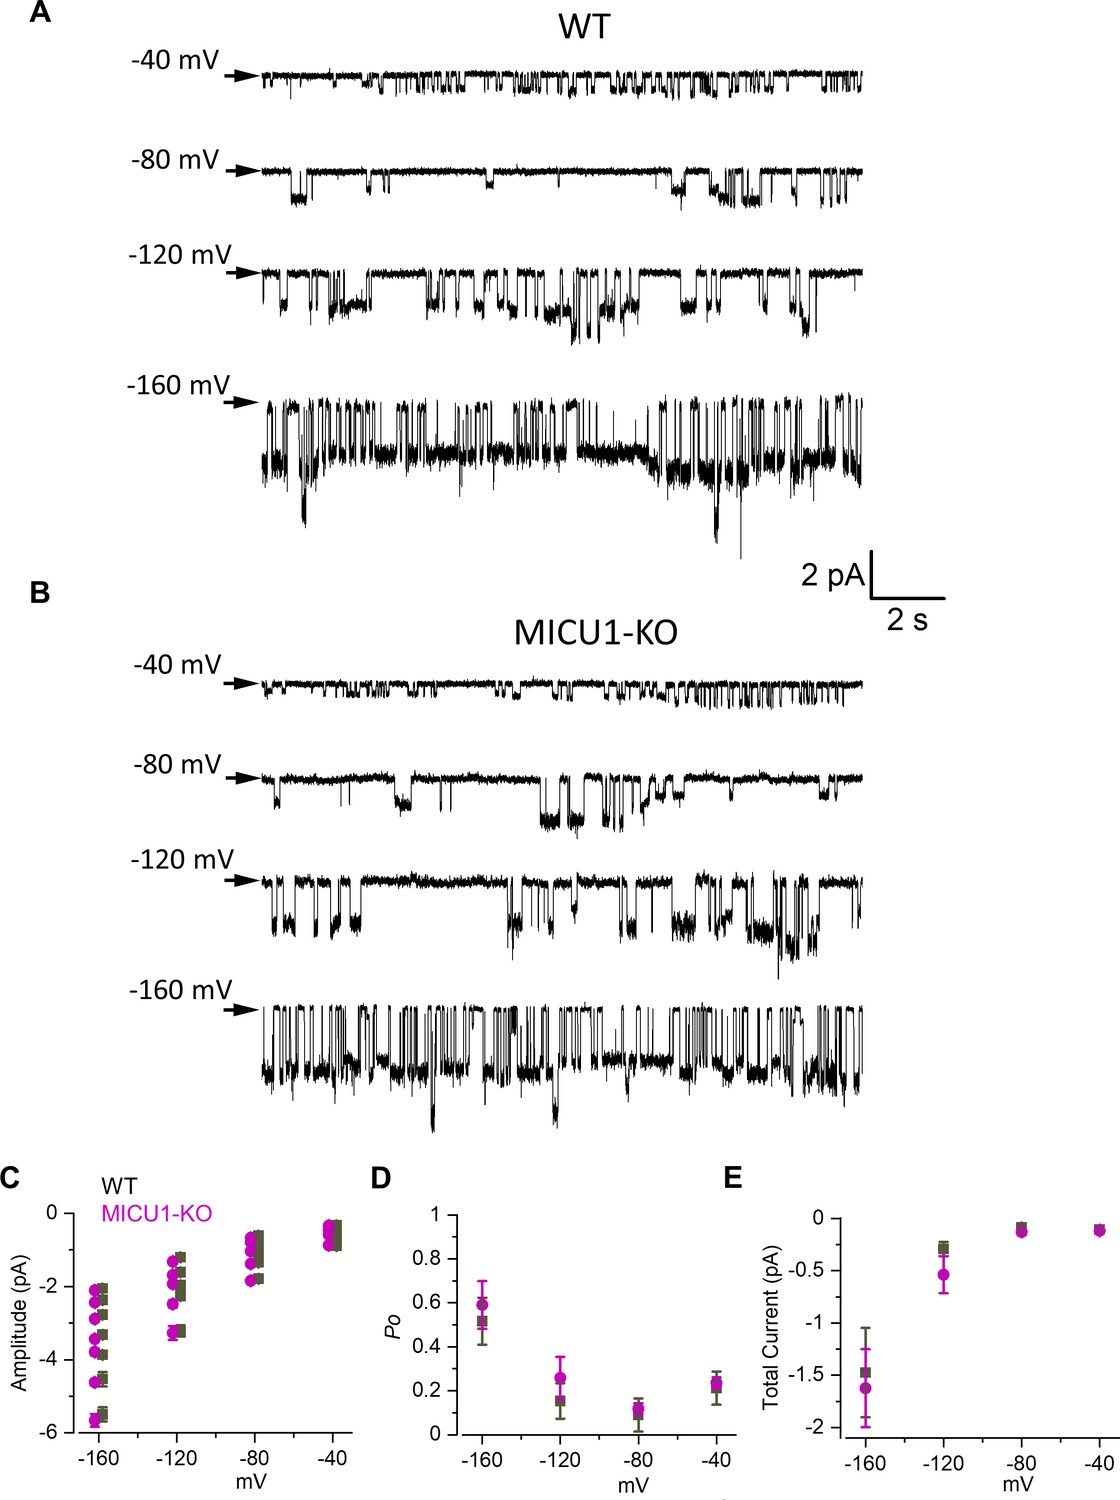
Open probability of the MCU channel in the presence of cytosolic Ca2+ is decreased in MICU1-KO.
(A and B) MCU single-channel Ca2+ currents (iCa) from inside-out IMM patches in WT (A) and MICU1-KO (B), recorded at indicated potentials in symmetrical 105 mM Ca2+, and low-pass filtered at 0.3 kHz for display purposes. Arrows indicate closed-state level, and downward deflections are the open-state events. Multiple subconductance levels are clearly visible at −80 and −120 mV. (C–E) Single-channel amplitudes (C), open probability (Po) (D), and time-averaged unitary current (E) (see Methods) in WT and MICU1-KO at indicated potentials. Data shown as mean ± SEM; unpaired t-test, two-tailed, n = 5–6.
-
Figure 4—source data 1
Dataset values for Figure 4.
- https://cdn.elifesciences.org/articles/69312/elife-69312-fig4-data1-v2.xlsx
MCUcx exhibits multiple levels of single channel conductance (Figure 4A–C; Kirichok et al., 2004). The sub-conductances can be observed at all tested voltages (−40,–80, and −120 mV), but their resolution improves as the transmembrane voltage, and the amplitude of single-channel currents increase. It is clear that the open probability (Po) of the MCUcx is increased by the hyperpolarization of the IMM as was also shown previously (Kirichok et al., 2004). At −120 mV there are full-sized stochastic openings of MCUcx as well as sub-conductance openings at ~80% and ~60% of the amplitude of the fully open iCa (Figure 4A–C). Because similar amplitude levels were observed in all the patches, we conclude that these events represent genuine sub-conductances in the MCUcx channel.
There was no difference in the single channel amplitude between control and MICU1-KO mitoplasts (Figure 4C). However, we found that the single-channel open probability (Po) was significantly decreased ~2–3 fold in MICU1-KO versus WT mitoplasts, depending on the transmembrane voltage (Figure 4D). As a result, the time-averaged current contributed by a single MCUcx channel differs significantly between control and MICU1-KO mitoplasts (Figure 4E), thus mirroring and explaining the effect of MICU1 knockout on the amplitude of the whole mitoplast ICa (Figure 2B).
We next recorded MCUcx single channel activity using Na+ as the permeating ion (iNa), in nominally Ca2+-free conditions (MICUs in Ca2+-free state) (Figure 5A and B). Similar to our findings with Ca2+ as the permeant ion, there were multiple conductance states (i.e. sub-conductances) when Na+ was the permeant ion. These sub-conductance states were the same in WT and MICU1-KO (Figure 5C). However, in contrast to iCa, there were no significant differences in the open probability of iNa between WT and MICU1-KO when Na+ was the permeating ion (Figure 5D). Accordingly, there was no difference in the time-averaged currents contributed by a single MCUcx channel in control and MICU1-KO mitoplasts (Figure 5E). This correlates well with the absence of differences in amplitude of the whole mitoplast MCU currents when Na+ was the permeant ion for these two genotypes (Figure 2D).
Figure 5
Open probability of the MCU channel in the absence of Ca2+ remains unchanged in MICU1-KO.
(A and B) MCU single-channel Na+ currents (iNa) from inside-out IMM patches in WT (A) and MICU1-KO (B), recorded at indicated potentials in symmetrical 150 mM Na+, and low-pass filtered at 0.3 kHz for display purposes. Arrows indicate closed-state level, and downward deflections are the open-state events. Multiple subconductance levels are clearly visible at all potentials. (C–E) Single-channel amplitudes (C), open probability (Po) (D), and time-averaged unitary current (E) (see Methods) in WT and MICU1-KO at indicated potentials. Data shown as mean ± SEM; unpaired t-test, two-tailed, n = 6–7.
-
Figure 5—source data 1
Dataset values for Figure 5.
- https://cdn.elifesciences.org/articles/69312/elife-69312-fig5-data1-v2.xlsx
These results demonstrate that in the Ca2+-bound state, the MICUs potentiate MCU current by increasing the open probability of the MCU/EMRE pore. In the absence of Ca2+, the MICUs do not appear to affect the pore activity.
MCUcx Mn2+ conductance
While manganese (Mn2+) is essential for the proper function of several mitochondrial enzymes, its excessive accumulation inhibits oxidative phosphorylation and causes toxicity (Gunter and Pfeiffer, 1990). MCUcx appears to be the primary entry pathway for Mn2+ entry into mitochondria (Gunter et al., 2010). Recently, it has been suggested that MICU1 is responsible for the relatively low permeability of MCUcx for Mn2+ as compared to Ca2+, and when MICU1 deficiency or loss-of-function occurs, it can lead to excessive mitochondrial Mn2+ accumulation and cellular toxicity (Kamer et al., 2018; Wettmarshausen et al., 2018).
We recorded the current carried by Mn2+ through MCUcx (IMn) in the presence of 5 mM [Mn2+]i. IMn disappeared in MCU-KO and EMRE-KO, confirming that Mn2+ current was solely mediated by MCUcx (Figure 6A–C). IMn was significantly smaller (~7-fold) than ICa via MCUcx, as was also shown previously (Kirichok et al., 2004; Figure 6D and E). Interestingly, in MICU1-KO, IMn and ICa were reduced to a similar extent (Figure 6F–H). Moreover, even the ratio between IMn and ICa calculated from the same mitoplast (IMn/ICa) was not affected in MICU1-KO (Figure 6I). Two important conclusions follow from these observations. First, MICU1 does not differentially regulate IMn and ICa. Second, MICU1 potentiates MCUcx in the presence of both Mn2+ and Ca2+. These results are in contrast to a popular model in which MICUs occlude MCUcx, and that this occlusion is relieved only by Ca2+ but not by Mn2+ (Kamer et al., 2018; Wettmarshausen et al., 2018). However, our results are in agreement with important earlier studies which found that cytosolic Mn2+ allosterically stimulates mitochondrial Ca2+ uptake just like Ca2+ (Allshire et al., 1985; Hughes and Exton, 1983; Kröner, 1986; Vinogradov and Scarpa, 1973).
Figure 6

IMn is reduced in MICU1-KO to the similar extent as ICa.
(A and B) Representative inward IMn in WT (A), MCU-KO (upper panel) and EMRE-KO (lower panel, B) mitoplasts at 5 mM [Mn2+]i. All superimposed current traces in a single panel are from the same mitoplast. (C) IMn measured at −160 mV from WT, MCU-KO and EMRE-KO mitoplasts. Data shown as mean ± SEM. (n = 3–6). (D) MCU current amplitude (IMCU) in the presence of 5 mM [Ca2+]i and 5 mM [Mn2+]i in WT mitoplasts. Currents were measured at −160 mV. Data shown as mean ± SEM; unpaired t-test, two-tailed. n = 6–14. (E and F) Representative ICa (blue, [Ca2+]I = 1 mM), IMn (green, [Mn2+]I = 5 mM) and inhibition of ICa by Mn2+ (red, [Ca2+]I = 1 mM and [Mn2+]I = 1 mM) as recorded from the same mitoplast in WT (E) and MICU1-KO (F). All superimposed current traces in a single panel are from the same mitoplast. (G–J) IMn (G), ICa (H), IMn/ICa ratio (I, measured in the same mitoplast), and inhibition of ICa by 1 mM [Mn2+]i (J) in WT and MICU1-KO. Data shown as mean ± SEM; unpaired t-test, two-tailed, n = 3–11. (K) Proposed model of the MCU complex gating and the role of MICU subunits in Ca2+-dependent potentiation of the MCU current. The MCU complex is a constitutively active channel and the level of its activity is determined by the probability of open state (Po). At resting [Ca2+]i, Po is low. As [Ca2+]i is increased and Ca2+ binds to the EF hands of MICU subunits, MICUs increase Po, resulting in the increase in the MCU activity.
-
Figure 6—source data 1
Dataset values for Figure 6.
- https://cdn.elifesciences.org/articles/69312/elife-69312-fig6-data1-v2.xlsx
We further sought to explain why IMn via MCUcx is smaller than ICa. In the presence of Mn2+, ICa was decreased (Figure 6E). This decrease was the same in MICU1-KO demonstrating that it was a pore effect (Figure 6F and J). This suggests that Mn2+ slows down Ca2+ permeation simply because it dwells in the pore longer than Ca2+ due to tighter binding (Lansman et al., 1986). The higher affinity of Mn2+ to the pore and the longer dwell time also explains why IMn is smaller than ICa.
Thus, the ICa and IMn phenotypes of MICU1-KO are the same, and MICU1 does not determine the preference of MCUcx for Ca2+ over Mn2+. Permeation of both Ca2+ and Mn2+ is enhanced, rather than inhibited by MICU1.
Mg2+ occludes the MCUcx pore independently of MICU1
Mg2+, the most abundant cytosolic divalent ion, is an important negative regulator of MCUcx-mediated mitochondrial Ca2+ uptake (Gunter et al., 2010; Hutson et al., 1976). However, the mechanism of the inhibitory action of Mg2+ on MCUcx is poorly understood. Our previous study suggested that in Ca2+-free conditions, Mg2+ occludes the MCUcx pore for Na+ permeation (Kirichok et al., 2004). Here, we investigate how Mg2+ affects Ca2+ conduction through MCUcx.
We first studied how cytosolic Mg2+ affects activation of ICa by [Ca2+]i (Figure 7A and B). The results of these experiments clearly demonstrated that ICa is inhibited in the presence of Mg2+, and that this inhibition was primarily prominent in the lower range of micromolar [Ca2+]i (Figure 7B). Thus, we specifically tested the effect of [Mg2+]i in this range of [Ca2+]i by recording ICa at 30 μM [Ca2+]. In these experiments, we found that ICa in the WT MCUcx remains about double the ICa in MICU1-KO whether [Mg2+] is 200 μM or 0 (Figure 7C). Thus, these data suggest that the potentiating effect that MICU1 exerts on MCUcx does not depend on [Mg2+]. Furthermore, as shown in Figure 7D, Mg2+ inhibits ICa with similar IC50 in WT (149 ± 20 μM) and MICU1-KO (156 ± 20 μM). Taken together, these findings indicate that Mg2+ exerted its inhibitory effect at the MCUcx pore (Figure 7C and D) and not through the MICUs. The pronounced competitive nature of the Mg2+ inhibition (Figure 7B) suggests that Mg2+ binds within the MCUcx selectivity filter formed by Asp and Glu residues (Baradaran et al., 2018; Fan et al., 2018; Nguyen et al., 2018; Yoo et al., 2018). Mg2+ is a smaller divalent cation than Ca2+, and it is more difficult for Mg2+ to shed its hydration shell to fit into a narrow high-affinity Ca2+ binding site formed by Glu (site 2). However, Mg2+ could bind to the outermost and wider Asp binding site (site 1) of the selectivity filter even with a hydration shell. Such Mg2+ binding would not allow Mg2+ permeation, but would occlude the pore.
Figure 7
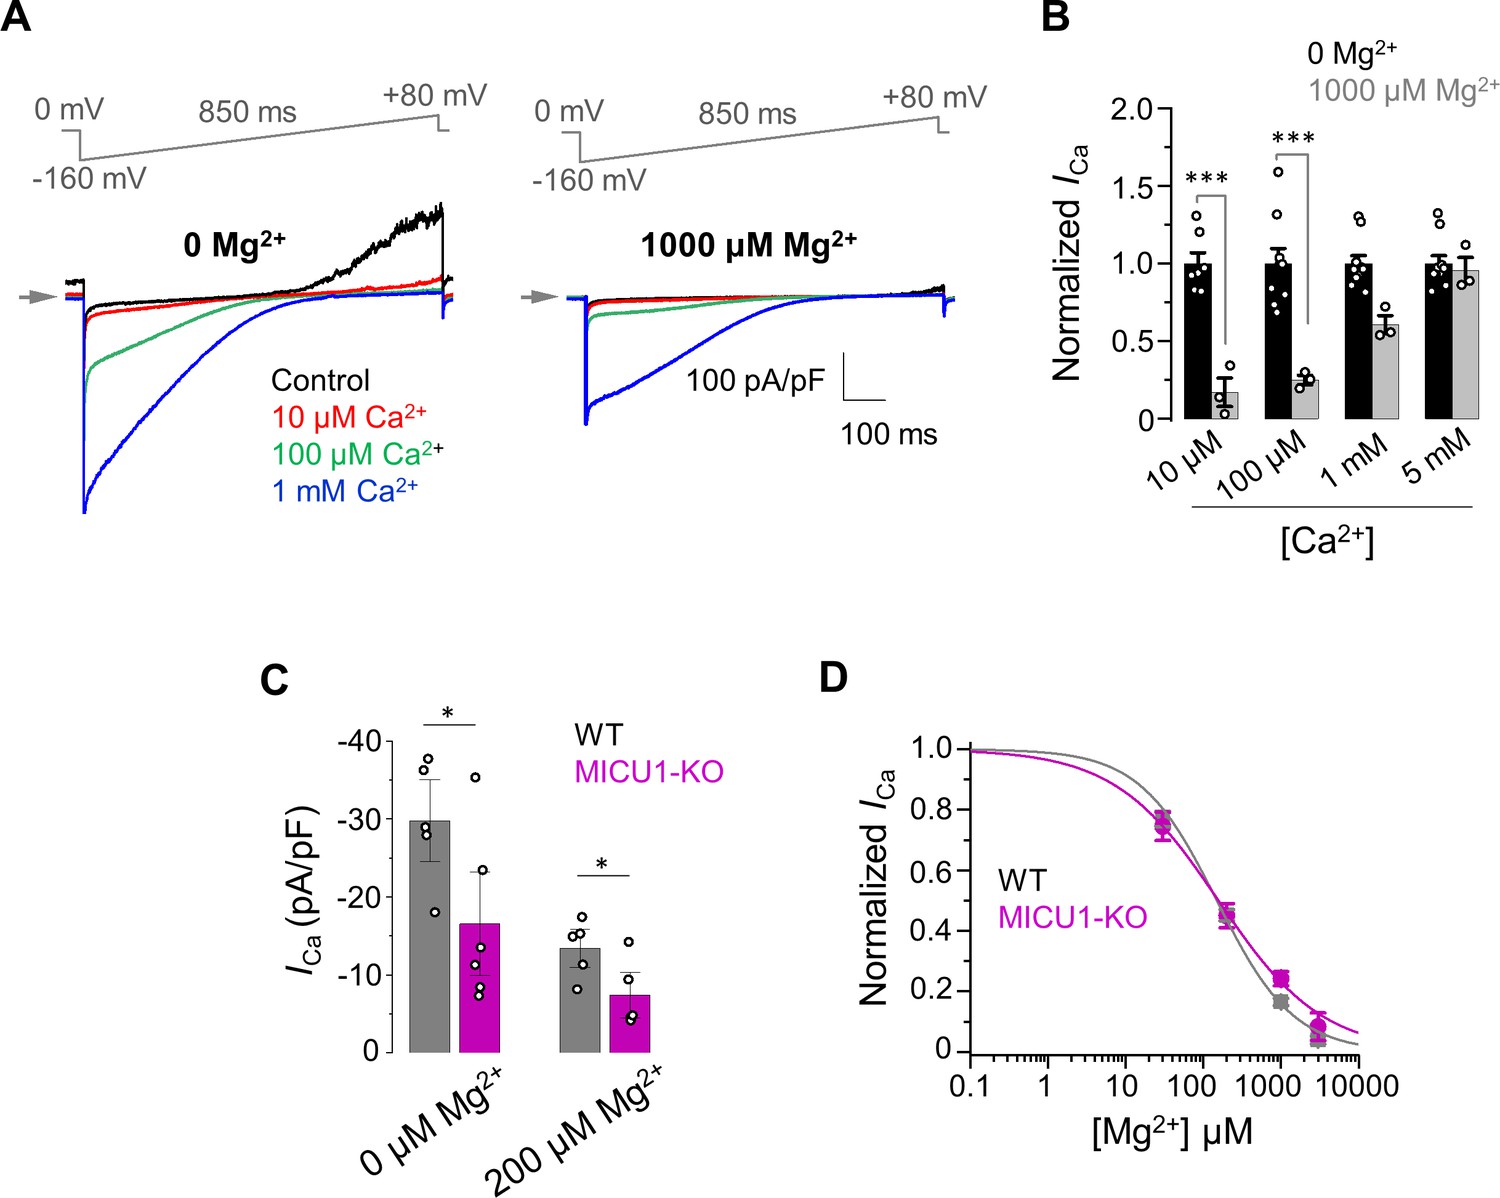
The inhibitory effect of Mg2+ on MCUcx does not depend on MICU1.
(A) Inward ICa elicited at indicated [Ca2+]i in the presence of 0 (left) and 1000 μM (right) [Mg2+]i in WT mitoplasts. (B) ICa elicited at indicated [Ca2+]i in the presence of 0 and 1000 μM [Mg2+]i. ICa amplitudes were measured at −160 mV in WT mitoplasts and normalized per ICa at [Mg2+]i = 0. Mean ± SEM; unpaired t-test, two-tailed. (C) Quantification of ICa elicited at 30 μm [Ca2+]i in the presence of 0 and 200 μM [Mg2+]i in WT and MICU1-KO. Currents were measured at −160 mV. Data shown as mean ± SEM; unpaired t-test, two-tailed, n = 5–6. (D) Dose-response curve of ICa inhibition by [Mg2+]i in WT (IC50 = 149 ± 20 μM, nH = 0.9 ± 0.1; n = 5) and MICU1-KO (IC50 = 156 ± 21 μM, nH = 0.7 ± 0.1; n = 4). Mean ± SEM; unpaired t-test, two-tailed.
-
Figure 7—source data 1
Dataset values for Figure 7.
- https://cdn.elifesciences.org/articles/69312/elife-69312-fig7-data1-v2.xlsx
In conclusion, Mg2+ is an MCUcx pore blocker that at the resting [Ca2+]i, would strongly compete with Ca2+ for binding to the selectivity filter, limiting Ca2+ permeation. The Mg2+ occlusion of the MCUcx pore can at least partially explain low mitochondrial Ca2+ uptake at resting [Ca2+]i.
Discussion
In summary, we demonstrate that the primary function of MICU subunits is to potentiate the activity of the MCUcx as cytosolic Ca2+ is elevated and binds to MICU’s EF hands. This potentiation would result in efficient stimulation of the mitochondrial ATP production in response to cytosolic Ca2+ signaling events, when energy demand is increased as shown in neurons (Ashrafi et al., 2020) and heart (Wescott et al., 2019). Although at low [Ca2+]i, MICU1-KO mitochondria appear to have higher Ca2+ uptake in comparison to WT, we find no evidence of a plug that blocks ion permeation via MCUcx. On the other hand, at high [Ca2+]i, the uptake was lower in MICU1-KO, which we demonstrate by the patch clamp analysis is due to loss of MICU-mediated potentiation of MCUcx. Mechanistically, at low [Ca2+]i the MCUcx channel is open in a lower open probability mode, but as [Ca2+]i is elevated, MICUs increase MCUcx open state probability, potentiating its activity (Figure 6K). MICUs are likely to achieve this effect by interacting with EMRE that is predicted to control the gating of the MCU pore (Wang et al., 2019; Fan et al., 2020; Wang et al., 2020b; Zhuo et al., 2021). We also show that the inward rectification property of MCUcx is independent of MICUs. Lastly, in contrast to the previous report (Vais et al., 2016), we found no evidence for the regulation of MCUcx activity by matrix [Ca2+].
Regulation of MCUcx function by cytosolic [Ca2+]
Assuming that Kd for Ca2+ binding to MICU EF hands is ~600 nM (Kamer et al., 2017), MICUs would exert their potentiating effect over a broad range of physiological [Ca2+]i that range from resting to low micromolar. By doing so, MICUs can help the MCUcx to overcome the mitochondrial Ca2+ efflux machinery and to elevate [Ca2+]m to achieve adequate stimulation of the mitochondrial ATP production. In previous reports, there has been significant inconsistency as to the proposed effect of MICU1 on mitochondrial Ca2+ uptake at high [Ca2+]i (Supplementary file 1a and b). For example, mitochondrial Ca2+ uptake rate appears to be decreased in isolated liver mitochondria from mice following siRNA-mediated knockdown of MICU1 or MICU2 in an earlier study (Plovanich et al., 2013). Another study (Csordás et al., 2013) also showed decreased uptake rates when MICU1 was knocked down in HeLa cells and hepatocytes leading authors to propose that MICU1 contributes to the cooperative activation of MCUcx, but the effect was mild and it disappeared in the absence of Mg2+. On the other hand, many reports (Kamer et al., 2018; Logan et al., 2014; Mallilankaraman et al., 2012a; Vais et al., 2016) showed no change in MCU activity upon MICU1 loss at high [Ca2+]i but only alteration in the threshold for mitochondrial Ca2+ uptake. However, a recent study again showed a decrease in Ca2+ uptake in isolated liver mitochondria in MICU1-KO mouse relative to WT (Liu et al., 2016). This correlates well with our data showing direct potentiation of the MCUcx activity by MICU1. Thus, the potentiating effect of MICUs on the MCUcx was discernible in the previous research but was largely rejected due to the predominant view that the primary function of MICUs is to occlude the MCUcx pore.
Our data is incompatible with the model in which MICUs occlude the MCU pore at low [Ca2+]i and impart a [Ca2+]i activation threshold on the MCUcx. This model explains the increase of mitochondrial Ca2+ accumulation at resting [Ca2+]i in MICU1-KO to ‘unblocking’ of MCUcx. However, in this concentration range, the MCUcx activity is so slow that the mitochondrial Ca2+ accumulation is definitely influenced by many other factors. Among other possibilities, one can speculate that mitochondrial Ca2+ efflux, matrix Ca2+ buffering, matrix pH and permeability of the outer mitochondrial membrane might be altered in MICU1-KO to facilitate mitochondrial Ca2+ accumulation at low [Ca2+]i.
Because these multiple factors can be affected by MICU1-KO differently in different experimental system and conditions, the change in the threshold can vary from one system to another. In Trypanosoma cruzi, where the composition of the MCU complex (including EMRE and MICU1) is similar to mammals, MICU1 knockout causes an increase in the Ca2+ uptake ‘threshold’ and a marked decrease in Ca2+ uptake capacity at all [Ca2+]i (Bertolini et al., 2019). A recent report also found no apparent [Ca2+]i threshold for MCU in isolated mitochondria from heart and skeletal muscle (Wescott et al., 2019). Similarly sympathetic neurons lack a discernible threshold and mitochondria were shown to accumulate small amount of Ca2+ at [Ca2+]i levels as low as 200 nM (Colegrove et al., 2000a; Colegrove et al., 2000b). Finally, interpretation of the MICU1-KO phenotypes can be further complicated by possible functional roles of MICU1 outside of the MCU complex (Gottschalk et al., 2019; Tomar et al., 2019; Tufi et al., 2019). In particular, MICU1 was proposed to interact with the MICOS complex, affecting the cristae structure (Tomar et al., 2019).
Examination of the conduction pathway of the MCUCX
To circumvent the problem of isolating the MCUcx activity from the other mitochondrial Ca2+ homeostatic mechanisms, we leveraged the capacity of MCUcx to conduct Na+. The Na+ permeation via MCUcx is observed not only in isolated mitoplasts but also in intact mitochondria. Na+ permeates via MCUcx because Ca2+ and Na+ ions have the same ionic diameter, and Na+ can pass through Ca2+ channels when Ca2+ is removed from the selectivity filter (Hess and Tsien, 1984; Hess et al., 1986; Tang et al., 2014). Ca2+ binds to the MCUcx selectivity filter with an exceptionally high affinity (Kd ≤2 nM) (Kirichok et al., 2004), and re-addition of cytosolic Ca2+ leads to INa inhibition upon Ca2+ binding to this site. Importantly, MICUs are not involved in this inhibition, as it is not affected by MICU1-KO (Figure 2—figure supplement 2). In intact mitochondria, Na+ uptake via WT or MICU1-deficient MCUcx causes the same ΔΨ depolarization, demonstrating that at low [Ca2+]i MCUcx is not occluded regardless of its association with MICUs. Moreover, using mitochondrial patch-clamp under Ca2+-free conditions, we recorded a robust INa via MCU, and the amplitude of this INa was not affected in MICU1-KO. This demonstrates that MCU pore is not occluded by MICUs at low [Ca2+]i.
The complexity of the MCUcx presents formidable difficulties even for the direct electrophysiological analysis. The electrophysiological phenotypes observed may be associated with altered expression levels of other subunits rather than the loss of MICU1. We not only analyzed the expression levels of all MCU complex subunits (Figure 2—figure supplement 1D–F) but also measured ICa/INa ratio in the same mitoplast (Figure 2C–F) to ensure that we correctly capture the role of MICU1 in the MCU complex.
Cryo-EM studies and the dynamic function of MICUs
Recently, cryo-EM structures of the MCUcx holocomplex reveal that it is composed of two conjoined MCU/EMRE pores with a MICU1/MICU2 heterodimer attached to each of them (Fan et al., 2020; Wang et al., 2020b; Zhuo et al., 2021). Based on molecular weight of the MCUcx as observed on the Blue native PAGE (Sancak et al., 2013), this structure likely represents the complete MCUcx of intact mitochondria. This is the primary structural form of MCUcx in the mitochondrial inner membrane.
However, in addition to this complete MCUcx, the cryo-EM analysis also reported structures of a monomeric MCU/EMRE pore with a single MICU1/MICU2 heterodimer. Although this does not appear to be the predominant state of the native MCUcx, it was primarily used for the analysis of the interaction between the pore and the MICU1/MICU2 dimer. Based on this analysis, a conclusion was made that in the absence of Ca2+, MICU1/MICU2 dimer occluded the MCUcx pore. Wang et al. (Wang et al., 2020b) observed occlusion of the dimeric complex, but such MICU1-occluded dimeric complex represented only ~10% of the total number of analyzed particles in the absence of Ca2+. The low prevalence of the dimeric complexes can be purely due to the experimental limitations, but a more thorough analysis of occlusion in this native form of MCUcx is warranted. At the same time, another work that analyzed the complete MCUcx with two pores and two MICU1/MICU2 heterodimers, did not show any occlusion (Zhuo et al., 2021). In this structure, the two MICU1/MICU2 heterodimers interact between each other, leaving both pores unoccluded (Zhuo et al., 2021). As more MCUcx structural data appear in the future, it is important to take into consideration the completeness of the complex and the new functional data on the MICU subunits presented here.
We are at the very beginning of the structural characterization of MCUcx. As this crucial work continues, selection of the experimental conditions is key to understanding how the channel works under physiological conditions. As we emphasize here, the direct inhibitory effect of Mg2+ on the MCU pore is important but has not yet been taken into consideration. In fact, Mg2+ was omitted in all structural studies of MCUcx holocomplex (Fan et al., 2020; Wang et al., 2020b; Zhuo et al., 2021). As we discussed before, Mg2+ is likely to bind to the same Asp ring of the selectivity filter where MICU1 was predicted to bind and, may therefore significantly affect conformational states of MCUcx. Thus, to determine how MICU1 interacts with the MCUcx pore, structural studies should be performed under conditions that include physiological concentrations of Mg2+. Furthermore, occlusion of the MCU/EMRE pore by MICUs in the absence of Ca2+ was observed when the cryoEM particles were obtained in a solution that had ionic strength ~three times lower than physiological (Fan et al., 2020; Wang et al., 2020b). In contrast, the unoccluded state was observed at the physiological ionic strength (Zhuo et al., 2021). This difference is critical, because the occlusion of the MCU pore by MICU1 strongly depends on ionic interactions (Fan et al., 2020; Wang et al., 2020b). Another important consideration is the presence of cardiolipin in MCUcx structures, likely affected by the type of detergent used during purification. Interestingly, the occluded state was observed in the structures that contained no cardiolipin (Fan et al., 2020; Wang et al., 2020b), while the unoccluded MCUcx structure contained cardiolipin (Zhuo et al., 2021). This point is important as cardiolipin interacts with the MCU complex (Ghosh et al., 2020; Zhuo et al., 2021) and may regulate MICU function (Kamer and Mootha, 2014).
In conclusion, we find no evidence for the occlusion of the MCUcx pore by MICUs at resting [Ca2+]i. Instead, under these conditions MCUcx-mediated uptake is limited by the low concentration of the conducting ion and by the Mg2+ block. A slow mitochondrial Ca2+ uptake at resting [Ca2+]i is likely at balance with the Ca2+ efflux mechanisms, which prevents mitochondrial Ca2+ overload (Nicholls, 2005). On the other hand, the phenomenon of allosteric potentiation of MCUcx has been known for many decades (Gunter et al., 2010; Kröner, 1986), and this work provides its clear mechanistic explanation.
Materials and methods
Key resources table
| Reagent type (species) or resource | Designation | Source or reference | Identifiers | Additional information |
|---|---|---|---|---|
| Cell line (M. musculus) | DRP1-KO (Dnm1l-/-) (Mouse embryonic fibroblast) | Ishihara et al., 2009 | Cell line maintained in D. Chan and K. Mihara lab; Dnm1l-/- background | |
| Cell line (M. musculus) | WT (Dnm1l+/+) (Mouse embryonic fibroblast) | Liu et al., 2016 | Cell line maintained in T. Finkel lab; Dnm1l+/+ background | |
| Cell line (M. musculus) | MICU1-KO (Micu1-/-) (Mouse embryonic fibroblast) | Liu et al., 2016 | Cell line maintained in T. Finkel lab; Dnm1l+/+ background | |
| Cell line (M. musculus) | MCU-KO (Mcu-/-) (Mouse embryonic fibroblast) | This paper | Cell line maintained in Y. Kirichok and V. Garg lab. Dnm1l-/- background | |
| Cell line (M. musculus) | EMRE-KO (Smdt1-/-) (Mouse embryonic fibroblast) | This paper | Cell line maintained in Y. Kirichok and V. Garg lab. Dnm1l-/- background | |
| Cell line (M. musculus) | MICU1-KO (Micu1-/-) (Mouse embryonic fibroblast) | This paper | Cell line maintained in Y. Kirichok and V. Garg lab. Dnm1l-/- background | |
| Cell line (M. musculus) | MICU2-KO (Micu2-/-) (Mouse embryonic fibroblast) | This paper | Cell line maintained in Y. Kirichok and V. Garg lab. Dnm1l-/- background | |
| Cell line (M. musculus) | MICU3-KO (Micu3-/-) (Mouse embryonic fibroblast) | This paper | Cell line maintained in Y. Kirichok and V. Garg lab. Dnm1l-/- background | |
| Strain, strain background (M. musculus) | MCU-KO (Mcu-/-) mouse | This paper | Mouse line maintained in T. Finkel lab | |
| Recombinant DNA Reagent | Mcu (plasmid) | This paper | Lentiviral Construct (Y. Kirichok and V. Garg lab) | |
| Recombinant DNA Reagent | Smdt1 (alias Emre) (plasmid) | This paper | Lentiviral Construct (Y. Kirichok and V. Garg lab) | |
| Recombinant DNA Reagent | Micu1 (plasmid) | This paper | Lentiviral Construct (Y. Kirichok and V. Garg lab) | |
| Recombinant DNA Reagent | Micu2 (plasmid) | This paper | Lentiviral Construct (Y. Kirichok and V. Garg lab) | |
| Recombinant DNA Reagent | Micu3 (plasmid) | This paper | Lentiviral Construct (Y. Kirichok and V. Garg lab) | |
| Recombinant DNA Reagent | mut-EF-Micu1 (plasmid) | This paper | Lentiviral Construct (Y. Kirichok and V. Garg lab) | |
| Recombinant DNA Reagent | mut-EF-Micu2 (plasmid) | This paper | Lentiviral Construct (Y. Kirichok and V. Garg lab) | |
| Recombinant DNA Reagent | mut-EF-Micu3 (plasmid) | This paper | Lentiviral Construct (Y. Kirichok and V. Garg lab) | |
| Recombinant DNA Reagent | Cepia2mt (plasmid) | Suzuki et al., 2014. Lentiviral construct was made in this paper. | Lentiviral construct | |
| Antibody | MCU antibody (rabbit polyclonal) | Sigma | HPA016480; RRID:AB_2071893 | WB (1:2000) |
| Antibody | EMRE antibody (mouse monoclonal) | Santa Cruz | sc-86337; RRID:AB_2250685 | WB (1:200) |
| Antibody | MICU1 antibody (rabbit polyclonal) | Cell Signalling | D4P8Q (12524S); RRID:AB_2797943 | WB (1:2000) |
| Antibody | MICU2 antibody (mouse monoclonal) | Bethyl laboratories | A300-BL19212 | WB (1:500) |
| Antibody | MICU3 antibody (mouse monoclonal) | Sigma | HPA024779; RRID:AB_1848023 | WB (1:1000) |
| Antibody | VDAC antibody (rabbit monoclonal) | Santa Cruz | ab15895; RRID:AB_2214787 | WB (1:1000) |
| Antibody | TOM20 antibody (rabbit polyclonal) | Santa Cruz | sc-11415; RRID:AB_2207533 | WB (1:2000) |
| Antibody | HSP60 antibody (rabbit polyclonal) | Santa Cruz | sc-1052; RRID:AB_631683 | WB (1:3000) |
| Chemical compound, drug | ANTI-FLAG M2 Affinity Gel | Sigma-Aldrich | Cat# A2220; RRID:AB_10063035 | |
| Software, algorithm | PClamp 10 | Molecular Devices | https://www.moleculardevices.com/systems/conventional-patch-clamp/pclamp-10-software | |
| Software, algorithm | Origin 7.5 | OriginLab | http://www.originlab.com/ | |
| Software, algorithm | ImageJ Software | ImageJ | https://imagej.net/ | |
| Software, algorithm | [Ca2+]m threshold detection algorithm | Custom-made | https://github.com/ishanparanjpe/upstroke (Paranjpe et al., 2019) |
Contact for reagent and resource sharing
Request a detailed protocolFurther information and requests for reagents may be directed to and will be fulfilled by Lead Contact Yuriy Kirichok (yuriy.kirichok@ucsf.edu).
Experimental model
Cell culture and recombinant gene expression
Request a detailed protocolAll mouse embryonic fibroblast (MEF) cells with (Liu et al., 2016) or without Drp1 (Ishihara et al., 2009), and all knockout clones were grown in low glucose (5.6 mM) Dulbecco’s modified Eagle’s medium (DMEM) supplemented with 10% FBS, 100 U/ml penicillin, and 100 U/ml streptomycin at 37°C, 5% CO2. Cells were maintained by splitting every 48–72 hr at a ratio of 1:5 to 1:10. The MEF cell lines were authenticated by short tandem repeat profiling conducted by Labcorp. The cell lines were free of mycoplasma as determined by PCR based detection (Dreolini et al., 2020).
We used third-generation lentiviral (bi-cistronic) vectors containing the ORF for gene of interest with or without a selection marker (EGFP, mCherry or puromycin). The vectors were generated by VectorBuilder, Inc (Chicago, IL, USA), and their sequences were confirmed independently by the company and by us. Recombinant cDNA expressing cells were enriched using multiple rounds of FACS or antibiotic selection. In some cases, EGFP was targeted to mitochondria (using a mitochondrial targeting sequence from COX8) to identify mitoplasts expressing the recombinant protein of interest during patch clamp experiments.
Animals
Mice were maintained on a standard rodent chow diet under 12 hr light and dark cycles. All animal experiments were performed with male mice (2–5 month old) according to procedures approved by the UCSF Institutional Animal Care and Use Committee and adhered to NIH standards. C57BL/6J were obtained from the Jackson laboratory. MCU-KO mice were obtained from Dr. Torren Finkel and have been used previously (Pan et al., 2013).
Method details
Request a detailed protocolGene expression analysis (qRT-PCR) qPCR was performed by Syd Labs (Natick, MA, USA). Total RNA was isolated from cells using the RNAeasy Minikit (QIAGEN), and reverse transcribed using the First Strand cDNA Synthesis Kit (Syd Labs). qPCR reactions were performed with the following gene-specific primers (generated by Integrated DNA Technologies):
Hprt, Forward Primer 5'-GTCCCAGCGTCGTGATTAGC-3'
Reverse Primer 5'-GTGATGGCCTCCCATCTCCT-3'
Mcu, Forward Primer 5’-AAGGGCTTAGCGAGTCTTGTC-3'
Reverse Primer 5’- GGGTGCTGGTGTGTTAGTGT −3'
Mcub, Forward Primer 5’-CCACACCCCAGGTTTTATGTATG-3'
Reverse Primer 5’-ATGGCAGAGTGAGGGTTACCA-3'
Smdt1, Forward Primer 5’-ATTTTGCCCAAGCCGGTGAA-3'
Reverse Primer 5’-CCTCAAGCAGAGCAGCGAAG-3'
Micu1, Forward Primer 5'-CTTAACACCCTTTCTGCGTTGG-3'
Reverse Primer 5'-AGCATCAATCTTCGTTTGGTCT-3'
Micu2, Forward Primer 5'-CTCCGCAAACAGCGGTTCAT-3'
Reverse Primer 5'-TGCCAGCTTCTTGACCAGTG-3'
Micu3, Forward Primer 5’-GTAAGGTCAGAGCACGCAGAA-3'
Reverse Primer 5’-TTTCCTGTTGGACGCTGACAA −3'
cDNA (100 ng, calculated from initial RNA) samples were pre-amplified for 12 cycles using ABsolute qPCR SYBR Green Low ROX Mix (ThermoFisher). qPCR reactions were performed using an Agilent MX3000 (Fluidigm) with 40 cycles of amplification (15 s at 95°C, 5 s at 70°C, and 60 s at 60°C). Ct values were calculated by the Real-Time PCR Analysis Software (Fluidigm). Relative gene expression was determined by the ΔCt method. Hprt was selected as the reference gene.
Generation of knockout cell lines by the CRISPR/Cas9 method
Request a detailed protocolKnockout MEF cell lines were generated using the CRISPR/Cas9 method (Ran et al., 2013). All knockouts (except the MCU-KO line) were generated by Alstem LLC (Richmond, CA, USA). Either one sgRNA or a pair of two adjacent sgRNAs were used to create a point indel or a truncate indel, respectively (Figure S1).
Mcu, TGGCAGCGCTCGCGTCGAGA GGG
Smdt1, GAGTGTCCCGACATAGAGAA AGG
CTTACACTCCCACTAGGTTA AGG
Micu1, TCACTTTTAGATGCTGCCGG TGG
CTGCAAGTACCGGTCTCCTG TGG
Micu2, CGTTCGGGAGCCCTCGCGCG CGG
GGGCGCTTCCGCAAAGATGG CGG
Micu3, GGGCGAGCTGAGCATCGCGG CGG
CCGGGGCCGCTAGCTCCGAG GGG
MEFs were transfected with the Cas9 gRNA vector (Addgene: PX459) via electroporation (Invitrogen Neon transfection system) using the following parameters: 1×10⁶ cells and 1 µg of two different gRNA-Cas9 plasmids. Puromycin was used for enrichment of transfected cells, and serial dilution was performed to select single-cell clones. A stable homozygous knockout cell line was confirmed by PCR amplification of the targeted region, cloning into a pUC19 vector, and sequencing showing that either a frameshift or large deletion had occurred in the targeted region of the gene (Figure 1—figure supplement 1). All knockout clones were further validated by western blotting (Figure 1—figure supplement 1). The primers used for amplification of genomic sites and cloning into pUC19 sequencing vector were as follows:
Mcu, Forward Primer TAGAAGCTTTCCACTGCTCTGATTGATCTTG
Reverse Primer ATGTGAATTCGAGCTGCTTTGGAATGAGAC
Smdt1, Forward Primer GTGAAGCTTGGGATCAGTAGTCCATTGGAGG
Reverse Primer AGGAGAATTCAGTGAGAGTTCCTGTGGTATG
Micu1, Forward Primer TTTAAGCTTGATTCCTTTGAGTTATAAGTAG
Reverse Primer CAAAGAATTCAGCAAAGAAATTCTGATGTA
Micu2, Forward Primer ACCAAGCTTGAACGTCGAGGAAGCAGCCAC
Reverse Primer AGGAGAATTCTCCATCCACCAGGTGGGCAG
Micu3, Forward Primer CGCAAGCTTCTCGCGAGATTTCGGCCCGCC
Reverse Primer AGGAGAATTCTCCATCCACCAGGTGGGCAG
Isolation of mitochondria and mitoplasts
Request a detailed protocolMitoplasts were isolated from MEFs using methodology previously described (Garg and Kirichok, 2019). Briefly, MEFs were homogenized in ice-cold medium (Initial medium) containing 250 mM sucrose, 10 mM HEPES, 1 mM EGTA, and 0.1% bovine serum albumin (BSA) (pH adjusted to 7.2 with Trizma base) using a glass grinder with six slow strokes of a Teflon pestle rotating at 280 rpm. The homogenate was centrifuged at 700× g for 10 min to create a pellet of nuclei and unbroken cells. The first nuclear pellet was resuspended in the fresh Initial medium and homogenized again to increase the mitochondrial yield. Mitochondria were collected by centrifugation of the supernatant at 8500× g for 10 min.
Mitoplasts were produced from mitochondria using a French press. Mitochondria were suspended in a hypertonic solution containing 140 mM sucrose, 440 mM D-mannitol, 5 mM HEPES, and 1 mM EGTA (pH adjusted to 7.2 with Trizma base) and then subjected to a French press at 1200–2000 psi to rupture the outer membrane. Mitoplasts were pelleted at 10,500× g for 15 min and resuspended for storage in 0.5–1 ml of solution containing 750 mM KCl, 100 mM HEPES, and 1 mM EGTA (pH adjusted to 7.2 with Trizma base). Mitoplasts prepared and stored with this method contained the same amount of auxiliary MICU1 and MICU2 subunits as compared to intact mitochondria (Figure 1—figure supplement 2F, see TCo-immunoprecipitation section below).
Mitochondria and mitoplasts were prepared at 0–4°C and stored on ice for up to 5 hr. Immediately before the electrophysiological experiments, 15–50 μl of the mitoplast suspension was added to 500 μl solution containing 150 mM KCl, 10 mM HEPES, and 1 mM EGTA (pH adjusted to 7.0 with Trizma base) plating on 5 mm coverslips pretreated with 0.1% gelatin to reduce mitoplast adhesion.
Patch-clamp recording
Request a detailed protocolWhole mitoplast currents were measured as described previously (Garg and Kirichok, 2019). Gigaohm seals with mitoplasts were formed in the bath solution containing 150 mM KCl, 10 mM HEPES and 1 mM EGTA, pH 7.2 (adjusted with KOH). Voltage steps of 350–500 mV for 2–8 ms were applied to rupture the IMM and obtain the whole-mitoplast conFiguration. Typically, pipettes had resistances of 20–40 MΩ, and the access resistance was 35–65 MΩ. The membrane capacitances of mitoplasts range from 0.2 to 0.6 pF.
All indicated voltages are on the matrix side of the IMM (pipette solution), relative to the cytosolic side (bath solution, Figure 1—figure supplement 2D; Figure 1—figure supplement 2E; Garg and Kirichok, 2019). Currents were normally induced by a voltage ramp from −160 mV to +80 mV (interval between pulses was 5 s) to cover all physiological voltages across the IMM, but other voltage protocols were also used as indicated in the Figures. All whole-IMM recordings were performed under continuous perfusion of the bath solution. Currents were normalized per membrane capacitance to obtain current densities (pA/pF). Currents flowing into mitochondria are shown as negative, while those flowing out are positive. Membrane capacitance transients observed upon application of voltage steps were removed from current traces.
Typically, pipettes were filled with one of the following three solutions (Garg and Kirichok, 2019) (tonicity was adjusted to ∼350 mmol/kg with sucrose).
Solution A was used to measure Ca2+ currents and contained: 110 mM Na-gluconate, 40 mM HEPES, 10 mM EGTA and 2 mM MgCl2 (pH 7.0 with NaOH).
Solution B was used to measure Na+ or Mn2+ currents and contained: 110 Na-gluconate, 40 HEPES, 1 EGTA, 5 EDTA, and 2 mM NaCl (pH 7.0 with Tris base).
Solution C was used to measure outward Ca2+ currents (the MCU rectification experiments) and contained: 130 mM tetramethylammonium hydroxide (TMA), 100 mM HEPES and 2 mM CaCl2 (pH 7.0 with D-gluconic acid).
To measure whole-mitoplast Ca2+ currents, the bath solution was formulated to contain only 150 mM HEPES (pH 7.0 with Tris base, tonicity ∼300 mmol/kg with sucrose) and different dilutions of CaCl2 from a 1 M stock (Sigma) (Kirichok et al., 2004). The control solution contained: 150 mM HEPES, 80 mM sucrose and 1 mM EGTA (pH 7.0 with Tris base, tonicity ∼300 mmol/kg with sucrose). The bath solution used for measuring Na+ current contained: 110 mM Na-gluconate, 40 mM HEPES, 1 mM EGTA and 5 mM EDTA (pH 7.0 with Tris base, tonicity ∼300 mmol/kg with sucrose). The bath solution for measuring inhibition of Na+ current by cytosolic Ca2+ contained: 110 mM Na-gluconate, 40 mM HEPES, and 10 mM EDTA (pH 8.0 with Tris, tonicity ∼380 mmol/kg with sucrose) and varying amounts of CaCl2 were added to the bath solution to achieve the free [Ca2+] calculated using the MaxChelator program (C. Patton, Stanford University).
A rapid exchange of [Ca2+]i from virtual zero (control solution) to 1 mM was achieved using a commercially available fast solution exchange system (Warner Instruments, SF-77B perfusion fast step system). It was interfaced with our pClamp acquisition software in order to precisely time the steps during solution change. The timing (τ ~0.4 ms) for solution exchange was judged by the current changes because of a junction potential difference using solutions with different ionic strengths.
Currents were recorded using an Axopatch 200B amplifier (Molecular Devices). Data acquisition and analyses were performed using PClamp 10 (Molecular Devices) and Origin 9.6 (OriginLab). All data were acquired at 10 kHz and filtered at 1 kHz.
Single-channel recordings and analysis
Request a detailed protocolAll single-channel data were acquired from inside–out patches excised from isolated mitoplasts (Kirichok et al., 2004). For Ca2+ single channel (iCa) recordings, patches were excised in a bath solution containing 150 mM KCl, 10 mM HEPES and 1 mM EGTA, pH 7.2 (adjusted with KOH). Recordings were performed under symmetrical conditions (the same bath and pipette solutions): 105 mM CaCl2 and 40 mM HEPES, pH 7.0 with Tris base. Signals were sampled at 50 kHz and low-pass filtered at 1 kHz. Fire-polished, borosilicate pipettes (Sutter QF-150–75) coated with Silguard (Dow Corning Corp., Midland, MI) and having a tip resistance of 50–70 MΩ were used for low noise recordings.
For Na+ single channel (iNa) recordings, patches were excised in a bath solution containing 150 mM Na-gluconate, 10 mM HEPES, 1 mM EGTA and 1 mM MgCl2, pH 7.2 (adjusted with NaOH). Pipette solution contained 150 mM Na-gluconate, 10 mM HEPES, 1 mM EGTA, 1 mM EDTA, and 2 mM NaCl, pH 7.2 (adjusted with NaOH). Signals were sampled at 50 kHz and low-pass filtered at 1 kHz.
To characterize the single-channel conductance and subconductance levels and their occupancy probabilities, we used the MLab version of the QuB software, freely available from the Milescu lab at: https://milesculabs.biology.missouri.edu/QuB_Downloads.html. The data were first resampled at 2.5 kHz and then were idealized with the Baum-Welch and Viterbi algorithms, as implemented in QuB, which classify each point in the data to a conductance level and produce estimates of current amplitudes and occupancy probabilities. The time-averaged single-channel current can be calculated as the product between occupancy probability and current amplitude, summated over all conductance levels (main open state and substates).
Time-lapse Ca2+ imaging in intact cells
For imaging experiments, MEFs were plated on collagen type-I-coated glass-bottom 35 mm dishes (P35G-1.5–14 C, Matek), 48–72 hr before imaging. Cells were imaged at the interval of 3 s on a Nikon Ti-E microscope using a 40× objective (NA 1.30, oil, CFI Plan Fluor, Nikon), Lambda 421 LED light source (Sutter) and ORCA Flash 4.0 CMOS camera (Hamamatsu Photonics) at room temperature (25°C). The following excitation/emission filter settings were used: 340±13/525±25 nm and 389±19/510±40 nm for cytosolic Ca2+ imaging using fura-2 (Kd=224 nM) and 480±40/525±15 nm for mitochondrially targeted cepia2 (CEPIA2mt, Kd=160 nM (Suzuki et al., 2014), cloned into a lentiviral vector). Cells were loaded with 3 μM fura-2 AM (Life Tech., USA) in DMEM/FBS at room temperature for 30 min. After three washes with physiological salt solution (PSS) containing (in mM) 150 NaCl, 4 KCl, 2 CaCl2, 1 MgCl2, 5.6 glucose, and 25 HEPES (pH 7.4), each dish was placed on the stage for imaging. Imaging was performed in PSS within 1 hr of dye staining. Baseline fluorescence was taken for 1–2 min after which thapsigargin (Tg) (final [Tg] = 300 nM) was added while imaging was continued for another 10–15 min.
Fura-2 calibration
Request a detailed protocolBaseline measurements were taken, and cells were incubated in PSS (No CaCl2) containing 3 mM EGTA, 1 μM ionomycin and 1 μM Tg for 5–10 min. After 2–3 washes with PSS (No CaCl2) containing 0.3 mM EGTA, cells were imaged for 5 min (average of last 10 frames was used for calculation) to obtain the Rmin and F380max values. Finally, PSS containing 10 mM CaCl2 (no EGTA), 1 μM ionomycin and 1 μM Tg was added and cells were imaged for 10 min. After the signal reached saturation (~3 min), the average value from 10 frames was used to calculate Rmax and F380min values. Using these obtained values, the fura-2 ratio was calibrated by the following equation (Grynkiewicz et al., 1985):
All image analyses were done with ImageJ (NIH). Briefly, mitochondrial and cytosolic regions were manually determined for each cell. The average fluorescence intensity in the regions was measured and the background intensity was subtracted. For analysis of the cepia2 signal, we normalized the fluorescence intensity by the baseline fluorescence. For analysis of the fura-2 signal, we calculated the fluorescence ratio (F340/F380 for fura-2).
The time point for increase in mitochondrial [Ca2+] (upstroke) was detected using a script written in Python and manually checked afterwards. Briefly, the fluorescence signal was smoothed by applying a second-order zero phase digital Butterworth filter with an optimal cutoff frequency as previously described (Winter, 2009). From the smoothed signal, the upstroke frame was defined as the earliest point between the baseline and signal peak that was greater than 80% of the maximal time derivative. The time-point for change in mitochondrial signal was time-matched with the fura-2 reading to determine the threshold [Ca2+]i.
Measurements of mitochondrial Ca2+ influx in isolated mitochondria
Request a detailed protocolBriefly, mitochondria were isolated from MEF cells using differential centrifugation as described above. The mitochondrial pellet was resuspended in resuspension buffer (RB) supplemented with 2 mM EGTA and 2 μM of Fura-2-acetoxymethyl ester (Fura-2 AM) and kept at room temperature for 10 min to allow loading of Fura-2 into the mitochondrial matrix. The RB buffer contained: 100 mM KCl, 50 mM MOPS, 1 mM MgCl2. Mitochondria were pelleted at 3200 g, and further incubated on ice for 50 min to allow de-esterification of Fura-2 AM in RB supplemented with 2 mM EGTA. Mitochondria were pelleted at 3200 g and resuspended in RB supplemented with 10 μM EGTA. Mitochondria were further pelleted and resuspended twice in RB supplemented with 40 μM Fluo-4 pentapotassium salt (for measurements carried out below 3 μM [Ca2+]i), or RB supplemented with 40 μM EGTA (for measurements carried out above 3 μM [Ca2+]i). After final centrifugation step at 3200 g, protein concentration was determined by Lowry assay.
Measurements of mitochondrial Ca2+ influx were carried out using a BMG LABTECH CLARIOstar plate reader as described before (Wescott et al., 2019). Experiments were carried out with mitochondria (0.5 mg/ml) in an uptake assay buffer (uAB) that contained: 130 mM KCl, 20 mM HEPES, 1 mM MgCl2, 1 mM K2HPO4, pH 7.2 (with KOH), supplemented with energetic substrates (glutamate, malate and succinate, each 5 mM), and 1 μM TMRM. The uAB and all the stock solutions were made with analytical-grade deionized water (OmniSolv LC–MS, Sigma Aldrich) and contained less than 50 nM of residual [Ca2+] (measured daily). After 3 min of incubation with substrates, assays were initiated by injection of 100 μl of Ca2+ stock to bring the final volume to 200 μl. TMRM (ex: 546 ± 4 nm and 573 ± 5 nm, em: 619 ± 15 nm) and Fura-2 (ex: 335 ± 6 nm and 380 ± 6 nm, em: 490 ± 15 nm) fluorescence were measured, along with Fluo-4 or Fluo4-FF (ex: 485 nm, em: 520–542 nm) within the same well for 35 s. To measure MCU Ca2+ flux (JMCU), two protocols were used. Protocol 1 ([Ca2+] range ≤ 3 μM): here, Fluo-4 (3 μM) is the single significant buffer of extra-mitochondrial Ca2+ (i.e., [Ca2+]i). Protocol 2 ([Ca2+] range from 4 μM to 25 μM): here mitochondria were suspended in 40 μM EGTA and 1 μM Fluo4-FF was used. Total Ca2+ influx (J) is taken as the first derivative of the linear fit to the measured total extramitochondrial [Ca2+] over the first 20 s of each experiment. The total Ca2+ conductance of the IMM (G) was obtained from the simultaneous measurements of J, [Ca2+]i, [Ca2+]m and ΔΨm according to the typical Hodgkin–Huxley model (Wescott et al., 2019):
I = G (ΔΨm – ECa2+) where ECa2+ is the Nernst reversal potential for Ca2+ obtained from simultaneously measured [Ca2+]i, and [Ca2+]m. Measured J was converted to I using the Faraday constant (Wescott et al., 2019).
Measurements of mitochondrial Na+ influx in isolated mitochondria
Request a detailed protocolMembrane potentials in intact mitochondria were evaluated with TMRE using previously described method (Scaduto and Grotyohann, 1999). Mitochondria isolated from mouse liver or MEF cells were suspended in ice-cold initial medium. These mitochondria were mixed in 50–100 μl of an uptake assay buffer (liver: 150 mM NaCl, 10 mM HEPES, 1 mM EGTA, 2 mM glutamate, 2 mM malate, and 2 mM succinate, pH 7.2 with Trizma base; MEF: 30 mM NaCl, 120 mM TrisCl, 10 mM HEPES, 1 mM EGTA, 1 μM MgCl2, 5 mM glutamate, 5 mM malate, and 5 mM succinate, pH 7.2 with Trizma base) with 200 nM TMRE. Mitochondrial concentration in the assay buffer was 0.25 mg/ml. TMRE fluorescence were measured at 550/570 nm and 570/589 nm (excitation/emission, 9 nm band width) with using a Biotek Synergy H4 plate reader, and the fluorescence ratio between two fluorescence was calculated. After 5 min incubation of mitochondria in the assay medium, assays were initiated by injection of 0.5–1 μl of EDTA (5 mM final), RuR (1–3 μM final) or FCCP (1 μM final), and the ratio change within 5 min after the injection was evaluated. The ratio change induced by EDTA and/or RuR was normalized with that by FCCP.
Co-immunoprecipitation
Request a detailed protocolMitochondria or mitoplasts were isolated from MEFs deficient in the MCU subunit but stably expressing Flag-tagged MCU. Mitochondrial fraction from wild type cells (without MCU-FLAG) was used as negative control. Isolated mitoplasts (but not mitochondria) were incubated in 750 mM KCl for 30 min before solubilization. Briefly, 300 µg of protein lysate was solubilized with 500 µl of lysis buffer (50 mM HEPES pH 7.4, 150 mM NaCl, 1 mM EGTA, 0.2% DDM and Halt protease inhibitor cocktail [Thermo Fisher]) for 30 min at 4°C. Lysates were cleared by spinning at 20,000× g for 10 min at 4°C. Cleared lysates were incubated with anti-Flag M2 affinity gel (Sigma A2220) for 2 hr at 4°C. Immunoprecipitates were washed with 1 ml of lysis buffer three times and boiled in 20 μl of Laemmli buffer (without β-mercaptoethanol). One-third of the immunoprecipitate was loaded onto a 4–20% gradient SDS-PAGE gel for detection of the indicated proteins by Western blotting. Flow-through fraction was also collected and analyzed in the same gel.
Immunoblots
Request a detailed protocolFor western blot analysis, MEFs or isolated mitochondria/mitoplasts were lysed in radioimmunoprecipitation assay (RIPA) buffer (1% IGEPAL, 0.1% sodium dodecyl sulfate, 0.5% sodium deoxycholate, 150 mM NaCl, 1 mM EDTA, 50 mM Tris-HCl (pH 7.4) and a cocktail of proteases inhibitors). Lysates were resolved by SDS-PAGE; transferred to PVDF membrane (Millipore); and probed with anti-MCU (Sigma, HPA016480, 1:2000), anti-EMRE (Santa Cruz, sc-86337, 1:200), anti-HSP60 (Santa Cruz, sc-1052, 1:3000), anti-VDAC (Abcam, ab15895, 1:2000), anti-MICU1 (Cell Signaling Technology, 12524S, 1:2000), anti-MICU2 (Bethyl, A300-BL19212, 1:500), anti-MICU3 (Sigma, HPA024779, 1:1000), and anti-TOM20 (Santa Cruz, sc-11415, 1:2000). Anti-MICU1 antibody produced a non-specific band near its monomeric molecular weight (~50 kDa), so samples were prepared in Laemmli buffer without β-mercaptoethanol to detect MICU1 homo- or heterodimers (~100 kDa).
Statistical analysis
Request a detailed protocolData are presented as mean ± standard error of the mean (SEM), as specified in the Figure legend. Statistical analysis was completed in Excel or Origin 9.6. All experiments were performed in triplicate or more. Statistical significance at an exact p-value was determined with the methods as indicated in the corresponding Figure legends.
Data availability
Due to the size of the dataset, raw electrophysiology traces are available on request to the corresponding author. All information has been extracted from the raw electrophysiological traces and is available to download as source data files. All the codes or software used in analyzing the data and their sources are listed in the Key Resources Table.
References
-
Manganese stimulates calcium flux through the mitochondrial uniporterBiochimica Et Biophysica Acta (BBA) - Bioenergetics 807:202–209.https://doi.org/10.1016/0005-2728(85)90123-9
-
Mitochondrial transport of cations: channels, exchangers, and permeability transitionPhysiological Reviews 79:1127–1155.https://doi.org/10.1152/physrev.1999.79.4.1127
-
Calcium signalling: dynamics, homeostasis and remodellingNature Reviews. Molecular Cell Biology 4:517–529.https://doi.org/10.1038/nrm1155
-
NCLX: the mitochondrial sodium calcium exchangerJournal of Molecular and Cellular Cardiology 59:205–213.https://doi.org/10.1016/j.yjmcc.2013.03.012
-
Dissection of mitochondrial Ca2+ uptake and release fluxes in situ after depolarization-evoked [Ca2+]i elevations in sympathetic neuronsThe Journal of General Physiology 115:351–370.https://doi.org/10.1085/jgp.115.3.351
-
A rapid and sensitive Nucleic Acid Amplification Technique for Mycoplasma screening of cell therapy productsMolecular Therapy. Methods & Clinical Development 17:393–399.https://doi.org/10.1016/j.omtm.2020.01.009
-
Calmodulin as a direct detector of Ca2+ signalsNature Neuroscience 14:301–304.https://doi.org/10.1038/nn.2746
-
Activity of the mitochondrial calcium uniporter varies greatly between tissuesNature Communications 3:1317.https://doi.org/10.1038/ncomms2325
-
Regulation of the mitochondrial Ca2+ uniporter by MICU1 and MICU2Biochemical and Biophysical Research Communications 449:377–383.https://doi.org/10.1016/j.bbrc.2014.04.146
-
Patch-Clamp Analysis of the Mitochondrial Calcium UniporterMethods in Molecular Biology 1925:75–86.https://doi.org/10.1007/978-1-4939-9018-4_7
-
Role of mitochondrial Ca2+ in the regulation of cellular energeticsBiochemistry 51:2959–2973.https://doi.org/10.1021/bi2018909
-
A new generation of Ca2+ indicators with greatly improved fluorescence propertiesThe Journal of Biological Chemistry 260:3440–3450.
-
Mechanisms by which mitochondria transport calciumThe American Journal of Physiology 258:C755–C786.https://doi.org/10.1152/ajpcell.1990.258.5.C755
-
Assessment of cardiac function in mice lacking the mitochondrial calcium uniporterJournal of Molecular and Cellular Cardiology 85:178–182.https://doi.org/10.1016/j.yjmcc.2015.05.022
-
Effect of micromolar concentrations of manganese ions on calcium-ion cycling in rat liver mitochondriaThe Biochemical Journal 212:773–782.https://doi.org/10.1042/bj2120773
-
Effect of cations and anions on the steady state kinetics of energy-dependent Ca2+ transport in rat liver mitochondriaThe Journal of Biological Chemistry 251:5251–5258.
-
Ca2+ ions, an allosteric activator of calcium uptake in rat liver mitochondriaArchives of Biochemistry and Biophysics 251:525–535.https://doi.org/10.1016/0003-9861(86)90360-7
-
MCUR1 is an essential component of mitochondrial Ca2+ uptake that regulates cellular metabolismNature Cell Biology 14:1336–1343.https://doi.org/10.1038/ncb2622
-
Role of calcium ions in regulation of mammalian intramitochondrial metabolismPhysiological Reviews 70:391–425.https://doi.org/10.1152/physrev.1990.70.2.391
-
Mitochondrial Ca2+ transport and the role of intramitochondrial Ca2+ in the regulation of energy metabolismDevelopmental Neuroscience 15:165–173.https://doi.org/10.1159/000111332
-
Mitochondria and calcium signalingCell Calcium 38:311–317.https://doi.org/10.1016/j.ceca.2005.06.011
-
MICU3 is a tissue-specific enhancer of mitochondrial calcium uptakeCell Death and Differentiation 26:179–195.https://doi.org/10.1038/s41418-018-0113-8
-
Genome engineering using the CRISPR-Cas9 systemNature Protocols 8:2281–2308.https://doi.org/10.1038/nprot.2013.143
-
Imaging intraorganellar Ca2+ at subcellular resolution using CEPIANature Communications 5:4153.https://doi.org/10.1038/ncomms5153
-
The initial velocities of calcium uptake by rat liver mitochondriaThe Journal of Biological Chemistry 248:5527–5531.
-
Voltage-energized calcium-sensitive ATP production by mitochondriaNature Metabolism 1:975–984.https://doi.org/10.1038/s42255-019-0126-8
Article and author information
Author details
Funding
National Institutes of Health (R01GM134536)
- Yuriy Kirichok
National Institutes of Health (R35GM136415)
- Yuriy Kirichok
American Heart Association (17SDG33660926)
- Vivek Garg
The funders had no role in study design, data collection and interpretation, or the decision to submit the work for publication.
Acknowledgements
We thank Drs. Katsuyoshi Mihara (Kyushu University, Japan) and David C. Chan (Caltech, USA) for sending us DRP1-KO MEFs, and Dr. Toren Finkel (University of Pittsburgh, USA) for sending the MEFs with intact DRP1 (WT and MICU1-KO MEFs) and the MCU-KO mice. We thank the Nikon Microscopy Core (DeLaine Larsen, Kari Herrington) and Lab for Cell Analysis (Sarah Elms) at UCSF for help with use of microscopy and FACS equipment. We thank all members of the YK lab for helpful discussions. This work was supported by American Heart Association Scientist Development Grant 17SDG33660926 (VG) and NIH grant 5R01GM107710 (YK) and R35GM136415 (YK).
Ethics
Animal experimentation: All animal experiments were performed according to procedures approved by the UCSF Institutional Animal Care and Use Committee (approval # AN183460-02A) and adhered to NIH standards.
Copyright
© 2021, Garg et al.
This article is distributed under the terms of the Creative Commons Attribution License, which permits unrestricted use and redistribution provided that the original author and source are credited.
Metrics
-
- 3,265
- views
-
- 491
- downloads
-
- 62
- citations
Views, downloads and citations are aggregated across all versions of this paper published by eLife.
Citations by DOI
-
- 62
- citations for umbrella DOI https://doi.org/10.7554/eLife.69312
Download links
A two-part list of links to download the article, or parts of the article, in various formats.
Downloads (link to download the article as PDF)
Open citations (links to open the citations from this article in various online reference manager services)
Cite this article (links to download the citations from this article in formats compatible with various reference manager tools)
The mechanism of MICU-dependent gating of the mitochondrial Ca2+uniporter
eLife 10:e69312.
https://doi.org/10.7554/eLife.69312


