Information transfer in mammalian glycan-based communication
- Department of Pharmaceutical Sciences, University of Vienna, Austria
- Department of Biomolecular Systems, Max Planck Institute of Colloids and Interfaces, Germany
- Department of Microbiology, Immunology and Genetics University of Vienna, Max F. Perutz Labs, Austria
Figures
Figure 1
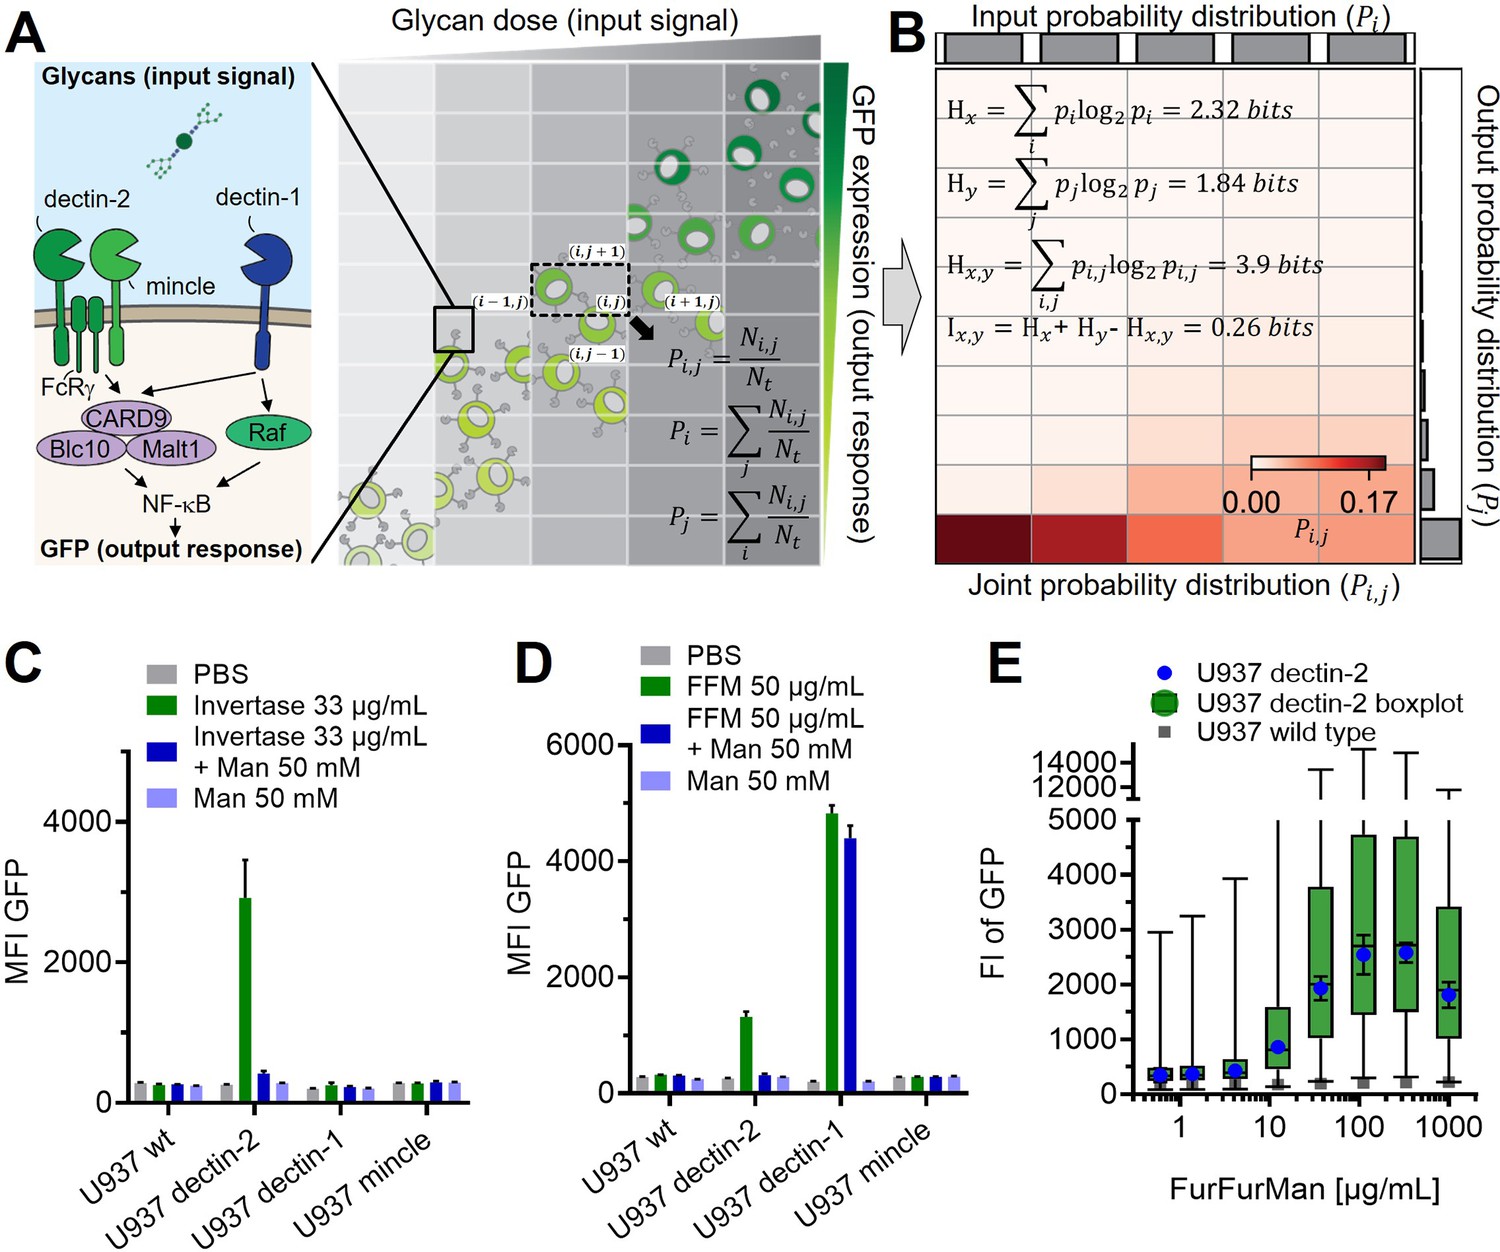
Reporter cell system for the observation of glycan-lectin interactions.
(A) Schematic representation of dectin-1, dectin-2, and macrophage-inducible C-type lectin (MINCLE) signaling pathway with GFP under control of nuclear factor kappa-B (NF-κB; left) and the dose dependence of the GFP expression of the cells (right). The input and output distribution of single-cell resolution data are divided by indexed (i.e. and ) rectangular grids to estimate the joint and marginal probability of the distribution. and are the number of cells in the index and the total number of cells, respectively. (B) Estimated joint probability distribution between the input glycan concentration and GFP expression using the procedures described in (A). The joint entropy () and marginal entropies ( and ) and therefore mutual information () can be calculated from the estimated distribution. The channel capacity of the distribution can be further found by maximizing the mutual information with various trial input distributions (see also Appendix 2—figure 3). Experimental data for FurFurMan stimulation is shown. (C–D) Monoclonal reporter cells expressing dectin-1, dectin-2, MINCLE, or wild type (WT) were stimulated with (C) invertase or (D) FurFurMan (n=3). (E) Dose response of the dectin-2 reporter cells is shown both as geometric mean with SD and boxplot with the whiskers representing the 1 percentile of the cellular population (n=6).
Figure 2
Quantification of signal transduction.
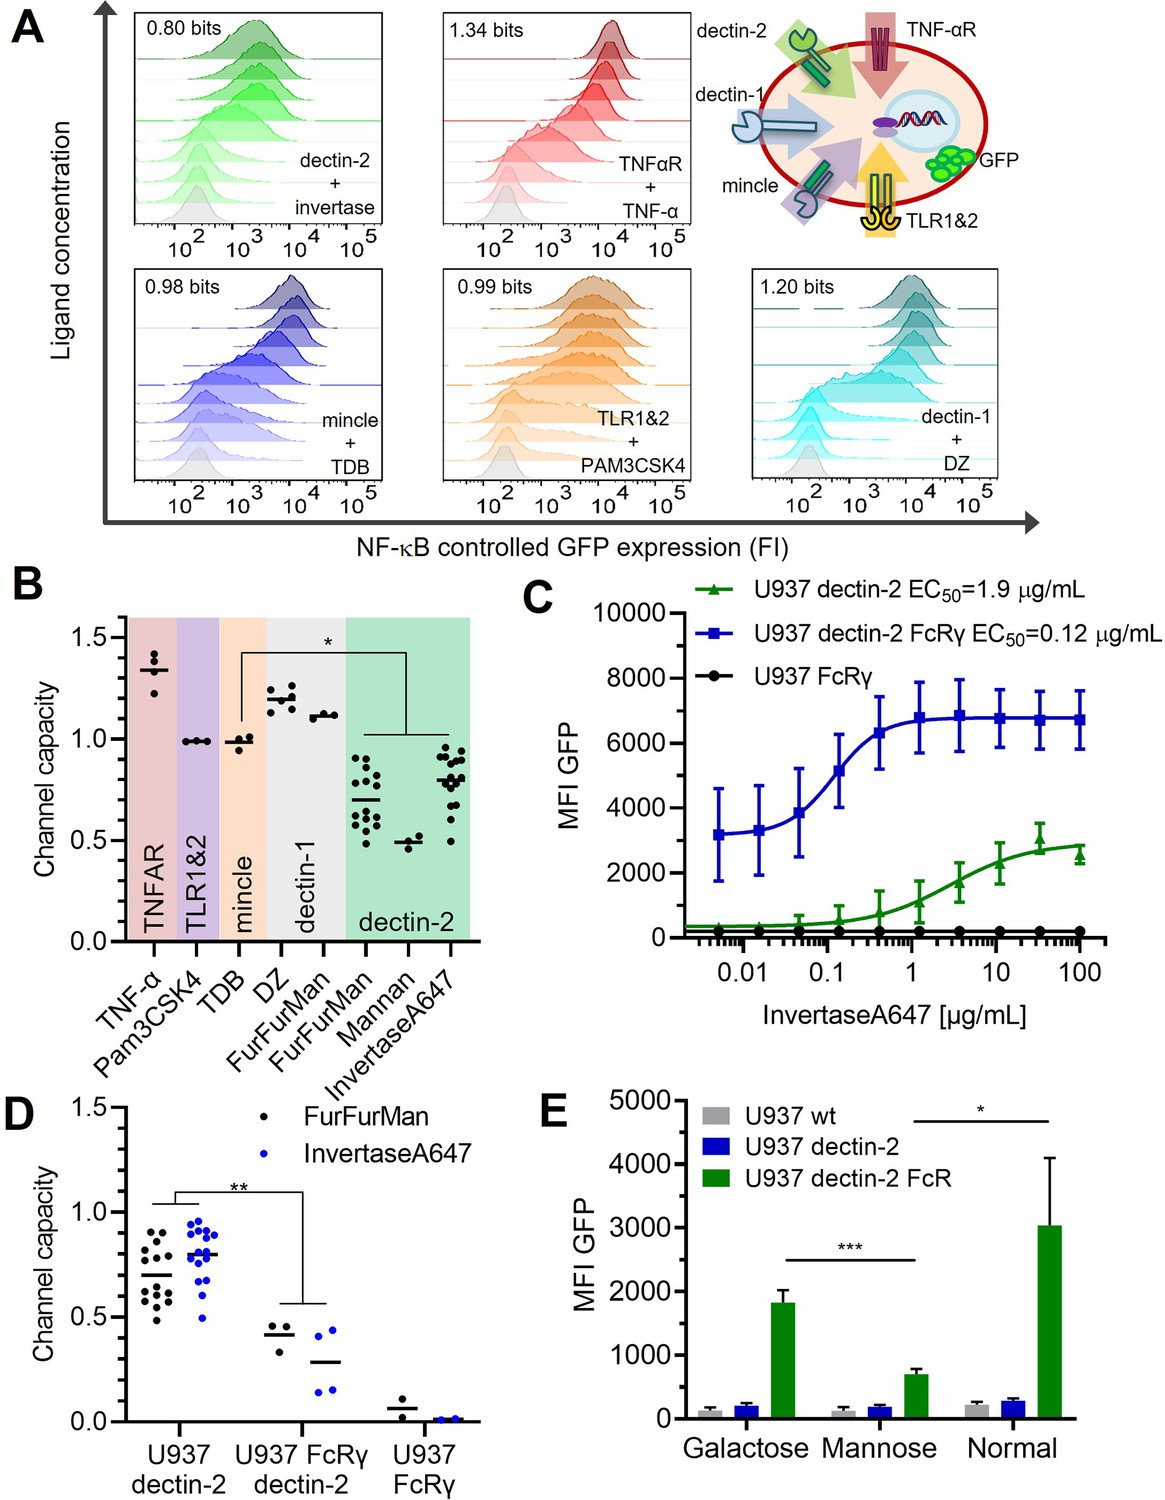
(A) Representative histograms of U937 reporter cells dose response, stimulated specifically with invertase for dectin-2, TNFα for the TNFαR, trehalose-6,6-dibehenate (TDB) for macrophage-inducible C-type lectin (MINCLE), Pam3-Cys-Ser-Lys4 (Pam3CSK4) for TLR1&2, and depleted zymosan (DZ) for dectin-1. The number in each histogram is the channel capacity of the corresponding signals. Top right panel shows a schematic representation of the five analyzed receptor channels. (B) Estimated channel capacities between various pairs of ligand and receptor (*p<0.05, Wilcoxon rank-sum test). (C) Monoclonal reporter cells either expressing dectin-2 (n=3), FcRγ (n=2), or dectin-2 and FcRγ (n=4) were stimulated for 16 hr with various concentrations of invertase, labeled with Atto647 dye. The error bars indicate the SDs. (D) Channel capacities from stimulation with invertase and FurFurMan (data also seen in B) and FurFurMan stimulation of U937 reporter cells (**p<0.01, Wilcoxon rank-sum test). (E) Unstimulated reporter cells (mock stimulated) 16 hr after cultivation with 25 mM galactose, or mannose, or under normal conditions for 48 hr (n=3, *p<0.05 and ***p<0.001, Student’s t-test), suggesting that dectin-2 mediated self-recognition leads to a high basal level of cellular activation in FcRγ overexpression cells.
Figure 3
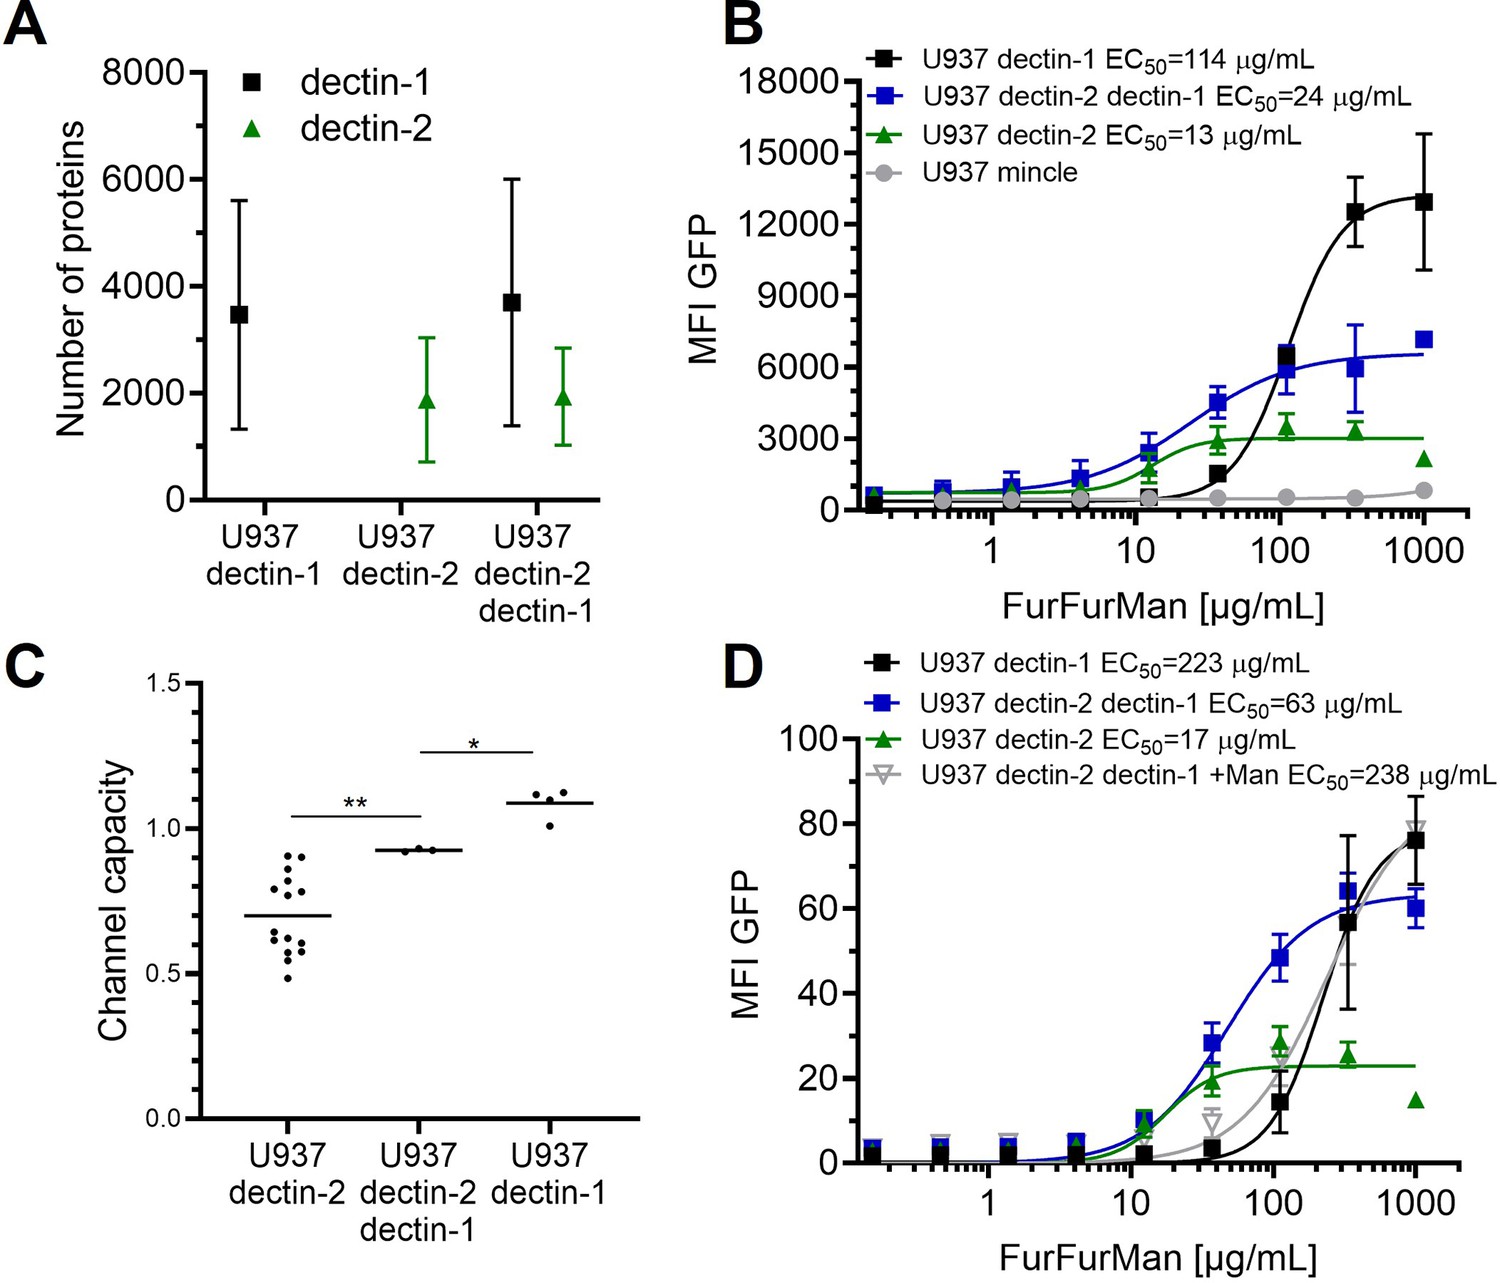
Signal integration of dectin-1 and dectin-2.
(A) Quantitation of surface expression of U937 dectin-1, dectin-2, and dectin-1 dectin-2 U937 reporter cells. Fluorescence intensity (FI) values were transformed into the number of proteins expressed using a PE-quantitation. Graph shows geometric mean ± robust SD of the cellular population. (B) Monoclonal reporter cells either expressing macrophage-inducible C-type lectin (MINCLE), dectin-2, dectin-1, or both dectin-2 and dectin-1 were stimulated for 16 hr with various concentrations of FurFurMan (n≥3). The error bars indicate the SDs. (C) Channel capacities of U937 reporter cells expressing either dectin-1, dectin-2, or both stimulated with FurFurMan (*p<0.05 and **p<0.01, Wilcoxon rank-sum test). (D) Monoclonal reporter cells either expressing dectin-2, dectin-1, or both dectin-2 and dectin-1, stimulated with various concentrations of FurFurMan (n=3). Dectin-1 expressing cells were stimulated either with or without 25 mM of mannose. The error bars indicate the SDs.
Figure 4
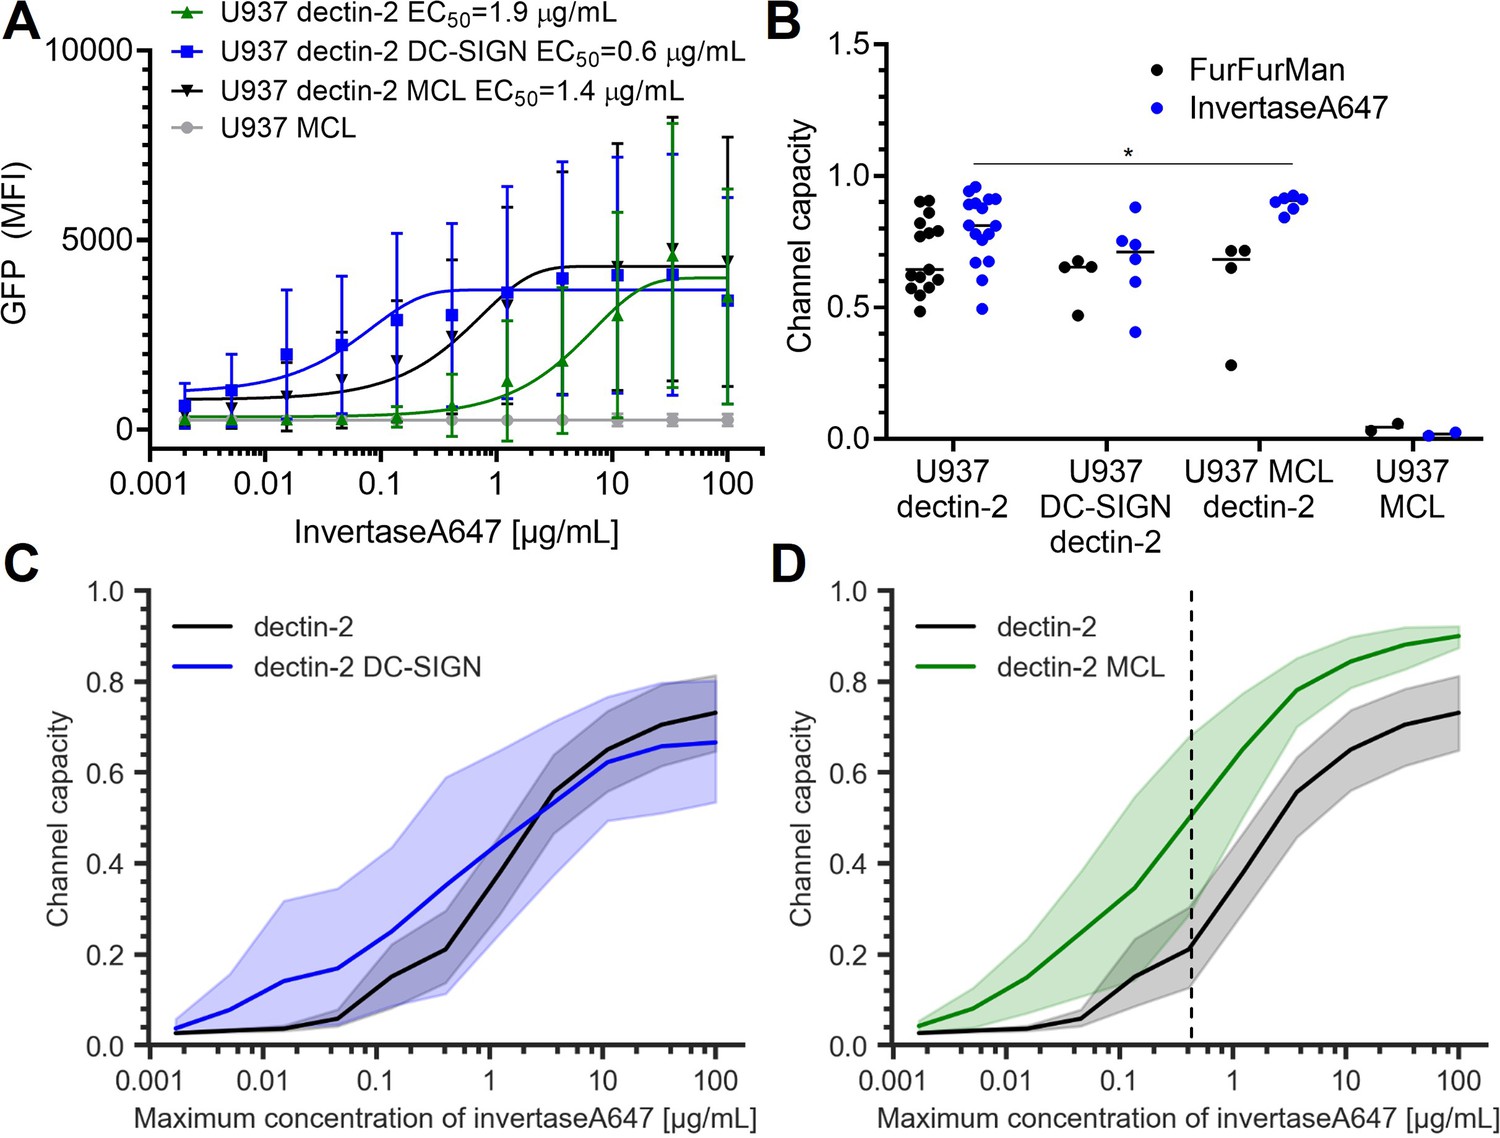
Signal response of dectin-2 in the presence DC-specific ICAM-3–grabbing nonintegrin (DC-SIGN) or macrophage C-type lectin (MCL).
(A) Representative dose response of invertase stimulation of U937 cells expressing dectin-2, MCL, or dectin-2 co-expressed with either DC-SIGN or MCL. (B) Channel capacities of dectin-2 in combination with DC-SIGN and MCL after stimulation with either FurFurMan or invertase (*p<0.05, Wilcoxon rank-sum test). (C and D) Channel capacities calculated from different maximum invertase concentrations of dectin-2 expressing cells compared with either DC-SIGN (C) or MCL (D) co-expression. The shaded regions represent the 95% CI of the channel capacity. The right side of the dashed line in (D) is the region that shows statistical significance between dectin-2 and MCL co-expressed dectin-2 (*p<0.05, Wilcoxon rank-sum test).
Figure 5
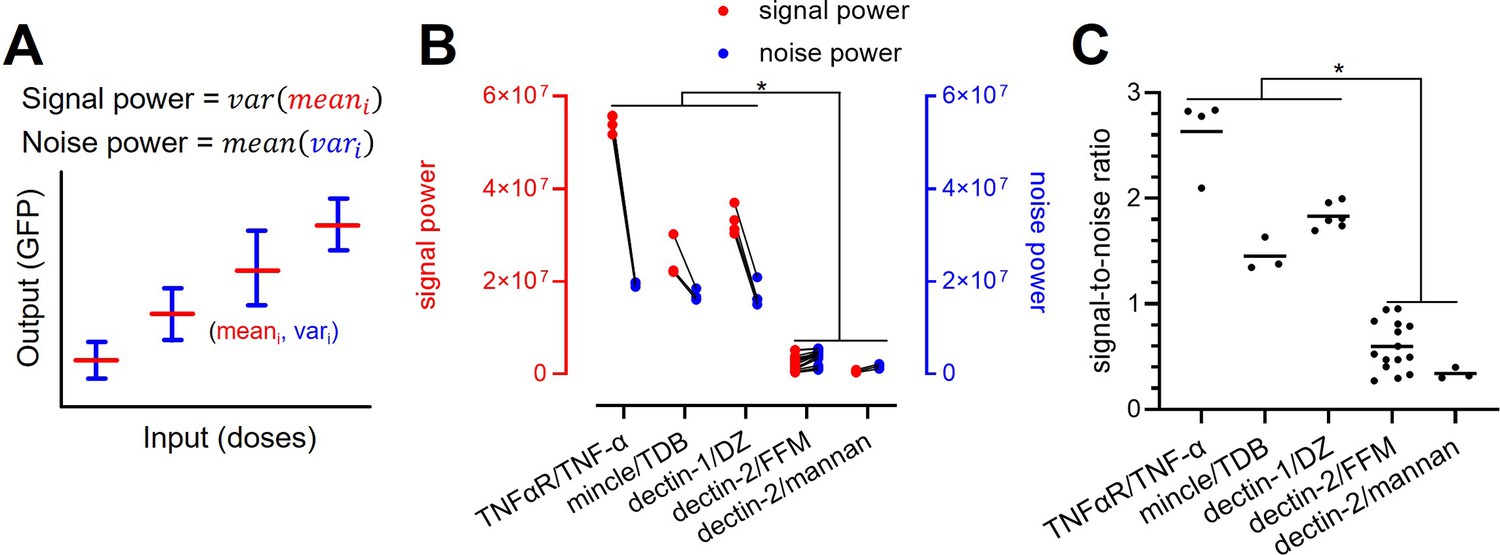
Decomposition of the signaling channels into signal power and noise power.
(A) Schematic description of signal and noise power. meani and vari are the average and variance of the output at ith dose, respectively. (B) Decomposed signal power (red) and noise power (blue) of the individual signaling channel. (C) The ratio between signal power and noise power (i.e. signal-to-noise ratio) of individual channel given in (A) (*p<0.05, Wilcoxon rank-sum test).
Appendix 1—figure 1
Signal transduction in the reporter cells.
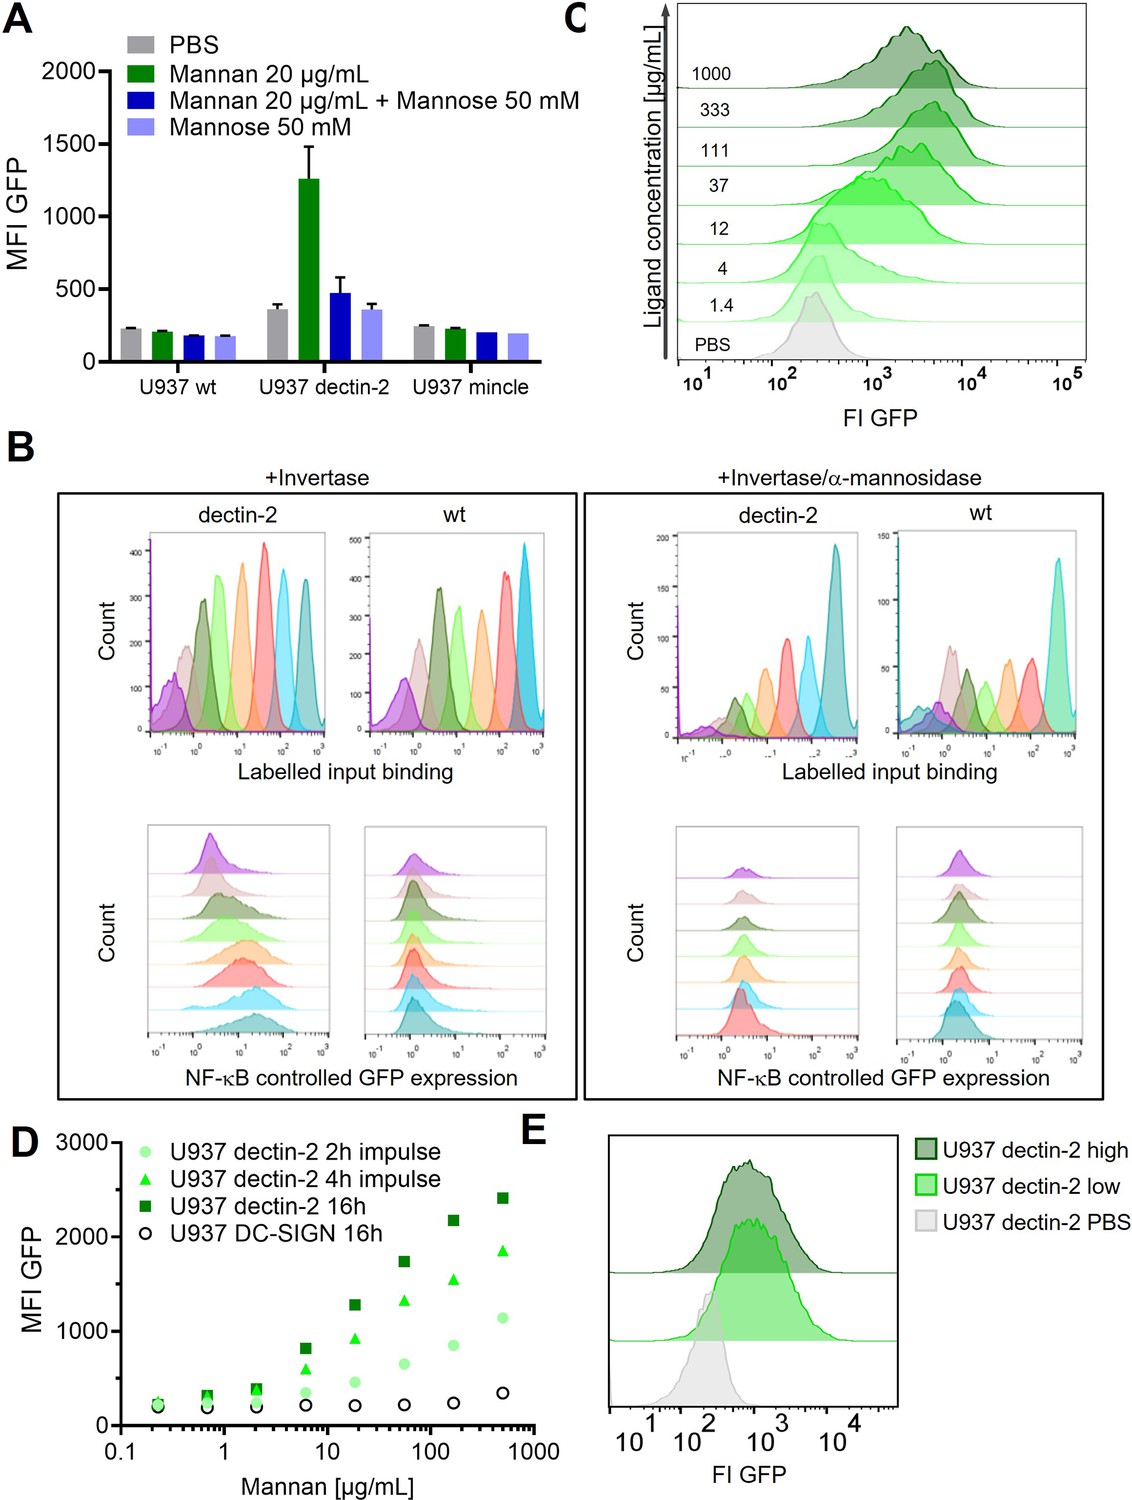
(A) Monoclonal U937 reporter cells expressing macrophage-inducible C-type lectin (mincle), dectin-2, or wild type were stimulated with mannan (n=4). Mannose alone could not stimulate dectin-2 but could inhibit stimulation by Mannan. (B) Dectin-2 downstream signaling is mediated by glycosylation of invertase. (Left) Interaction of Atto647 labeled invertase with dectin-2 or wild type U937 cells. While activation of the downstream signaling is dectin-2 specific (lower panel), the binding of invertase to U937 does not depend only on the interaction with dectin-2 (upper panel). Right: The invertase and U937 cells were treated with α-mannosidase. Such treatment resulted in complete inhibition of nuclear factor kappa-B (NF-κB) activation in dectin-2 cells (lower panel) but did not affect protein binding (upper panel). (C) Histograms of the dose response in Figure 1D and U937 dectin-2 expressing reporter cells react to various concentrations of FurFurMan. Darker histograms were stimulated with higher ligand concentration. (D) Dose response of dectin-2 and DC-specific ICAM-3–grabbing nonintegrin (DC-SIGN) expressing reporter cells stimulated for 16 hr, or stimulated for 2 and 4 hr, washed in fresh media, and incubated to a total of 16 hr. (E) U937 dectin-2 reporter cells were sorted in a GFP high and low population after stimulation for 16 hr with 300 µg/mL Mannan. The sorted cells were the re-stimulated 2 weeks later with 500 µg/mL.
Appendix 1—figure 2
Stimulation time and stimulant dependent signal transduction in the model cells expressing the receptor of interest.
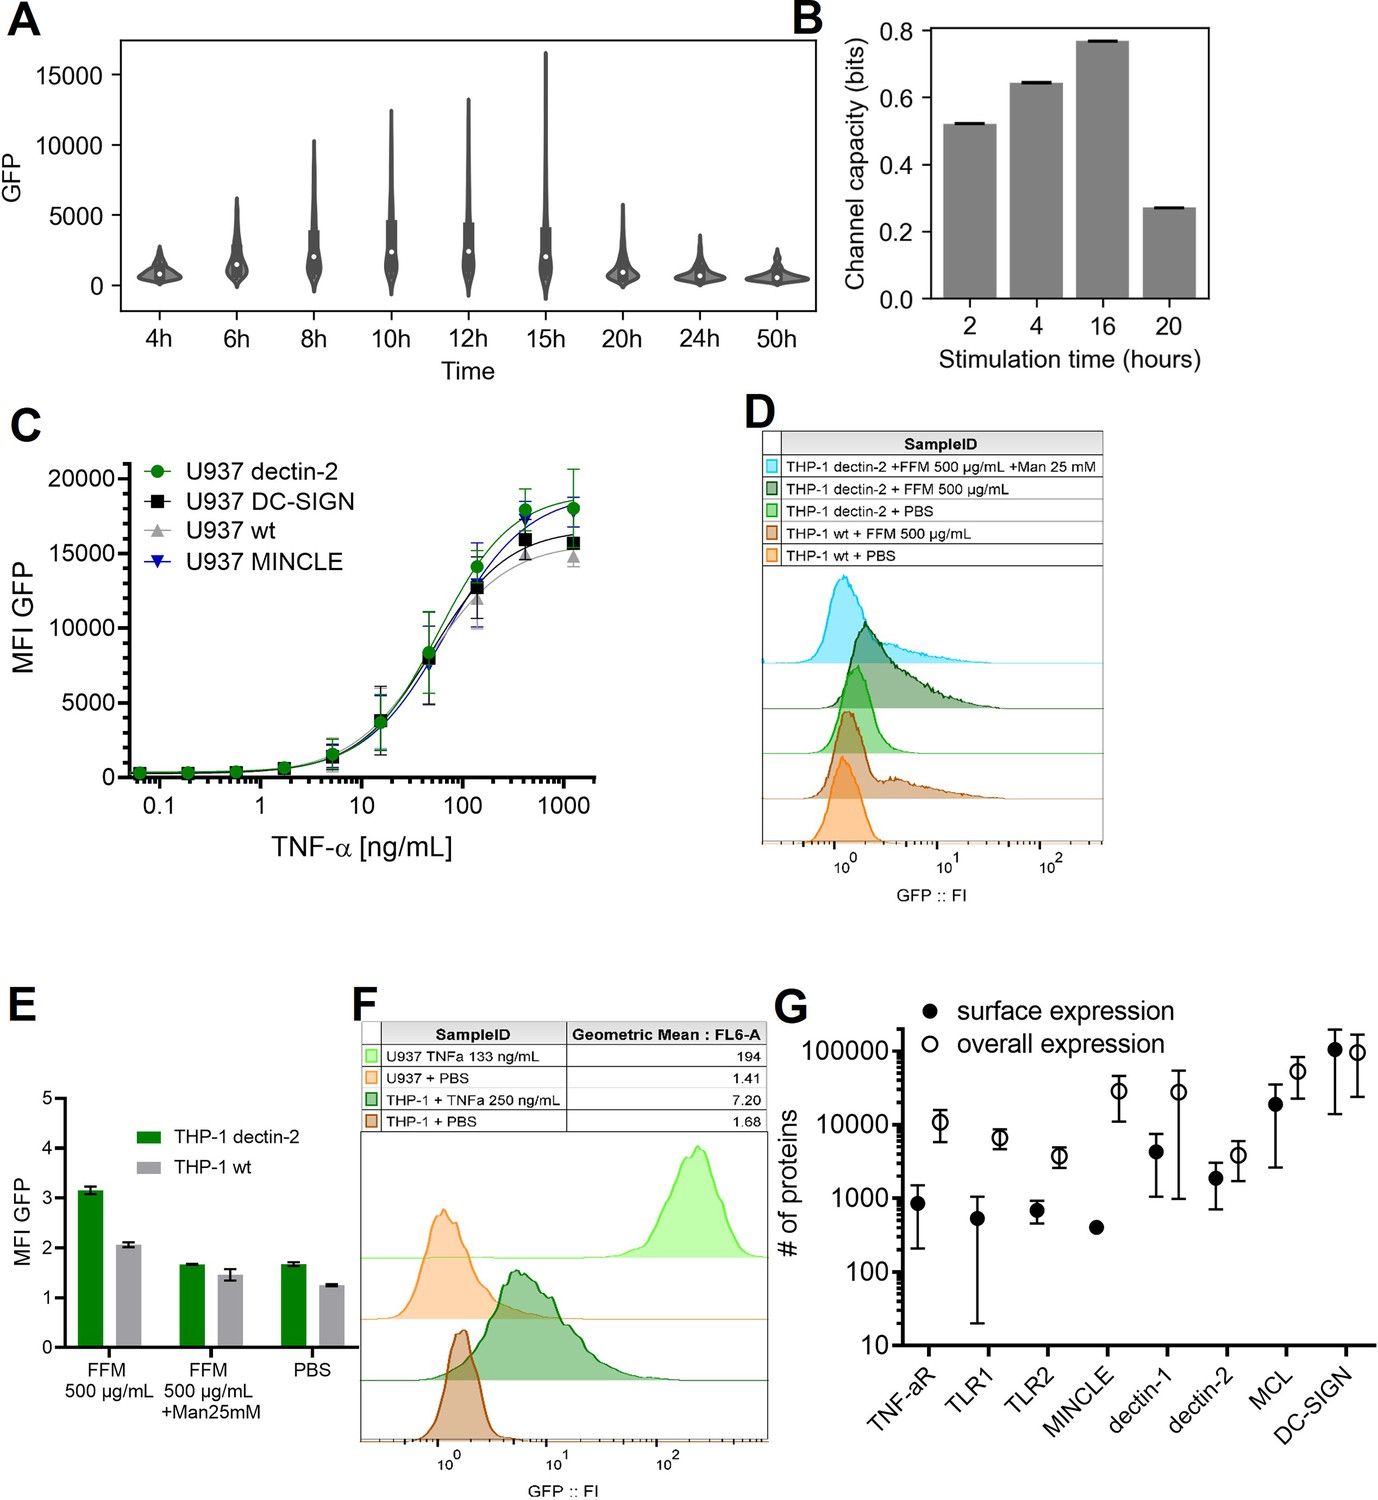
(A) Violin plot of nuclear factor kappa-B (NF-κB) controlled GFP expression of U937 cells in response to 50 ng/mL TNF-α stimulant for various stimulation time. (B) Channel capacity of TNFαR channel to TNF-α stimulant for various stimulation time. Error bars indicate 95% CI. (C) Reporter cell lines expressing various lectins stimulated with TNF-α. (D) THP-1 reporter cells expressing dectin-2 or wild type (WT) were stimulated for 48 hr with FurFurMan (FFM), unstimulated (PBS), or the FurFurMan stimulation was inhibited with 25 mM mannose. Graph shown representative histograms. (E) Geometric means of the experiment done in A in triplicates (n=3) with the error bar representing SD. (F) Representative histograms showing the TNF-α stimulation (13 hr) of U937 and THP-1 reporter cells. THP-1 cells stimulated for 48 hr with TNF-α gave less signal than at 13 hr (data not shown). (G) Quantitation of surface and overall expression of receptors used in this study in U937 reporter cells. Cells were stained either for their surface expression or their overall protein expression with PE coupled antibodies. FI values were transformed into the number of proteins expressed using a PE-quantitation kit. Graph shows geometric mean ± robust SD of the cellular population.
Appendix 1—figure 3
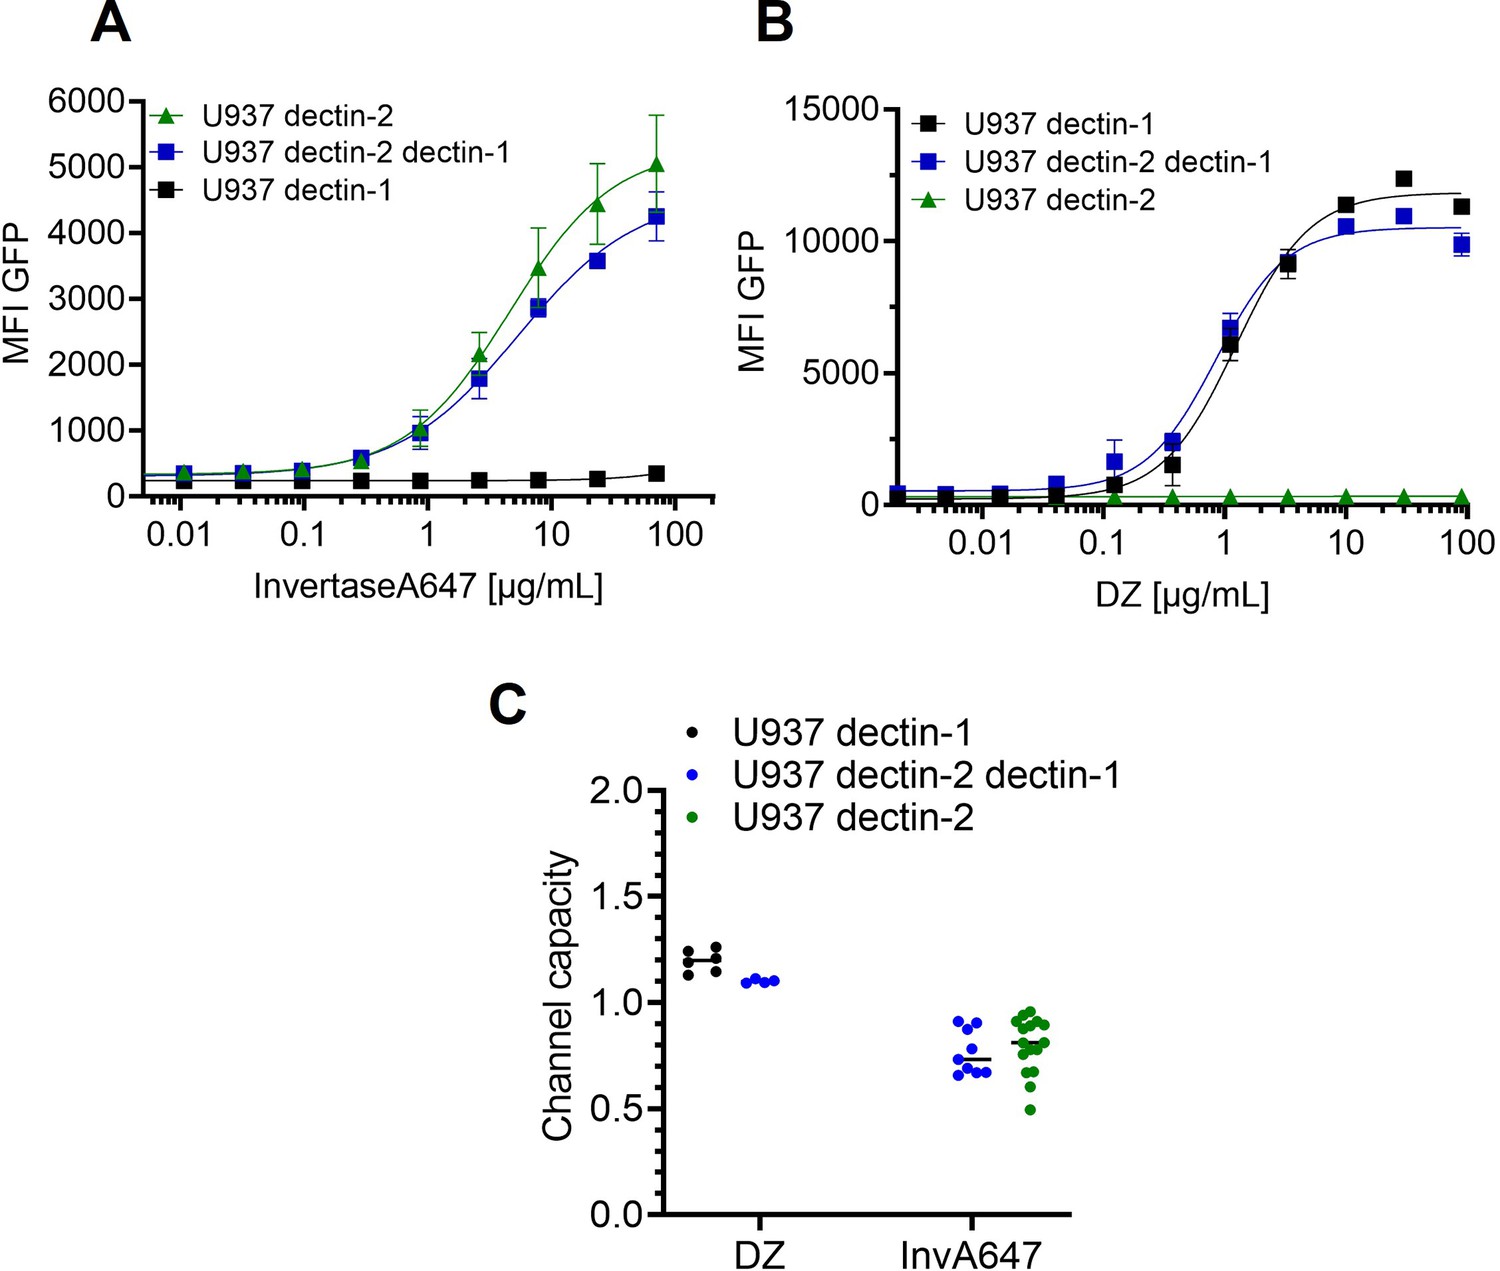
Signal integration of dectin-1 and dectin-2 in the presence of invertase or depleted zymosan.
Monoclonal reporter cells either expressing dectin-2, dectin-1, or both dectin-2 and dectin-1 (n≥3) were stimulated for 16 hr with various concentrations of (A) InvertaseA647, or (B) depleted zymosan respectively. (C) Channel capacities of the data in (A) and (B).
Appendix 1—figure 4
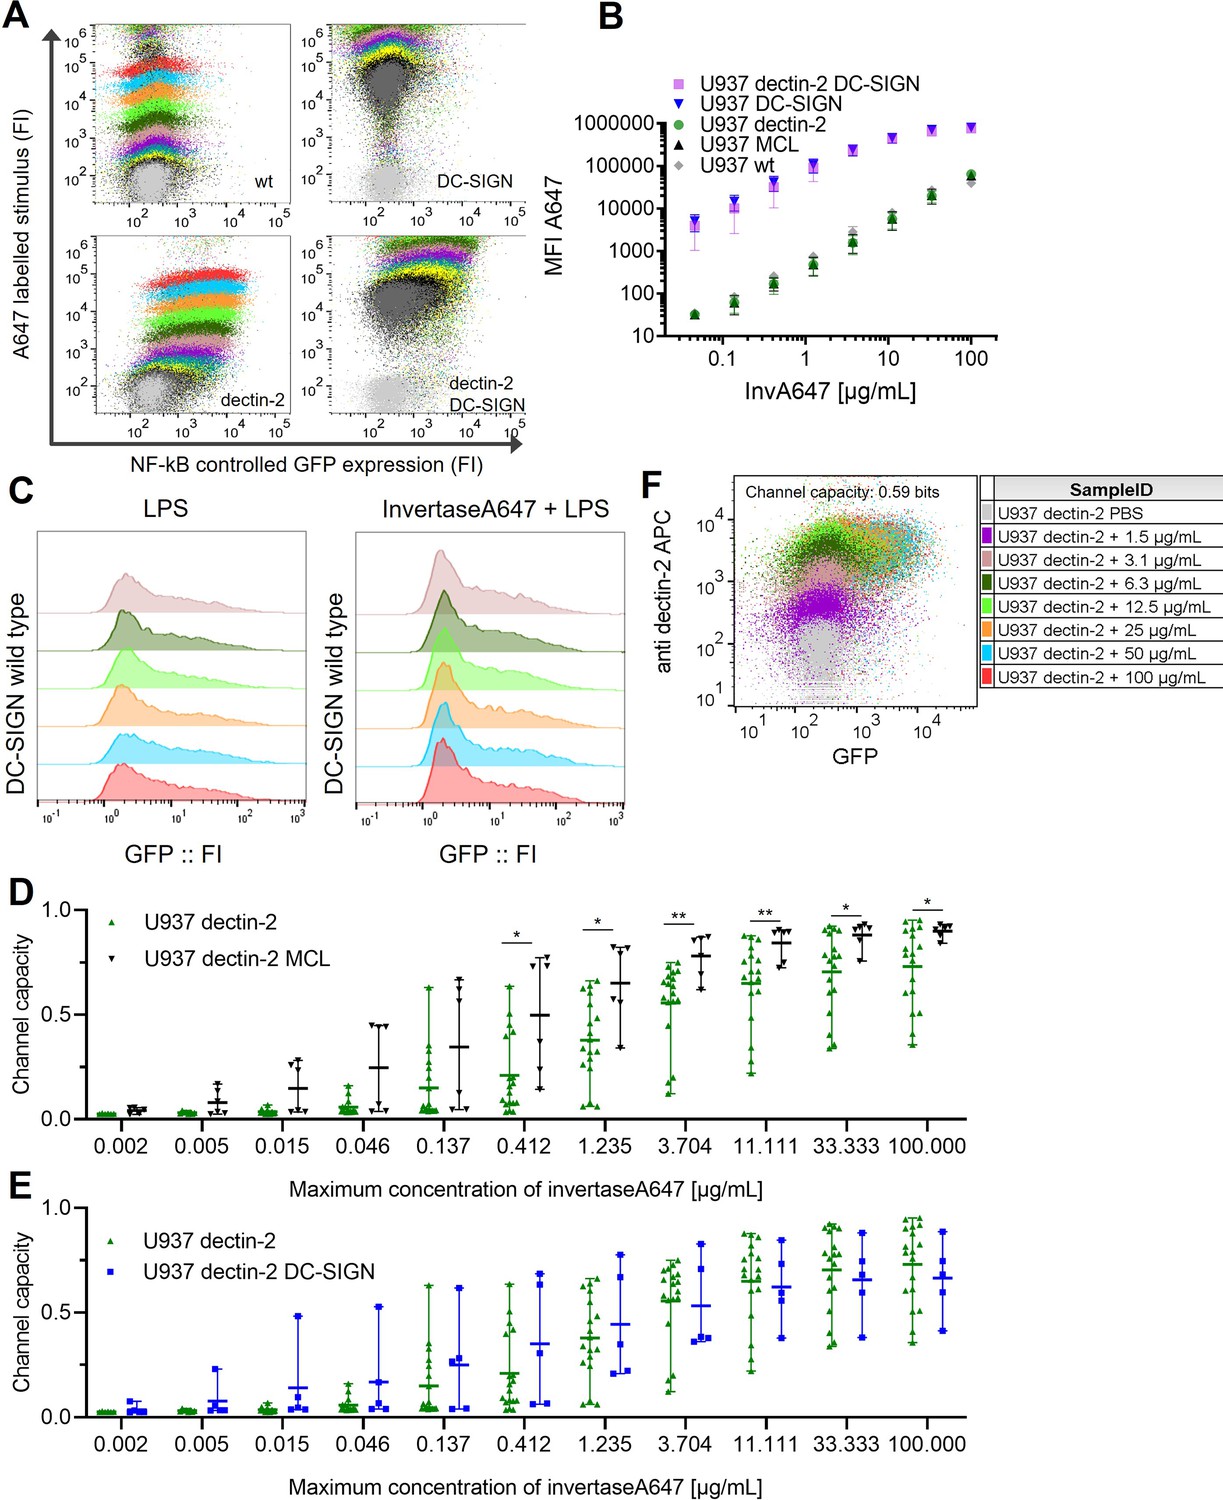
Signal integration between dectin-2 and either MCL or DC-SIGN in the presence of an invertase stimulus.
U937 reporter cells expressing lectins as indicated, representative 2D plots (A) and labeled input binding (B) seen in the main Figure 3B.(C) U937 reporter cells either wild type or DC-specific ICAM-3–grabbing nonintegrin (DC-SIGN) expressing were stimulated with 5 µg/mL LPS-EB (invivogen) and 50 µg/mL InvertaseA647 for 18 hr. (D) 2D dose response and channel capacity of dectin-2 U937 reporter cells stimulated with anti dectin-2 for 16 hr. Channel capacities calculated from different maximum invertase concentrations of dectin-2 expressing cells compared with either DC-SIGN (E) or MCL (F) co-expression (*p<0.05 and **p<0.01, Wilcoxon rank-sum test).
Appendix 1—figure 5
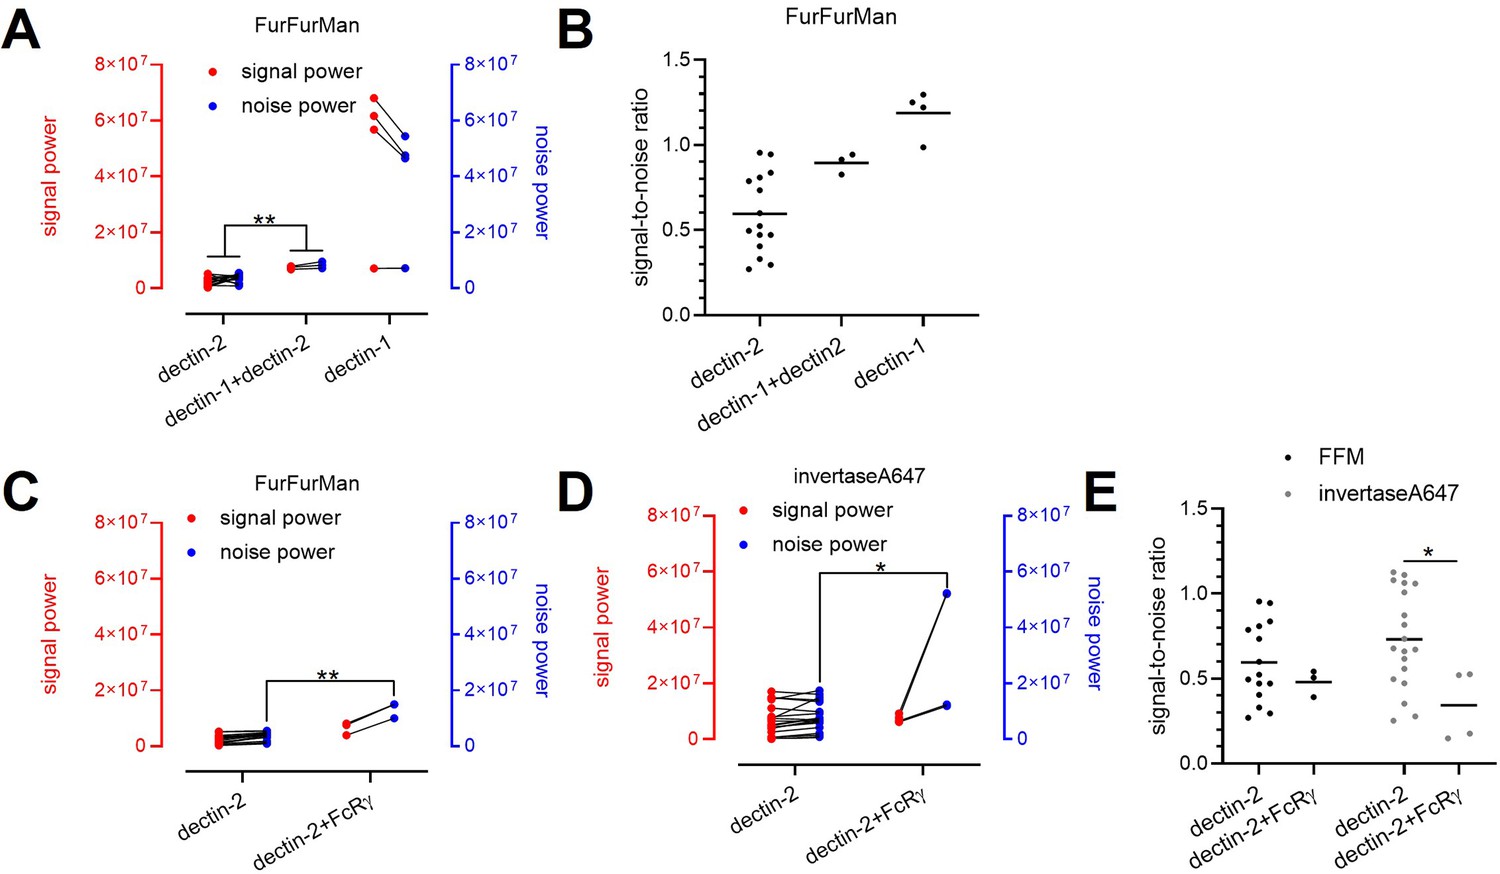
Decomposition of the signaling channels in various receptors and ligand conditions.
(A) Decomposed signal (red) and noise power (blue) of dectin-2, dectin-1, and dectin-1/dectin-2 channel in the presence of FurFurMan stimulant. (B) Signal-to-noise ratio of (A). (C and D) Decomposed signal and noise power of dectin-2 and dectin-2/overexpressed FcRγ channel in the presence of FurFurMan (C) and invertaseA647 (D). (E) Signal-to-noise ratio (C) and (D) (*p<0.05 and **p<0.01 Wilcoxon rank-sum test).
Appendix 1—figure 6
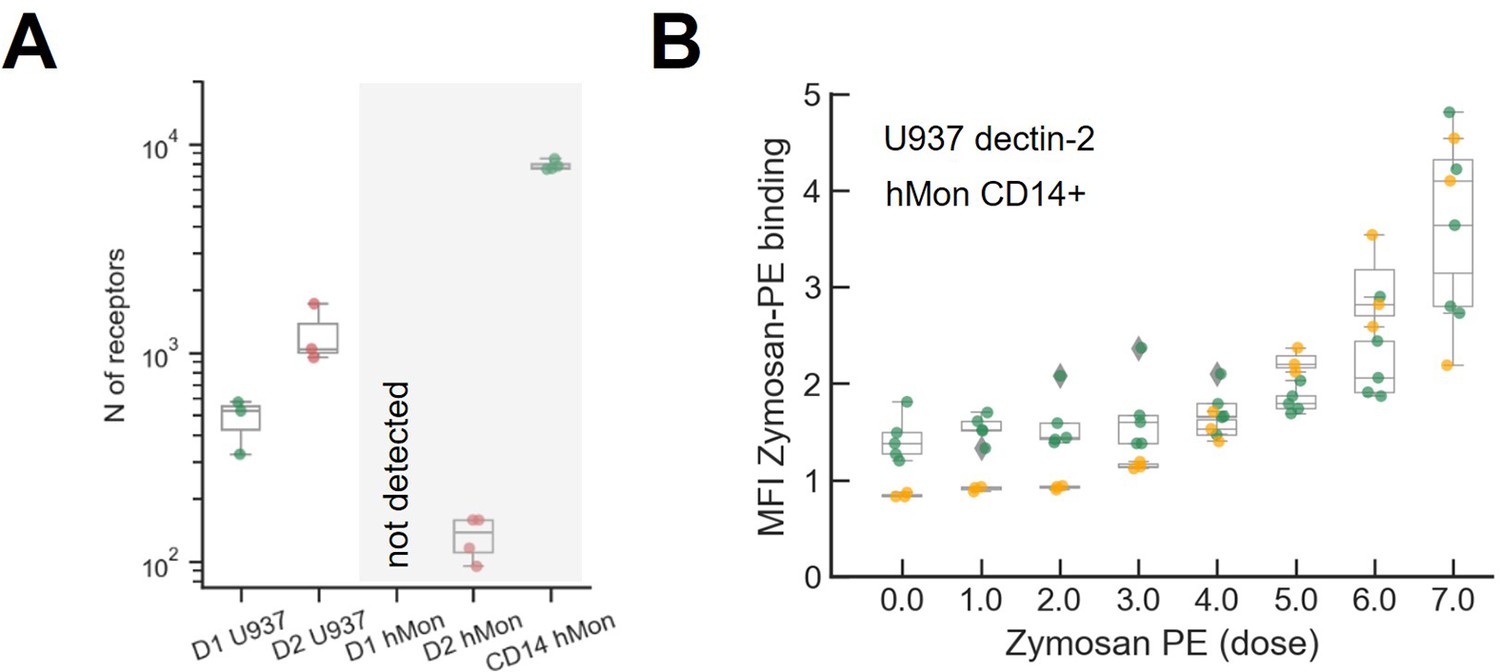
Quantification of the number of receptors and zymosan binding in primary cultured human monocytes.
(A) Comparison of dectin-1 and dectin-2 expression level between our model cell (U937) and primary cultured human monocyte. The number of dectin-2 expression on U937 cells and primary human monocytes are 477±133 and 144±24, respectively. (B) Labeled zymosan binding on dectin-2 expressing U937 and human monocyte.
Appendix 2—figure 1
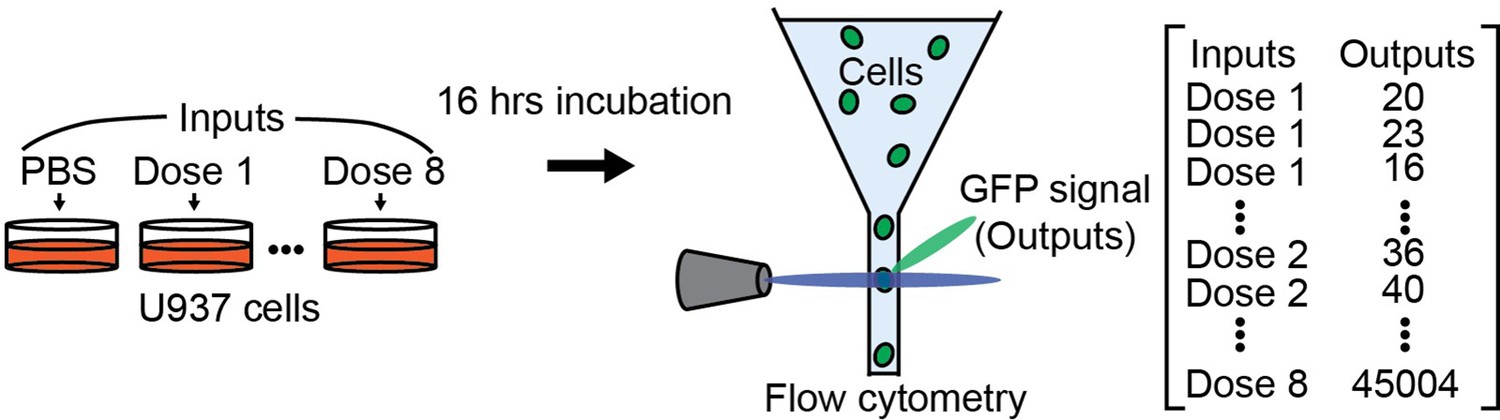
Illustrations showing how input and output are measured.
Appendix 2—figure 2
Mutual information and channel capacity calculation from TNF-α stimulation and nuclear factor kappa-B (NF-κB) reporter.
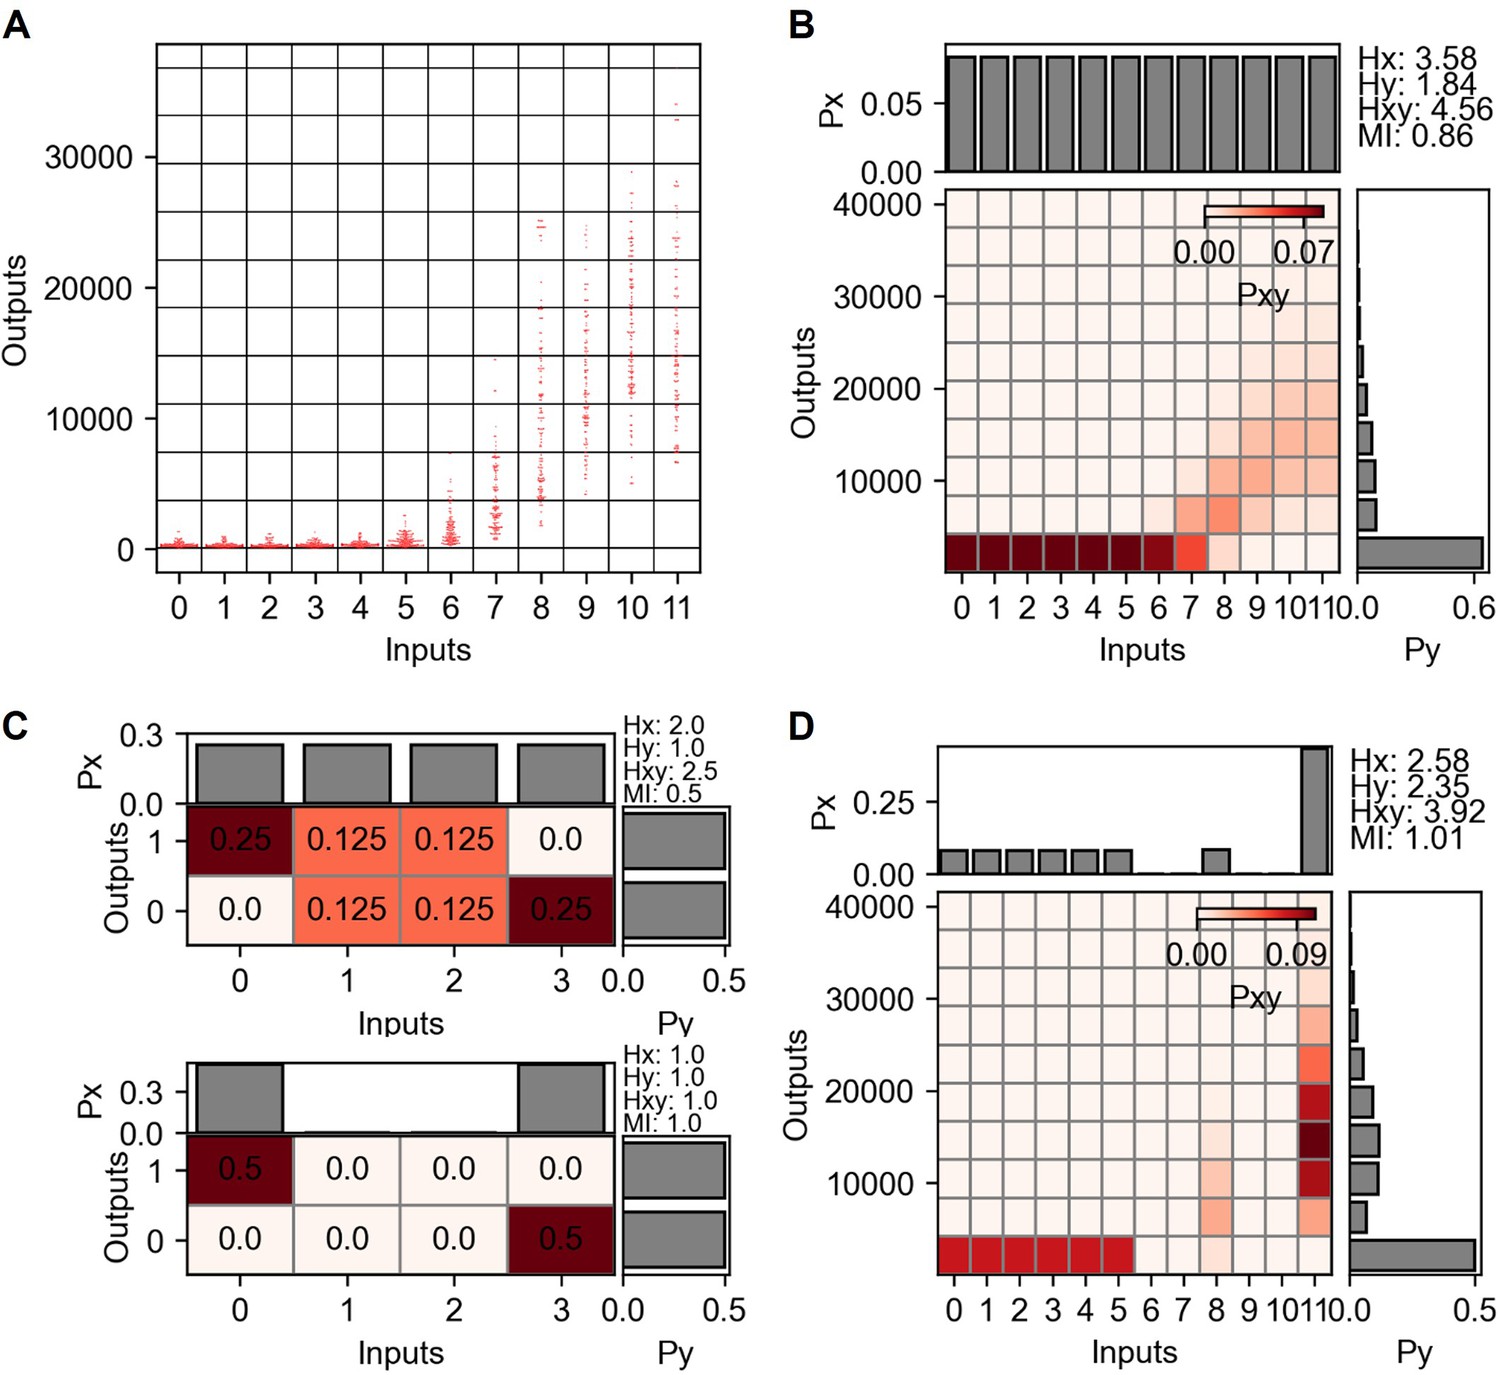
(A) Grid projection of input and output distribution from dectin-2 communication channel. Inputs are the concentrations and the outputs are the GFP expression level. (B) Probability space describing joint and marginal probability distribution of the input and output distribution shown in (A). (C) Simple joint probability distribution consists of four inputs and two outputs signifying the channel capacity variation depending on the presence of noisy inputs. (D) Joint probability distribution maximizing the mutual information.
Appendix 2—figure 3
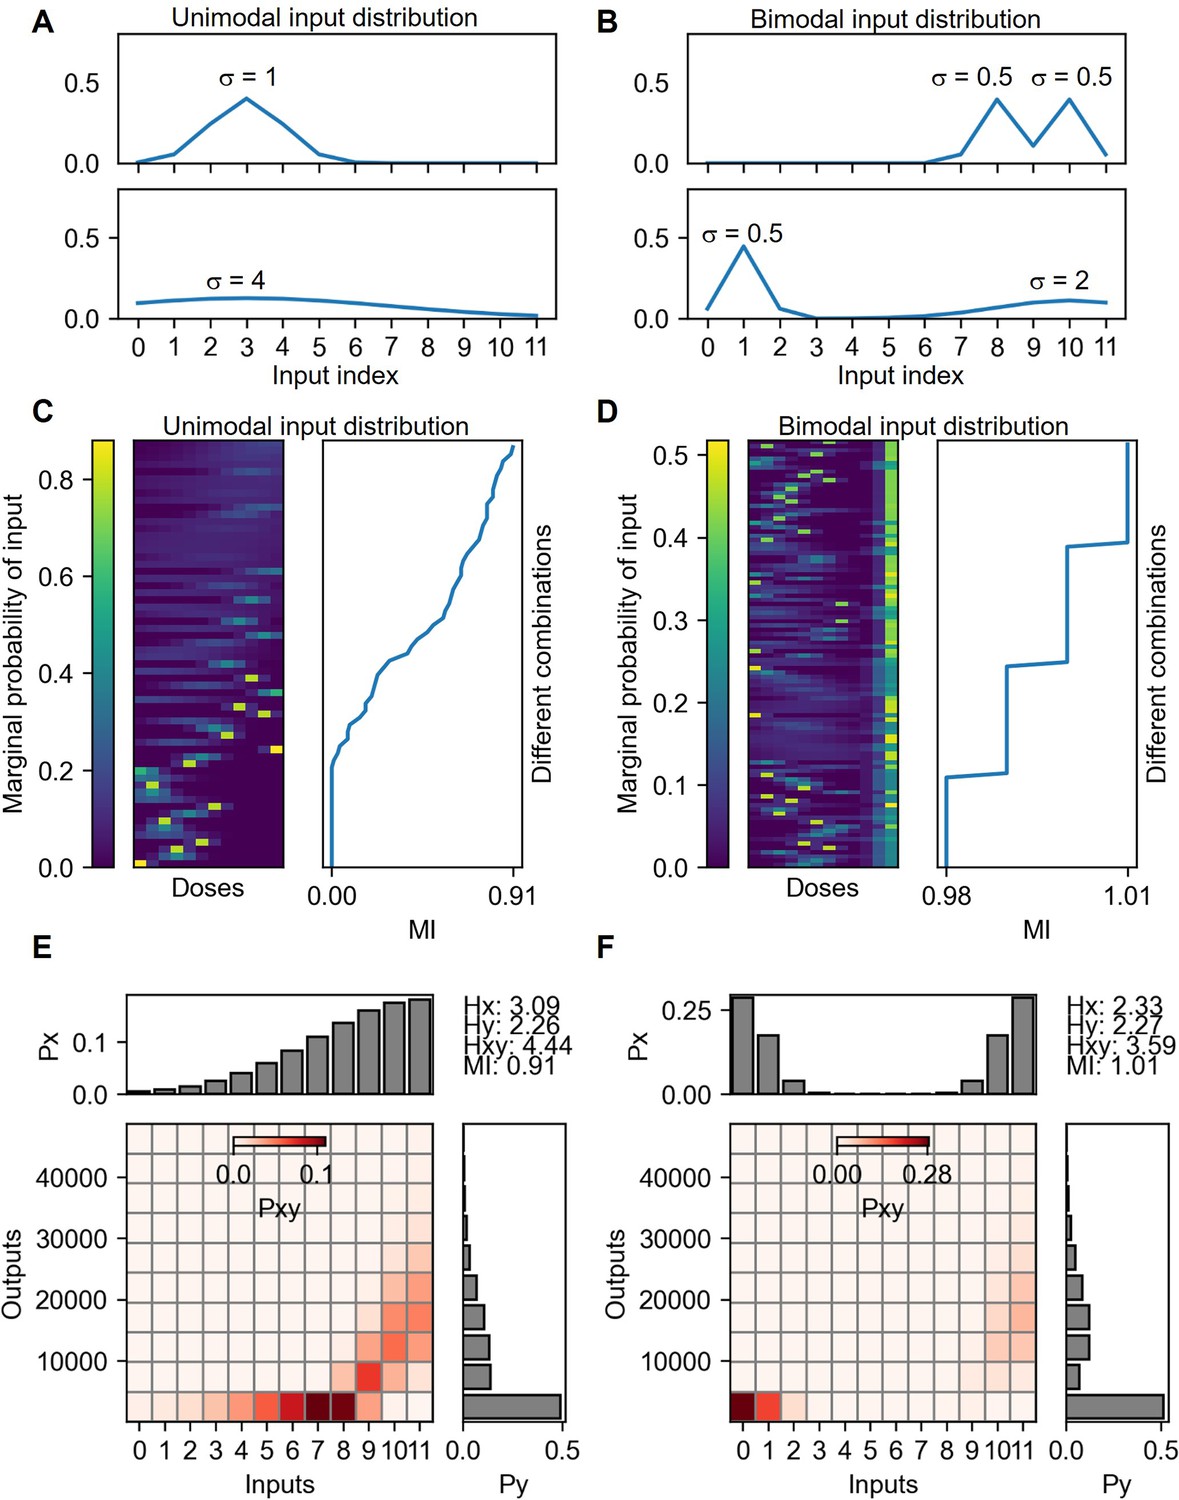
Mutual information calculation under unimodal and bimodal input distributions.
(A) Examples of unimodal input distributions. The parameter σ is the SD of the Gaussian function selected from 0.5, 1, 2, 4 and 8. There are 60 cases of input distributions. (B) Examples of bimodal input distribution containing the same σ parameters of the unimodal distributions. The number of bimodal combinations of the distribution is 1496. Vertically sorted various unimodal (C) and bimodal (D) input marginal probability distribution by the mutual information yields of the distribution. The probability space for the maximum mutual information given from unimodal (E) and bimodal (F) input distributions.
Appendix 2—figure 4
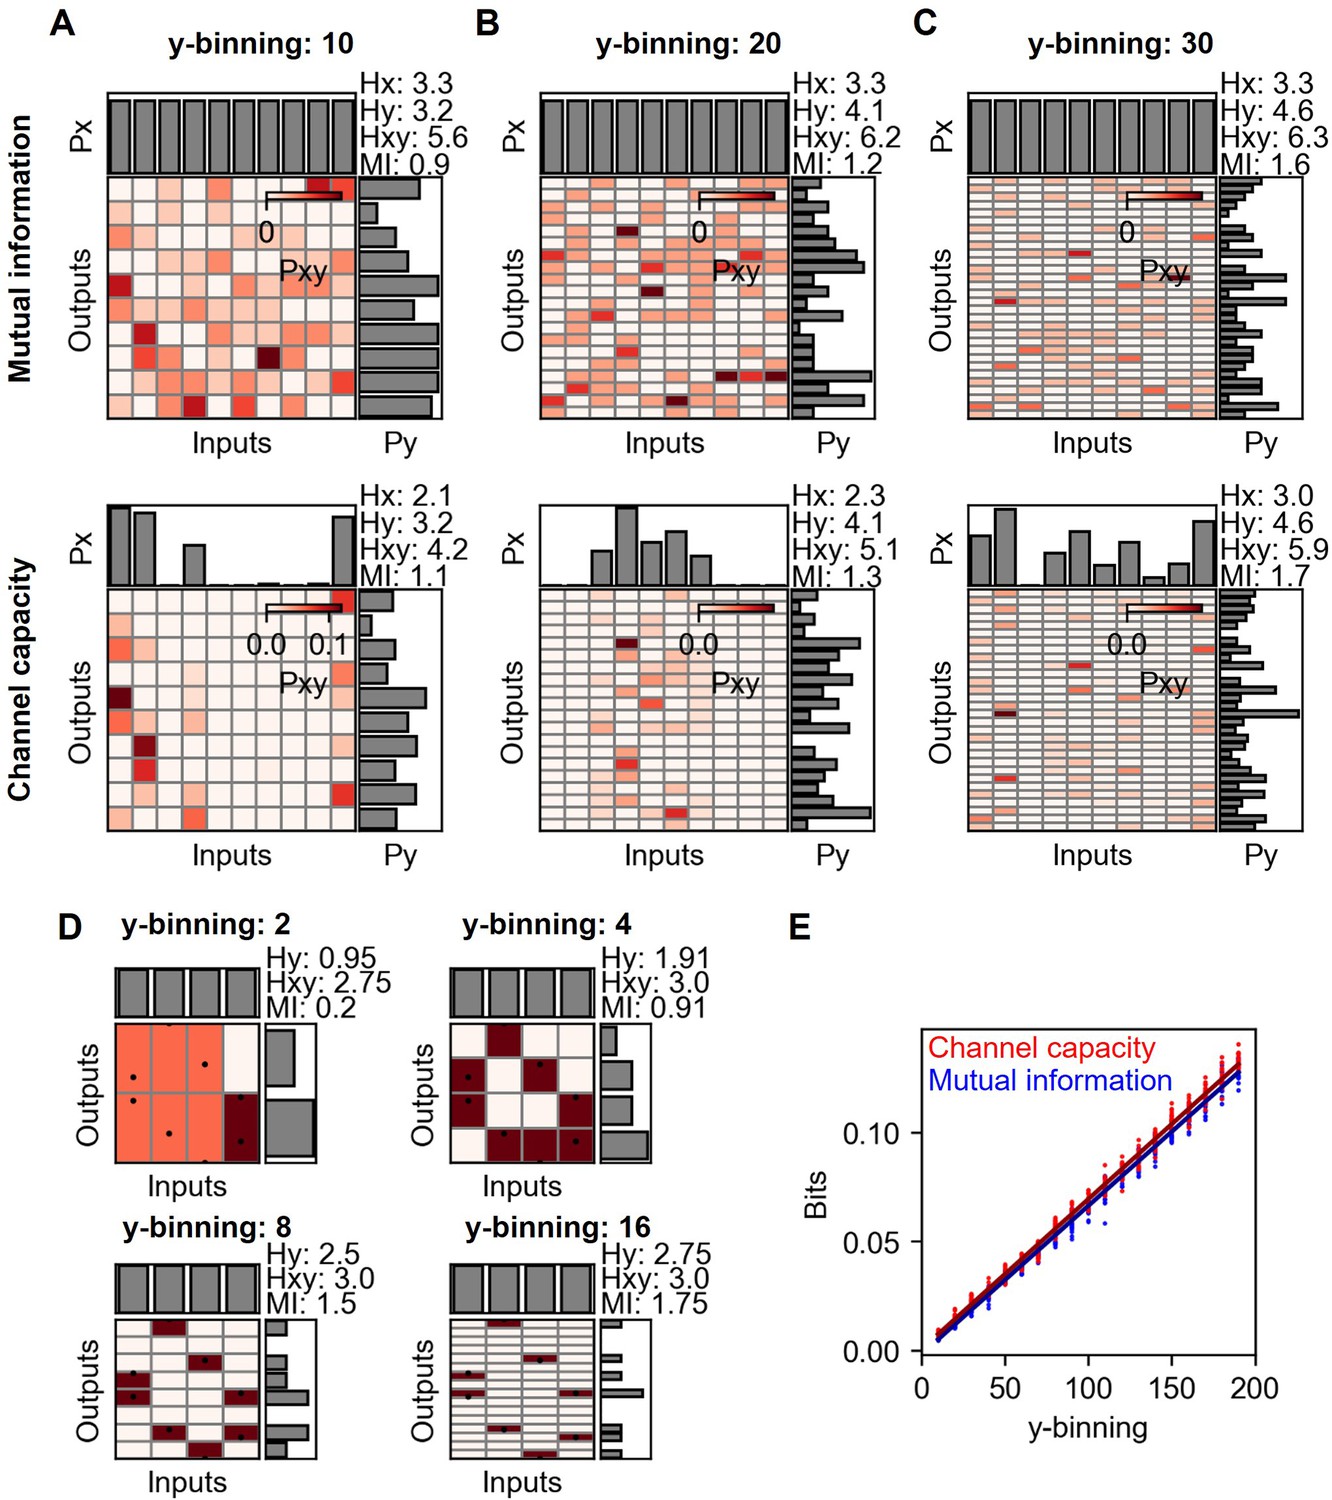
Mutual information and channel capacity variation depending on the number of output binning.
(A–C) Probability space of different output binning number of random distribution (upper) and the optimized probability distribution maximizing the mutual information of the given distribution (lower). The number of random data points in each input is 10, and thereby, the total is 100. (D) Probability space of the same input and output distribution in different output binning. (E) Output binning number dependence of mutual information and channel capacity values given total 10,000 random data points distributed equally on 10 input indexes. The lines represent the linear regression.
Appendix 2—figure 5
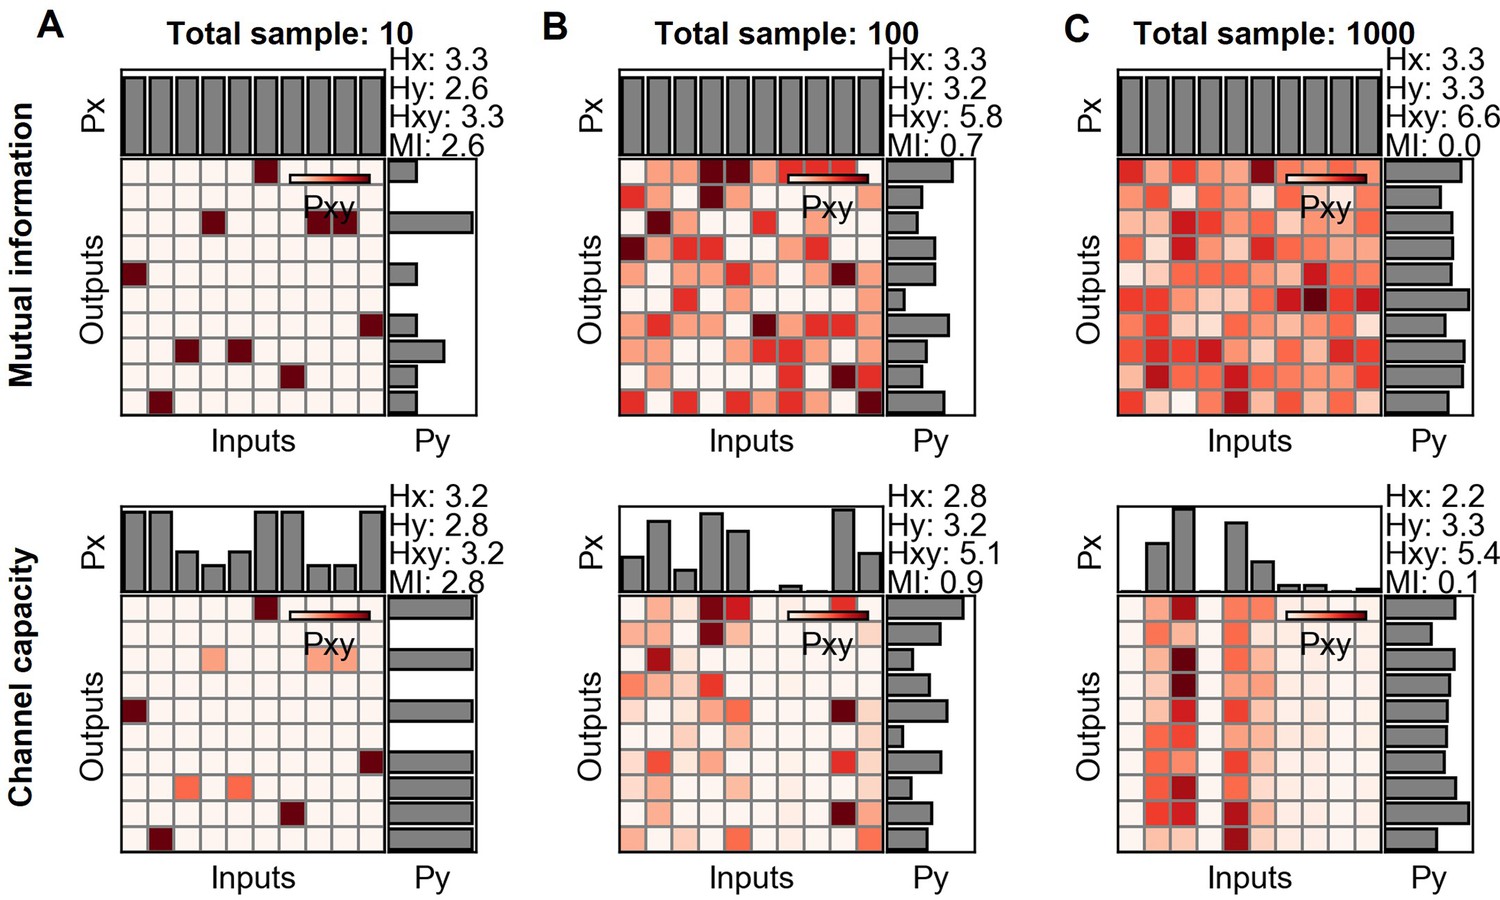
Mutual information and channel capacity variation depending on the sample size.
(A–C) Probability space of different sample sized random distribution (upper) and the optimized probability distribution maximizing the mutual information of the given distribution (lower).
Appendix 2—figure 6
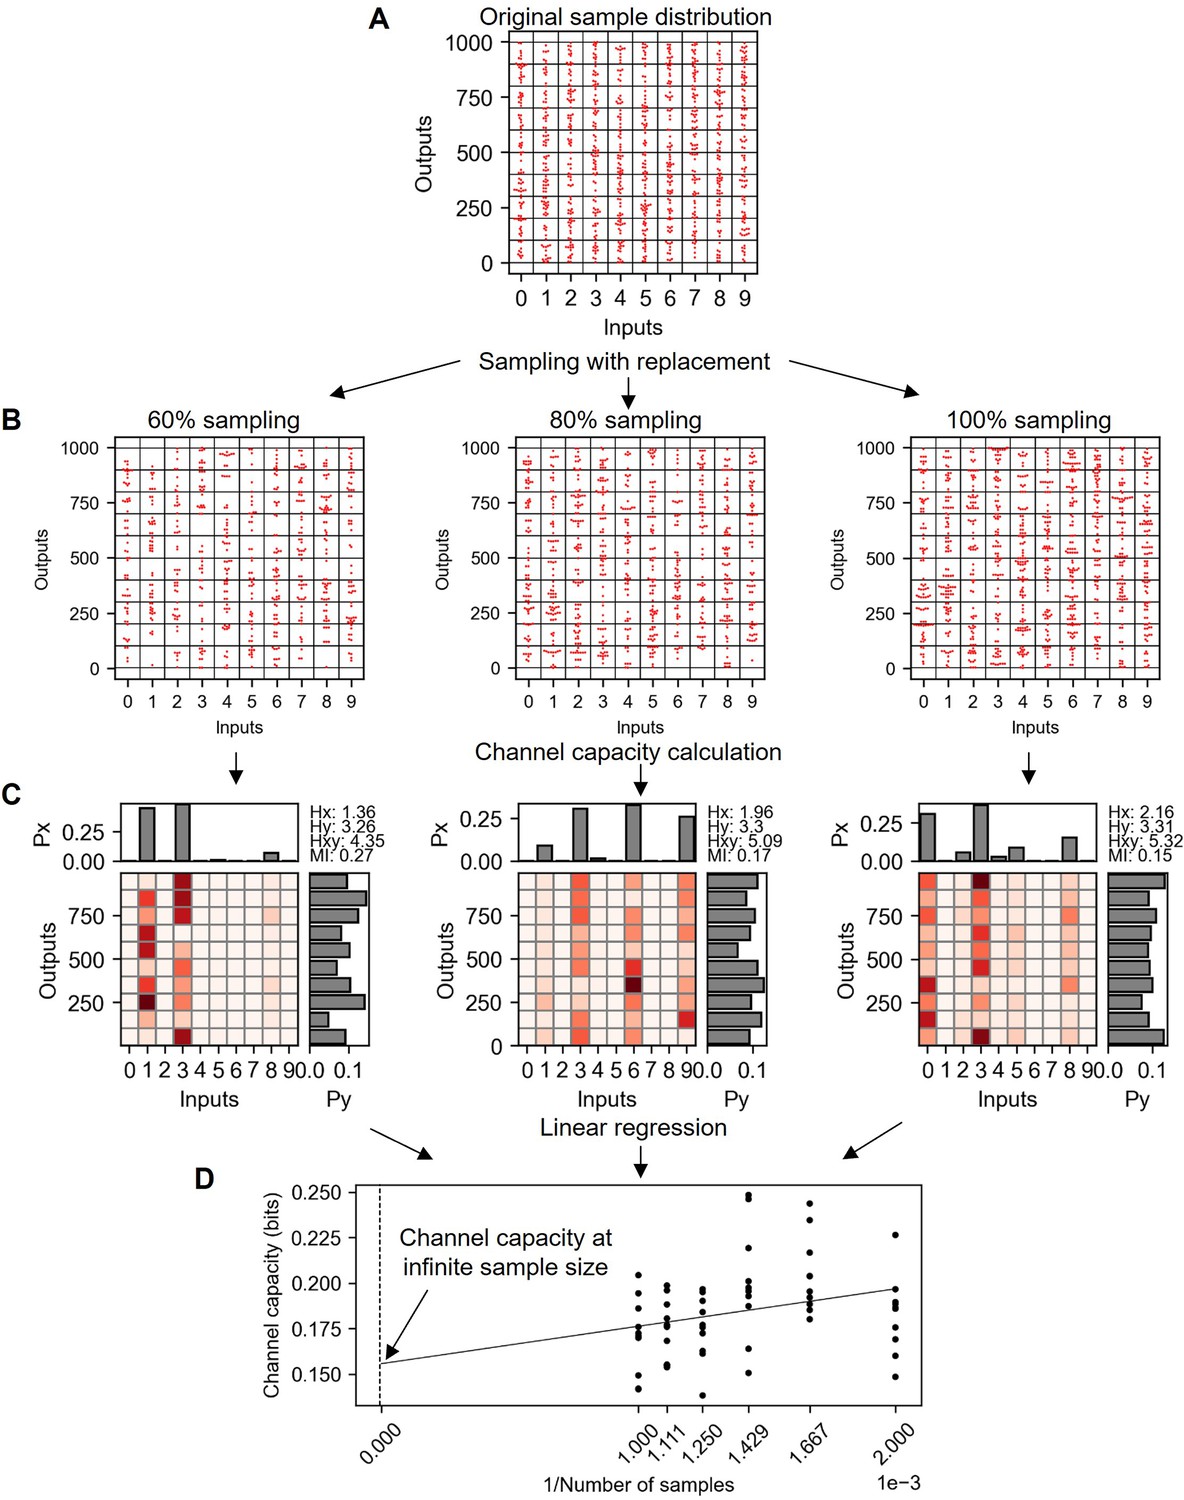
Explanation of bootstrapping procedure to estimate the channel capacity at infinite sample size.
(A) Original random distribution having 100 data points in each input and therefore 1000 data points for total. (B) Subsampled data from (A) with replacement in various subsampling percentage. (C) Probability spaces of (B) maximizing the mutual information (i.e. channel capacity). (D) Channel capacity values calculated in various subsampling percentages. Note that the x-axis is the inverse of subsampled sample number. Therefore, the range from 0.001 to 0.002 represents the 100–50% subsampling.
Appendix 2—figure 7
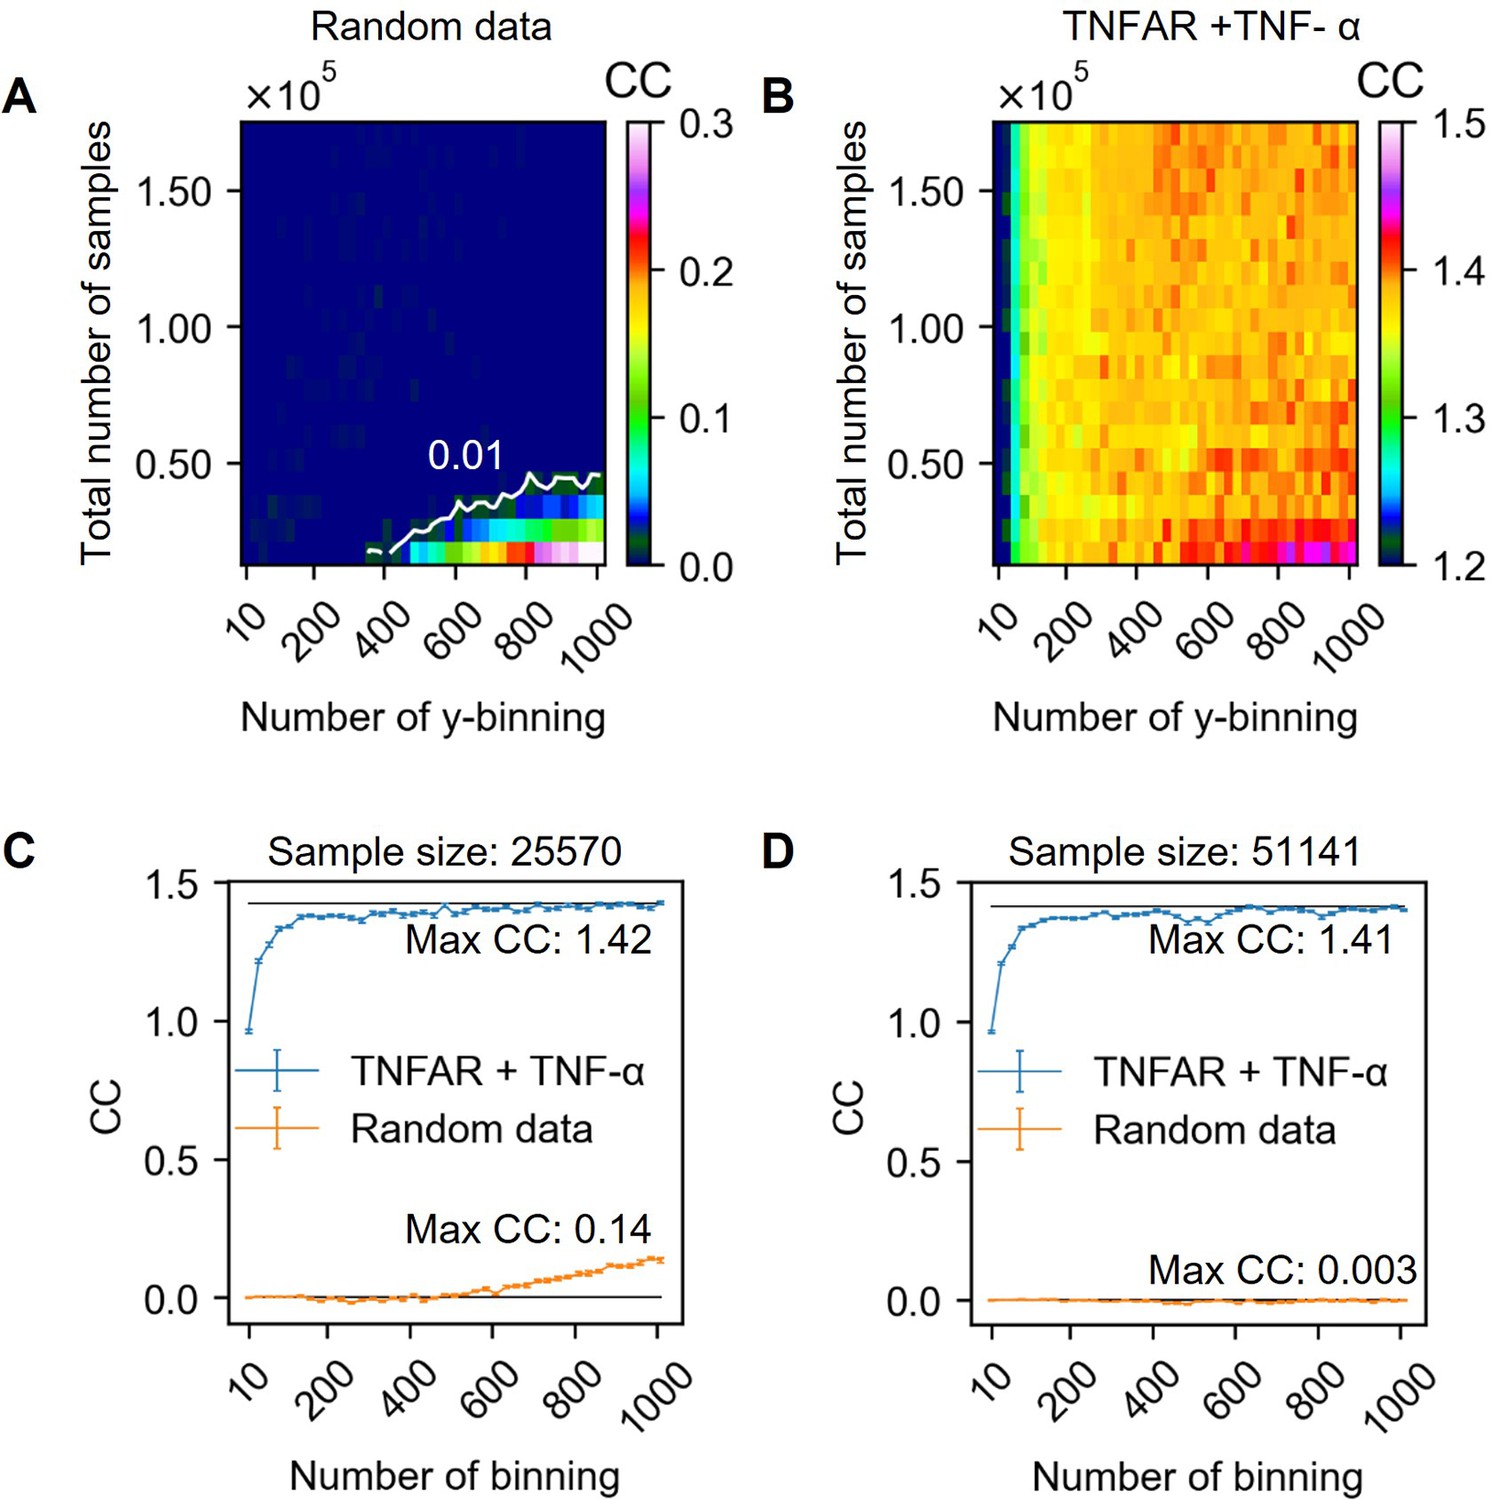
Channel capacity estimation in various output binning numbers and total sample numbers.
(A) Extrapolated channel capacity values of random dataset at infinitely subsampled distribution under various total number of samples and output binning. The white line in the heatmap represents the channel capacity value at 0.01 bits. (B) Extrapolated channel capacity values at infinite subsample size of the input (TNF-α doses) and output (GFP reporter) of the dataset. (C–D) Line graphs showing the channel capacities of random and experimental dataset.
Appendix 2—figure 8
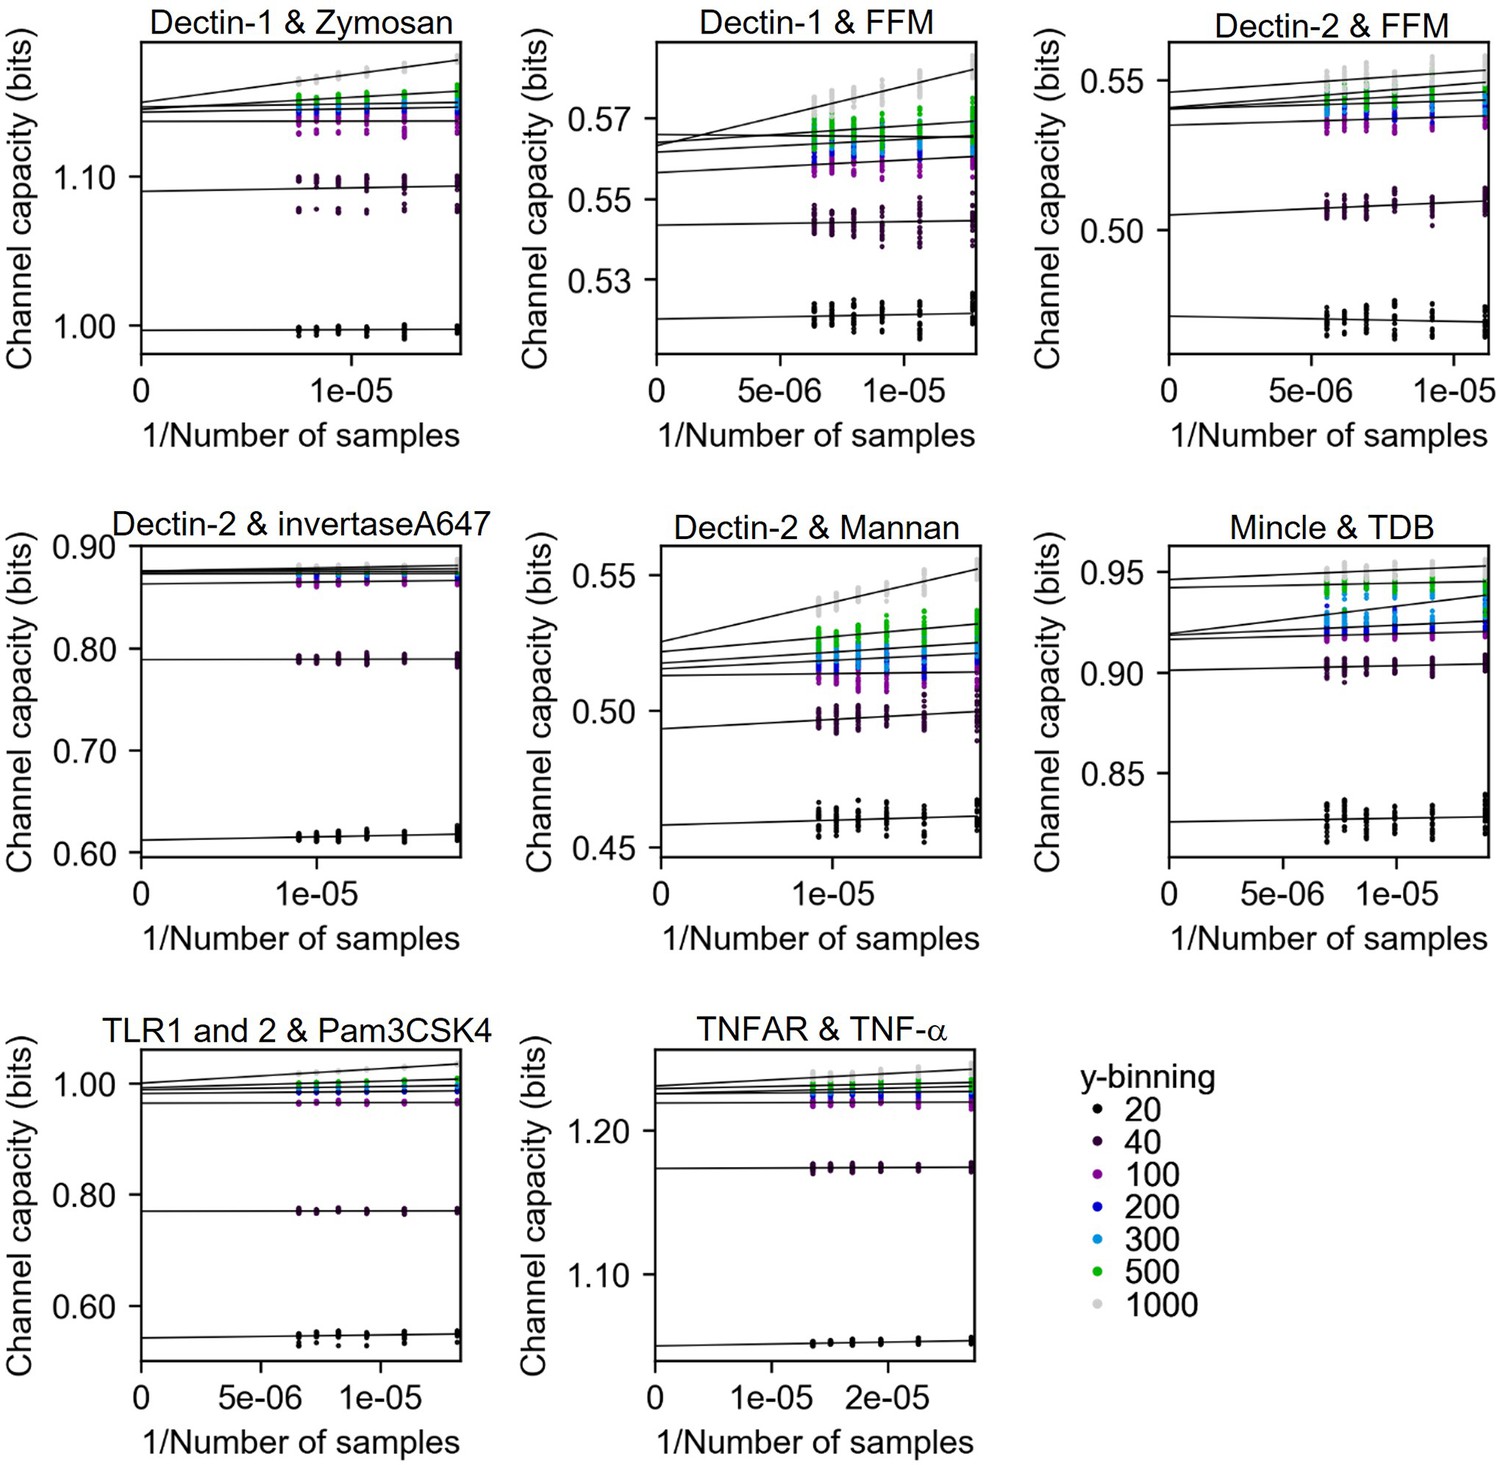
Channel capacity estimation of experimental data using bootstrapping in various y-binning number.
The y-intercept values of the regression line are the estimated channel capacity in the given y-binning number. The number of subsampled data points in each inverse sample side is 30.
Appendix 3—figure 1
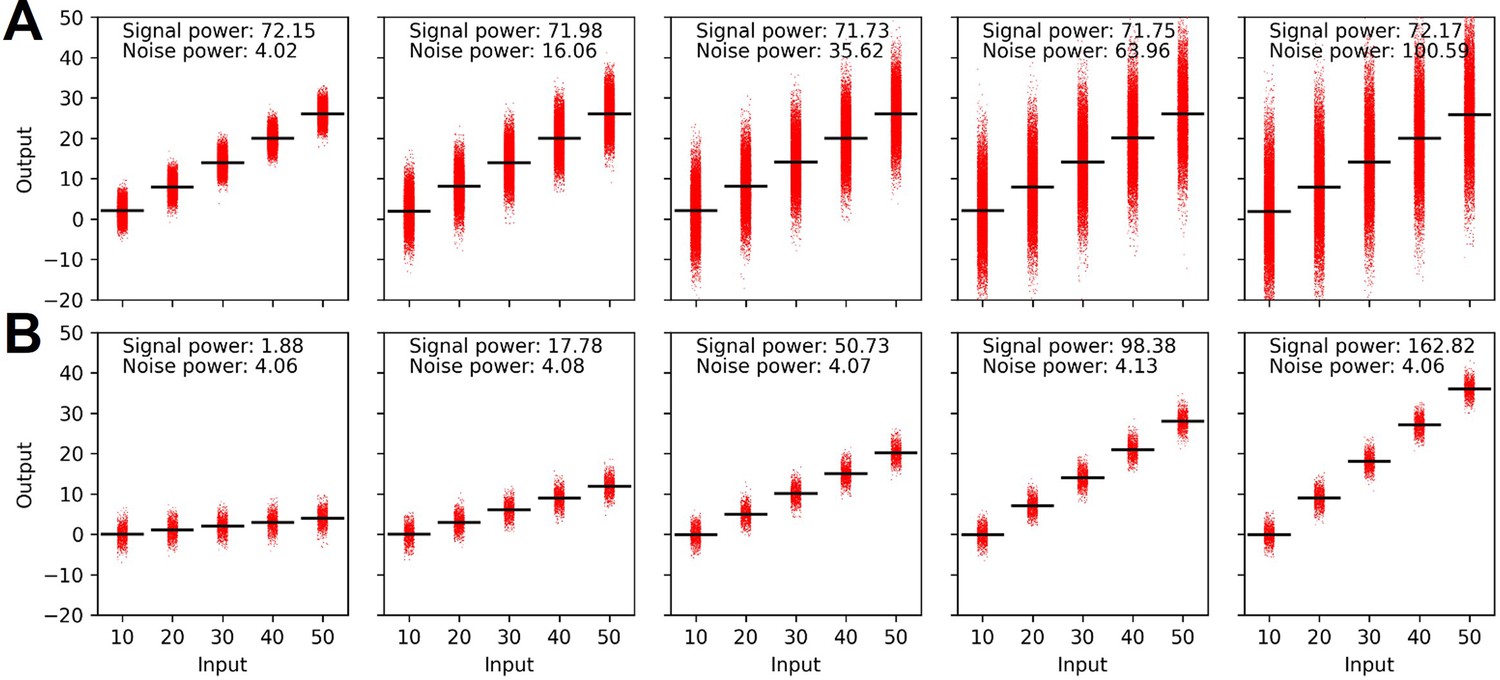
Signal and noise power calculated under the constraint of mean (A) and variance (B) of the output distribution.
Author response image 1
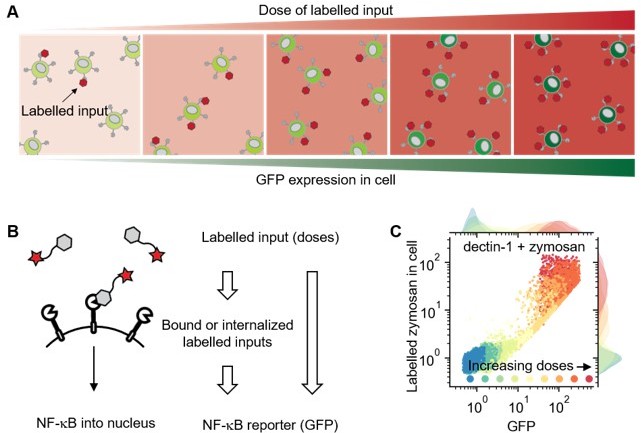
Using labelled input adds measurable intermediate layer between ligand dose and GFP expression that can be directly related to ligand-receptor bindings.
(A) Illustration showing response of cell in different doses of labelled inputs. (B) Illustration showing information transmittance from labelled input doses to ligand-receptor binding and from ligand-receptor binding to NF-κB translocation (left). And schematics representing measurable information including receptor-bound labelled input of cells (right). (C) Response of dectin-1 expressing U937 cells on labelled zymosan in different doses.
Author response image 2
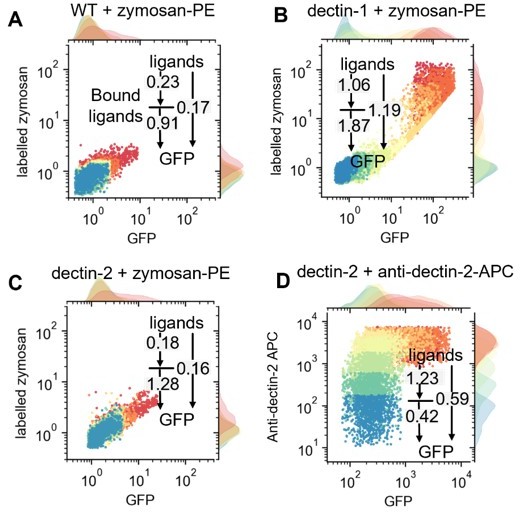
Single cell resolved scattered plot showing distribution of GFP expression and bound-labelled input on WT (A), dectin- (B)1, and dectin-2 (C) cells with various concentrations of labelled-zymosan or dectin-2 antibodies (D).
Author response image 3
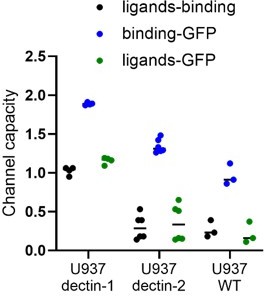
Channel capacity values in the presence of labelled input information.
Author response image 4
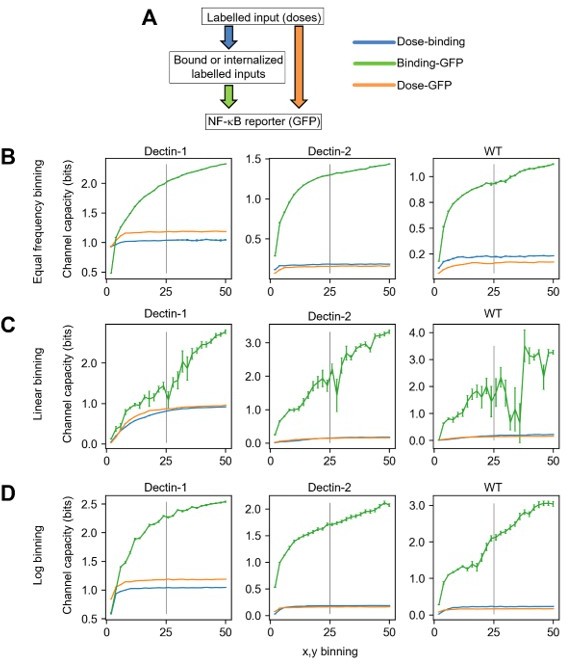
Channel capacity calculation including labelled zymosan information.
A) Schematic diagram representing both the layers where the corresponding information is measured (rectangular box) and the transmissions of information between layers (colored allows). B-D) Channel capacity values calculated from varied binning number and binning method for dectin-1, dectin-2 and WT U937 cells. The information of individual colors in the plot is given in A). The error bars in the plots represent the 95% confidence interval of the channel capacity value.
Author response image 5
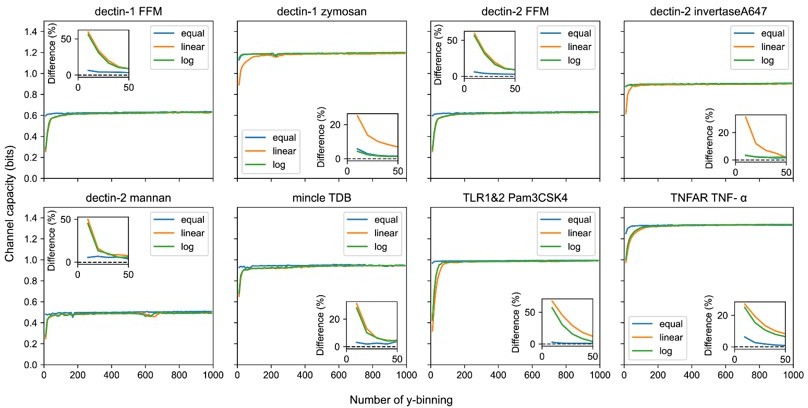
Output binning number and binning method dependence of channel capacity value for experimental dataset.
The inset plots show the relative difference of channel capacity value to the maximum channel capacity value in the entire binning range (i.e., from 10 to 1000) of the corresponding binning method.
Author response image 6
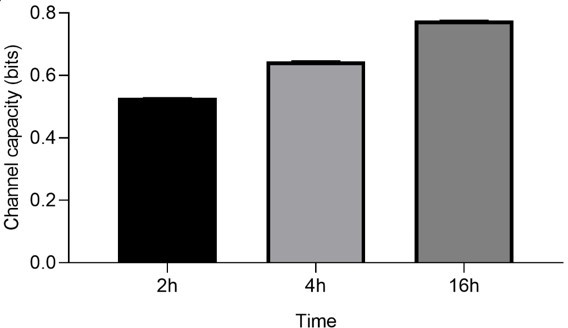
Channel capacity of TNFαR channel to TNF-α stimulant for various stimulation time.
Error bars indicate 95 % confidence interval.
Additional files
-
Supplementary file 1
List of antibodies.
- https://cdn.elifesciences.org/articles/69415/elife-69415-supp1-v3.docx
-
Supplementary file 2
List of primers.
- https://cdn.elifesciences.org/articles/69415/elife-69415-supp2-v3.docx
-
Transparent reporting form
- https://cdn.elifesciences.org/articles/69415/elife-69415-transrepform1-v3.pdf
Download links
A two-part list of links to download the article, or parts of the article, in various formats.
Downloads (link to download the article as PDF)
Open citations (links to open the citations from this article in various online reference manager services)
Cite this article (links to download the citations from this article in formats compatible with various reference manager tools)
Information transfer in mammalian glycan-based communication
eLife 12:e69415.
https://doi.org/10.7554/eLife.69415


