In vivo analysis reveals that ATP-hydrolysis couples remodeling to SWI/SNF release from chromatin
- Department of Biochemistry, Netherlands
- Proteomics Center, Erasmus University Medical Center, Netherlands
Figures
Figure 1 with 1 supplement
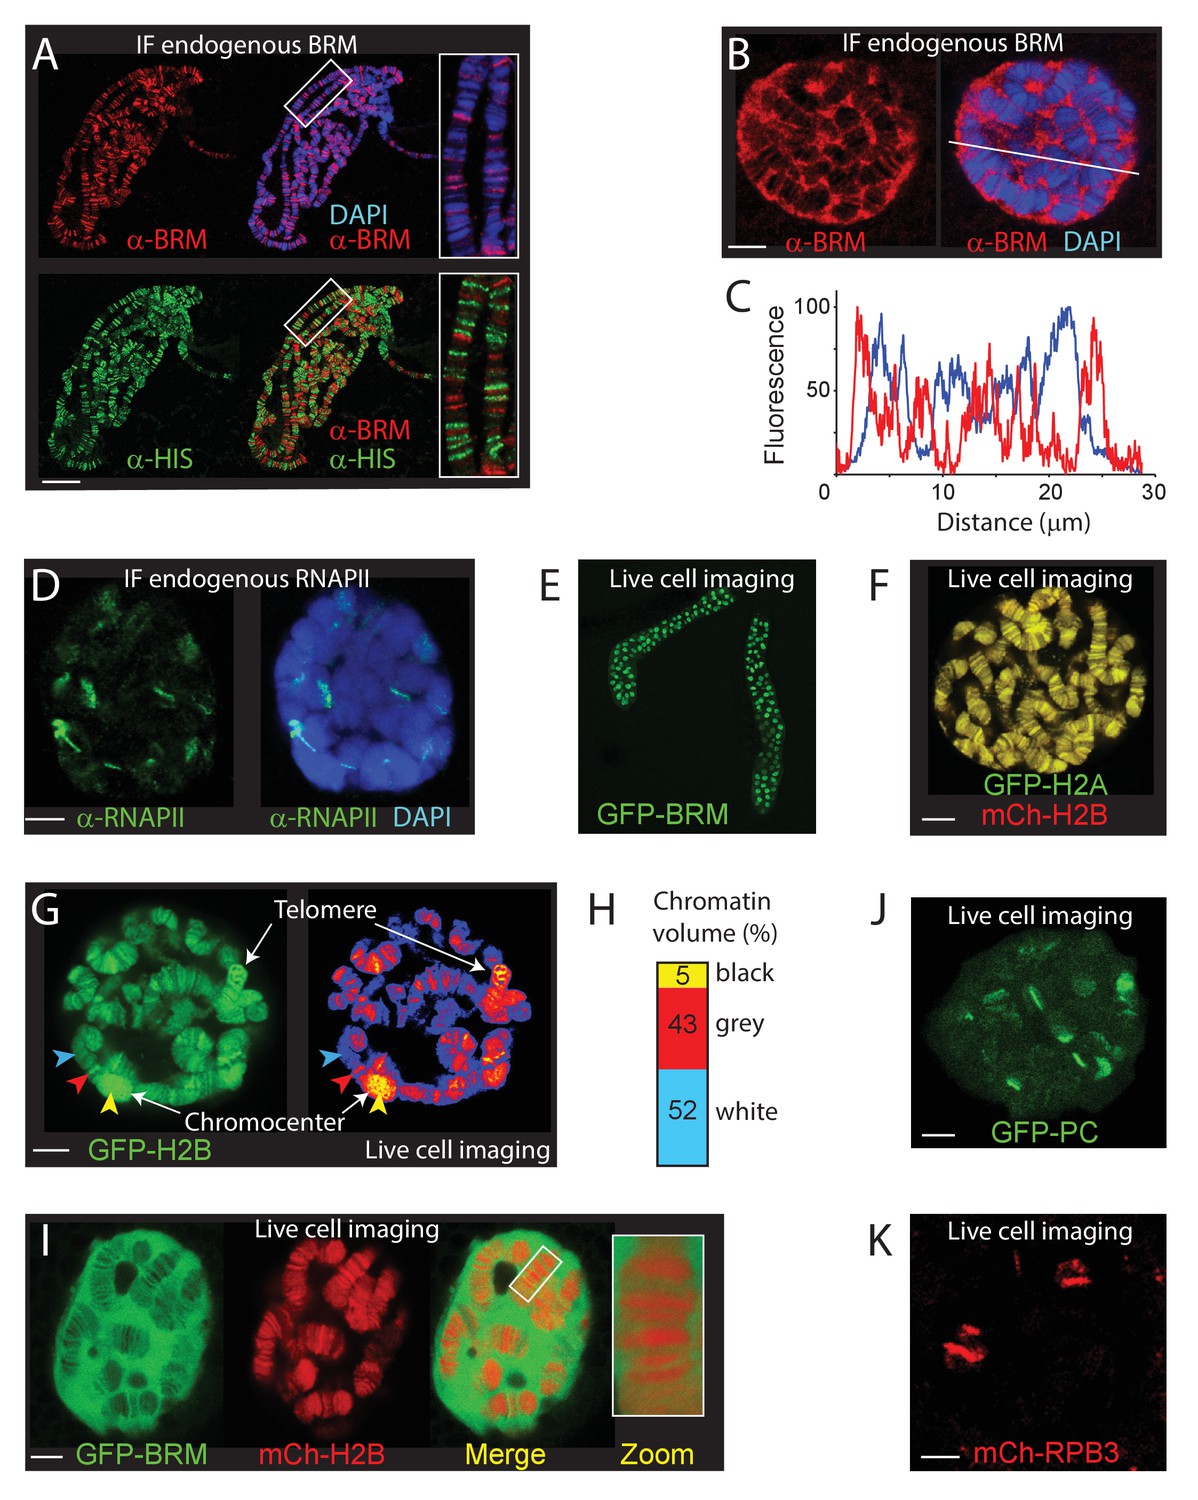
The chromosomal and nuclear distribution of BRM in larval salivary gland polytene nuclei.
(A) Distribution of endogenous BRM on a polytene chromosome spread determined by indirect IF using antibodies against BRM (red) and core histones (HIS, green). DNA was visualized by DAPI staining (blue). Scale bar represents 20 μm. (B) Confocal IF image of whole mount intact polytene nucleus from a formaldehyde-fixed salivary gland using antibodies against BRM (red) and DAPI (blue). White line indicates the line scan used for the fluorescence intensity plot shown in panel C. Scale bar represents 5 μm. (C) Fluorescence intensity plot of BRM (red) and DNA (blue) across an intact polytene nucleus. Position of the line scan (from left to right) is indicated in (B). Fluorescence intensity is expressed as percentage of the highest pixel intensity of the entire image. Images in panel A-C are representative for polytene nuclei in salivary glands obtained from multiple larvae. (D) IF confocal section of whole mount intact polytene nucleus from a formaldehyde-fixed salivary gland using antibodies against RNAPII subunit RPB1 (red) and DAPI (blue). Scale bar represents 5 μm. (E) Image of an isolated, cultured 3rd instar larval salivary gland expressing GFP-BRM. (F) Confocal image of GFP-H2A and mCh-H2B in a cultured salivary gland reveals strong co-localization and recapitulates the polytene banding pattern. Scale bar represents 5 μm. (G) Confocal section of a GFP-H2B expressing polytene nucleus. The right panel provides a confocal false color image heat map of GFP fluorescence. Arrowheads indicate examples of white- (blue arrowhead), gray- (red arrowhead), or black- (yellow arrowhead) chromatin. The heterochromatic chromocenter and a telomeric region are indicated. Scale bar represents 5 μm. (H) The intensity of GFP-H2B was measured across 10 nuclei, nine confocal slices per nucleus. For raw data see Figure 1—source data 1. Next, GFP-H2B intensities were binned in three classes, corresponding to white, gray, and black chromatin, using thresholds obtained from the fluorescence intensity curves shown in Figure 1—figure supplement 1B. The resulting chromosome volumes of white, gray, and black chromatin are presented as a bar graph. (I) Confocal section of a polytene nucleus expressing GFP-BRM and mCh-H2B. (J) Confocal image of GFP-PC and (K) mCh-RPB3. Images in panels I-J are representative for polytene nuclei in salivary glands obtained from multiple independent crosses. Scale bars represents 5 μm.
-
Figure 1—source data 1
GFP-H2B intensity across nuclei.
- https://cdn.elifesciences.org/articles/69424/elife-69424-fig1-data1-v2.xlsx
Figure 1—figure supplement 1
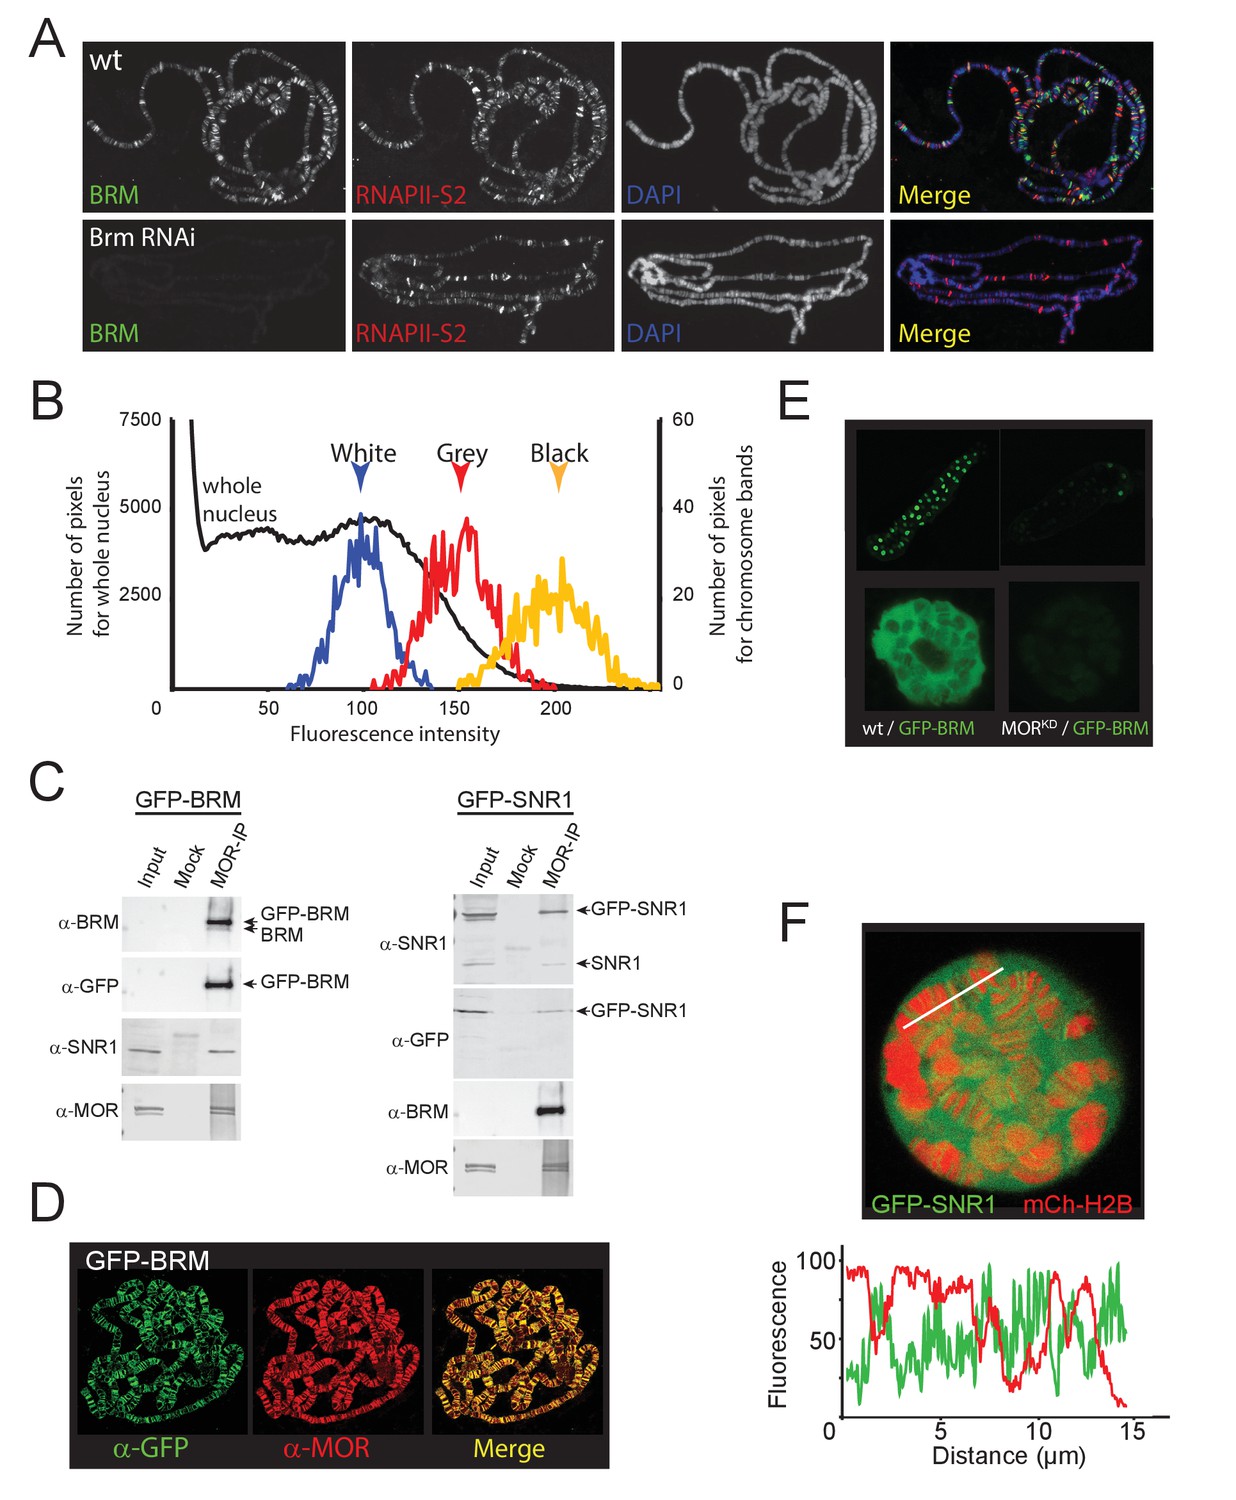
Expression, incorporation in (P)BAP and localization of GFP-BRM and GFP-SNR1 in 3rd instar salivary gland polytene nuclei.
(A) RNAi-mediated depletion of BRM does not affect global association of elongating RNAPII with polytene chromosomes nor does it affect chromatin condensation as reflected by the polytene banding pattern. Distribution of endogenous BRM on a polytene chromosome spread was determined by indirect IF using antibodies against BRM (green) and RNAPII phosphorylated at S2 (RNAPII-S2; red). DNA was visualized by DAPI staining (blue). (B) Pixel fluorescence intensity distribution of the whole nucleus (black, left axis) and of chromosomal regions identified as ‘white’ (blue), ‘Gray’ (red), and ‘black’ (yellow) chromatin (right axis). For raw data see Figure 1—source data 1. (C) Western blots of mock and anti-MOR IP’s of nuclear extracts from GFP-BRM and GFP-SNR1 expressing salivary glands probed with antibodies against BRM, GFP, SNR1, and MOR. For original blots see Figure 1—figure supplement 1—source data 1. (D) Polytene chromosome spreads from GFP-BRM expressing polytene nuclei probed with antibodies against GFP and MOR. (E) Confocal images of a salivary gland and a single polytene nucleus from GFP-BRM or MORkd/GFP-BRM expressing flies. (F) Confocal image from a GFP-BRM/mCh-H2B expressing polytene nucleus. White line indicates the line scan used for the fluorescence intensity plot shown below. GFP-BRM (green) and mCh-H2B (red) across an intact polytene nucleus. Fluorescence intensity is expressed as percentage of the highest pixel intensity of the entire image.
-
Figure 1—figure supplement 1—source data 1
Original blots.
- https://cdn.elifesciences.org/articles/69424/elife-69424-fig1-figsupp1-data1-v2.pdf
Figure 2

PBAP but not BAP is required for Ec-induction of the E74 and E75 loci.
(A) Endogenous BRM and EcR binding to the E74 and E75 loci on 3rd instar larval polytene chromosomes before (-) and after activation by Ec, determined by indirect IF using antibodies against BRM (green) and EcR (red). DNA was visualized by DAPI staining (blue). The E74 and E75 loci are indicated. (B) IF of endogenous RNAPII recruitment using an antibody against RNAPII phosphorylated at Ser2 (RNAPII-S2). (C) Schematic representation of Drosophila BAP and PBAP. (D) Although both were present prior to induction, only PBAP but not BAP accumulates on the puffed E74 and E75 loci after activation by Ec. IF of endogenous OSA (red) or PBRM (green) before (-) and after addition of Ec. (E) IF of PBRM (red) and EcR (green) on the puffed E74 and E75 loci. (F) PBAP mutant larvae mis-express E74 and E75 transcripts. Wt and homozygous Bap170kim1; Pbrm33.2 mutant prepupae were isolated at 2 hr intervals from pupariation (t=0) for 12 hr. RNA was extracted, and relative expression levels of E74 and E75 transcripts were determined by (RT)-qPCR. Shown are the results for primers corresponding to exons shared by distinct transcripts from E74 and E75, respectively. Biological triplicates were used. Variance per time point was below 10%. (G) PBAP is required for the induction of E74 and E75 expression by Ec in S2 cells. RT-qPCR analysis of E74 and E75 expression in S2 cell in the absence (yellow) or presence of Ec (blue). Cells were treated with dsRNA directed against GFP (mock), MOR, OSA, BAP170, or PBRM. The relative level of expression in mock-treated cells in the absence of Ec was set at 1.
Figure 3
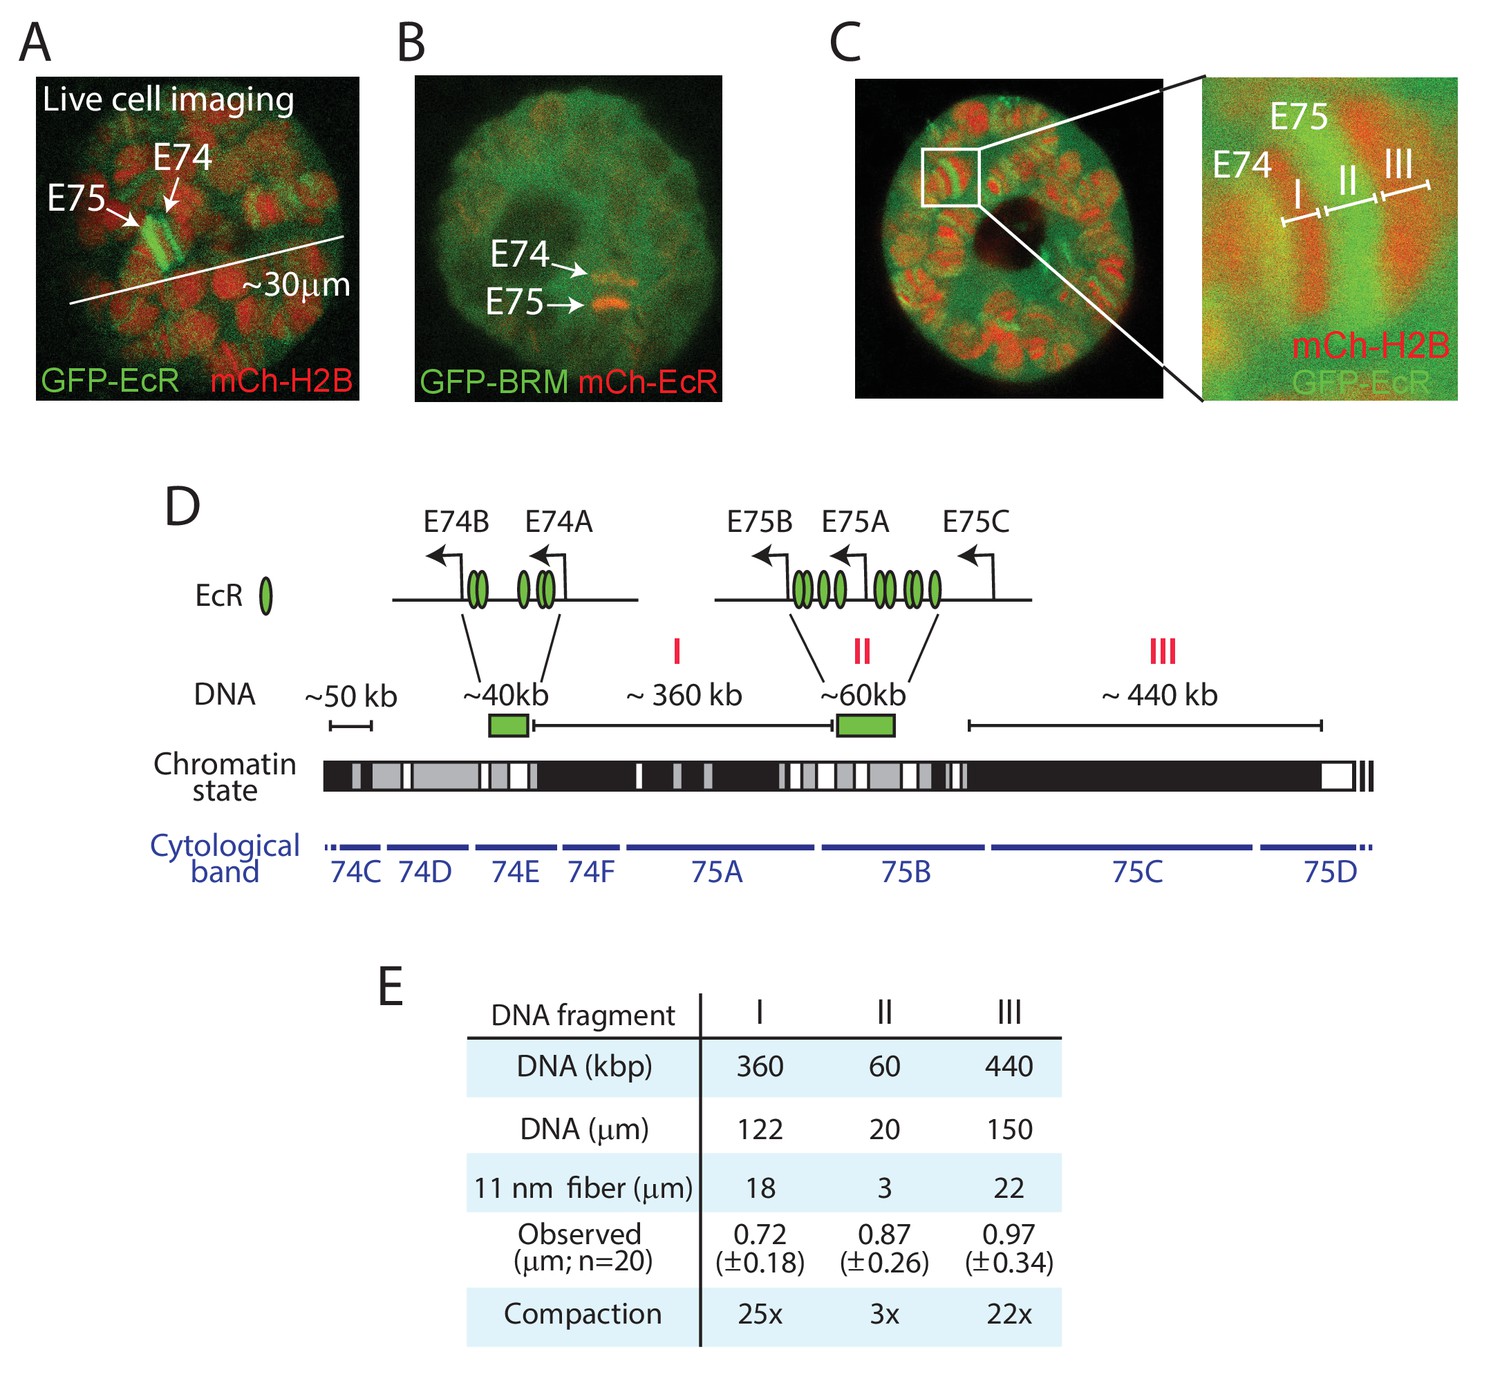
Live imaging reveals local chromatin condensation at the E74 and E75 loci.
(A) Confocal image of a polytene nucleus expressing GFP-EcR and mCh-H2B. E74 and E75 are indicated. (B) Confocal image of a nucleus expressing GFP-BRM and mCh-EcR. (C) Confocal image and zoom of the E74 and E75 loci in a nucleus expressing GFP-EcR and mCh-H2B. The GFP-EcR-marked E75 puff (fragment II) flanked by two heterochromatic bands (Fragments I and III) are indicated. (D) Chromosomal map of the E74 and E75 loci. The EcR binding sites (Bernardo et al., 2014) are indicated. The simplified local chromatin state (white, gray, or black) was derived from combining available maps of histone marks (Filion et al., 2010; Kharchenko et al., 2011). The GFP-EcR-marked E75 puff (fragment II) and flanking heterochromatic bands (fragments I and III) are indicated with red roman numerals. (E) Comparison between observed chromosomal physical distances in living cells and genomic DNA length. In vivo apparent lengths of fragments I, II and III (see panels C and D) were determined in 20 different nuclei in cultured salivary glands. The degree of in vivo compaction was derived by comparing observed fragment length to the calculated length of the corresponding DNA packaged into an extended 11 nm nucleosomal fiber (packing ratio of 6.8:1).
Figure 4
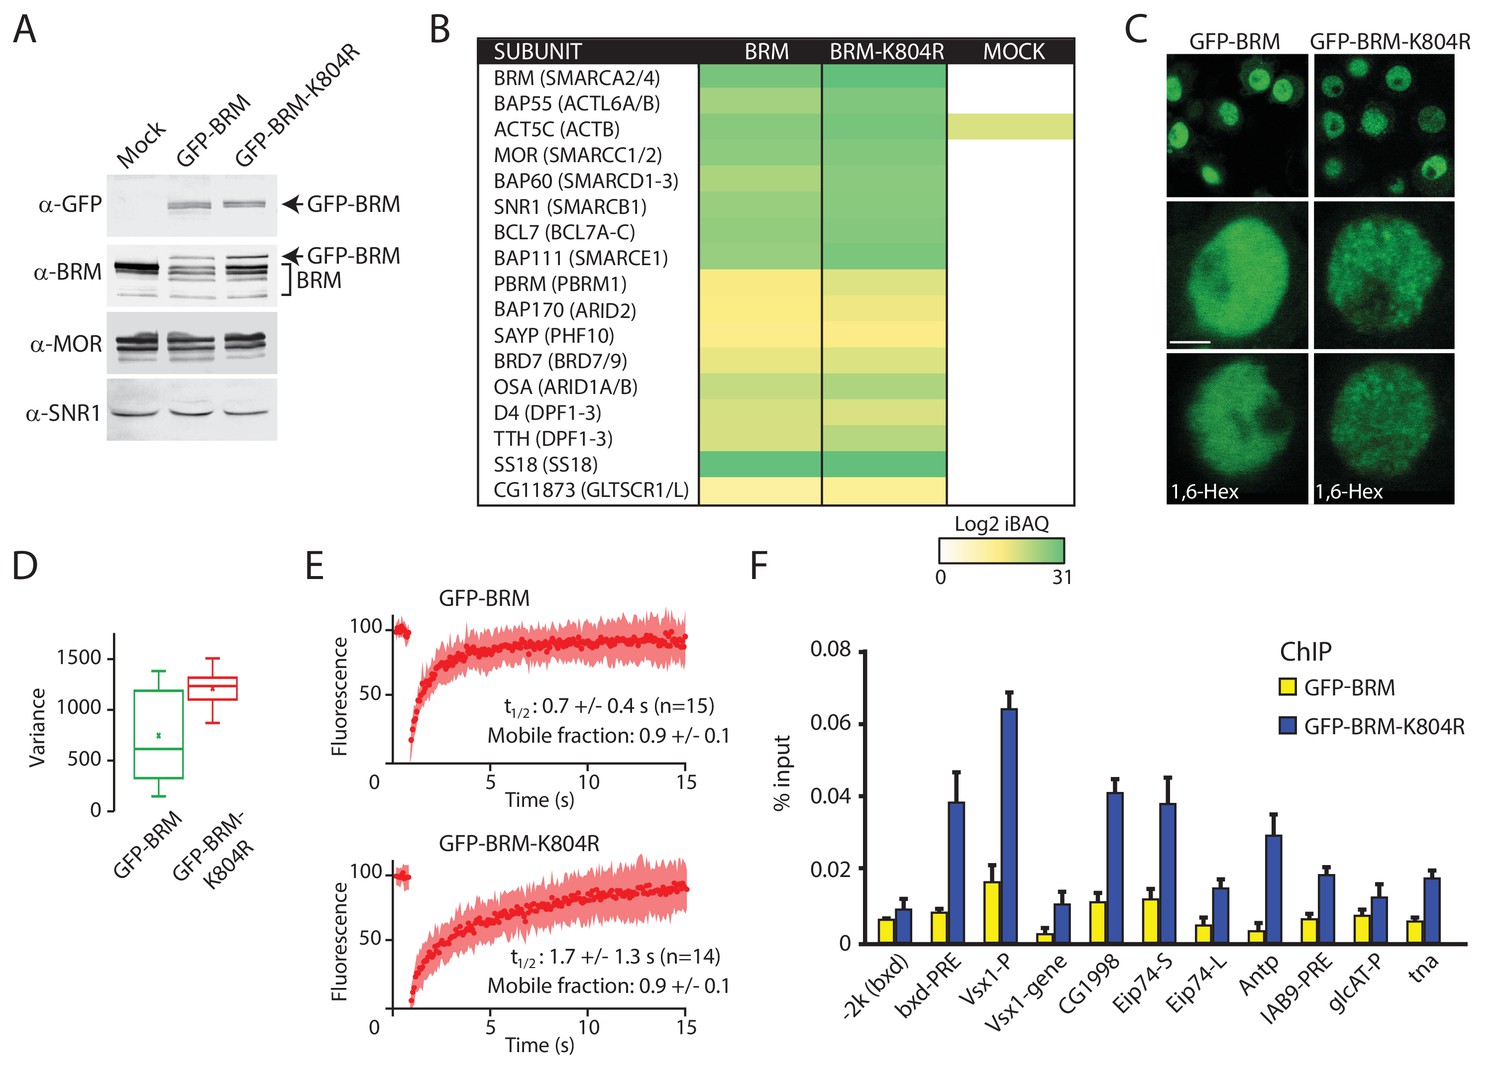
Enhanced clustering and chromatin retention of a BRM ATP-binding mutant in S2 cells.
(A) Western blot analysis of extracts from Drosophila S2 cells that were either transfected with empty vector or with a vector expressing GFP-BRM or GFP-BRM-K804R. Blots were probed with the indicated antibodies. For original blots see Figure 4—source data 1. (B) Mass spectrometric analysis of GFP-BRM-associated proteins immunopurified using antibodies directed against GFP. Drosophila (P)BAP subunits and their human orthologs (in brackets) are indicated. The color gradient reflects the Log2 iBAQ scores. In addition to all BAP and PBAP subunits (Bracken et al., 2019), we also detected the Drosophila homolog of human GLTSCR1. Note that fly BRD7 is homologous to both human BRD7 and BRD9. (C) Confocal images of GFP-BRM or GFP-BRM-K804R expressing S2 cells. Bottom panels have been treated with 1,6-Hex at a final concentration of 5% for 1 min. Scale bar represents 1 μm. (D) Box and Whisker plots of the mean variance of the nuclei after applying a variance filter (ImageJ, 2-pixel radius) to the GFP fluorescence images of GFP-BRM and GFP-BRM-K804. Mean +/- SD; 880 +/- 432 (n=29) for GFP-BRM and 1351 +/- 171 (n=32) for GFP-BRM-K804R, p-value: 2.7 x 10⁻⁶ (Student T test). Units variance: pixel intensity2. (E) FRAP of GFP-BRM and GFP-BRM-K804R after bleaching a 16-pixel wide strip across the nucleus. Curves represent the average +/- SD of 15 (GFP-BRM) or 14 (GFP-BRM-K804R) independent experiments. (F) ChIP-qPCR analysis of GFP-BRM (yellow) or GFP-BRM-K804R (blue) binding to a subset of functional (P)BAP target loci (Moshkin et al., 2012). The −2 k (bxd) sequence is a negative control.
-
Figure 4—source data 1
Original blots.
- https://cdn.elifesciences.org/articles/69424/elife-69424-fig4-data1-v2.pdf
Figure 5 with 1 supplement

BRM interacts transiently with chromatin.
(A) Confocal images of GFP-BRM expressing salivary gland nuclei before or 0, 15 or 60 s after photo-bleaching the upper half of the nucleus. (B) Corresponding average FLIP-FRAP curves of GFP-BRM (n=6; SD bleached curve < 2%; unbleached curve < 1%). (C) Confocal images of mCh-H2B expressing salivary gland nuclei before or 180 s after photo-bleaching the upper half of the nucleus. (D) Corresponding average FLIP-FRAP curves of mCh-H2B (n=9; SD bleached curve < 1%; unbleached curve < 3%). (E) Representative confocal image of a chromosomal band of GFP-BRM analyzed by FRAP. Rectangle indicates bleached area. (F) Averaged FRAP curves of chromosomal GFP-BRM. Data are expressed as mean ± SD for 17 nuclei. Half maximal recovery time (t½) and size of the mobile fraction were determined as described in the Materials and methods section. (G) Chromosomal band FRAPs of the (P)BAP subunits GFP-BRM (red) and GFP-SNR1 (green), RNAPII subunit mCh-RPB3 (blue) and GFP-H2B (yellow). Traces shown are the average of 17 (GFP-BRM), 14 (GFP-SNR1), 9 (mCh-RPB3), and 18 (mCh-H2B) experiments. GFP-BRM data are obtained from Figure 3F. (H) Confocal images of a GFP-H2B containing chromosome segment before, directly after and 40 min after photobleaching. Top images: GFP-fluorescence; bottom images; heat map. Graph shows the fluorescence recovery of mCh-H2B. All scale bars represent 5 μm.
Figure 5—figure supplement 1
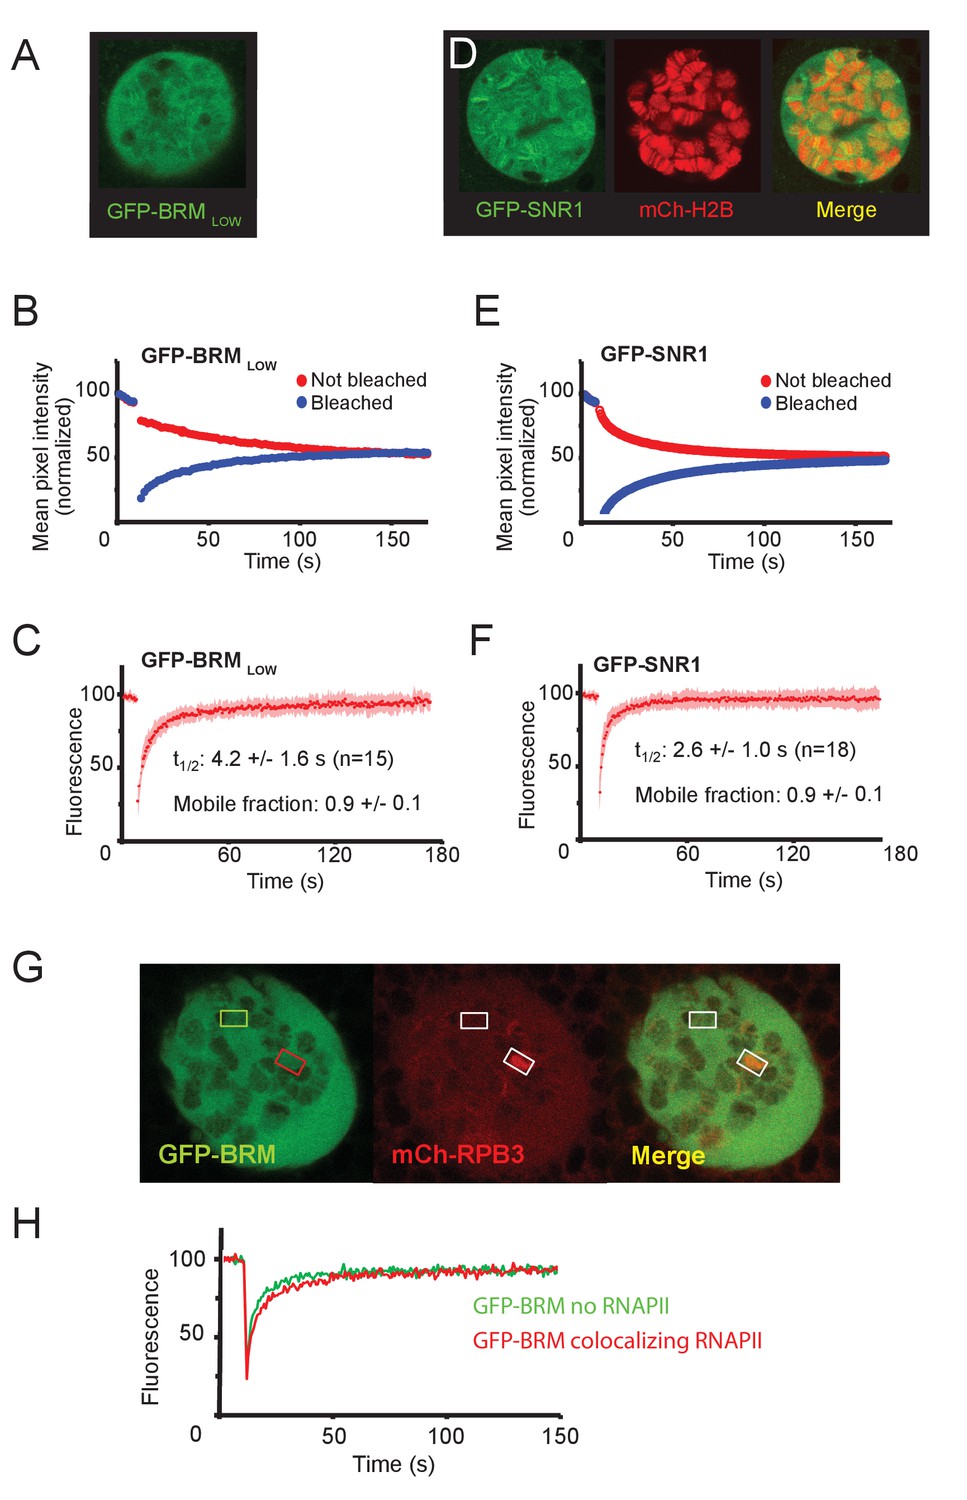
Localization and mobility of GFP-SNR1 and GFP-BRM in a low expressing Drosophila line.
(A) Confocal section of a polytene nucleus expressing GFP-BRM at a low level (Bloomington 59784). (B) Average FLIP-FRAP curve of GFP-BRM (n=6; SD bleached curve < 4%; unbleached curve < 3%). (C) Averaged FRAP curve of GFP-BRM in low expressing polytene nuclei. Data are expressed as mean ± SD for n=15 nuclei. (D) Confocal image of polytene nucleus expressing GFP-SNR1 and mCH-H2B. (E) Average FLIP-FRAP curve of GFP-SNR1 (n=9; SD bleached curve < 4%; unbleached curve < 3%). (F) Averaged FRAP curve of GFP-SNR1. Data are expressed as mean ± SD for n=18 nuclei. (G) Confocal images of a polytene nucleus expressing GFP-BRM and mCh-RPB3. Bleached areas are indicated by rectangles. (H) Corresponding FRAP curves of GFP-BRM in the absence (green) and presence (red) of RNAPII.
Figure 6 with 1 supplement
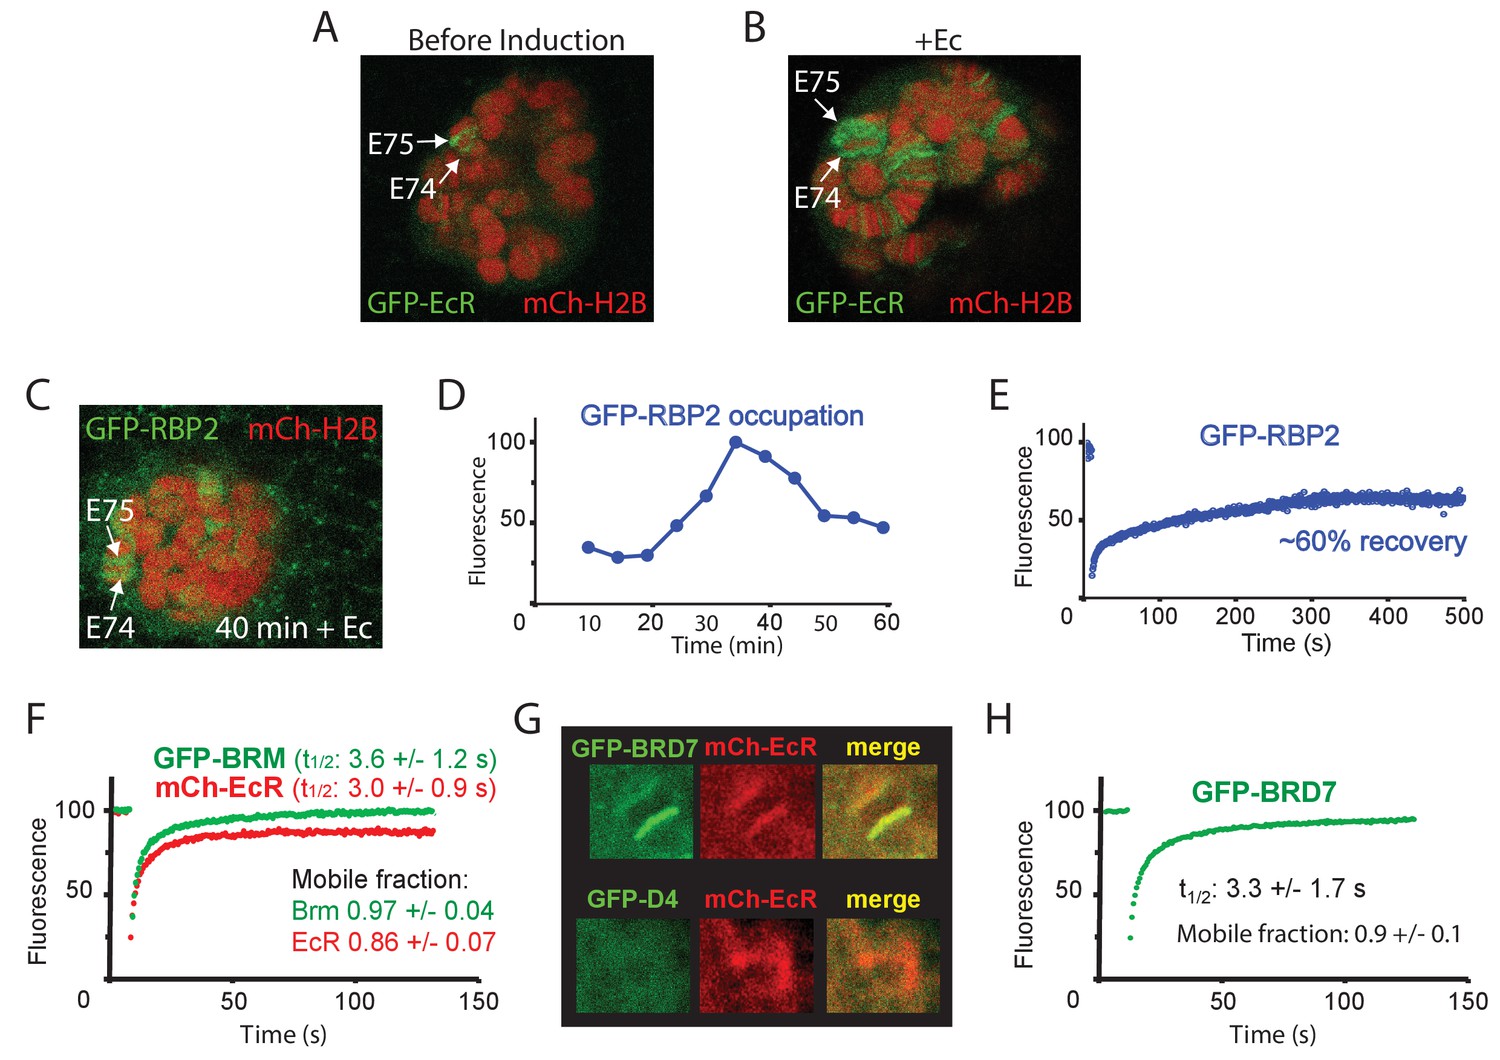
Dynamics of EcR, RNAPII and PBAP at the E74 and E75 loci.
(A) Confocal image of a polytene nucleus expressing GFP-EcR and mCh-H2B prior to- and (B) 40 min following addition of Ec. (C) Confocal image of a salivary gland nucleus expressing GFP-RBP2 and mCh-EcR 40 min after the addition of Ec. (D) Addition of Ec to isolated salivary glands leads to increased RNAPII occupation of the E74 and E75 loci. GFP-RBP2 accumulation on the E74 and E75 loci after addition of Ec. Fluorescence is expressed as percentage of the maximal mean pixel intensity. See also Figure 6—figure supplement 1A. (E) FRAP analysis of GFP-RPB2 at the peak of RNAPII accumulation (30 min). (F) Averaged FRAP curves of GFP-BRM (green) and mCh-EcR (red) at the E74 and E75 loci. Data are expressed as mean ± SD for n=10 nuclei. (G) GFP-BRD7, but not GFP-D4, co-localizes with mCh-EcR on the E74 and E75 loci. Confocal images of nuclei expressing mCh-EcR (red) and either GFP-BRD7 (green) or GFP-D4 (green). See also Figure 6—figure supplement 1C,D. (H) Averaged FRAP curves of GFP-BRD7 (green) on the E74 and E75 loci.
Figure 6—figure supplement 1
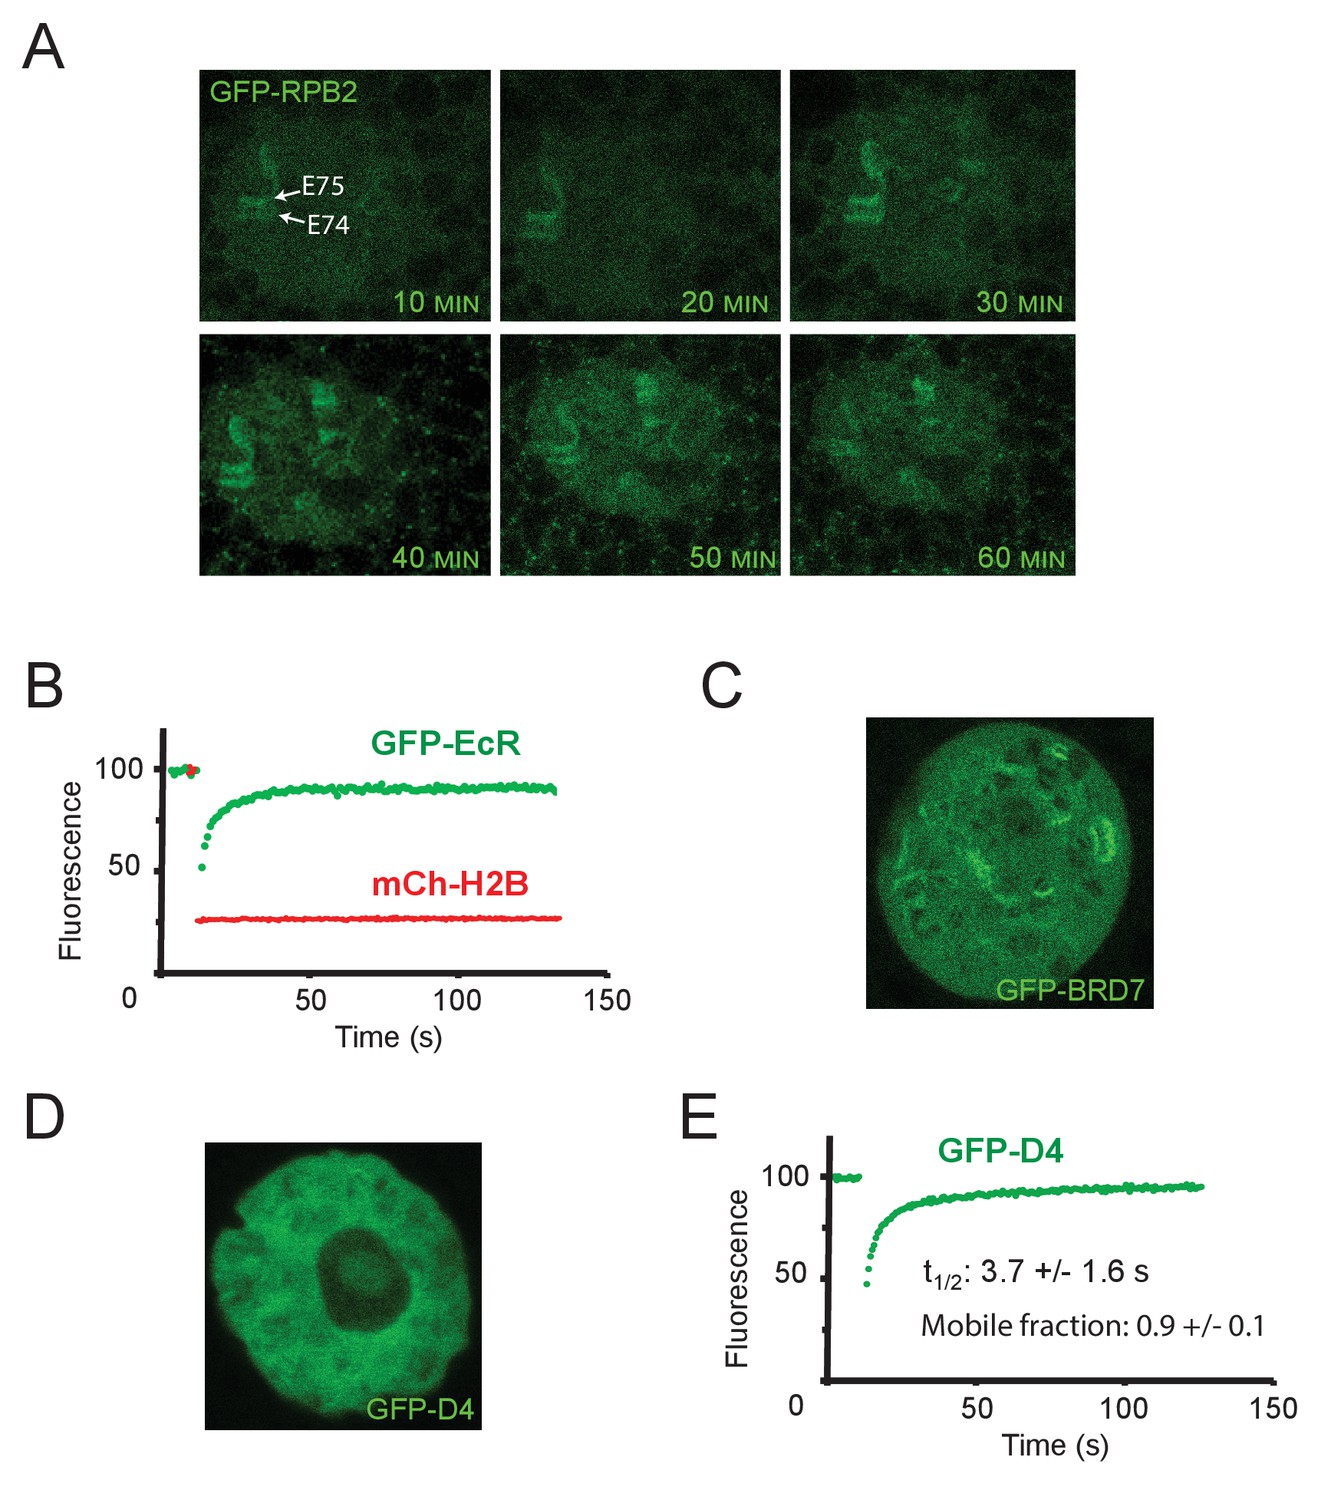
Ec-induced transient recruitment of RNAPII to the E74 – E75 locus.
(A) Confocal images of polytene nuclei from isolated salivary glands expressing GFP-RBP2, after addition of Ec (20 µM, final concentration). (B) Averaged FRAP curves of GFP-EcR (green) and mCh-H2B (red) at the E74 and E75 loci (n=6). (C) Representative confocal image of a GFP-BRD7 expressing polytene nucleus. (D) Representative confocal image of a GFP-D4 expressing polytene nucleus. (E) Averaged FRAP curves of GFP-D4 bands on chromatin (n=6).
Figure 7 with 1 supplement
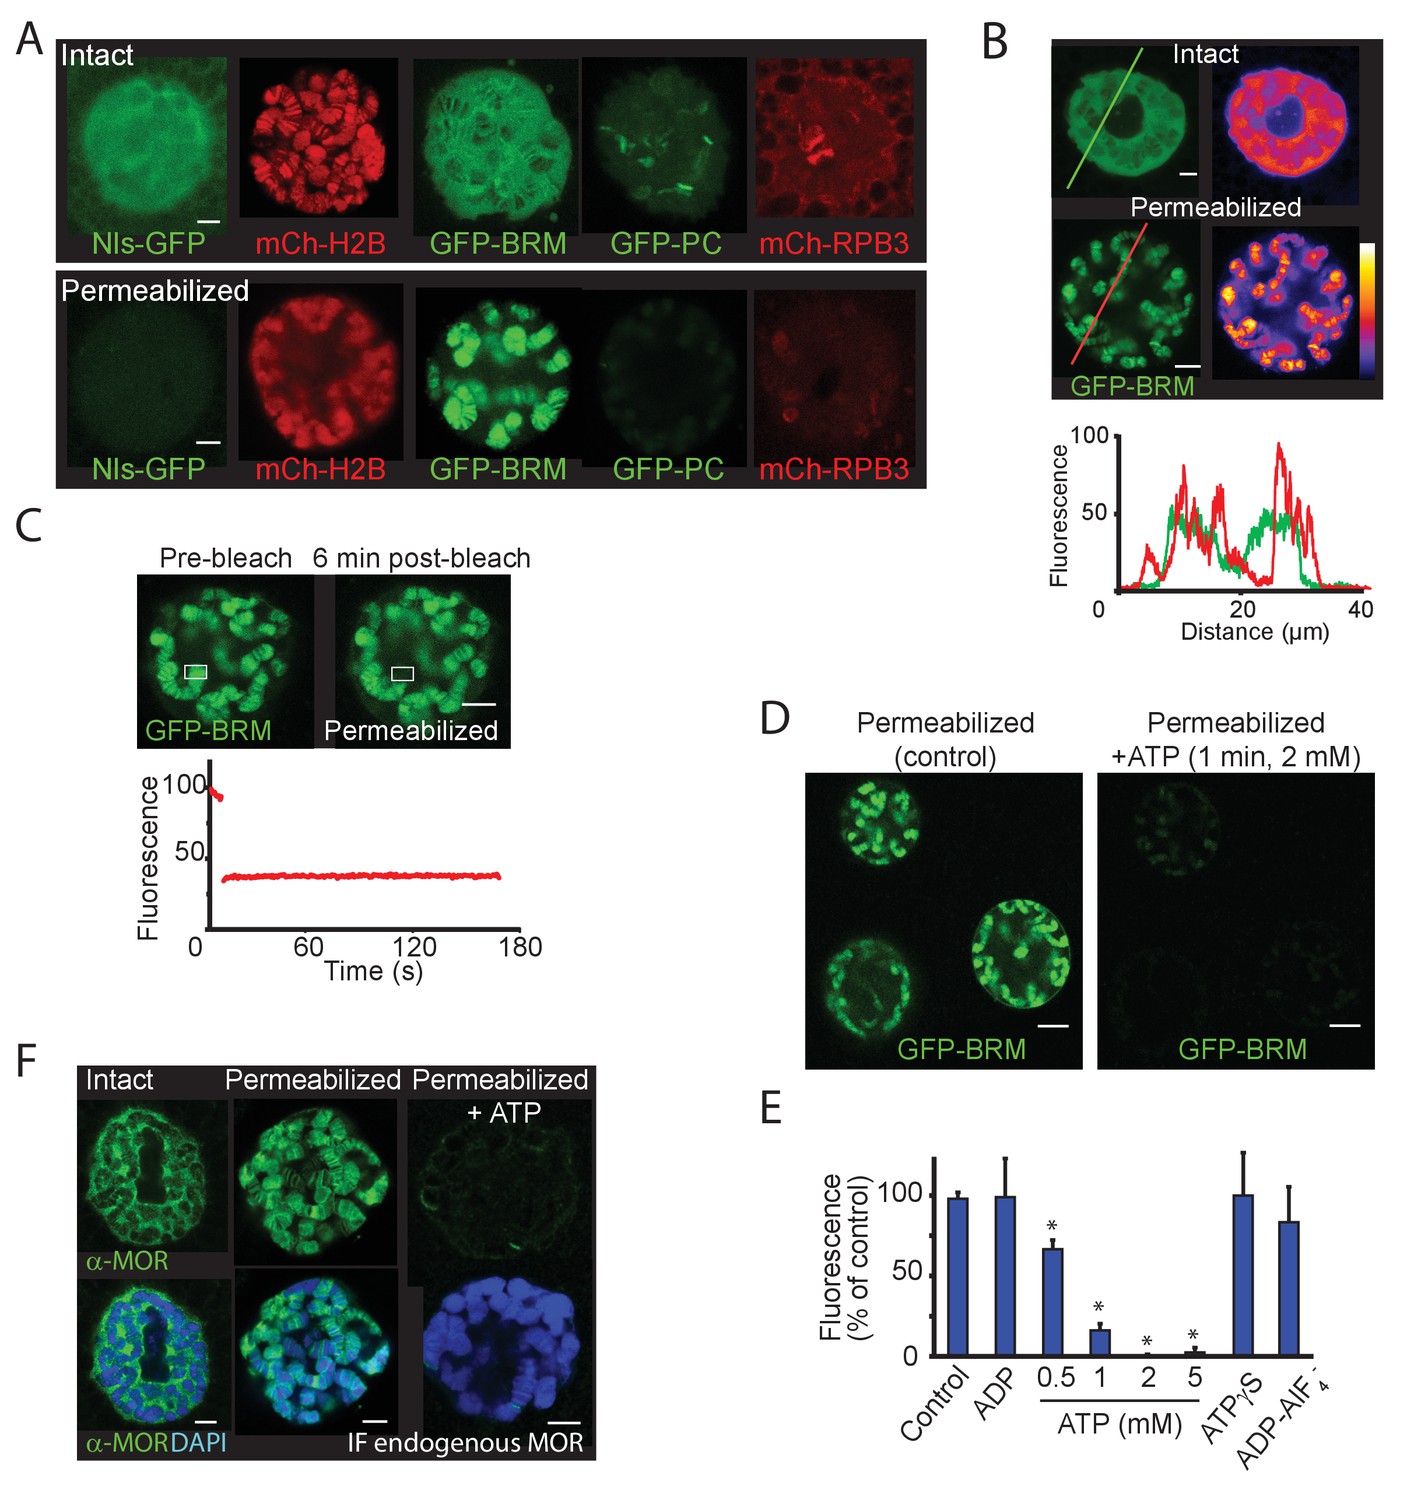
ATP-hydrolysis is required for (P)BAP release from polytene chromosomes.
(A) Confocal images showing the nuclear distribution of NLS-GFP, mCh-H2B, GFP-BRM, GFP-PC, and mCh-RPB3 in isolated salivary glands that were either intact (top panels) or permeabilized by treatment with 0.01% digitonin (bottom panels). Images are representative for polytene nuclei in salivary glands obtained from multiple independent crosses. (B) GFP-fluorescence and heat maps of GFP-BRM in a nucleus of an intact or a digitonin-permeabilized salivary gland. Fluorescence intensity plots corresponding to the line scans (from left to right) indicated in the top panels. Fluorescence intensity is expressed as percentage of the highest pixel intensity of the combined images. The false color scale bar represents full-scale gray values (eight bit) from 0 (black) to 255 (white). (C) FRAP of a GFP-BRM chromosomal band in a nucleus of a digitonin-permeabilized salivary gland. Rectangle indicates the bleached area. (D) Confocal images of GFP-BRM in a permeabilized gland prior to- or 1 min after the addition of ATP to a final concentration of 2 mM. See also Figure 7—video 1 depicting GFP-BRM after addition of ATP. (E) Effect of adenosine nucleotides and ATP mimetics on chromatin retention of GFP-BRM in permeabilized salivary glands. Fluorescence intensity (as percentage of control without added ATP) of individual nuclei in permeabilized salivary glands incubated for 5 min with 5 mM ADP, 0.5–5 mM ATP, 5 mM ATP-γ-S or ADP-AlF4- (5 mM ADP + 10 mM AlF4-). Data are expressed as mean +/- SD. Asterisk indicates a significant difference from the control (p < 0.05). (F) Endogenous (P)BAP clamps chromatin in the absence of ATP. Confocal IF images of whole mount nuclei from intact or permeabilized salivary glands using antibodies against MOR (green) and DAPI (blue). Prior to fixation, permeabilized glands were incubated in media that either lacked- or contained 5 mM ATP for 10 min. Images are representative for polytene nuclei in salivary glands obtained from multiple larvae. All scale bars represent 5 μm.
Figure 7—video 1
Video depicting GFP-BRM in permeabilized salivary gland after addition of ATP.
Figure 8
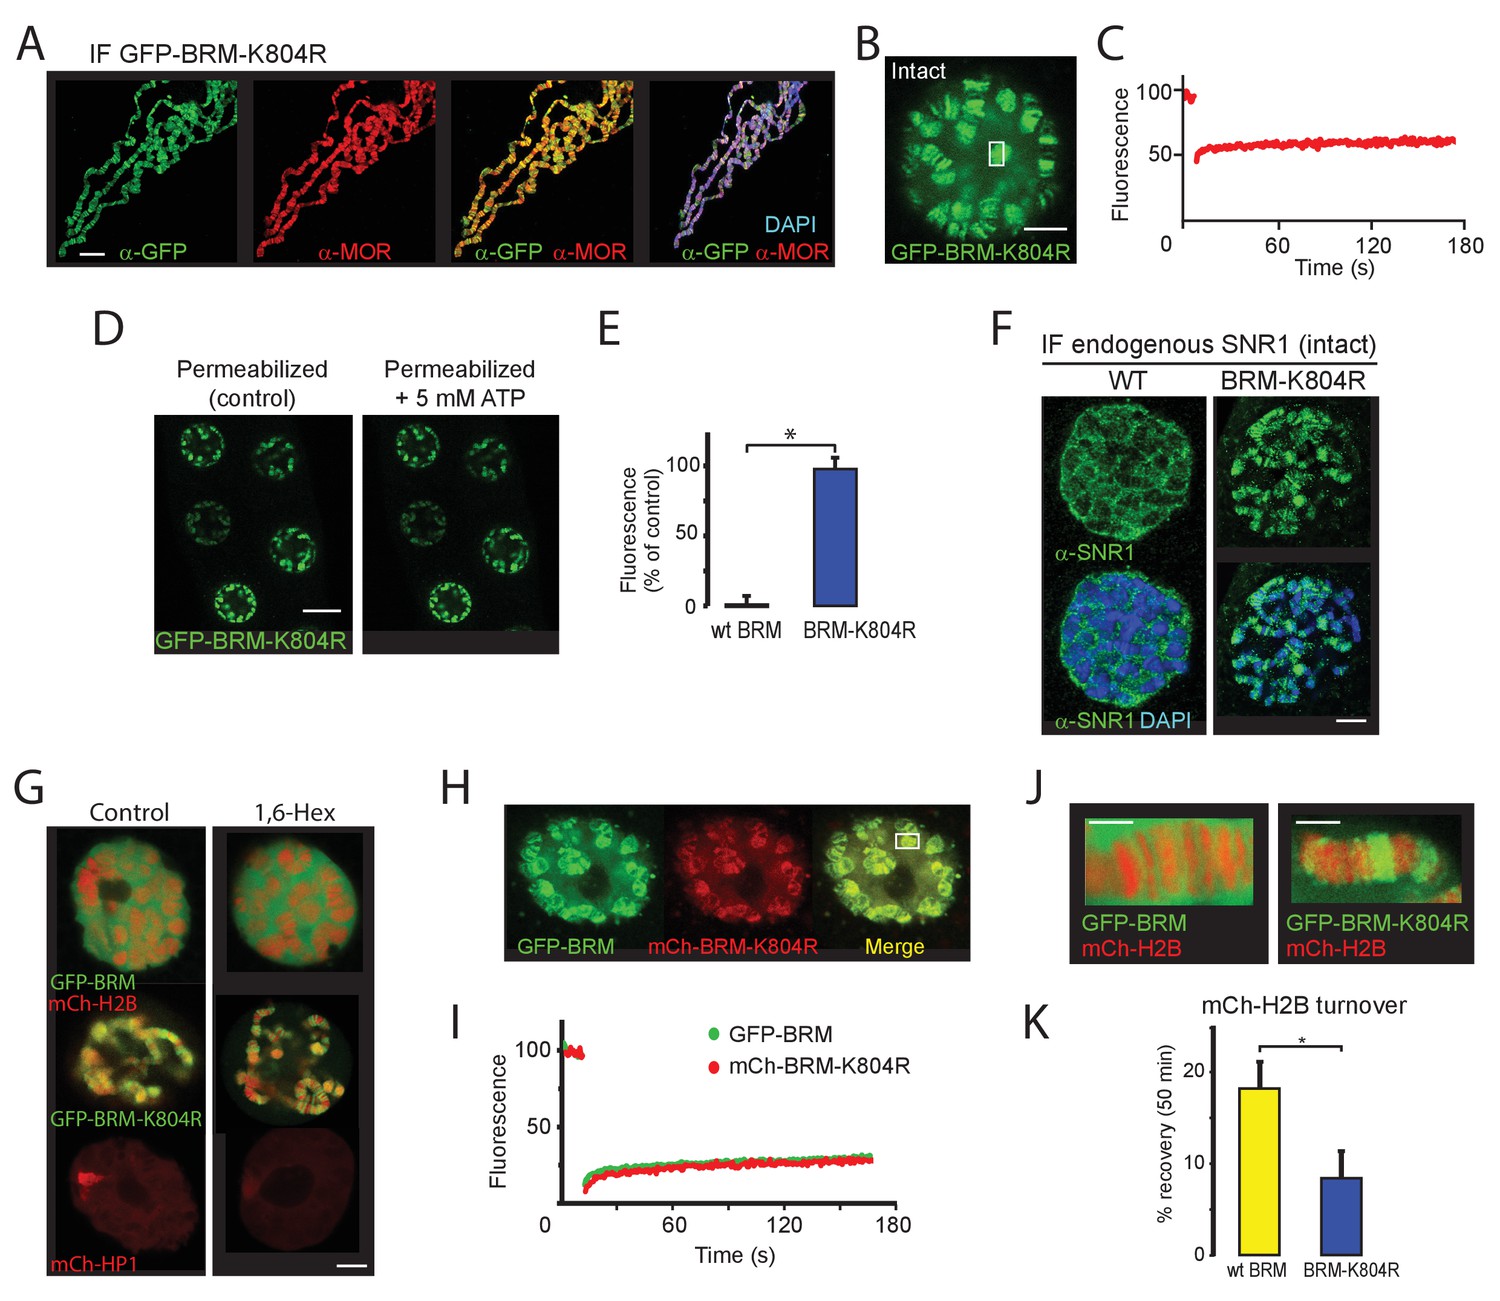
BRM-K804R clamps onto polytene chromosomes and impedes histone turnover.
(A) Distribution of GFP-BRM-K804R on a polytene chromosome spread determined by indirect IF using antibodies against GFP (green) and MOR (red). DNA was visualized by DAPI staining (blue). Scale bar represents 20 μm. (B) Confocal image of GFP-BRM-K804R expressing salivary gland. Scale bar represents 5 μm. (C) FRAP of GFP-BRM-K804R chromosomal band. Rectangle in panel B indicates the bleached area. (D) Confocal images of GFP-BRM-K804R in a permeabilized gland prior or 5 min after the addition of ATP to a final concentration of 5 mM. Scale bar represents 20 μm. (E) Comparison of GFP-BRM and GFP-BRM-K804R fluorescence in permeabilized glands 5 min after addition of 5 mM ATP. Fluorescence is expressed as percentage of the intensity prior to ATP addition (mean +/- SD for n = 4 (GFP-BRM)) or 8 (GFP-BRM-K804R). Asterisk indicates a significant difference (p < 0.05). (F) GFP-BRM-K804R determines chromatin association of endogenous SNR1. Confocal IF images of whole mount nuclei from formaldehyde fixed salivary glands expressing either wt GFP-BRM or GFP-BRM-K804R using antibodies against SNR1 and DAPI. Scale bar represents 5 μm. (G) Confocal images of salivary gland polytene nuclei expressing mCh-H2B, GFP-BRM, GFP-BRM-K804R, or mCh-HP1 in either the absence or presence of 5% 1,6-Hex for 5 min. (H) BRM-K804R traps wt BRM onto polytene chromosomes. Confocal image of a nucleus in cultured salivary gland expressing both GFP-BRM and mCh-BRM-K804R. Scale bar represents 5 μm. (I) Two color FRAP of GFP-BRM (green) and mCh-BRM-K804R (red) chromosomal band. Rectangle in panel H indicates the bleached area. (J) Zoom of polytene chromosome in glands that co-express mCh-H2B and either GFP-BRM or GFP-BRM-K804R. Scale bar represents 2.5 μm. (K) BRM-K804R impedes histone turnover. Single chromosomal band FRAP of mCh-H2B co-localized with either GFP-BRM (yellow) or GFP-BRM-K804R (blue). Data are expressed as percentage recovery within 50 min after photobleaching (mean ± S.E.M. for n = 5). Asterisk indicates a significant difference (p < 0.05). Images are representative for polytene nuclei in salivary glands obtained from multiple larvae and independent crosses.
Figure 9
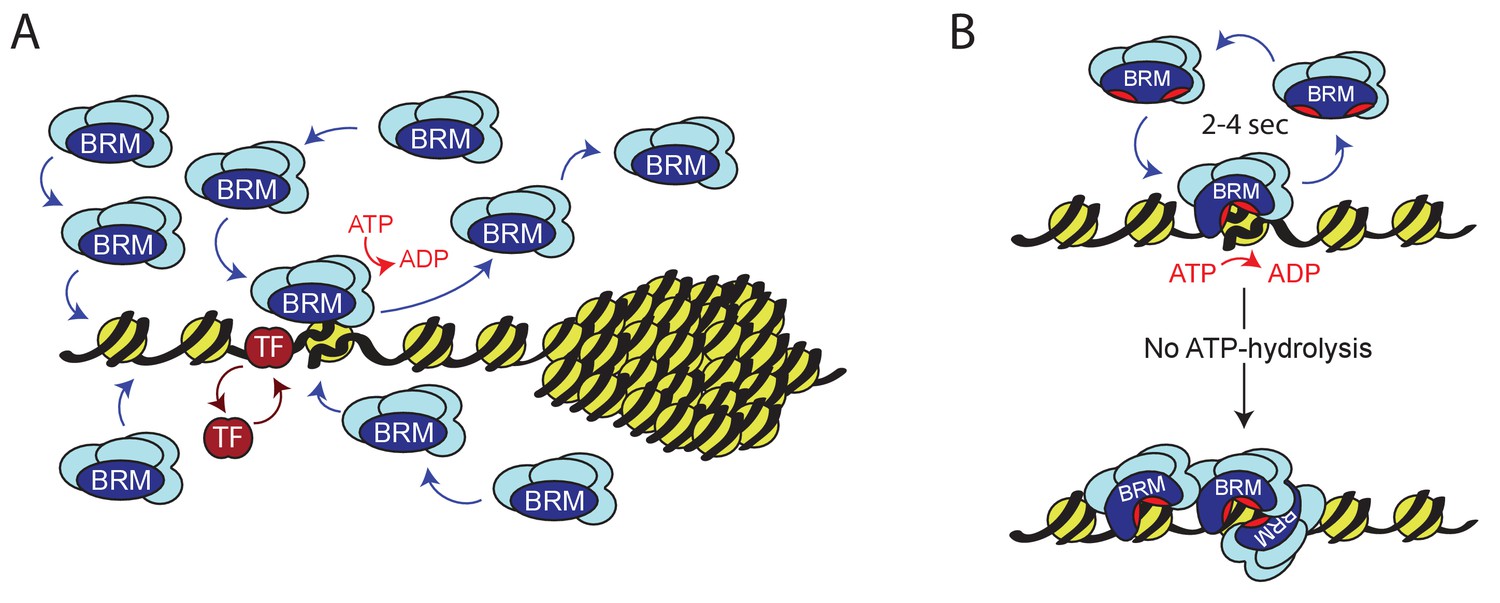
Model for ATP-dependent chromatin remodeler dynamics.
(A) (P)BAP remodelers act through a continuous transient exploration of the genome that is driven by the coupling between ATP-hydrolysis and remodeler release from chromatin. In contrast, histone exchange is limited and more than 2 orders of magnitude slower. Chromatin condensation leads to the exclusion of (P)BAP, thus reducing its genomic search space. Sequence-specific transcription factor (TF). (B) ATP-hydrolysis stimulates remodeler release, but is not required for binding to chromatin. In solution, the two domains that harbor the ATP-binding motifs (red pockets) are oriented away from one another, precluding ATP-binding. Upon DNA-binding, these core domains rotate towards each other, forming a functional ATP-binding pocket (Xia et al., 2016). ATP-hydrolysis not only enables nucleosome remodeling but also increases the probability of remodeler release. This drives rapid cycles of remodeling and remodeler recycling. Loss of ATP-hydrolysis results in retention and clustering of (P)BAP on chromatin, and reduced histone turnover. For details see main text.
Additional files
-
Supplementary file 1
List of Drosophila lines.
- https://cdn.elifesciences.org/articles/69424/elife-69424-supp1-v2.docx
-
Supplementary file 2
List of Primers.
- https://cdn.elifesciences.org/articles/69424/elife-69424-supp2-v2.docx
-
Supplementary file 3
List of Antibodies.
- https://cdn.elifesciences.org/articles/69424/elife-69424-supp3-v2.docx
-
Transparent reporting form
- https://cdn.elifesciences.org/articles/69424/elife-69424-transrepform-v2.pdf
Download links
A two-part list of links to download the article, or parts of the article, in various formats.
Downloads (link to download the article as PDF)
Open citations (links to open the citations from this article in various online reference manager services)
Cite this article (links to download the citations from this article in formats compatible with various reference manager tools)
In vivo analysis reveals that ATP-hydrolysis couples remodeling to SWI/SNF release from chromatin
eLife 10:e69424.
https://doi.org/10.7554/eLife.69424


