Sensory transduction is required for normal development and maturation of cochlear inner hair cell synapses
- Speech and Hearing Bioscience & Technology Program, Division of Medical Sciences, Harvard University, United States
- Department of Otolaryngology, Boston Children’s Hospital and Harvard Medical School, United States
- Department of Neurology, Boston Children’s Hospital and Harvard Medical School, United States
Figures
Figure 1
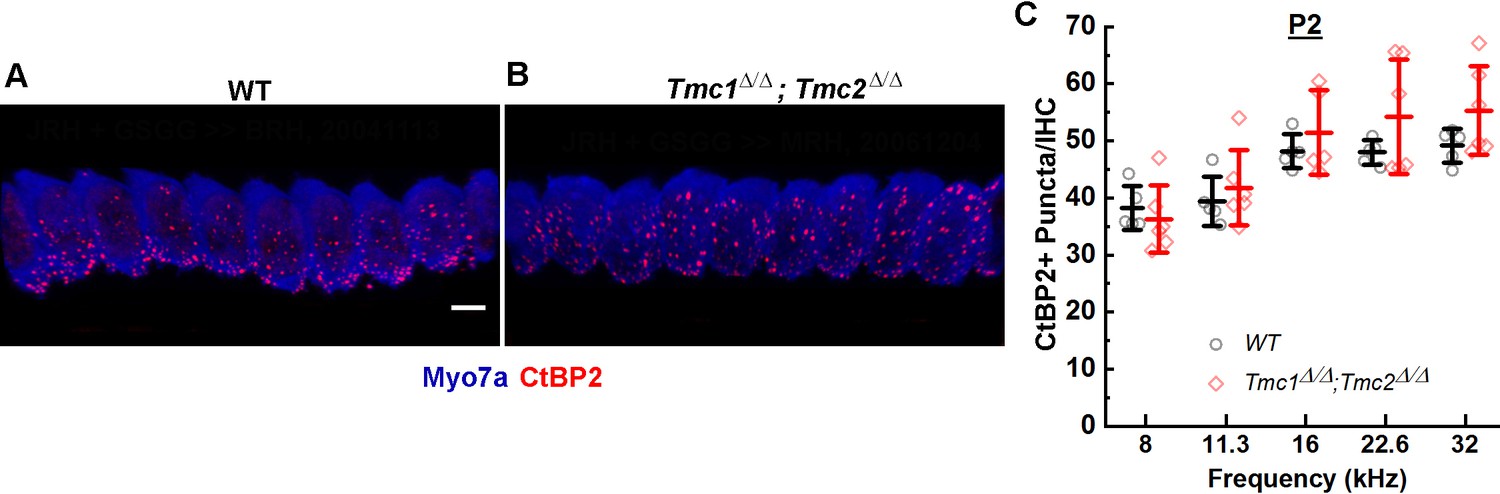
CtBP2+ puncta counts in Tmc1Δ/Δ;Tmc2Δ/Δ mice lacking sensory transduction are similar to those in wild-type (WT) mice at postnatal day 2 (P2).
(A) Representative 3D projections of confocal z-stacks of P2 WT and Tmc1Δ/Δ;Tmc2Δ/Δ (B) inner hair cells (IHCs) from the 16 kHz region. Scale bar: 7 µm. The tissue was immunostained with anti-Myosin7a (blue) and anti-CtBP2 (red). (C) To determine a mean number of ribbon precursors/IHC, the total number of CtBP2+ puncta from 8 to 10 IHCs was counted for each frequency region. Individual points represent counts from one mouse. Data from WT (black; n = 5) and Tmc1Δ/Δ; Tmc2Δ/Δ (red; n = 5–6) groups are illustrated. Bold lines indicate mean ± SD.
-
Figure 1—source data 1
CtBP2+ puncta counts in Tmc1Δ/Δ;Tmc2Δ/Δ mice lacking sensory transduction are similar to those in wild-type (WT) mice at postnatal day 2 (P2).
- https://cdn.elifesciences.org/articles/69433/elife-69433-fig1-data1-v2.xlsx
Figure 2
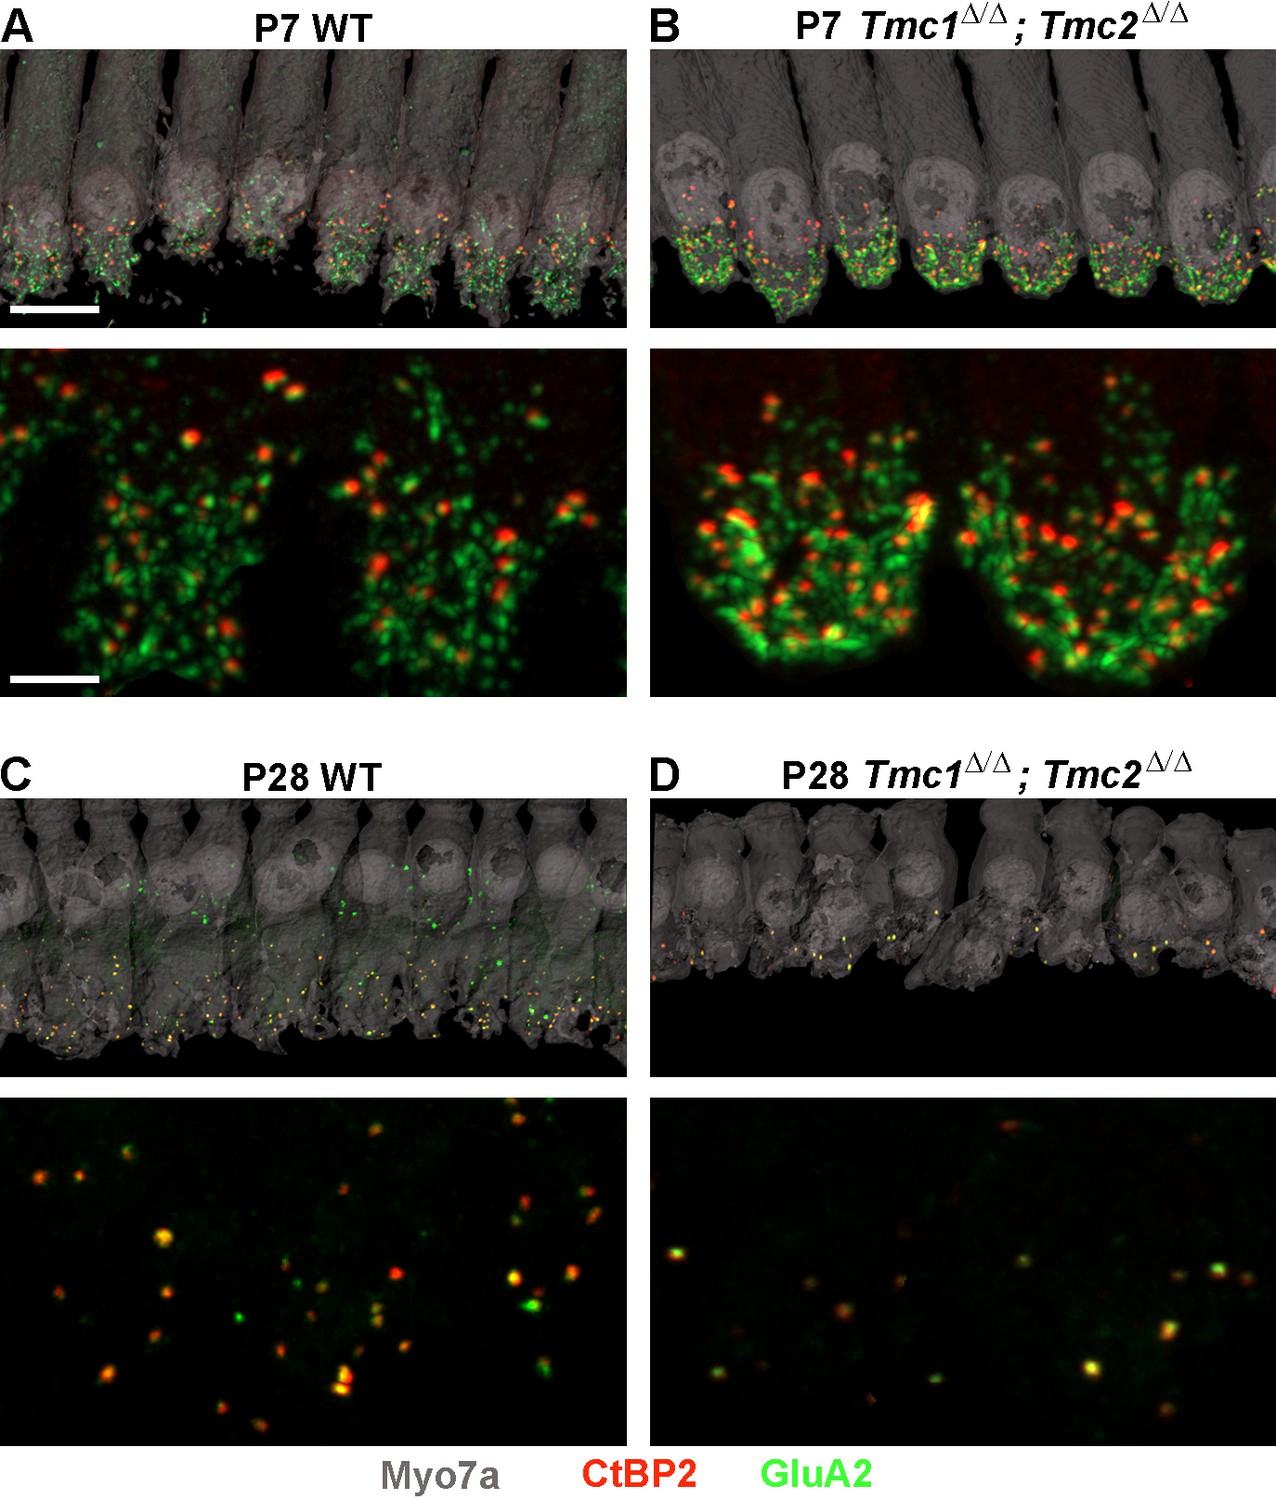
Synapse counts are elevated at postnatal day 7 (P7) and reduced at P28 in Tmc1Δ/Δ;Tmc2Δ/Δ mice relative to wild-type (WT) mice.
(A–B) Representative image of P7 WT and Tmc1Δ/Δ;Tmc2Δ/Δ inner hair cells (IHCs) from 16 kHz region immunostained for anti-Myosin7a (gray), anti-CtBP2 (red), and anti-GluA2 (green). Higher magnification images are shown below. (C–D) P28 WT and Tmc1Δ/Δ;Tmc2Δ/Δ IHCs from 16 kHz region. Scale bars: 10 µm (upper) and 5 µm (lower).
Figure 3
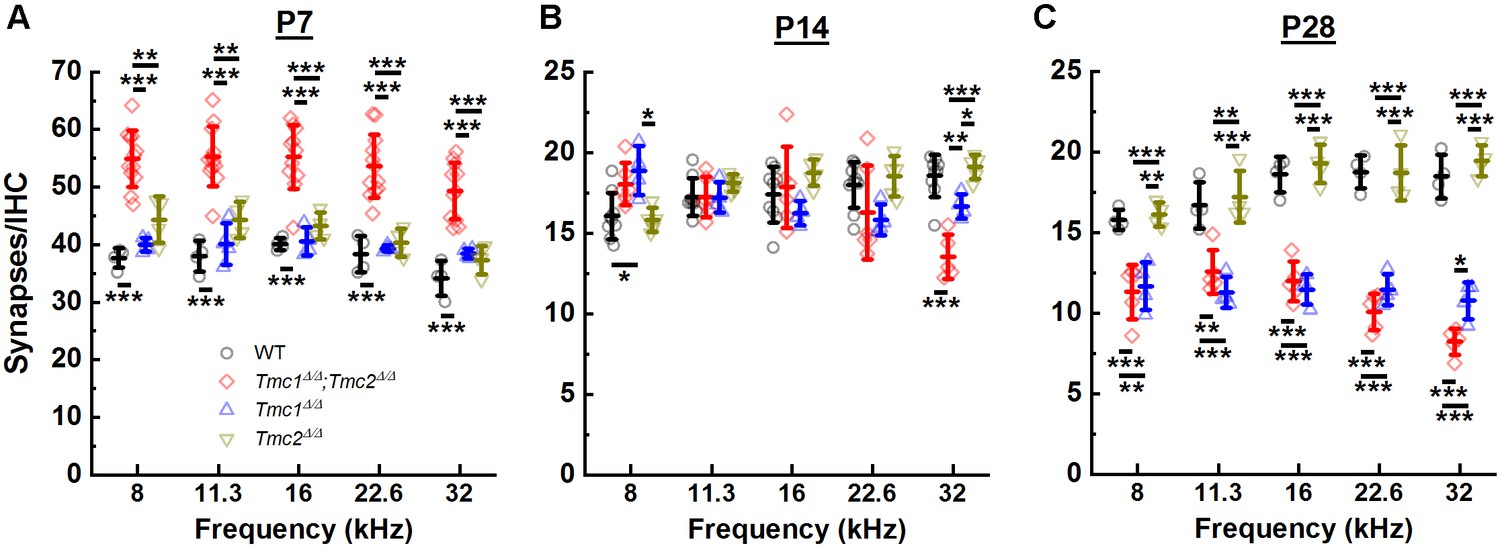
Synapse counts were elevated at postnatal day 7 (P7) in the absence of both Tmc1 and Tmc2 and diminished at P28 in the absence of Tmc1 and Tmc2 or Tmc1 alone.
(A–C) The mean number of synapses/inner hair cell (IHC) was calculated for each frequency region. Data from wild-type (WT) (black), Tmc1Δ/Δ;Tmc2Δ/Δ (red), Tmc1Δ/Δ (blue), and Tmc2Δ/Δ (dark yellow) groups are shown. Individual points represent counts from one mouse. Temporal changes in synapse counts differed by genotype (two-way ANOVA; p < 0.001 based on two-way interaction between genotype and timepoints for all frequencies; Supplementary file 3A). However, genotype-specific trajectories of synaptic development did not vary by frequency (three-way ANOVA; p = 0.73 based on three-way interaction between group, time, frequency; Supplementary file 3A). Bolded lines depict mean ± SD. Black horizontal bars and asterisks represent statistically significant differences between group means (multiple pairwise comparisons, *p < 0.05, **p < 0.01, ***p < 0.001; p values are listed in Supplementary file 2A-C). Number of cochleas: 4–9 WT, 5–12 Tmc1Δ/Δ;Tmc2Δ/Δ, 4 Tmc1Δ/Δ, 4–5 Tmc2Δ/Δ.
-
Figure 3—source data 1
Synapse counts were elevated at postnatal day 7 (P7) in the absence of both Tmc1 and Tmc2 and diminished at P28 in the absence of Tmc1 and Tmc2 or Tmc1 alone.
- https://cdn.elifesciences.org/articles/69433/elife-69433-fig3-data1-v2.xlsx
Figure 4
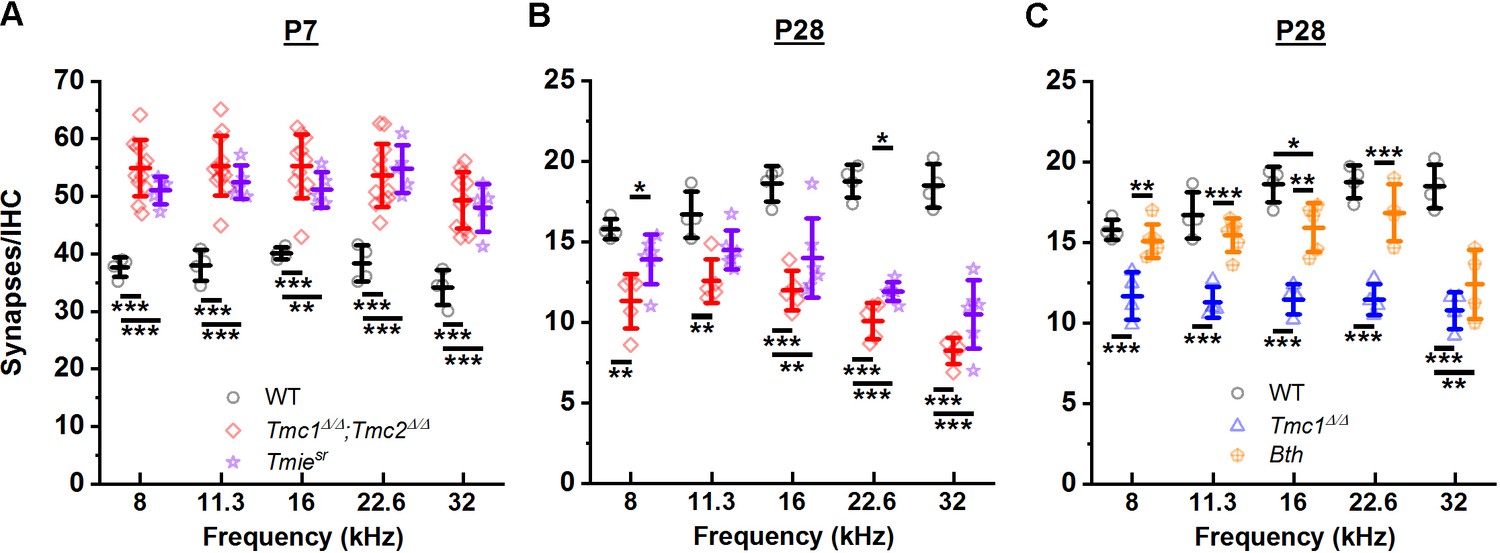
Loss of sensory transduction, not of Tmc1 and Tmc2 specifically, results in the synaptic differences observed at postnatal day 7 (P7) and P28.
(A–C) The mean number of synapses/inner hair cell (IHC) at each frequency region. Data from wild-type (WT) (black), Tmc1Δ/Δ;Tmc2Δ/Δ (red), Tmc1Δ/Δ (blue), Tmiesr (purple), and Tmc1Bth (gold) groups are shown. WT, Tmc1Δ/Δ, and Tmc1Δ/Δ;Tmc2Δ/Δ data are the same as those depicted in Figure 3, reprinted here to facilitate comparison. Individual points represent counts from one mouse. In A and B two-way interactions between genotype and timepoints were statistically significant for all frequencies based on two-way ANOVA (p < 0.001; Supplementary file 3B), suggesting the trajectory of synaptic development varies by genotype. The genotype-specific trajectory of synaptic development did not vary by frequency (three-way ANOVA; p = 0.68 based on three-way interaction between genotype, timepoints, and frequency; Supplementary file 3B). Frequency-specific synapse counts differed by genotype in C (two-way ANOVA; p = 0.002 based on two-way interaction between genotype and frequency; Supplementary file 3B). Bolded lines depict mean ± SD. Black horizontal bars and asterisks represent statistically significant differences in group means (multiple pairwise comparisons, *p < 0.05, **p < 0.01, ***p < 0.001; exact p values listed in Supplementary file 4A-C). Number of cochleas: 4 WT, 5–12 Tmc1Δ/Δ;Tmc2Δ/Δ, 4 Tmc1Δ/Δ, 5–6 Tmiesr, 4–6 Tmc1Bth.
-
Figure 4—source data 1
Loss of sensory transduction, not of Tmc1 and Tmc2 specifically, results in the synaptic differences observed at postnatal day 7 (P7) and P28.
- https://cdn.elifesciences.org/articles/69433/elife-69433-fig4-data1-v2.xlsx
Figure 5
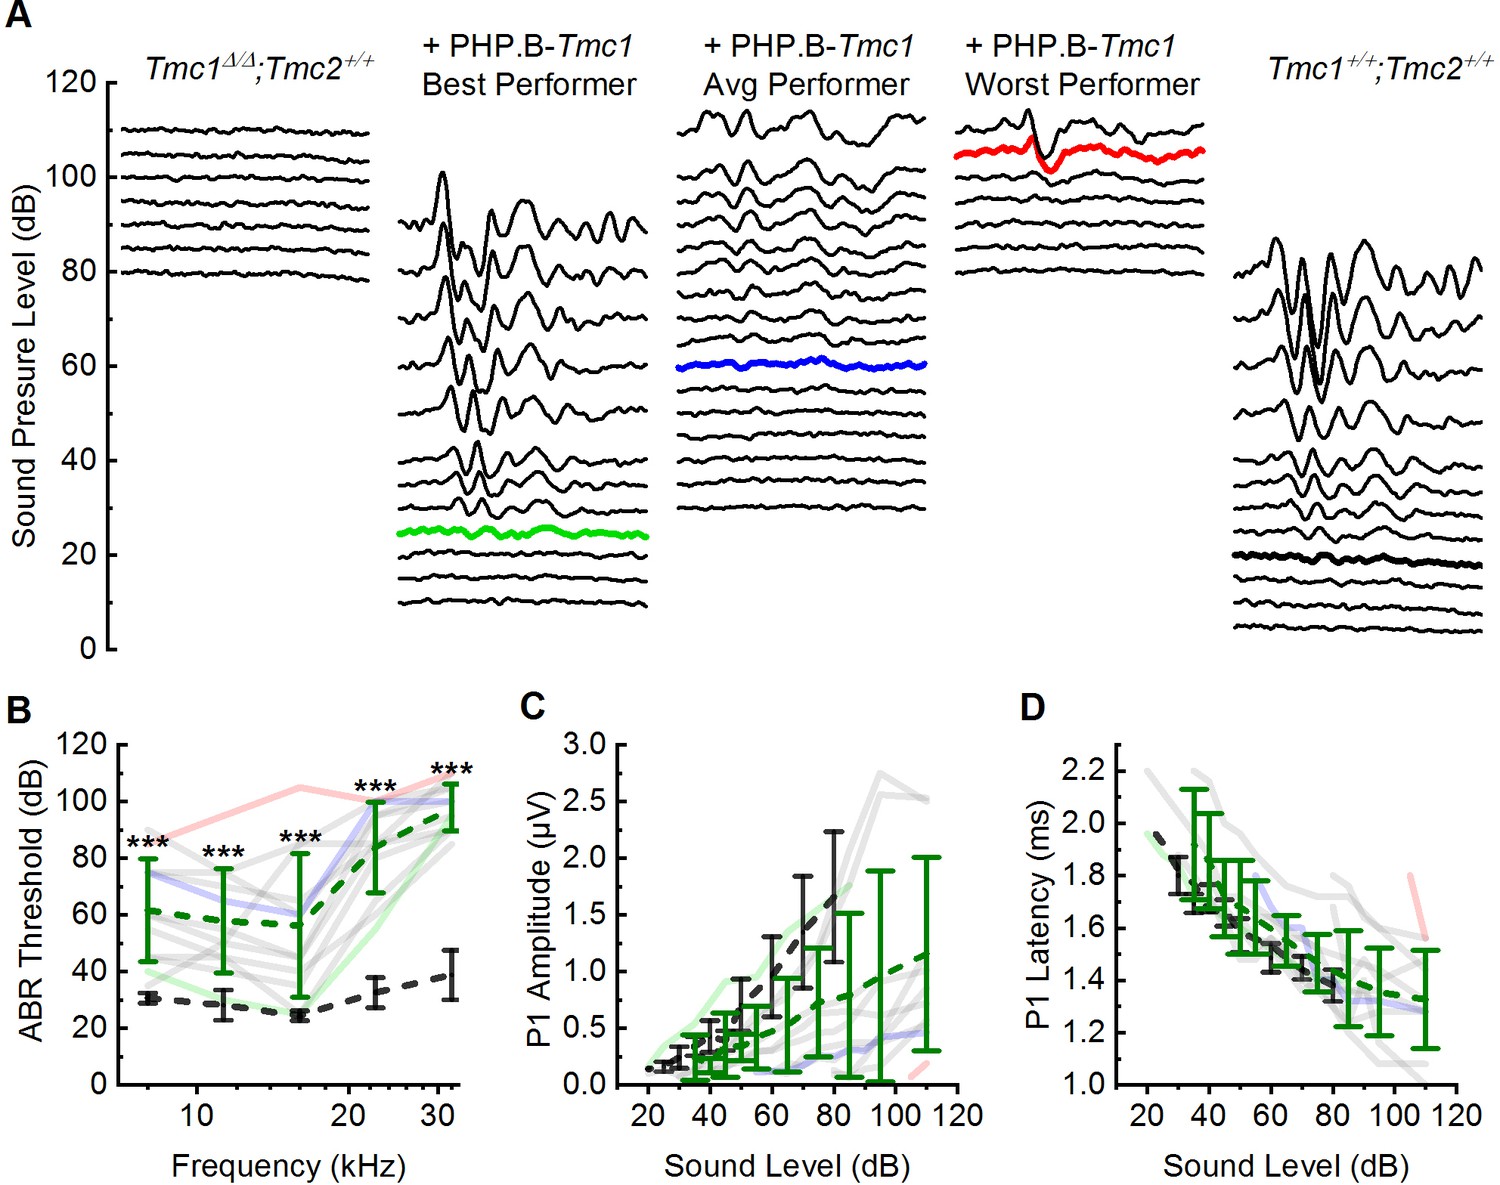
AAV9-PHP.B-Tmc1 restores ABR thresholds in Tmc1Δ/Δ mice.
(A) Representative ABR waveforms recorded at postnatal day 28 (P28) using 16 kHz tone bursts at sound pressure levels of increasing 5 dB increments. Waveforms from uninjected Tmc1Δ/Δ mouse (left), three Tmc1Δ/Δ mice injected with AAV9-PHP.B-Tmc1, representing best (green), average (blue), and worst (red) recovery and one wild-type (WT) control (black) are shown. Thresholds determined by the presence of Peak 1 and indicated by bolded, colored traces. (B) ABR thresholds plotted as a function of stimulus frequency for 12 Tmc1Δ/Δ mice injected with AAV9-PHP.B-Tmc1 tested at P28 (gray traces). Mice with the best (green), median (blue), and worst (red) recovery are indicated and correspond to the best, average, and worst traces in (A). Black dotted lines show mean ± SD thresholds from eight previously tested WT mice. Green dotted line shows mean ± SD thresholds from the 12 injected mice. (C) Peak 1 amplitudes measured from 16 kHz ABR waveforms (A) for 12 Tmc1Δ/Δ mice injected with AAV9-PHP.B-Tmc1. Colors correspond to conditions indicated in B. (D) Peak 1 latencies measured from 16 kHz ABR waveforms (A) for 12 Tmc1Δ/Δ mice injected with AAV9-PHP.B-Tmc1. Colors correspond to conditions indicated in B.
-
Figure 5—source data 1
AAV9-PHP.
B-Tmc1 restores ABR thresholds in Tmc1Δ/Δ mice.
- https://cdn.elifesciences.org/articles/69433/elife-69433-fig5-data1-v2.xlsx
Figure 6
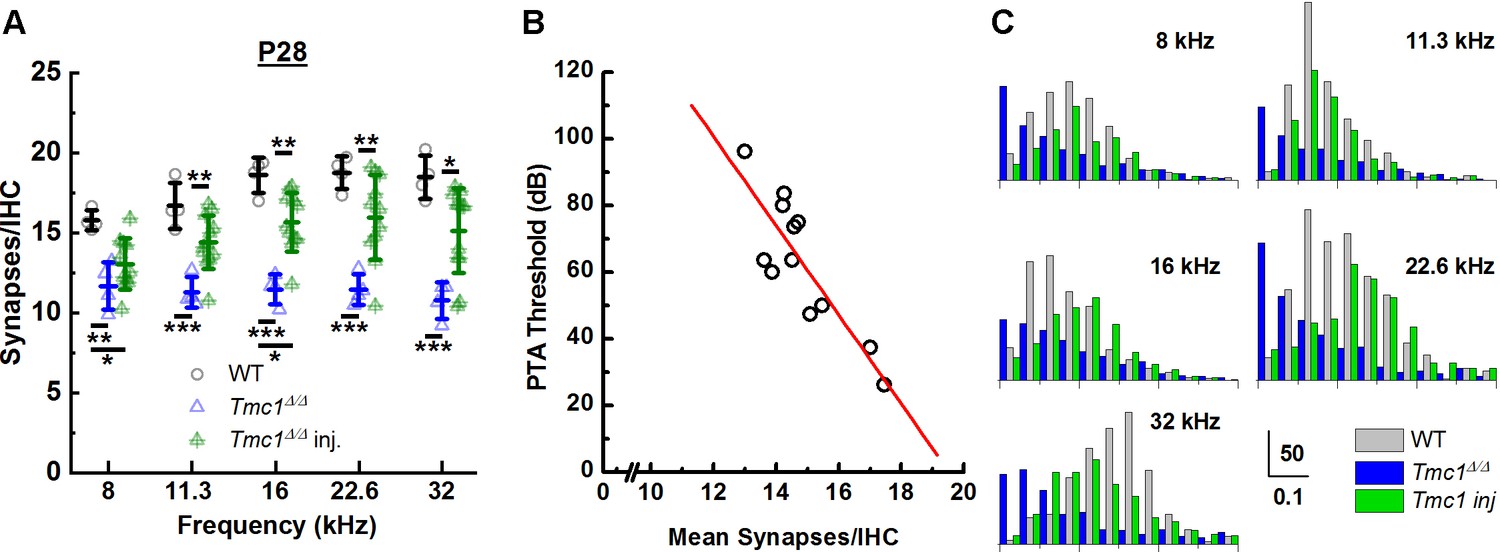
AAV9-PHP.B-Tmc1 preserves synapse counts and ribbon volume distributions in Tmc1Δ/Δ mice.
(A) The mean number of synapses/inner hair cell (IHC) was counted at each frequency region from postnatal day 28 (P28) wild-type (WT) (black), Tmc1Δ/Δ (blue), and injected Tmc1Δ/Δ (green) mice. WT and Tmc1Δ/Δ ribbon counts are the same as those depicted in Figure 3. Individual points represent counts from one mouse. Frequency-specific synapse counts did not differ by group (two-way ANOVA; p = 0.49 based on two-way interaction between genotype and frequency; Supplementary file 3C). Bolded lines indicate mean ± SD. Black horizontal bars and asterisks represent statistically significant differences in group means (multiple pairwise comparisons, *p < 0.05, **p < 0.01, ***p < 0.001). Number of cochleas: 4 WT, 4 Tmc1Δ/Δ cochleas, 11–12 injected Tmc1Δ/Δ cochleas. (B) Pure tone average (PTA) thresholds were calculated for frequencies between 8 and 22.6 kHz for 12 Tmc1Δ/Δ mice injected with 1 µL AAV9-PHP.B-Tmc1 at P1. PTA thresholds were plotted as a function of the mean synapses/IHC (circles) based on synapse counts from corresponding cochlear regions. The data were fitted with a linear regression (red line) that had a slope of 13 dB/synapse, a correlation coefficient of 0.86; p = 0.00032. (C) Histograms showing distributions of ribbon volumes from confocal z-stacks plotted for each frequency region. Scale bars indicate volume counts on the Y-axis and ribbon volumes in µm3 on the X-axis. Data were obtained from four P28 WT (gray) cochleas, four Tmc1Δ/Δ (blue) cochleas, and four injected Tmc1Δ/Δ (green) cochleas for each of the 8–32 kHz regions.
-
Figure 6—source data 1
AAV9-PHP.
B-Tmc1 preserves synapse counts and ribbon volume distributions in Tmc1Δ/Δ mice.
- https://cdn.elifesciences.org/articles/69433/elife-69433-fig6-data1-v2.xlsx
Figure 7
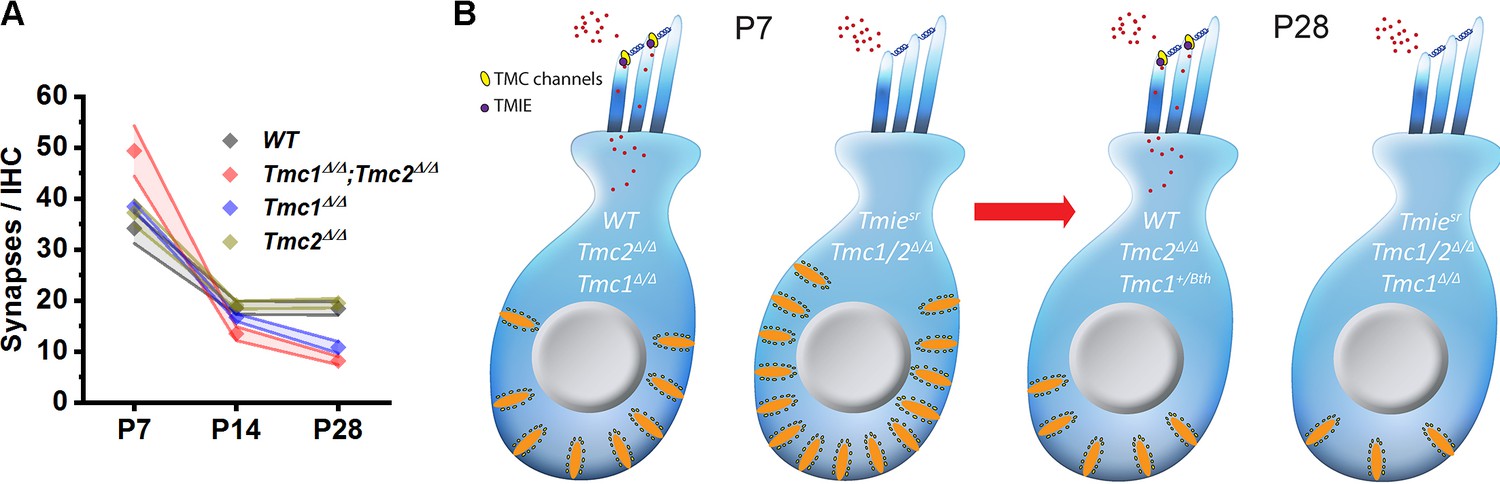
Developmental changes in inner hair cell (IHC) synapses in genetic models of sensory transduction dysfunction.
(A) Number of synapses/IHC from the 32 kHz region of wild-type (WT), Tmc1Δ/Δ;Tmc2Δ/Δ, Tmc1Δ/Δ, and Tmc2Δ/Δ cochleas as a function of age. (B) Schematic diagram summarizing changes in IHC synapses between postnatal day 7 (P7) and P28 in five genetic models.
Tables
Key resources table
| Reagent type (species) or resource | Designation | Source or reference | Identifiers | Additional information |
|---|---|---|---|---|
| Genetic reagent (Mus musculus) | C57B/L6-Cdh23753A>G | Derived from Lentz et al., 2010 | C57BL6 | Lentz et al. Dev. Neurobiol (2010) |
| Genetic reagent (Mus musculus) | 019146 - B6.129-Tmc1tm1.1Ajg/J | Available from Jackson Lab, obtained initially from Dr A Griffith (NIH/NIDCD) | Tmc1 Targeted (Reporter, Null/Knockout) | Kurima et al. Nat Genet. (2002) |
| Genetic reagent (Mus musculus) | 019147 - B6.129-Tmc2tm1.1Ajg/J | Available from Jackson Lab, obtained initially from Dr A Griffith (NIH/NIDCD) | Tmc2 Targeted (Reporter, Null/Knockout) | Kawashima et al. J Clin Invest (2011) |
| Genetic reagent (Mus musculus) | 003929 - BXA4/Pgn-Tmiesr-J/J | Available from Jax C57BL/6-Tmiesr (‘spinner’) mice | Spontaneous mutation in Tmie | Stock No. 000543Mitchem et al. Hum Mol Genet. (2002) |
| Genetic reagent (Mus musculus) | Tmc1Bth | Tmc1Bth/Bth mice were obtained from M Hrabé de Angelis and H Fuchs, Institute of Experimental Genetics, Neuherberg, Germany | Point mutation at residue 412 (M412K) | Vreugde et al. Nat Genet. (2002) |
| Antibody | Anti-CtBP2 (Mouse IgG1 monoclonal) | BD Transduction Laboratories | Cat #: 612044 | Primary antibody, IF (1:200) |
| Antibody | Anti-GluA2 (Mouse IgG2a monoclonal) | Millipore Sigma | Cat #: MABN1189 | Primary antibody, IF (1:2000) |
| Antibody | Anti-MyosinVIIA (Rabbit polyclonal) | Proteus Biosciences | Cat #: 25–6790 | Primary antibody, IF (1:200) |
| Antibody | Anti-Rabbit Alexa Fluor 647 (Donkey polyclonal) | Thermo Fisher Scientific | Cat #: A-31573 | Secondary antibody, IF (1:200) |
| Antibody | Anti-Mouse IgG2a Alexa Fluor 488 (Goat polyclonal) | Thermo Fisher Scientific | Cat #: A-21131 | Secondary antibody, IF (1:1000) |
| Antibody | Anti-Mouse IgG1 Alexa Fluor 546 (Goat polyclonal) | Thermo Fisher Scientific | Cat #: A-21123 | Secondary antibody, IF (1:1000) |
| Other | Vectashield Antifade | Vector Laboratories | Cat #: H-1000–10 | Mounting medium |
| Other | AAV9-PHP.B- CMV-Tmc1e × 1 | Wu et al., 2021 | Nucleic acid, Titer: 3.9 E + 13 gc/mL | |
| Software, algorithm | Imaris | https://imaris.oxinst.com/ | ||
| Software, algorithm | ImageJ software | http://imagej.nih.gov/ij/ | ||
| Software, algorithm | Eaton-Peabody Laboratories Cochlear Function Test Suite | https://www.masseyeandear.org/research/otolaryngology/eaton-peabody-laboratories/engineering-core |
Additional files
-
Supplementary file 1
CtBP2+ puncta (mean ± SEM) per inner hair cell (IHC) in postnatal day 2 (P2) wild-type (WT) and Tmc1Δ/Δ;Tmc2Δ/Δ mice.
- https://cdn.elifesciences.org/articles/69433/elife-69433-supp1-v2.xlsx
-
Supplementary file 2
Group comparisons of synapse counts at P7 and P14.
(A) Group comparisons of postnatal day 7 (P7) synapse counts per inner hair cell (IHC) (mean difference, 95% CI) in wild-type (WT), Tmc1Δ/Δ;Tmc2Δ/Δ, Tmc1Δ/Δ, and Tmc2Δ/Δ mice. *p < 0.05, **p < 0.01, ***p < 0.001, non-significant (ns) > 0.05.
(B) Group comparisons of postnatal day 14 (P14) synapse counts per inner hair cell (IHC) (mean difference, 95% CI) in wild-type (WT), Tmc1Δ/Δ;Tmc2Δ/Δ, Tmc1Δ/Δ, and Tmc2Δ/Δ mice. *p < 0.05, **p < 0.01, ***p < 0.001, non-significant (ns) > 0.05. (C) Group comparisons of postnatal day 28 (P28) synapse counts per inner hair cell (IHC) (mean difference, 95% CI) in wild-type (WT), Tmc1Δ/Δ;Tmc2Δ/Δ, Tmc1Δ/Δ, and Tmc2Δ/Δ mice. *p < 0.05, **p < 0.01, ***p < 0.001, non-significant (ns) > 0.05.
- https://cdn.elifesciences.org/articles/69433/elife-69433-supp2-v2.xlsx
-
Supplementary file 3
ANOVA analyses as a function of genotype, age and frequency.
(A) Three-way and two-way ANOVA analyses of genotypes (wild-type [WT], Tmc1Δ/Δ;Tmc2Δ/Δ, Tmc1Δ/Δ, Tmc2Δ/Δ), timepoints (P7, P14, P28), and frequencies (8, 11.3, 16, 22.6, 32 kHz) in Figure 3A–C.
(B) Three-way and two-way ANOVA analyses of genotypes (wild-type [WT], Tmc1Δ/Δ;Tmc2Δ/Δ, Tmc1Δ/Δ, Tmiesr, Tmc1Bth), timepoints (P7, P28), and frequencies (8, 11.3, 16, 22.6, 32 kHz) in Figure 4A–C.(C) Two-way ANOVA analyses of genotypes (wild-type [WT], injected Tmc1Δ/Δ, Tmc1Δ/Δ), and frequencies (8, 11.3, 16, 22.6, 32 kHz) in Figure 6A.
- https://cdn.elifesciences.org/articles/69433/elife-69433-supp3-v2.xlsx
-
Supplementary file 4
Group comparisons at P7 and P28 for WT, Tmc1Δ/Δ;Tmc2Δ/Δ, and Tmiesrmice.
(A) Group comparisons of postnatal day 7 (P7) synapse counts per inner hair cell (IHC) (mean difference, 95% CI) in wild-type (WT), Tmc1Δ/Δ;Tmc2Δ/Δ, and Tmiesr mice. *p < 0.05, **p < 0.01, ***p < 0.001, non-significant (ns) > 0.05.
(B) Group comparisons of postnatal day 28 (P28) synapse counts per inner hair cell (IHC) (mean difference, 95% CI) in wild-type (WT), Tmc1Δ/Δ;Tmc2Δ/Δ, and Tmiesr mice. *p < 0.05, **p < 0.01, ***p < 0.001, non-significant (ns) > 0.05. (C) Group comparisons of postnatal day 28 (P28) synapse counts per inner hair cell (IHC) (mean difference, 95% CI) in wild-type (WT), Tmc1Δ/Δ, and Tmc1Bth mice. *p < 0.05, **p < 0.01, ***p < 0.001, non-significant (ns) > 0.05.
- https://cdn.elifesciences.org/articles/69433/elife-69433-supp4-v2.xlsx
-
Supplementary file 5
ABR thresholds (mean ± SD) in postnatal day 28 (P28) wild-type (WT) (n = 8) and injected Tmc1Δ/Δ (n = 12) mice.
- https://cdn.elifesciences.org/articles/69433/elife-69433-supp5-v2.xlsx
-
Supplementary file 6
Group comparisons for synapse counts and synapse volumes at P28.
(A) Group comparisons of postnatal day 28 (P28) synapse counts per inner hair cell (IHC) (mean difference, 95% CI) in wild-type (WT), Tmc1Δ/Δ, and injected Tmc1Δ/Δ mice. *p < 0.05, **p < 0.01, ***p < 0.001, non-significant (ns) > 0.05. (B) Normalized distribution of ribbon volumes (median± SD) in postnatal day 28 (P28) wild-type (WT), uninjected Tmc1Δ/Δ, and injected Tmc1Δ/Δ mice. (C) Statistical comparison of standard deviations of normalized ribbon volumes in postnatal day 28 (P28) wild-type (WT), uninjected Tmc1Δ/Δ, and injected Tmc1Δ/Δ mice. See (B) for SD values.
- https://cdn.elifesciences.org/articles/69433/elife-69433-supp6-v2.xlsx
-
Transparent reporting form
- https://cdn.elifesciences.org/articles/69433/elife-69433-transrepform1-v2.pdf
Download links
A two-part list of links to download the article, or parts of the article, in various formats.
Downloads (link to download the article as PDF)
Open citations (links to open the citations from this article in various online reference manager services)
Cite this article (links to download the citations from this article in formats compatible with various reference manager tools)
Sensory transduction is required for normal development and maturation of cochlear inner hair cell synapses
eLife 10:e69433.
https://doi.org/10.7554/eLife.69433


