Glycolytic preconditioning in astrocytes mitigates trauma-induced neurodegeneration
- Department of Molecular Biology, University of Texas Southwestern Medical Center, United States
- Department of Mechanical Engineering, University of Texas at Dallas, United States
- O’Donnell Brain Institute, University of Texas Southwestern Medical Center, United States
- Department of Neuroscience, University of Texas Southwestern Medical Center, United States
- Department of Integrative Biology, University of California, Berkeley, United States
- Hamon Center for Regenerative Science and Medicine, University of Texas Southwestern Medical Center, United States
Figures
Figure 1 with 1 supplement

Conserved vulnerability of dopaminergic neurons to trauma-induced degeneration.
(A) Post-trauma GFP retention in different C. elegans neuronal subtypes by large-particle flow cytometry. n=two sorts, n=1181 worms (dopaminergic), n=1265 worms (GABAergic), n=1115 worms (glutamatergic), n=3139 worms (serotonergic), and n=1117 worms (cholinergic). (B) Representative micrographs of GFP dopaminergic neuronal morphology in C. elegans pre-injury and 24 hr post-injury. Scale bar=20 μm. (C) Representative micrographs of tyrosine hydroxylase (TH; green) and cleaved caspase-3 (Casp3; gray) in the midbrain of 10 week-old mice subject to concussive injury. 1: VTA, 2: SNpc, 3: SNr. Scale bar=200 μm. (D) Quantification of cleaved caspase-3 staining in the midbrain. n=four uninjured, n=six injured. (E) Latency to fall off an accelerating rotating rod 7 days after concussive injury. n=five uninjured, n=eight injured. (F) Incidence of laser beam disruptions in cage per mouse over 24 hr, n=three per group. Data are mean ± SEM. *p ≤ 0.05, **p ≤ 0.01, ****p ≤ 0.0001.
Figure 1—figure supplement 1
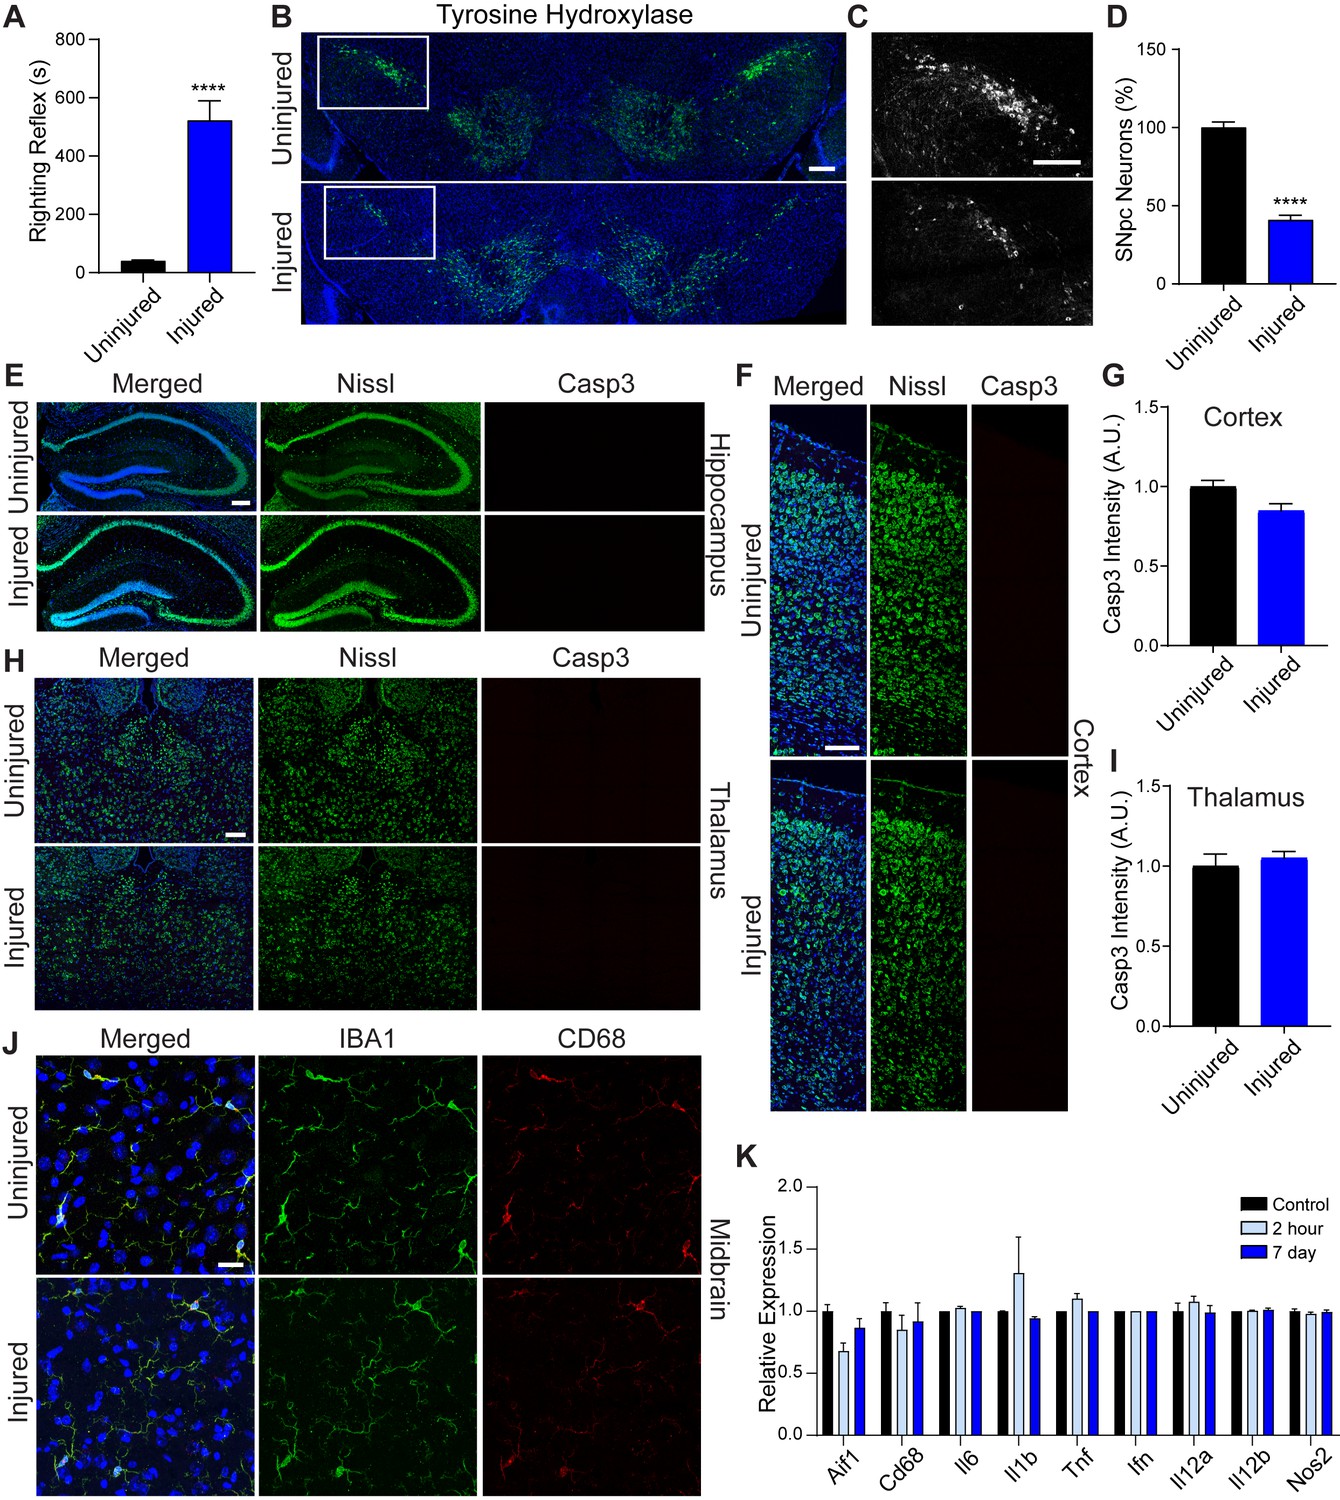
Immediate and long-term effects of concussive brain injury.
(A) Recovery of righting reflex immediately after concussive injury. n=seven uninjured, n=four injured. (B) Representative micrographs of tyrosine hydroxylase-positive neurons in the mouse midbrain before injury and 28 days after concussive injury. Scale bar=200 μm. (C) Insert from B of SNpc neurons expressing tyrosine hydroxylase. Scale bar=200 μm. (D) SNpc neurons expressing tyrosine hydroxylase counted in the substantia of 10 week-old mice. n=four uninjured, n=five injured. (E) Representative micrographs of Nissl (green) and cleaved caspase-3 (Casp3; red), in the mouse hippocampus 7 days post-injury. Scale bar=100 μm. (F) Representative micrographs of Nissl (green) and cleaved caspase-3 (Casp3; red), in the mouse visual cortex 7 days post-injury. Scale bar=40 μm. (G) Quantification of cleaved caspase-3 intensity in the visual cortex. n=five uninjured, n=five injured. (H) Representative micrographs of Nissl (green) and cleaved caspase-3 (Casp3; red), in the mouse thalamus 7 days post-injury. Scale bar=40 μm. (I) Quantification of cleaved caspase-3 intensity in the thalamus. n=six uninjured, n=five injured. (J) Representative micrographs of IBA1 (green) and CD68 (red) in the midbrain of 10 week-old mice. Scale bar=20 μm. (K) Relative transcript abundance from RNAseq. n=3 (control), n=4 (2 hours post-injury), n=3 (7 days post-injury). Data are mean ± SEM. ****p < 0.0001.
Figure 2 with 1 supplement
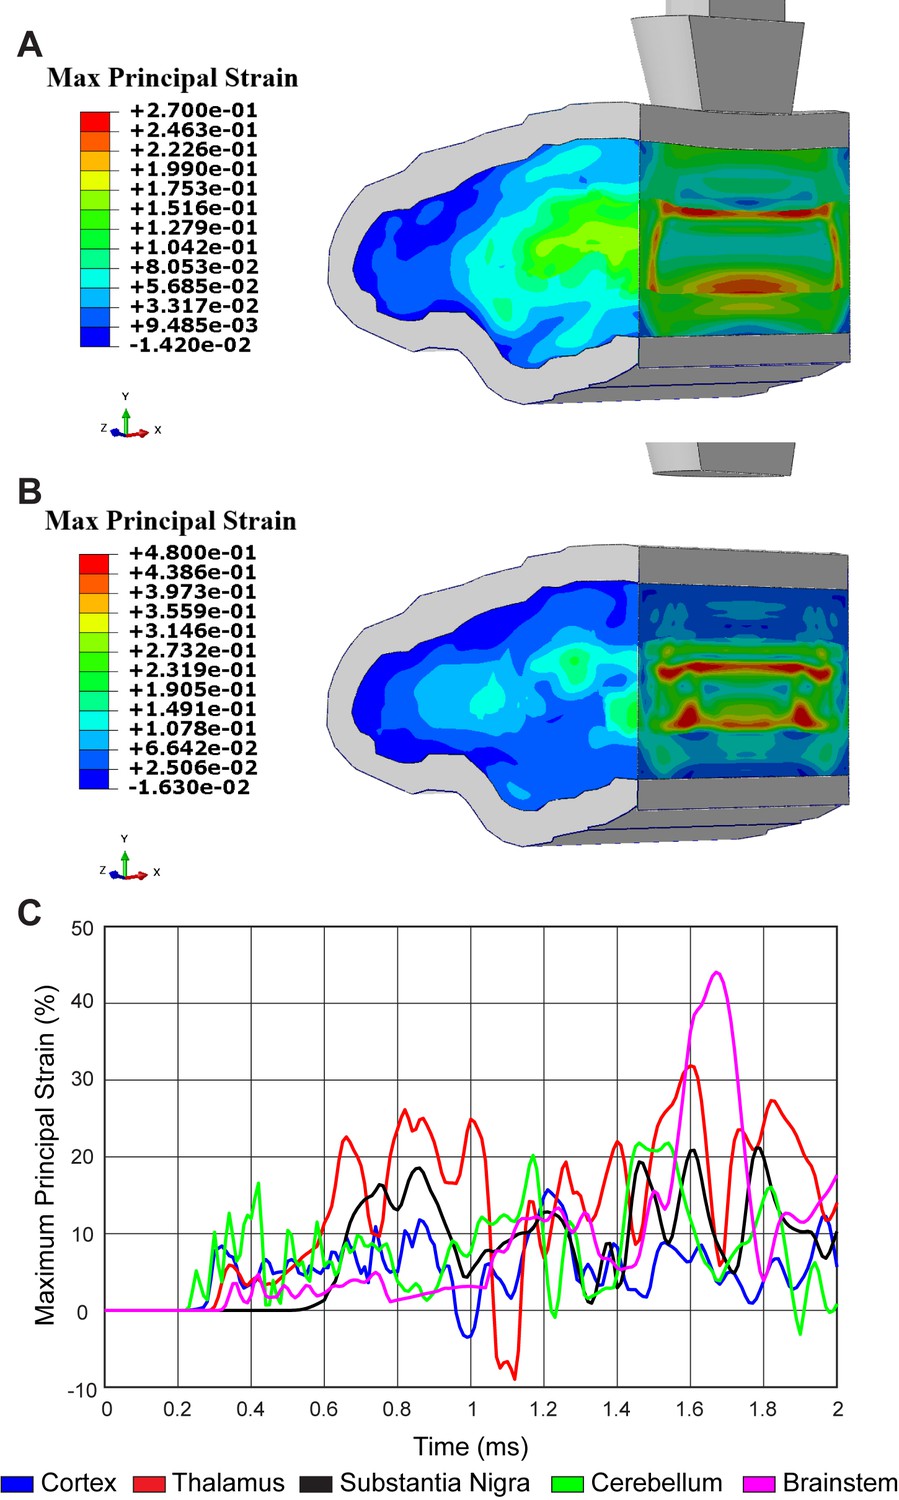
Concussive head trauma propagates strain throughout the brain.
Heat map of representative brain shows predicted maximum principal strain at (A) 0.85 ms and (B) 1.64 ms after initial impact. (C) Time history of maximum principal strain within the cortex (blue), thalamus (red), substantia nigra (black), cerebellum (green), and brainstem (magenta).
Figure 2—figure supplement 1
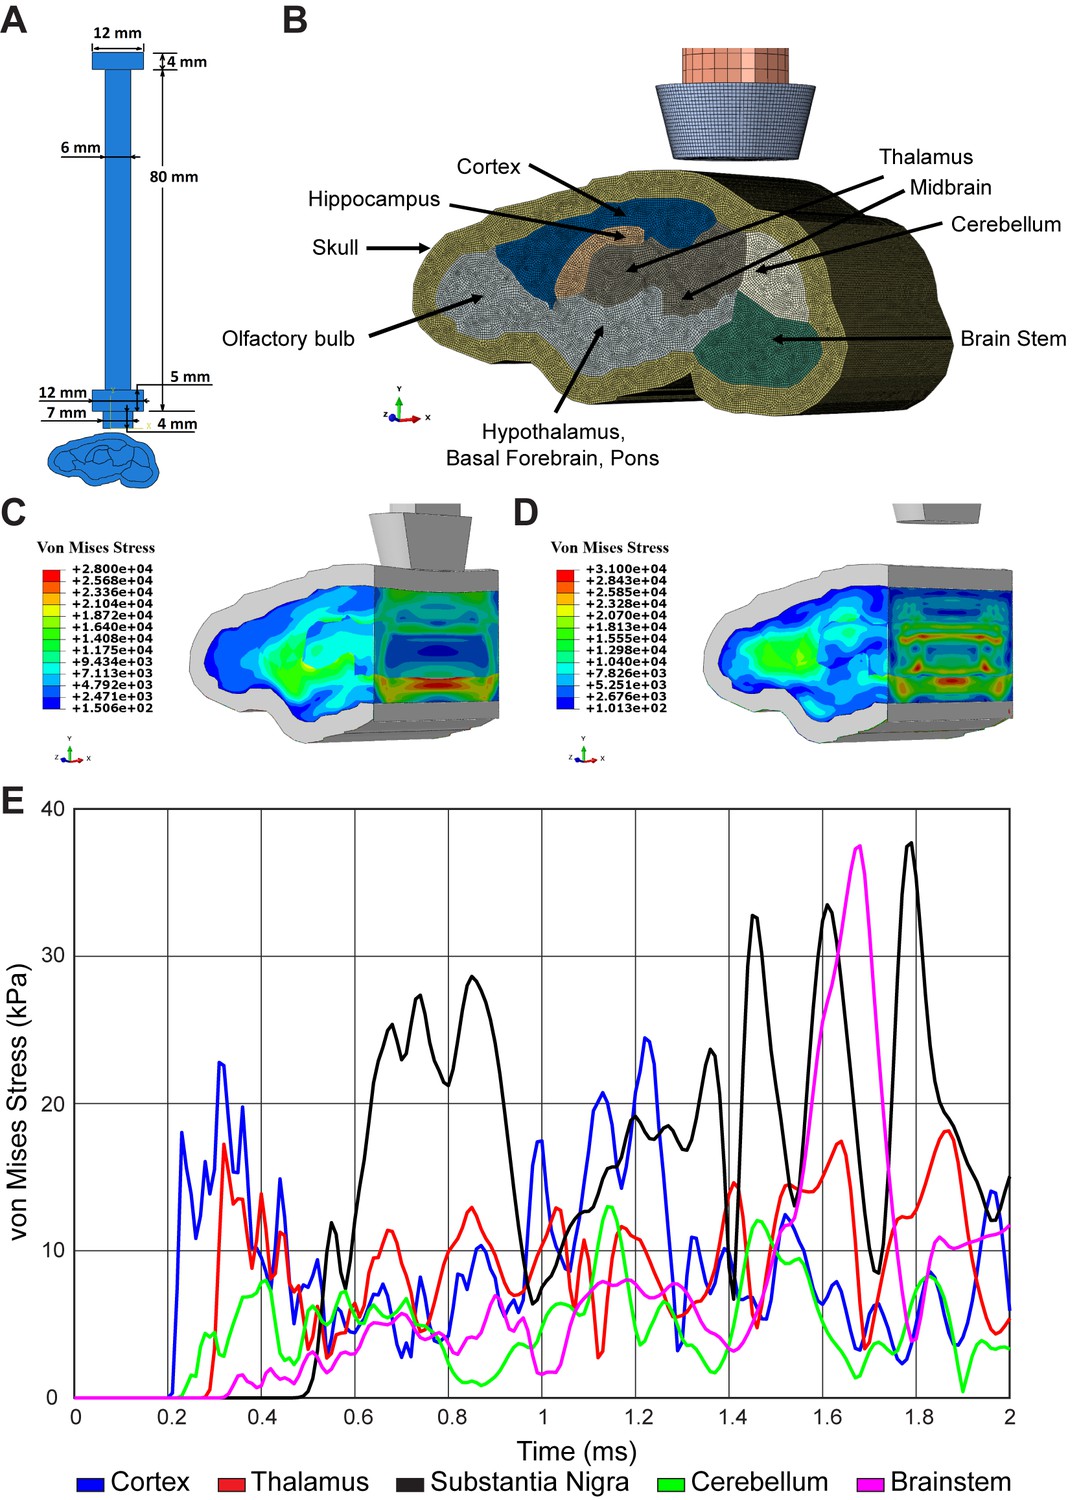
Finite element model of concussive head injury in the mouse.
(A) Measurement for impactor on brain injury device. (B) Finite element model of the impactor, skull, and brain regions with standardized material properties. Finite element model of the mouse brain at (C) 0.85 milliseconds and (D) 1.64 milliseconds post-impact. Heat map provides predicted von Mises stress. (E) Time history of von Mises stress after impact within the cortex (blue), thalamus (red), substantia nigra (black), cerebellum (green), and brainstem (magenta).
Figure 3 with 1 supplement
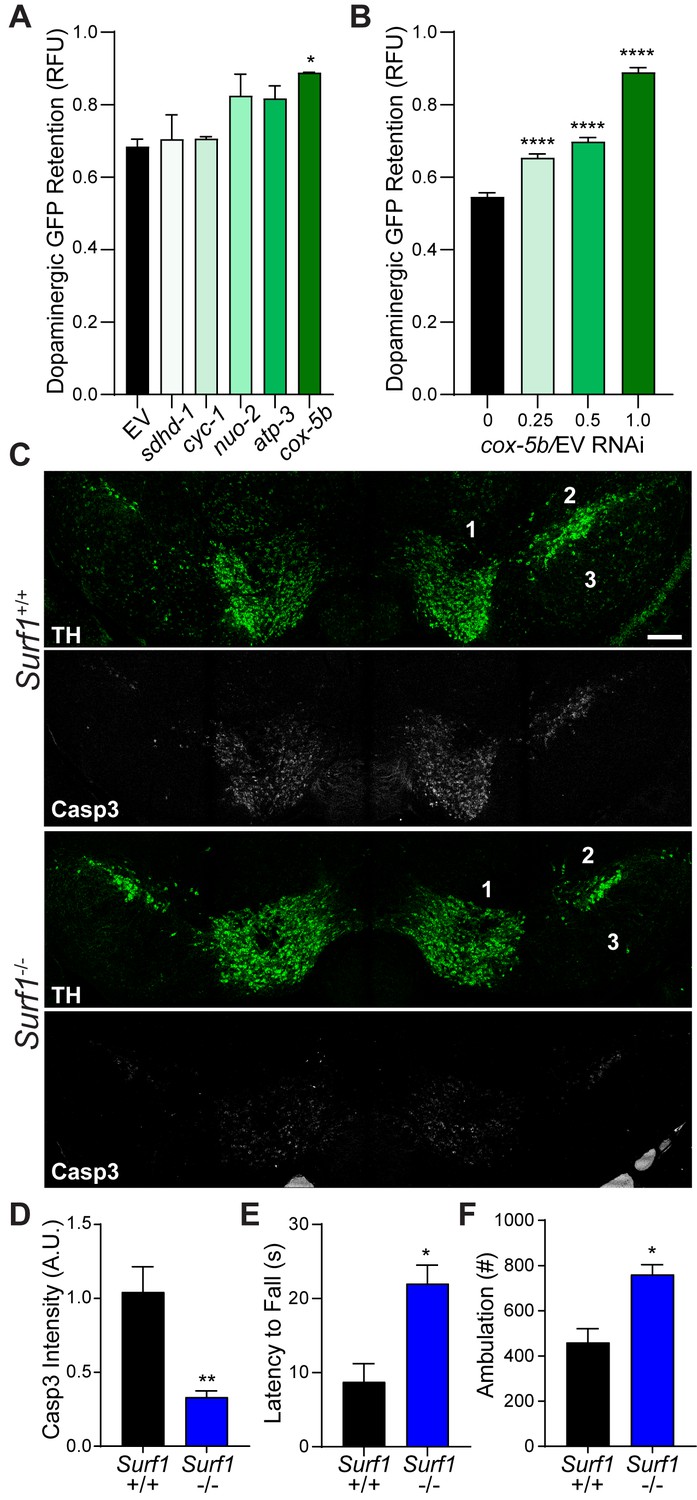
Conserved protection against trauma-induced neurodegeneration by reducing cytochrome C oxidase.
(A) Post-trauma GFP retention in dopaminergic neurons of C. elegans by large-particle flow cytometry with the respective RNAi for ETC subunit components. n=two sorts, n=3344 worms (nuo-2), n=2343 worms (sdhd-1), n=3825 (cyc-1), n=2973 (cox-5b), n=3265 (atp-3), n=1948 (EV). (B) Post-trauma GFP retention in dopaminergic neurons of C. elegans treated with cox-5b/EV RNAi dilutions. n=six sort, n=512 worms (0), n=827 worms (0.25), n=900 worms (0.5), n=832 worms (1). (C) Representative micrographs of tyrosine hydroxylase (TH, green) and cleaved caspase-3 (Casp3, gray) in the midbrain of 10-week-old Surf1+/+ or Surf1-/- mice subject to concussive injury. 1: VTA, 2: SNpc, 3: SNr. Scale bar=200 μm. (D) Quantification of cleaved caspase-3 staining in the midbrain. n=5 Surf1+/+, n=6 Surf1-/-. (E) Latency to fall off rotating rod 7 days after concussive injury (n=four per group). (F) Incidence of laser beam disruptions per mouse over 24 hr (n=three per group). Data are mean ± SEM. *p ≤ 0.05, **p ≤ 0.01, and ****p ≤ 0.0001.
Figure 3—figure supplement 1
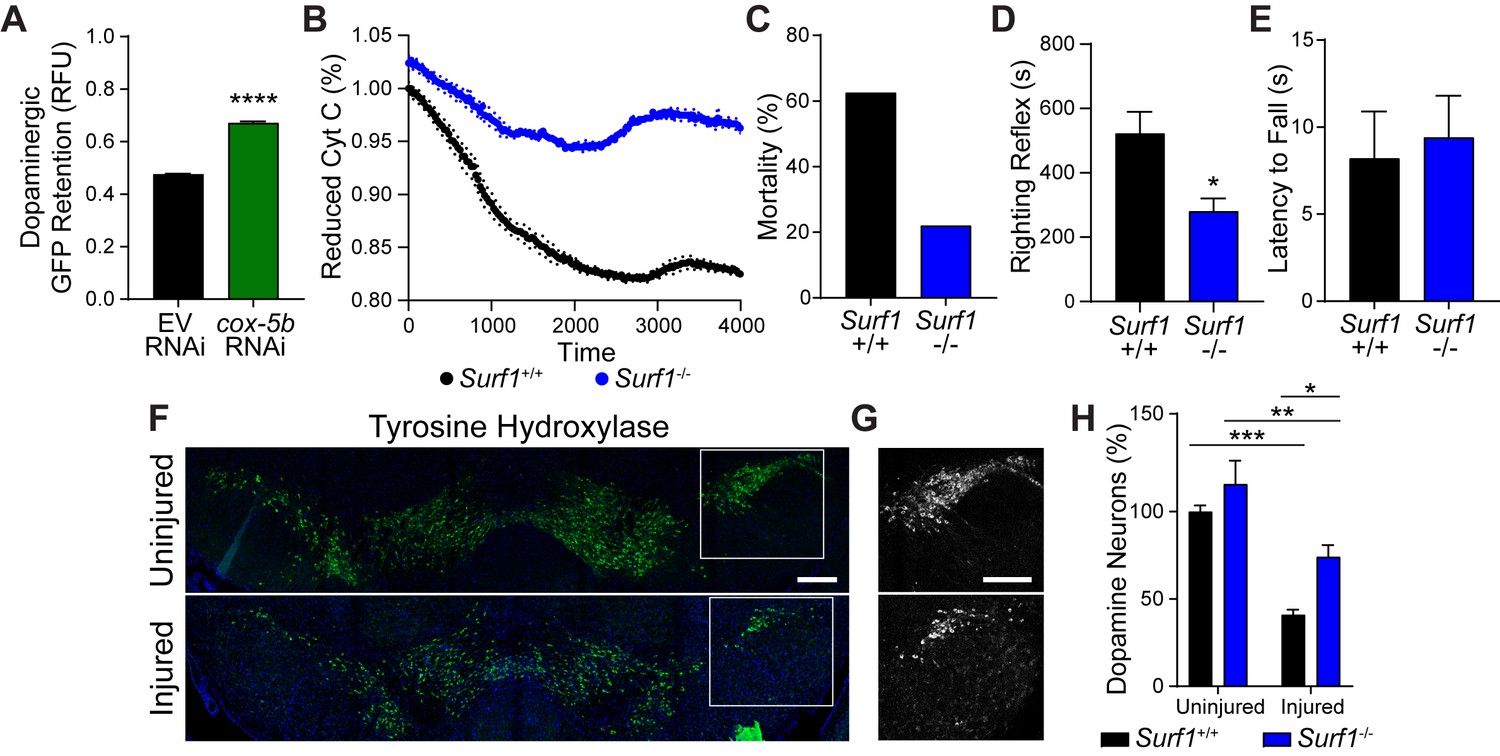
Reduced cytochrome C oxidase impact after concussive brain injury.
(A) Post-trauma retention of GFP fluorescence in dopaminergic neurons of PMD63 C. elegans treated with cox-5b RNAi and measured by large-particle flow cytometry. n=5226 worms (EV RNAi), n=3238 worms (cox-5b RNAi) across three independent trials. (B) Time-course for conversion of cytochrome C to an oxidized state. n=6 Surf1+/+, n=3 Surf1-/- . (C) Percent mortality after severe injury. n=7 Surf1+/+, n=9 Surf1-/-. (D) Righting reflex immediately post-injury. n=4 Surf1+/+, n=6 Surf1-/- . (E) Latency to fall off rotating rod at baseline (uninjured). n=five per group. (F) Representative micrographs of tyrosine hydroxylase-positive neurons in the Surf1-/- mouse midbrain 28 days after concussive injury. Scale bar=200 μm. (G) Insert from F of SNpc neurons expressing tyrosine hydroxylase. Scale bar=200 μm. (H) Neurons expressing tyrosine hydroxylase counted in the substantia nigra of 10 week-old Surf1+/+ and Surf1-/- mice. n=four uninjured, n=five injured. Data are mean ± SEM. *p ≤ 0.05, **p ≤ 0.01, and ***p ≤ 0.001.
Figure 4 with 1 supplement
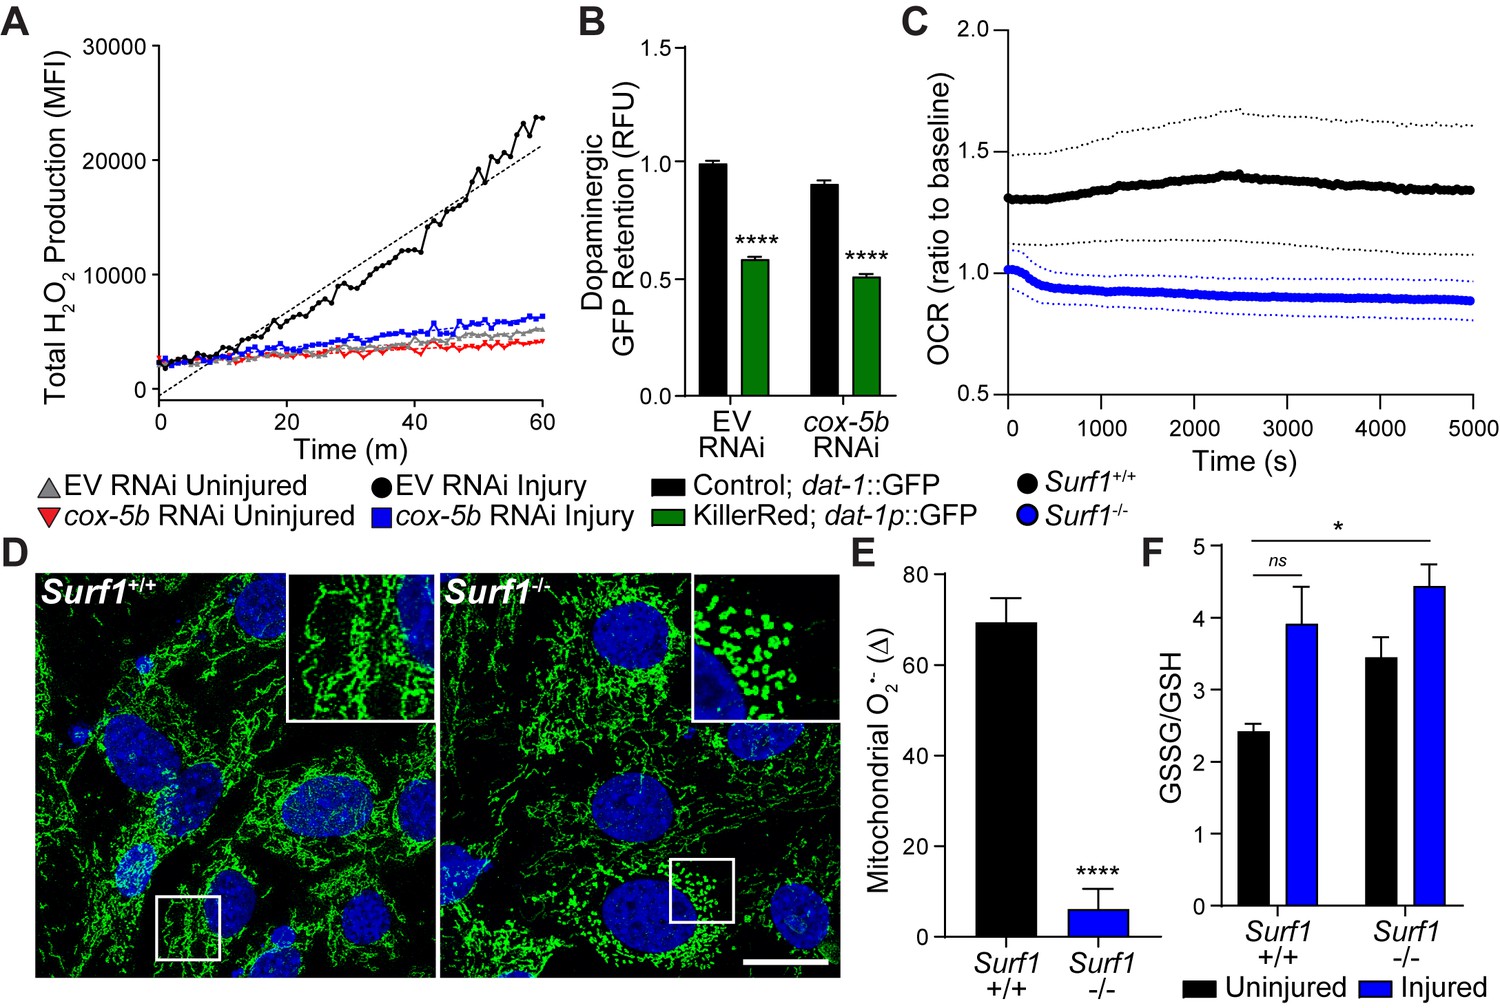
Reducing cytochrome C oxidase prevents trauma-induced ROS production.
(A) Time-course of peroxide levels in C. elegans post-trauma. n=three repeats per group. (B) GFP retention in dopaminergic neurons of C. elegans ectopically expressing the mitochondrial-targeted KillerRed fluorophore in neurons. n=three repeats per group. (C) Oxygen consumption rate, OCR, in Surf1+/+ and Surf1-/- mouse embryonic fibroblasts. n=3 Surf1+/+, n=2 Surf1-/-. (D) Representative micrographs of TOM20 (green) and DAPI (blue) in Surf1+/+ and Surf1-/-mouse embryonic fibroblasts. Scale bar=20 μm. (E) Trauma-induced superoxide production in mitochondria from Surf1+/+ and Surf1-/- brain single cell suspensions 2 hr post-injury. n=three per group. (F) Oxidized glutathione (GSSG) over glutathione (GSH) from metabolite analysis of Surf1+/+ and Surf1-/- brain tissue subject to concussive injury. n=three per group. Data are mean ± SEM. *p ≤ 0.0116, ns (not significant, p = 0.0524) and ****p ≤ 0.0001.
Figure 4—figure supplement 1
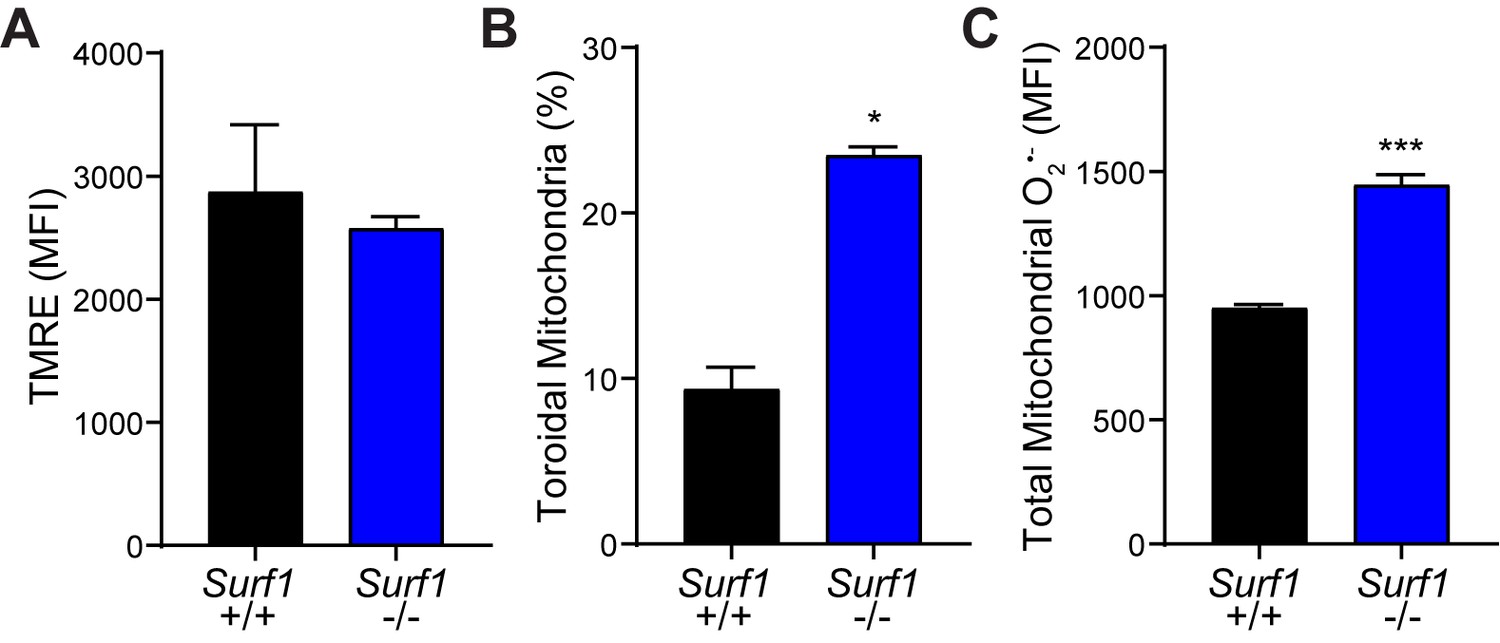
Mitochondrial dynamics in embryonic fibroblasts.
(A) Mitochondrial membrane potential by tetramethylrhodamine, ethyl ester (TMRE) fluorescence. n=3 Surf1+/+, n=3 Surf1-/-. (B) Percent fibroblasts with toroidal mitochondrial morphology. n=10 Surf1+/+, n=19 Surf1-/- micrographs. (C) Basal mitochondrial superoxide levels from Surf1+/+ and Surf1-/- brains. n=3 per group. Data are mean ± SEM. *p ≤ 0.05 and ***p ≤ 0.001.
Figure 5 with 2 supplements
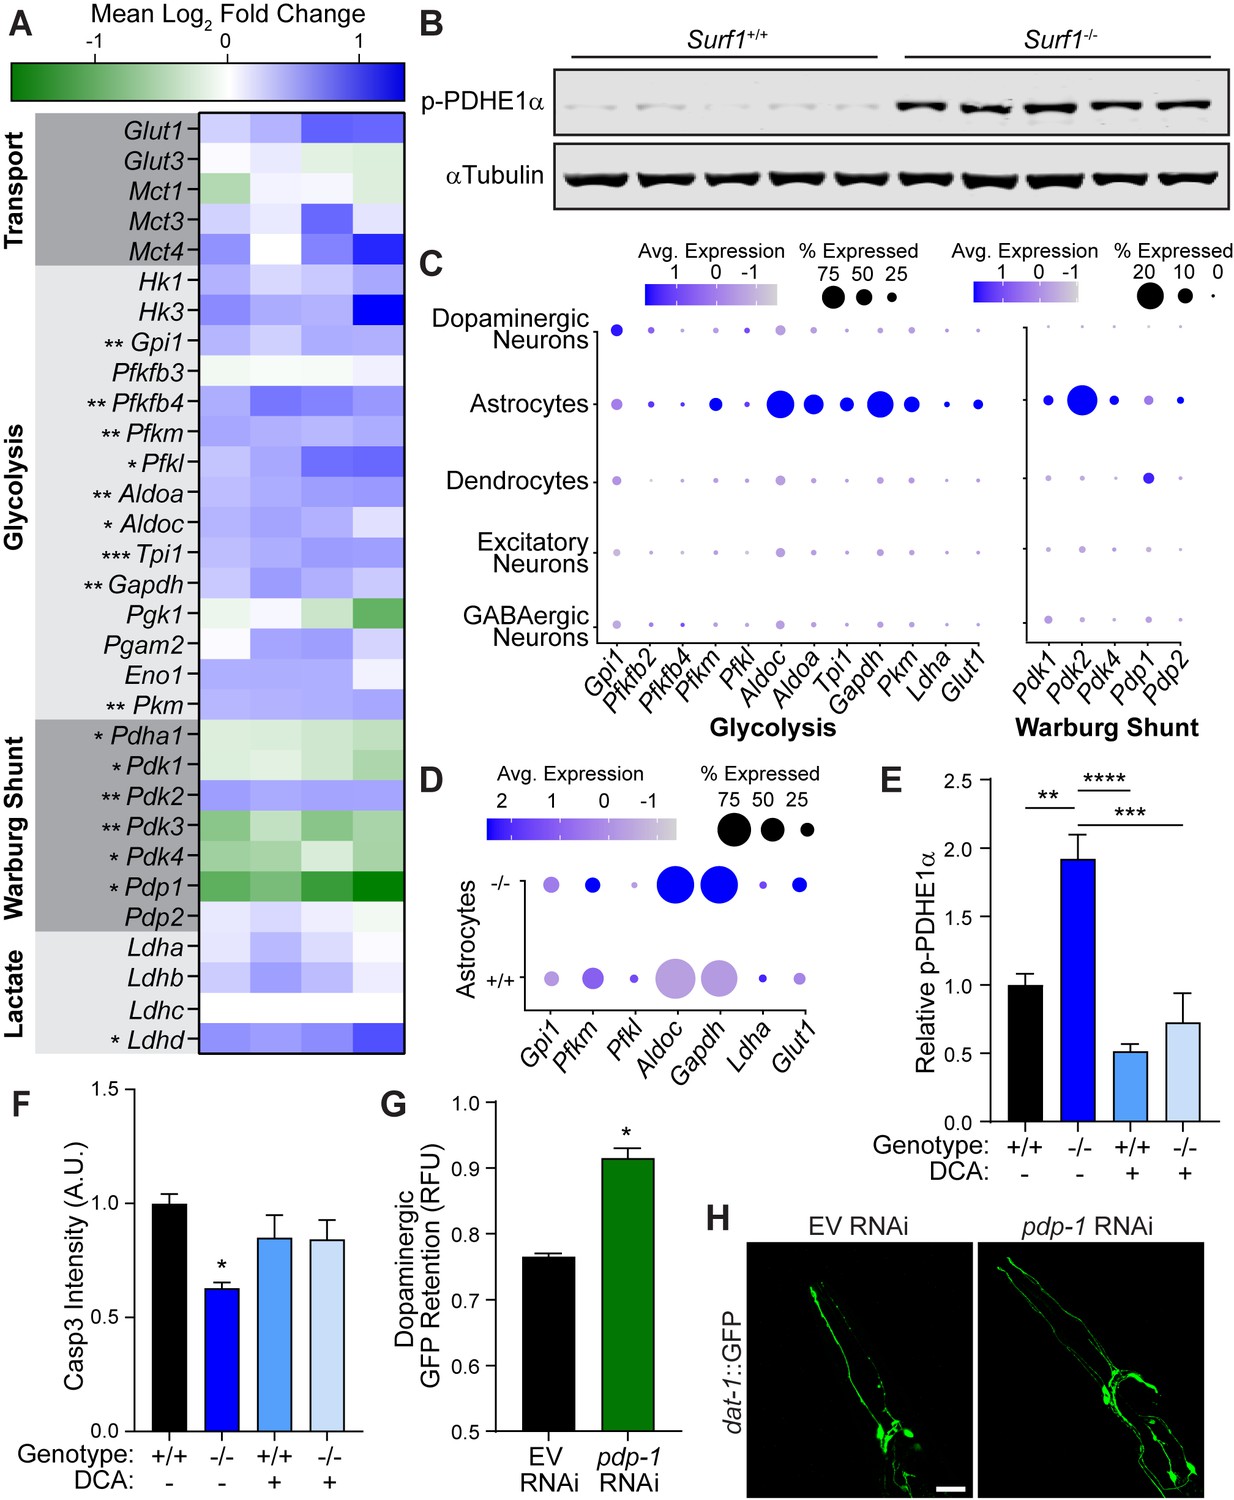
Impaired cytochrome C oxidase increases glycolysis in astrocytes through a Warburg-like effect.
(A) Heat map of transcriptional differences in Surf1+/+ versus Surf1-/- brains. n=4. Significance denoted next to gene. (B) Western blots of phosphorylated PDHE1α at Ser293 and αTubulin from Surf1+/+ and Surf1-/- brains, 7 days post-injury. (C) Dot plot of single nuclei RNAseq of glycolytic and Warburg-related genes in neuronal cell subtypes from Surf1+/+ and Surf1-/- brains. (D) Dot plot of single nuclei RNAseq of glycolytic genes in astrocytes from Surf1+/+ and Surf1-/- brains. (E) Quantification of phosphorylated PDHE1α at Ser293 and αTubulin from Surf1+/+ and Surf1-/- brains after NaCl and dichloroacetate (DCA) treatment. (F) Quantification of cleaved caspase-3 immunostaining in NaCl and DCA treated Surf1+/+ (n=3) and Surf1-/- (n=4) brains 7 days post-injury. (G) Post-trauma retention of GFP fluorescence in dopaminergic neurons of C. elegans treated with pdp-1 RNAi and measured by large-particle flow cytometry. n=1758 worms (EV RNAi), n=2307 worms (pdp-1 RNAi) across two independent trials. (H) Representative micrographs of GFP dopaminergic neuronal morphology in injured C. elegans treated with pdp-1 RNAi. Scale bar=20 μm. Data are mean ± SEM. *p ≤ 0.05, **p ≤ 0.01, ***p ≤ 0.001, and ****p ≤ 0.0001.
Figure 5—figure supplement 1
Warburg effect in concussive brain injury.
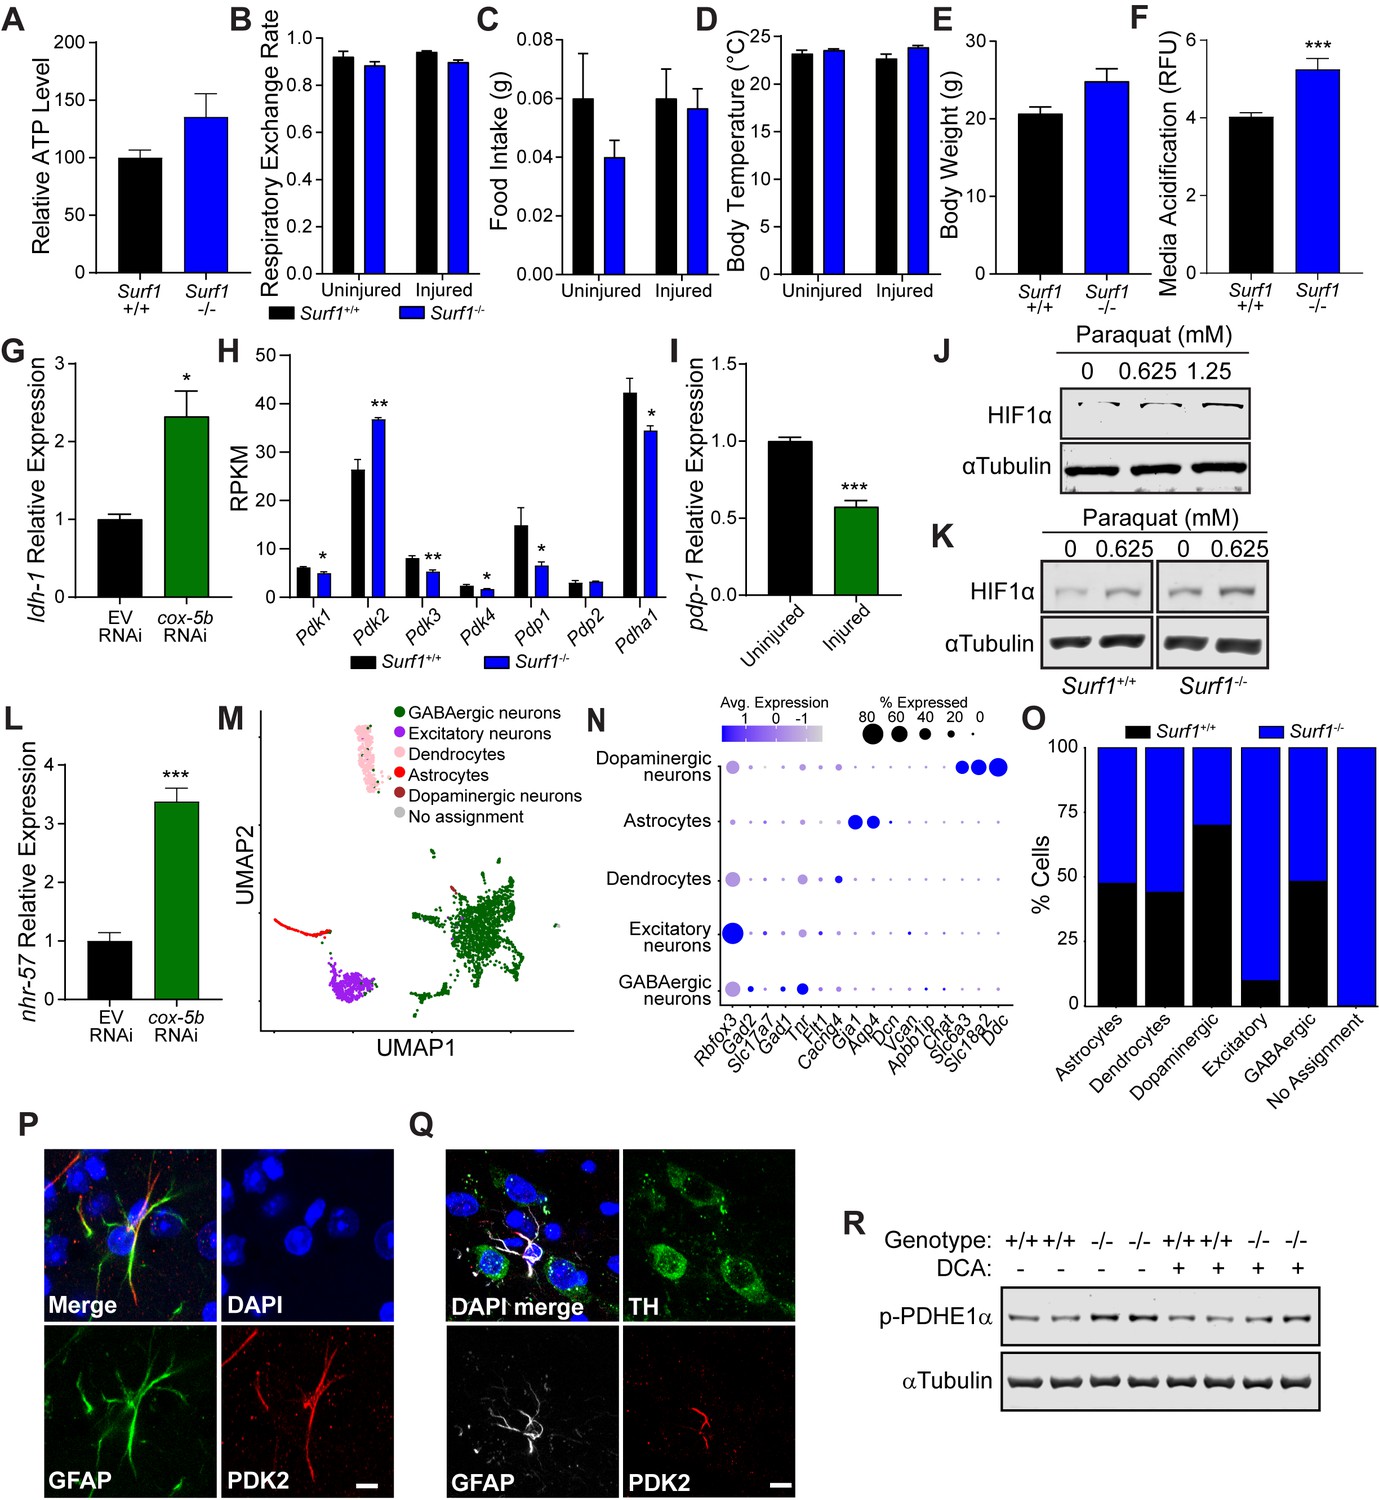
(A) Relative ATP levels from Surf1+/+ and Surf1-/- brain single cell suspensions. n=5 Surf1+/+, n=4 Surf1-/-. (B to E) Metabolic cage analysis of Surf1+/+ and Surf1-/- mice subject to concussive injury show: (B) respiratory exchange rate, (C) food intake, (D) body temperature, and (E) body weight. n=3 Surf1+/+ , n=3 Surf1-/-. (F) Acidification of extracellular media measured from absorbance at 585nm from Surf1+/+ and Surf1-/- mouse embryonic fibroblasts, n=3 per group. (G) Relative transcript abundance of ldh-1 in C. elegans with cox-5b RNAi. n=3 per group. (H) Transcript abundance from RNAseq in reads per kilobase million. n=3 Surf1+/+ , n=4 Surf1-/-. (I) Relative pdp-1 transcript abundance by RNAseq in C. elegans subject to blunt force injury. n=3 per group. (J) Western blot of HIF1α from HEK293 cells treated with paraquat at varying concentrations. (K) Western blot of HIF1α from Surf1+/+ and Surf1-/- mouse embryonic fibroblasts treated with 0 and 0.625 mM paraquat. (L) Relative nhr-57 transcript abundance by RNAseq in C. elegans with cox-5b RNAi. n=3 per group. (M) UMAP clustering of snRNAseq from midbrain and striatal brain regions. (N) Gene enrichment in cell clusters defined in M. (O) Percent distribution of clustered cell types in Surf1+/+ and Surf1-/- mice. (P) Immunostaining of astrocytes (GFAP, green) and PDK2 (red) in the midbrain. Scale bar=5 μm. (Q) Immunostaining of astrocytes (GFAP, gray), PDK2 (red), and dopaminergic neurons (TH, green) in the midbrain. Scale bar=5 μm. (R) Western blot of phosphorylated PDHE1α at Ser293 and αTubulin from Surf1+/+ and Surf1-/- brains, 24 hr post NaCl or DCA treatment. Data are mean ± SEM. *p ≤ 0.05, **p ≤ 0.01, and ***p ≤ 0.001.
Figure 5—figure supplement 2
Pyruvate dehydrogenase complex dynamics in blunt force trauma and concussive brain injury.
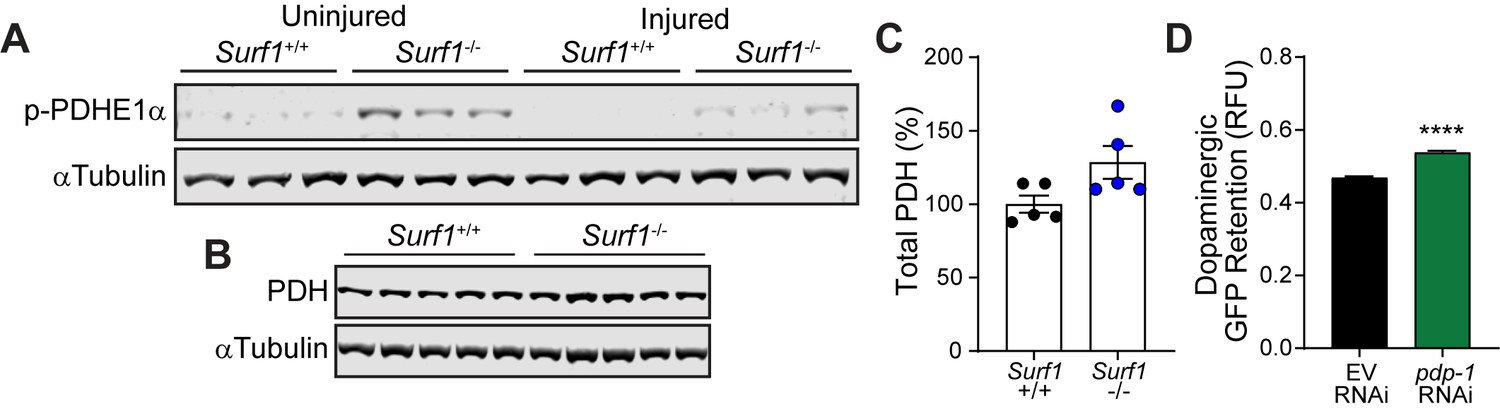
(A) Western blot of phosphorylated PDHE1α at Ser293 and αTubulin from Surf1+/+ and Surf1-/- brains 7 days post-injury. (B) Western blot of total baseline PDH and αTubulin from Surf1+/+ and Surf1-/- brains. (C) Western blot densitometry of PDH normalized to αTubulin from B. (D) Post-trauma retention of GFP fluorescence in dopaminergic neurons of PMD63 C. elegans treated with pdp-1 RNAi and measured by large-particle flow cytometry. n=5226 worms (EV RNAi), n=1703 worms (pdp-1 RNAi) across three independent trials. Data are mean ± SEM. ****p < 0.0001.
Videos
Video 1
Maximum principal stress propagation throughout the mouse brain after impact.
Video 2
Von Mises stress propagation throughout the mouse brain after impact.
Tables
Table 1
Viscoelastic parameters for P56 mouse brain.
| Brain region | G0 (Pa) | g1 | g2 | gl | τ1 (ms) | τ2 (ms) |
|---|---|---|---|---|---|---|
| Pons | 7643 | 0.578 | 0.267 | 0.162 | 12 | 182 |
| Cortex | 6343 | 0.568 | 0.264 | 0.168 | 14 | 182 |
| Cerebellum | 2807 | 0.518 | 0.31 | 0.171 | 14 | 190 |
| Thalamus | 2674 | 0.578 | 0.248 | 0.174 | 15 | 206 |
| Medulla | 3859 | 0.52 | 0.3 | 0.18 | 17 | 226 |
| Hippocampus | 5422 | 0.187 | 0.554 | 0.121 | 265 | 18 |
Table 2
Material parameters for the impactor.
| Component | Density | Young’s Modulus | Poisson’s Ratio |
|---|---|---|---|
| Brass (impactor body, head) | 8480 kg/m3 | 100 GPa | 0.34 |
| Nylon (impactor nut) | 1120 kg/m3 | 2.3 GPa | 0.4 |
Additional files
-
Source data 1
Uncropped western blot images.
- https://cdn.elifesciences.org/articles/69438/elife-69438-data1-v2.zip
-
Transparent reporting form
- https://cdn.elifesciences.org/articles/69438/elife-69438-transrepform-v2.docx
Download links
A two-part list of links to download the article, or parts of the article, in various formats.
Downloads (link to download the article as PDF)
Open citations (links to open the citations from this article in various online reference manager services)
Cite this article (links to download the citations from this article in formats compatible with various reference manager tools)
Glycolytic preconditioning in astrocytes mitigates trauma-induced neurodegeneration
eLife 10:e69438.
https://doi.org/10.7554/eLife.69438


