Towards novel herbicide modes of action by inhibiting lysine biosynthesis in plants
- Department of Biochemistry and Genetics, La Trobe Institute for Molecular Science, La Trobe University, Australia
- Australian Synchrotron, ANSTO, Australia
- Department of Molecular Biology and Biochemistry, Monash University, Australia
- Department of Chemistry and Physics, La Trobe Institute for Molecular Science, La Trobe University, Australia
- Department of Animal, Plant and Soil Sciences, AgriBio, La Trobe University, Australia
- Australian Research Council Research Hub for Medicinal Agriculture, Australia
Figures
Figure 1

Lysine biosynthesis in plants.
Plants utilise the diaminopimelate (DAP) pathway, a branch of the aspartate-derived super-pathway, to synthesise l-lysine. Firstly, l-aspartate semialdehyde (ASA) and pyruvate are converted to (4S)−4-hydroxy-2,3,4,5-tetrahydro-(2S)-dipicolinic acid (HTPA) in a condensation reaction catalysed by dihydrodipicolinate synthase (DHDPS). Dihydrodipicolinate reductase (DHDPR) then catalyses an NAD(P)H-dependent reduction of HTPA to produce 2,3,4,5-tetrahydrodipicolinate (THDP). THDP subsequently undergoes an amino-transfer reaction with l-glutamate, catalysed by diaminopimelate aminotransferase (DAPAT), to yield l,l-DAP. l,l-DAP is converted to meso-DAP by diaminopimelate epimerase (DAPEpi) and lastly, meso-DAP is decarboxylated by diaminopimelate decarboxylase (DAPDC) to yield l-lysine, which imparts a negative feedback loop on DHDPS.
Figure 2 with 1 supplement

Structure and sequence conservation of plant DHDPS enzymes.
(A) Cartoon structure of Arabidopsis thaliana (At) DHDPS1 (PDB: 6VVI) in the unliganded form illustrating the ‘back-to-back’ homotetramer conformation. (B) Cartoon structure of AtDHDPS1, with residues critical for catalysis shown as sticks. (C) Multiple sequence alignment of residues important for catalysis. (D) Cartoon structure of AtDHDPS1, with residues important for lysine binding and allosteric regulation shown as sticks. Residues are coloured by nitrogen (blue), oxygen (red), and sulfur (yellow). Images were generated using PyMOL v 2.2 (Schrödinger). (E) Multiple sequence alignment of residues involved in allosteric lysine binding. Sequences are AtDHDPS1 (At1; UNIPROT ID: Q9LZX6), AtDHDPS2 (At2; UNIPROT ID: Q9FVC8), Arabidopsis lyrata DHDPS1 (Al1; UNIPROT ID: D7LRV3), Nicotiana tabacum DHDPS (Nt; UNIPROT ID: Q42948), Oryza sativa DHDPS1 (Os1; UNIPROT ID: A0A0K0K9A6), Solanum lycopersicum DHDPS1 (Sl1; UNIPROT ID: A0A3Q7IMG0), Triticum aestivum DHDPS1 (Ta1; UNIPROT ID: P24846), Vitis vinifera DHDPS1 (Vv1; UNIPROT ID: A0A438E022), Zea mays DHDPS1 (Zm1; UNIPROT ID: P26259), and Escherichia coli (Ec) DHDPS (UNIPROT ID: P0A6L2). Residues are numbered according to AtDHDPS1 with dots (.) representing interspacing residues. Sequences were aligned in BioEdit (v 7.2.5) (Hall, 1999) using the ClustalW algorithm (Thompson et al., 1994).
Figure 2—figure supplement 1
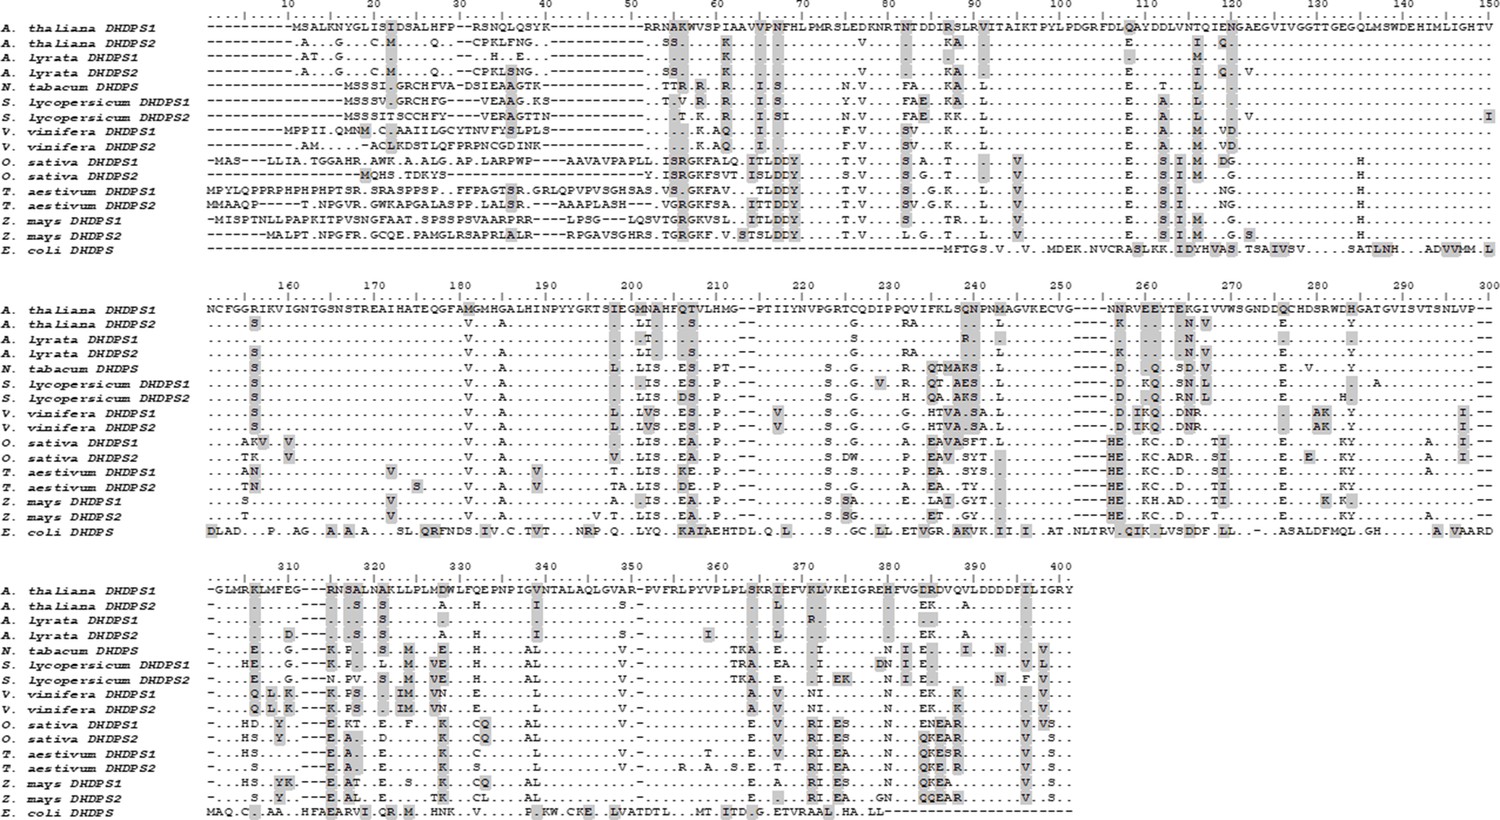
Sequence alignment of plant DHDPS enzymes.
Arabidopsis thaliana DHDPS1 (UNIPROT ID: Q9LZX6) and DHDPS2 (UNIPROT ID: Q9FVC8), Arabidopsis lyrata DHDPS1 (UNIPROT ID: D7LRV3) and DHDPS2 (UNIPROT ID: D7LCJ3), Nicotiana tabacum DHDPS (UNIPROT ID: Q42948), Oryza sativa DHDPS1 (UNIPROT ID: A0A0K0K9A6) and DHDPS2 (UNIPROT ID: Q9LWB9), Solanum lycopersicum DHDPS1 (UNIPROT ID: A0A3Q7IMG0) and DHDPS2 (UNIPROT ID: A0A3Q7FJL9), Triticum aestivum DHDPS1 (UNIPROT ID: P24846) and DHDPS2 (UNIPROT ID: P24847), Vitis vinifera DHDPS1 (UNIPROT ID: A0A438E022) and DHDPS2 (UNIPROT ID: D7U7T8), Zea mays DHDPS1 (UNIPROT ID: P26259) and DHDPS2 (UNIPORT ID: B4FLW2), and Escherichia coli DHDPS (UNIPROT ID: P0A6L2). Residues are numbered according to AtDHDPS1; identical residues are shown as dots (.), gaps are shown as dashes (-), and similar residues are highlighted in grey. Sequences were aligned in BioEdit (v 7.2.5) using the ClustalW algorithm.
Figure 3
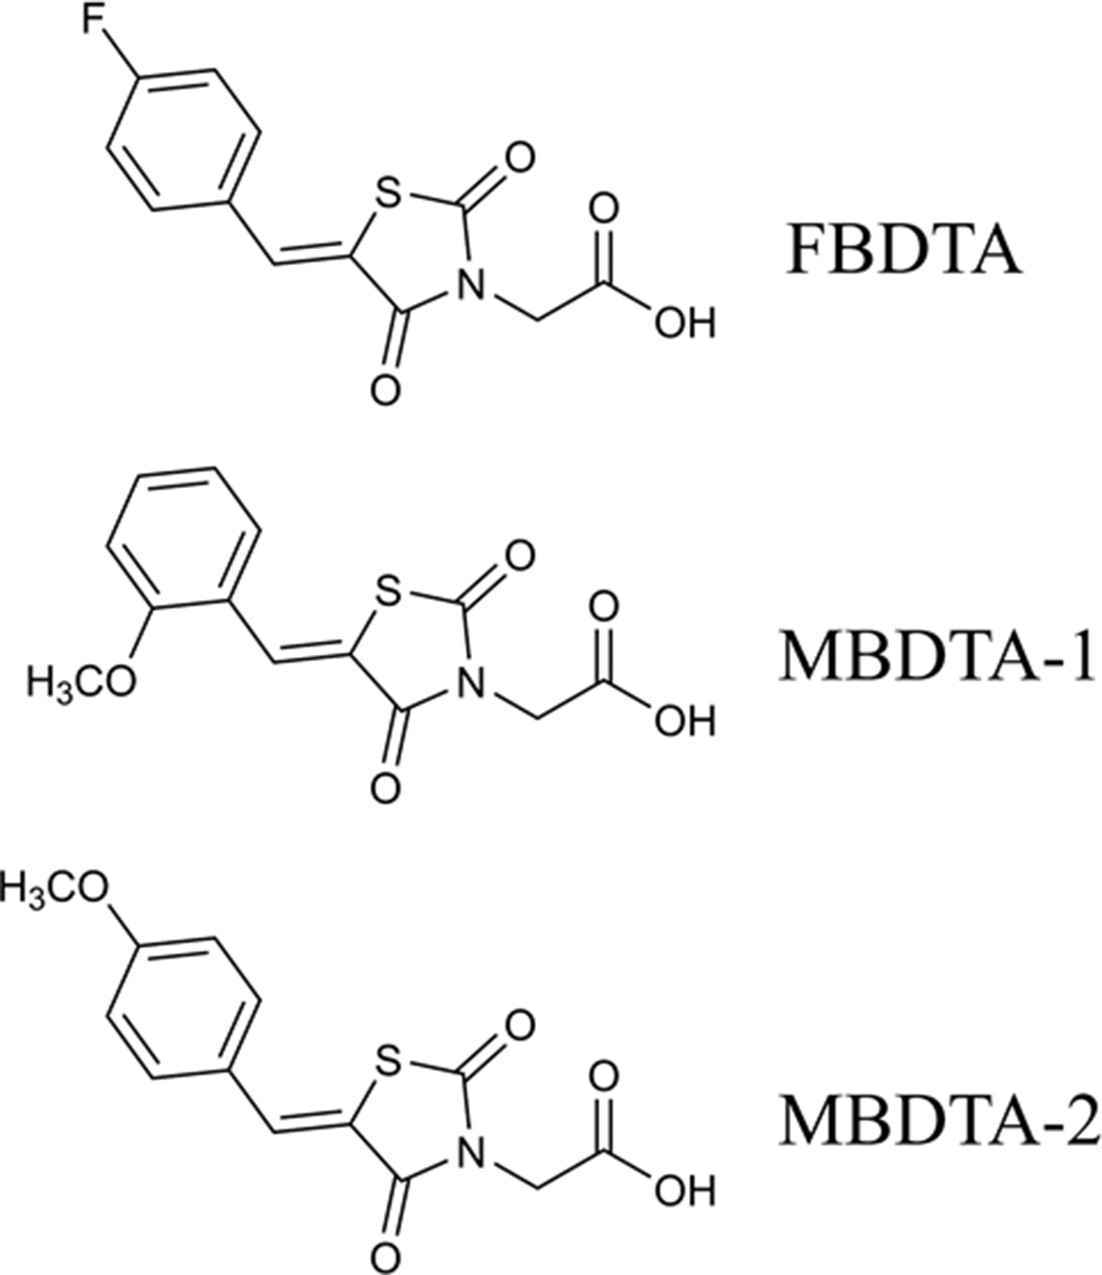
Structure of DHDPS inhibitors.
Chemical structures of the hit compound, (Z)−2-(5-(4-fluorobenzylidene)−2,4-dioxothiazolidin-3-yl)acetic acid (FBDTA), and two analogues, (Z)−2-(5-(2-methoxybenzylidene)−2,4-dioxothiazolidin-3-yl)acetic acid (MBDTA-1) and (Z)−2-(5-(4-methoxybenzylidene)−2,4-dioxothiazolidin-3-yl)acetic acid (MBDTA-2).
Figure 4
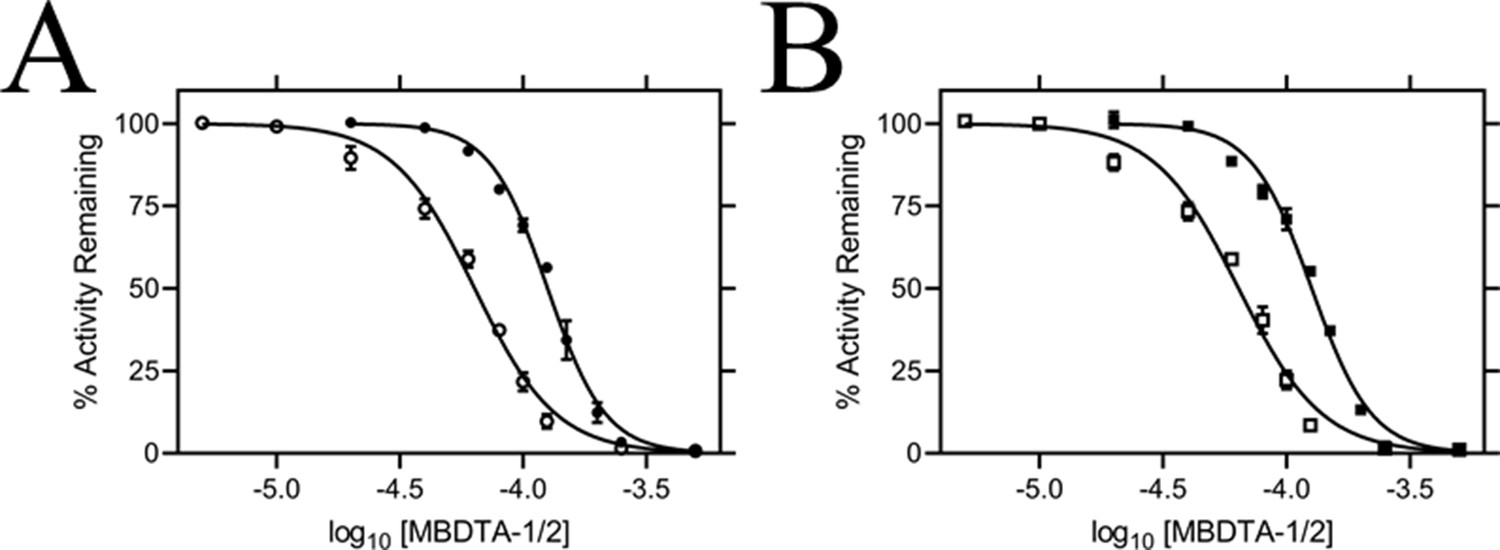
In vitro potency of DHDPS inhibitors.
Dose responses of MBDTA-1 (● or ■) and MBDTA-2 (○ or □) against recombinant (A) AtDHDPS1 and (B) AtDHDPS2. Initial enzyme rates were normalised against a vehicle control (1% [v/v] DMSO). Normalised data (% activity remaining) is plotted as a function of log10[inhibitor] and fitted to a nonlinear regression model (solid line) (R2 = 0.99). Data represents mean ± S.E.M. (N = 3).
-
Figure 4—source data 1
In vitropotency of DHDPS inhibitors.
- https://cdn.elifesciences.org/articles/69444/elife-69444-fig4-data1-v2.xlsx
Figure 5 with 1 supplement
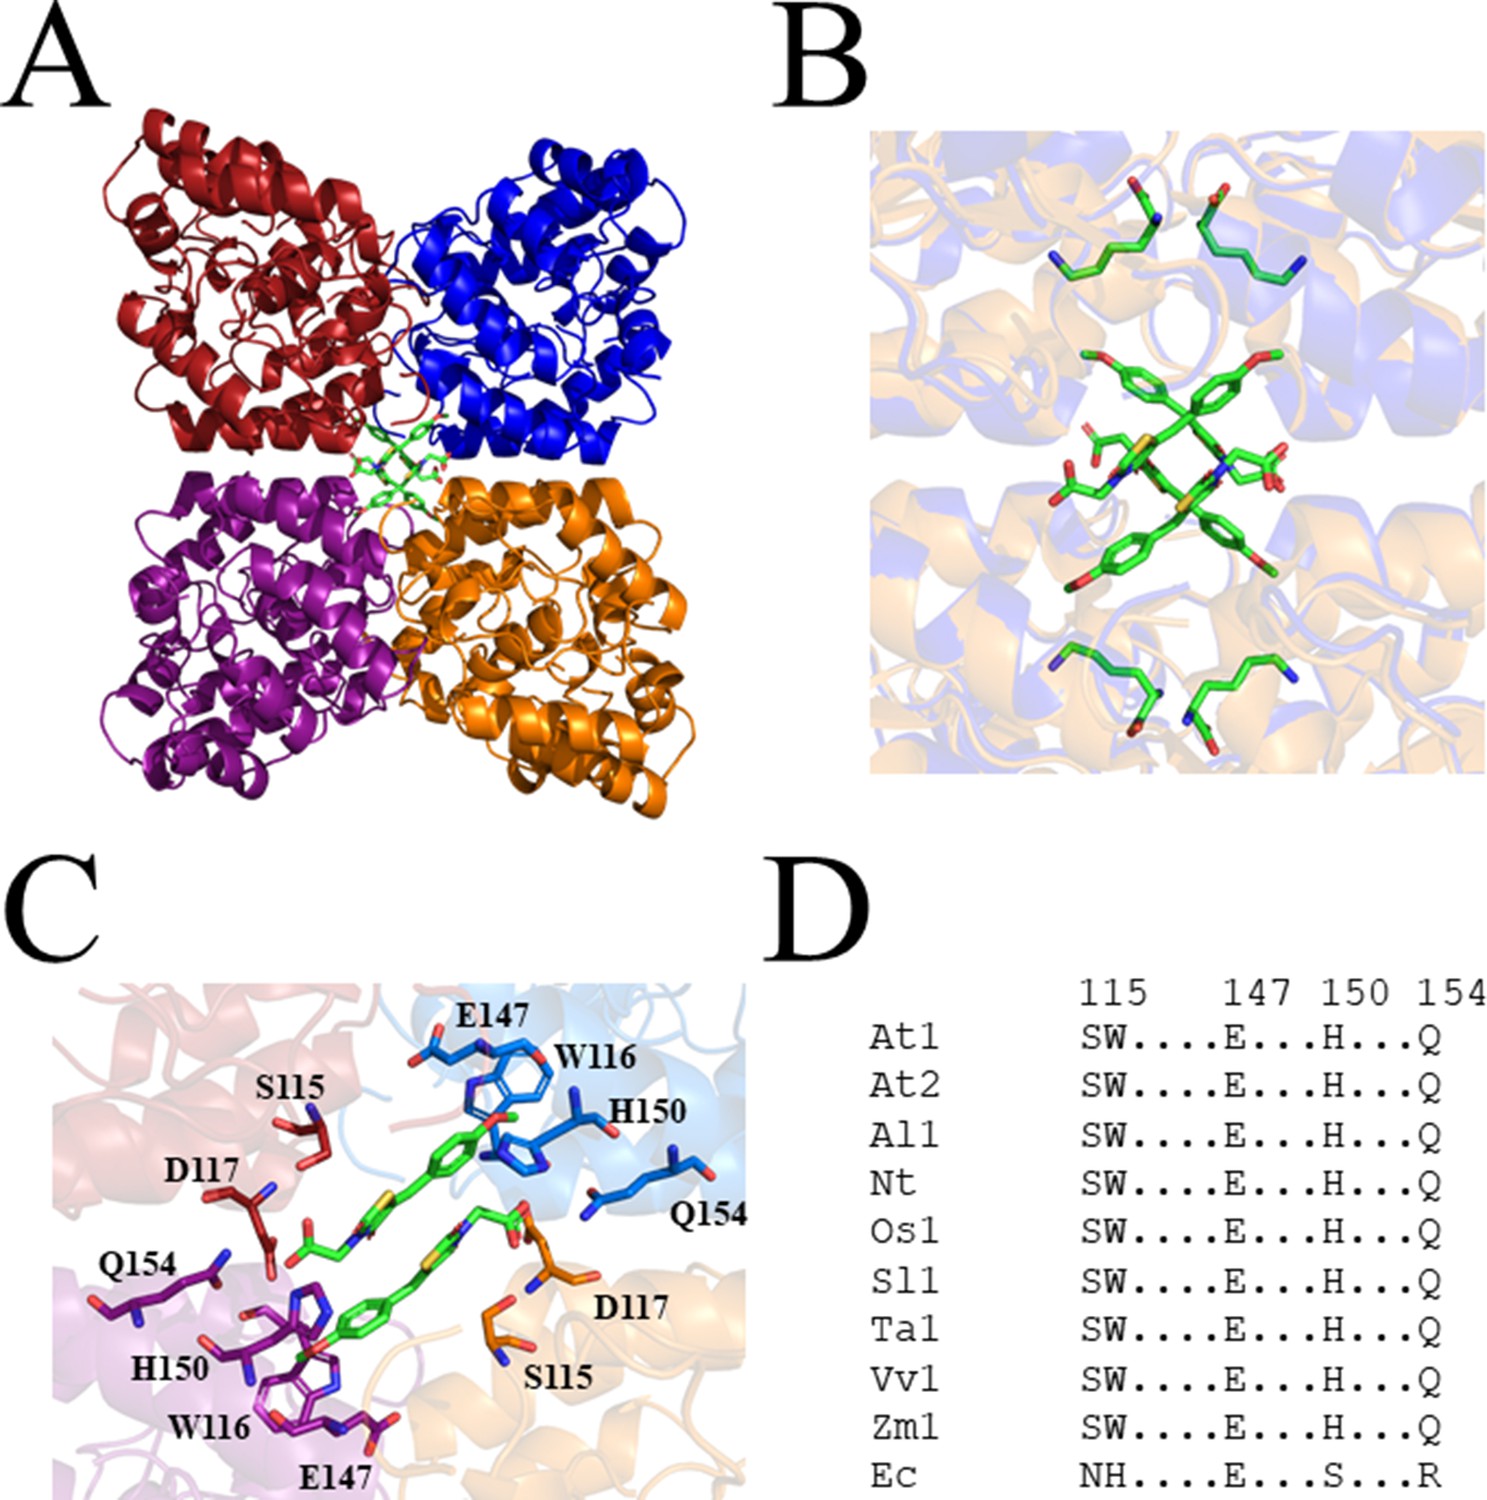
Crystal structure of AtDHDPS1 bound to MBDTA-2.
(A) Cartoon view of overall AtDHDPS1 quaternary (tetrameric) structure, illustrating the binding sites for MBDTA-2 at the centre of the tetramer. (B) Overlay of the lysine-bound (PDB: 6VVH) and MBDTA-2-bound structures. (C) Close-up of inhibitor binding pocket, with interacting residues shown as sticks. Lysine and MBDTA-2 are shown as green sticks and coloured by nitrogen (blue), oxygen (red), and sulfur (yellow). Images were generated using PyMOL v 2.2 (Schrödinger). (D) Sequence alignment of residues involved in MBDTA-2 binding from A. thaliana DHDPS1 (At1; UNIPROT ID: Q9LZX6), A. thaliana DHDPS2 (At2; UNIPROT ID: Q9FVC8), A. lyrata DHDPS1 (Al1; UNIPROT ID: D7LRV3), N. tabacum DHDPS (Nt; UNIPROT ID: Q42948), O. sativa DHDPS1 (Os1; UNIPROT ID: A0A0K0K9A6), S. lycopersicum DHDPS1 (Sl1; UNIPROT ID: A0A3Q7IMG0), T. aestivum DHDPS1 (Ta1; UNIPROT ID: P24846), V. vinifera DHDPS1 (Vv1; UNIPROT ID: A0A438E022), Z. mays DHDPS1 (Zm1; UNIPROT ID: P26259), and E. coli (Ec) DHDPS (UNIPROT ID: P0A6L2). Residues are numbered according to A. thaliana DHDPS1 with dots (.) representing interspacing residues. Sequences were aligned in BioEdit (v 7.2.5) using the ClustalW algorithm.
Figure 5—figure supplement 1
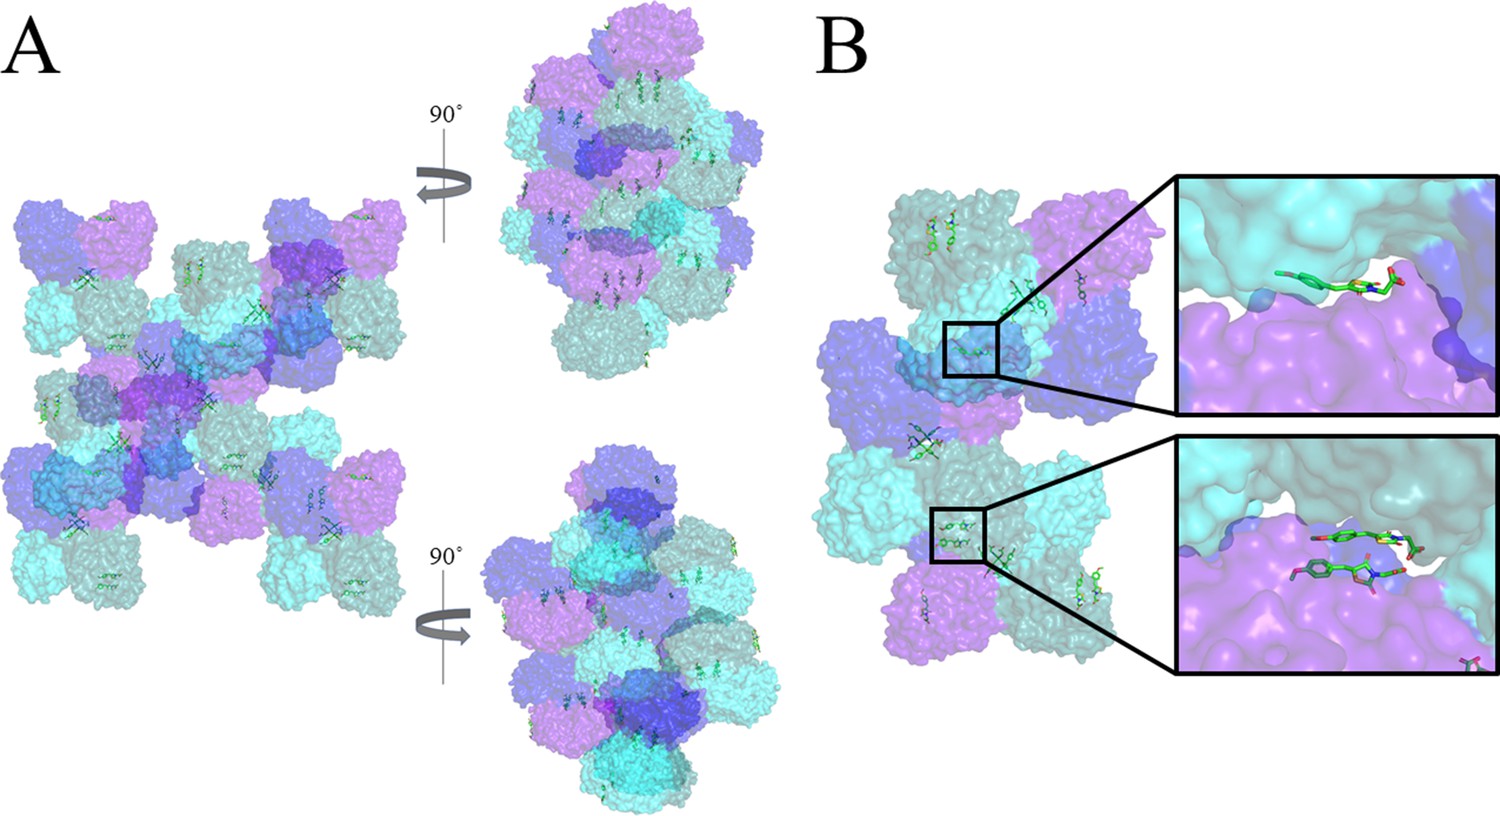
Non-specific binding of MBDTA-2 between symmetry mates.
(A) Surface view of symmetry mates of MBDTA-2 bound toAtDHDPS1, highlighting chains A (blue), B (purple), C (cyan), and D (turquoise). (B) Close up of MBDTA-2 molecules bound to the surface of the protein on chains B (top inlay) and D (bottom inlay) and wedged between chains C and A, respectively, of the symmetry mates. MBDTA-2 is shown as green sticks and coloured by nitrogen (blue), oxygen (red) and sulfur (yellow). Images were generated using PyMOL v 2.2 (Schrödinger).
Figure 6
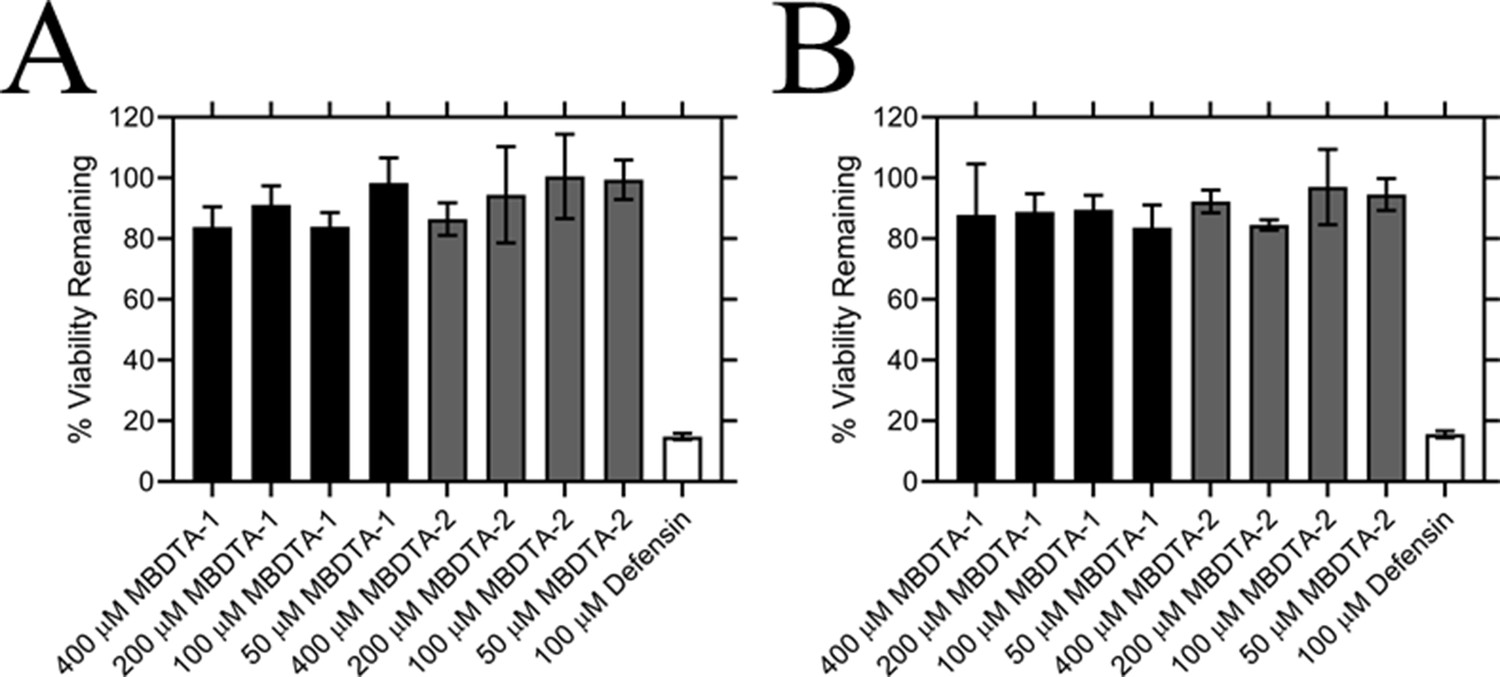
Effect of compounds on the viability of human cell lines.
Toxicity of MBDTA-1 (black) and MBDTA-2 (grey), compared to the positive control defensin (white), assessed against (A) HepG2 and (B) HEK293 human cell lines using the MTT assay. Data were normalised against a vehicle control (1% [v/v] DMSO) and plotted against inhibitor concentration. Data represents mean ± S.E.M. (N = 3).
-
Figure 6—source data 1
Minimum inhibitory concentration(MIC) values for MBDTA-1 and MBDTA-2 against several bacterial strains.
- https://cdn.elifesciences.org/articles/69444/elife-69444-fig6-data1-v2.xlsx
Figure 7
Effect of MBDTA compounds on agar-grown A. thaliana.
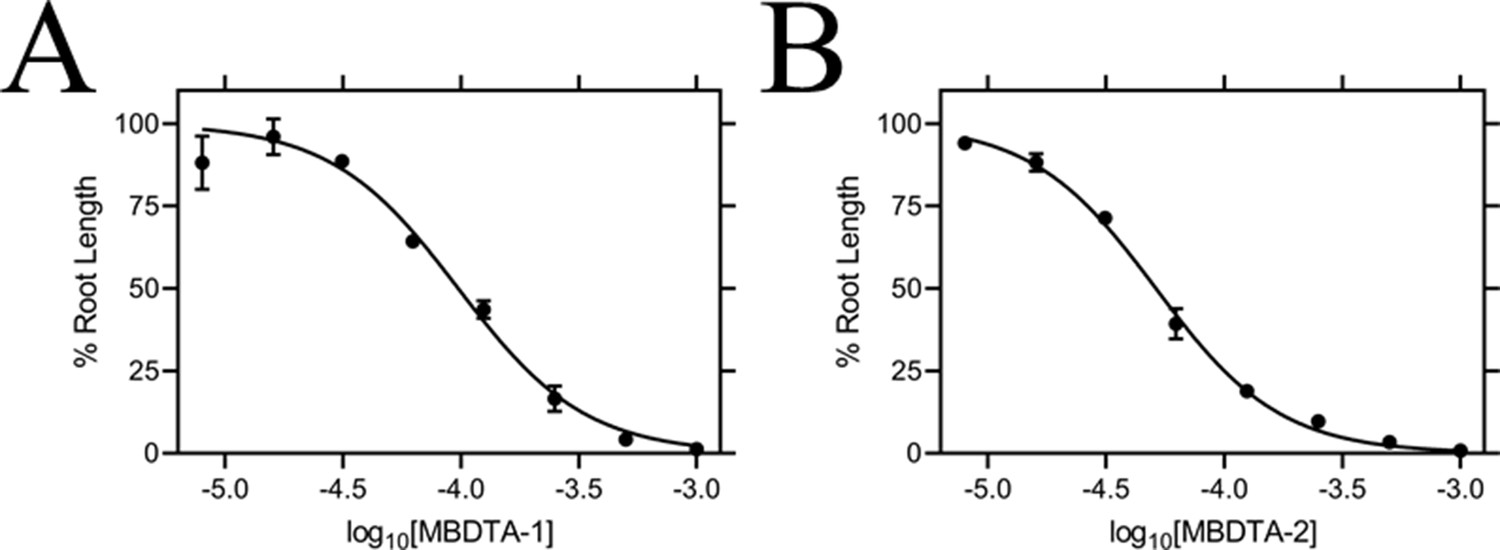
A thaliana root lengths after treatment with increasing concentrations of either (A) MBDTA-1 or (B) MBDTA-2. Root lengths were determined using ImageJ v 1.53b and normalised against a vehicle control (1% [v/v] DMSO). Normalised data (●) (% root length) is plotted as a function of log10[inhibitor] and fitted to a nonlinear regression model (solid line) (R2 = 0.99). Data represents mean ± S.E.M. (N = 3).
-
Figure 7—source data 1
Effect of MBDTA compounds on agar-grown A. thaliana.
- https://cdn.elifesciences.org/articles/69444/elife-69444-fig7-data1-v2.xlsx
Figure 8
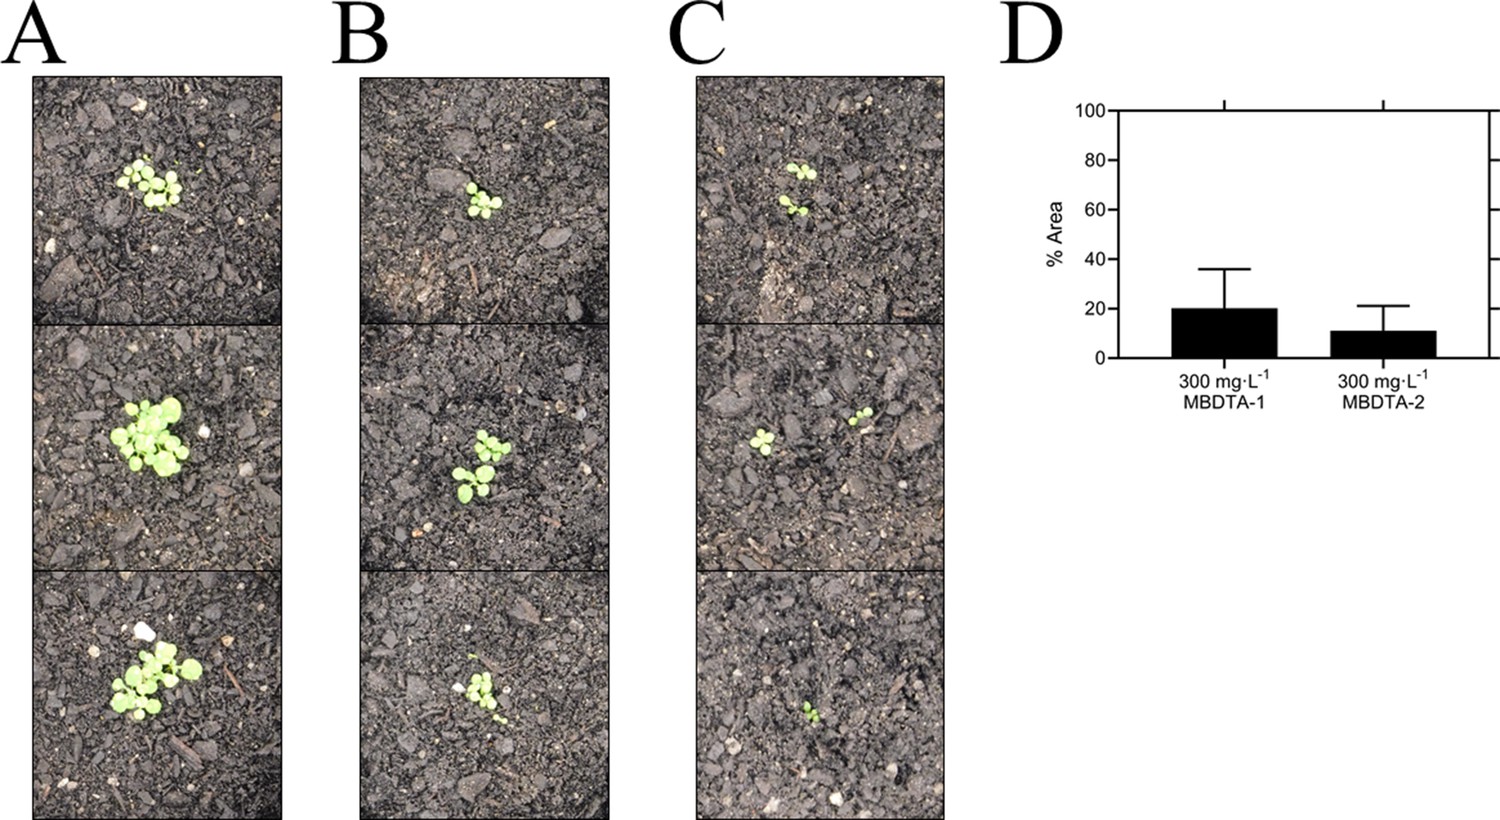
Pre-emergence efficacy of inhibitors on A. thaliana grown in soil.
Treatments of (A) vehicle control (1% [v/v] DMSO), (B) 300 mg·L−1 MBDTA-1, and (C) 300 mg·L−1 MBDTA-2 given at day 0 (first day under controlled environment room conditions). A representative in triplicate of the biological replicates is shown vertically. (D) Leaf area of MBDTA-1/2-treated A. thaliana. Area was determined using ImageJ v 1.53b and normalised against a vehicle control (1% [v/v] DMSO). Data represents mean ± S.D. (n = 3).
-
Figure 8—source data 1
Pre-emergence efficacy of inhibitors on A. thaliana grown in soil.
- https://cdn.elifesciences.org/articles/69444/elife-69444-fig8-data1-v2.xlsx
Tables
Table 1
Summary of MBDTA-2-bound AtDHDPS1 crystallographic data collection, processing, and refinement statistics.
| Data collection | AtDHDPS1 + MBDTA-2 |
|---|---|
| Space group | P41212 |
| Unit-cell parameters (Å) | 94.47, 94.47, 181.41 |
| Resolution (Å) | 20–2.29 (2.43–2.29) |
| No. of observations | 491,320 (74,297) |
| No. of unique reflections | 37,390 (5768) |
| Completeness (%) | 99.4 (96.6) |
| Redundancy | 13.1 (12.8) |
| Rmerge (%) | 9.9 (39.1) |
| Rmeas (%) | 10.0 (40.7) |
| CC1/2 | 99.9 (97.8) |
| Average I/σ(I) | 27.9 (7.9) |
| Refinement | |
| R (%) | 18.3 |
| Rfree (%) | 22.6 |
| No. (%) of reflections in test set | 1071 |
| No. of protein molecules per asu | 2 |
| r.m.s.d bond length (Å) | 0.007 |
| r.m.s.d bond angle (°) | 1.415 |
| Average B-factors (Å2)* | |
| Protein molecules | 44.52 |
| Ligand molecules | 60.01 |
| Water molecules | 40.33 |
| Ramachandran plot† | |
| Residues other than Gly and Pro in: | |
| Most favored regions (%) | 98.0 |
| Additionally allowed regions (%) | 2.0 |
| Disallowed regions (%) | 0.0 |
| PDB code | 7MDS |
-
Values in parentheses are for the highest-resolution shell.
*Calculated by BAVERAGE in CCP4 Suite (Winn et al., 2011).
-
†Calculated using MolProbity (Chen et al., 2010).
Table 2
Minimum inhibitory concentration (MIC) values for MBDTA-1 and MBDTA-2 against several bacterial strains.
| MBDTA-1 MIC (µg·mL−1) | MBDTA-2 MIC (µg·mL−1) | |
|---|---|---|
| Human flora | ||
| Enterococcus spp. | >128 | >128 |
| Staphylococcus aureus | >128 | >128 |
| Escherichia coli | >128 | >128 |
| Soil bacteria | ||
| Enterobacter ludwigii | >128 | >128 |
| Arthrobacter sp. | >128 | >128 |
| Enterobacter cancerogenus | >128 | >128 |
| Cedecea davisae | >128 | >128 |
| Rhodococcus erthropolis | >128 | >128 |
-
Table 2—source data 1
Minimum inhibitory concentration(MIC) values for MBDTA-1 and MBDTA-2 against several bacterial strains.
- https://cdn.elifesciences.org/articles/69444/elife-69444-table2-data1-v2.xlsx
Key resources table
| Reagent type (species) or resource | Designation | Source or reference | Identifiers | Additional information |
|---|---|---|---|---|
| Gene (Arabidopsis thaliana) | DHDPS1 | TAIR | At3G60880 | |
| Gene (Arabidopsis thaliana) | DHDPS2 | TAIR | At2G45440 | |
| Cell line (Homo sapiens) | HepG2 | ATCC | ATCC: HB-8065 RRID:CVCL_0027 | |
| Cell line (Homo sapiens) | HEK293 | ATCC | ATCC:ACS-4500 RRID:CVCL_0063 |
Additional files
-
Supplementary file 1
Physicochemical properties of MBDTA-1/2.
- https://cdn.elifesciences.org/articles/69444/elife-69444-supp1-v2.docx
-
Transparent reporting form
- https://cdn.elifesciences.org/articles/69444/elife-69444-transrepform-v2.docx
Download links
A two-part list of links to download the article, or parts of the article, in various formats.
Downloads (link to download the article as PDF)
Open citations (links to open the citations from this article in various online reference manager services)
Cite this article (links to download the citations from this article in formats compatible with various reference manager tools)
Towards novel herbicide modes of action by inhibiting lysine biosynthesis in plants
eLife 10:e69444.
https://doi.org/10.7554/eLife.69444


