Parallel functional testing identifies enhancers active in early postnatal mouse brain
- Department of Psychiatry and Behavioral Sciences, University of California, Davis, United States
- Department of Neurobiology, Physiology and Behavior, University of California, Davis, United States
- Department of Pediatrics and Human Development, Grand Rapids Research Center, Michigan State University, United States
- Helen Wills Neuroscience Institute, University of California, Berkeley, United States
- Departments of Ophthalmology and Neurobiology, University of Pittsburgh, United States
Figures
Figure 1 with 4 supplements
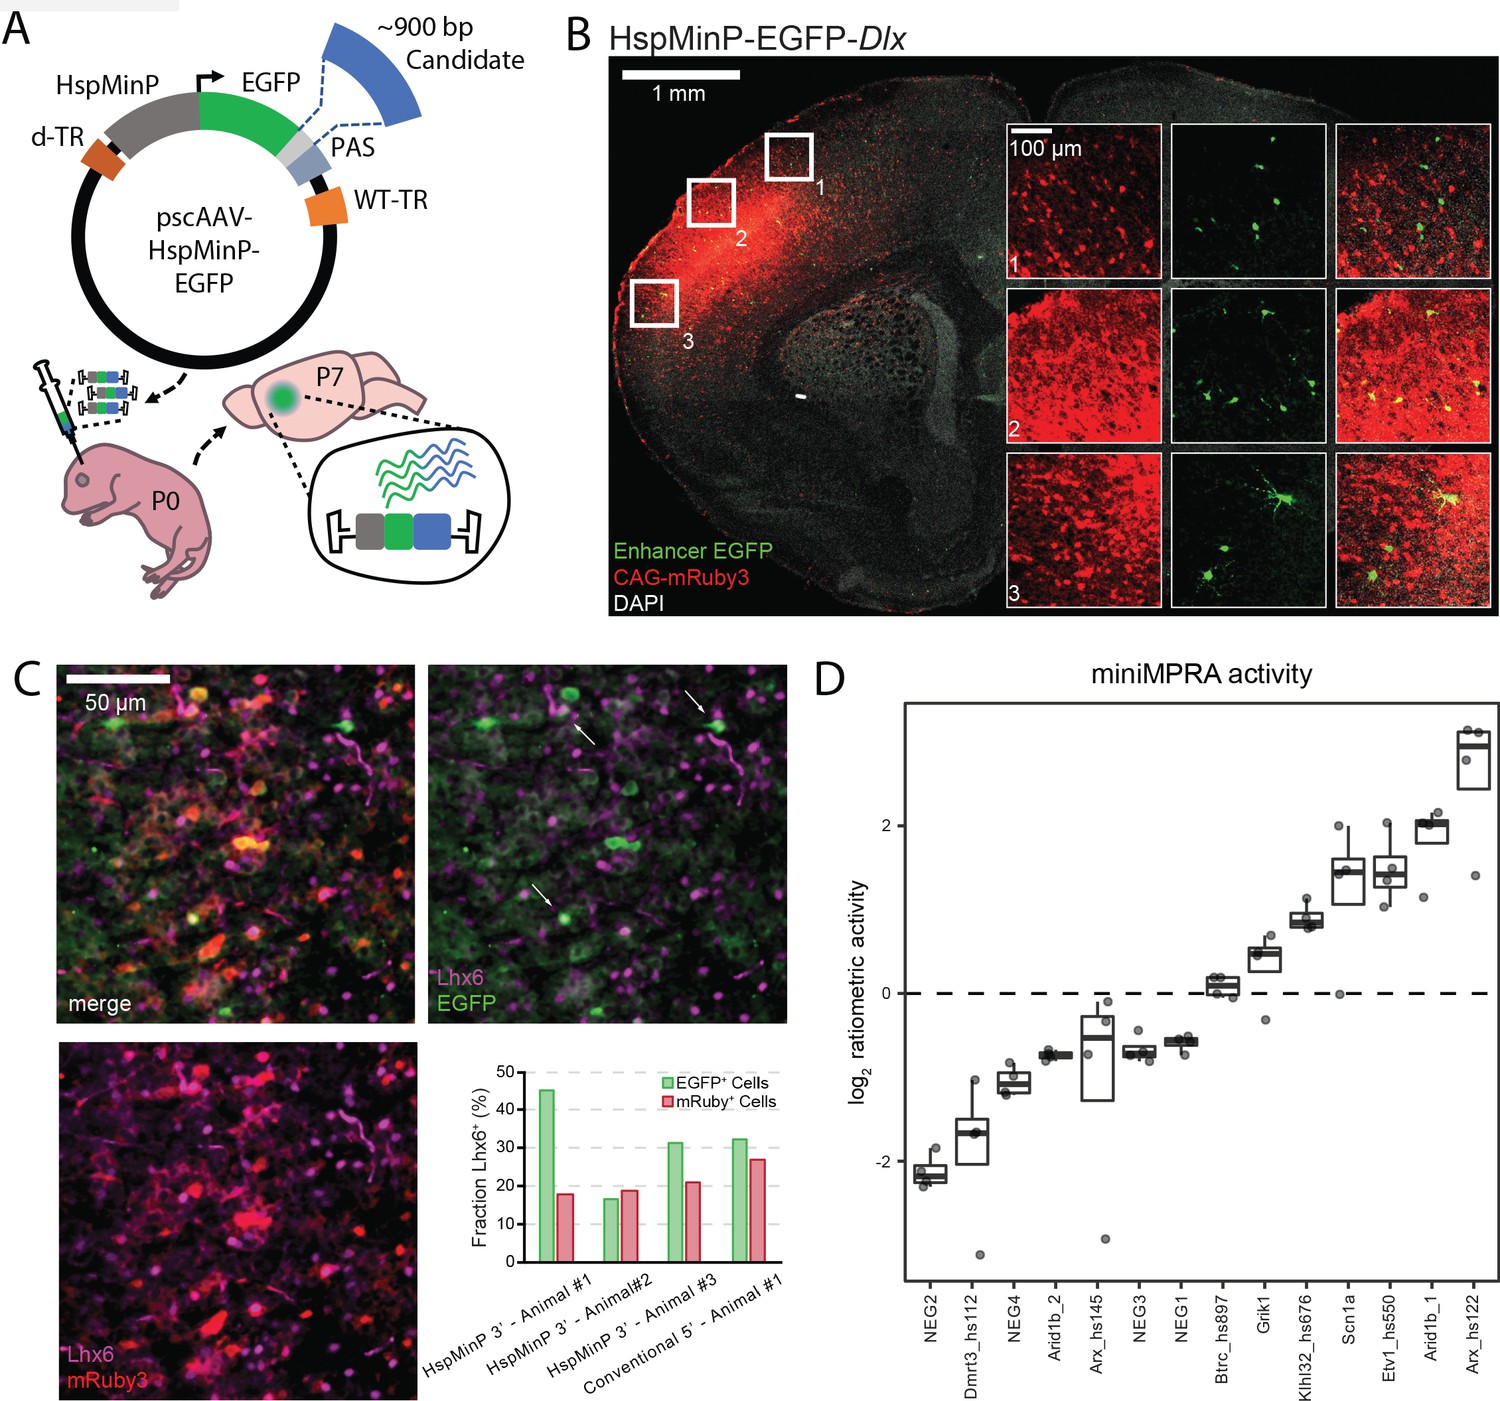
Designing and validating 3’-UTR enhancer reporter AAV assay.
(A) Schematic of in vivo parallelized functional enhancer reporter assay. The test library was generated using the previral vector pscAAV-HspMinP-EGFP, which contained a multiple cloning site (light grey) between the EGFP reporter and polyadenylation site (PAS). Purified PCR products for test amplicons were cloned into the vector using Gibson assembly. The previral library was packaged into AAV9(2YF), and the viral library delivered to the brain via injection at P0. Brains were collected at P7. (B) Representative image of a coronal section of a P7 mouse brain injected at P0 with a virus mixture consisting of an AAV containing the STARR-seq vector carrying the inhibitory interneuron enhancer Dlx (scAAV9-HspMinP-EGFP-Dlx) and an injection control AAV containing an expression vector for mRuby3 under the control of CAG, a general mammalian promoter. EGFP expression was visualized via IHC using an anti-GFP antibody, while mRuby3 expression was visualized using native fluorescence. Insets show close up of boxed regions showing morphology of EGFP-expressing cells in the cortex. (C) Sections from P7 mouse cortex transduced with Dlx-driven STARR-seq reporter vector and mRuby3 injection control at P0, counterstained with an antibody for Lhx6, a transcription factor active in deep cortical layer interneurons. EGFP-expressing cells with Lhx6+ Nuclei are indicated with arrows. Inset graph shows fraction of EGFP- or mRuby3-expressing cells co-labeled with Lhx6 in three replicate animals injected with scAAV9-HspMinP-EGFP-Dlx (Animal 1, n = 20 EGFP+ cells, 218 mRuby3+ cells; Animal 2, n = 18 EGFP+ cells, 435 mRuby3+ cells; Animal 3, n = 32 EGFP+ cells, 311 mRuby3+ cells) or one animal injected with AAV9-Dlx-βGlobinMinP-EGFP (Dimidschstein et al., 2016; Lee et al., 2014) (n = 31 EGFP+ cells, 63 mRuby3+ cells). (D) Ratiometric (log2 RNA/DNA) activity of miniMPRA mouse library in P7 mouse cortex after injection at P0. Boxplot of distribution and individual replicates (N = 4) shown for the 16 tested candidates. NEG indicates putative negative candidate; otherwise, name indicates nearby gene and if applicable, embryonic enhancer ID, for positive candidates.
Figure 1—figure supplement 1
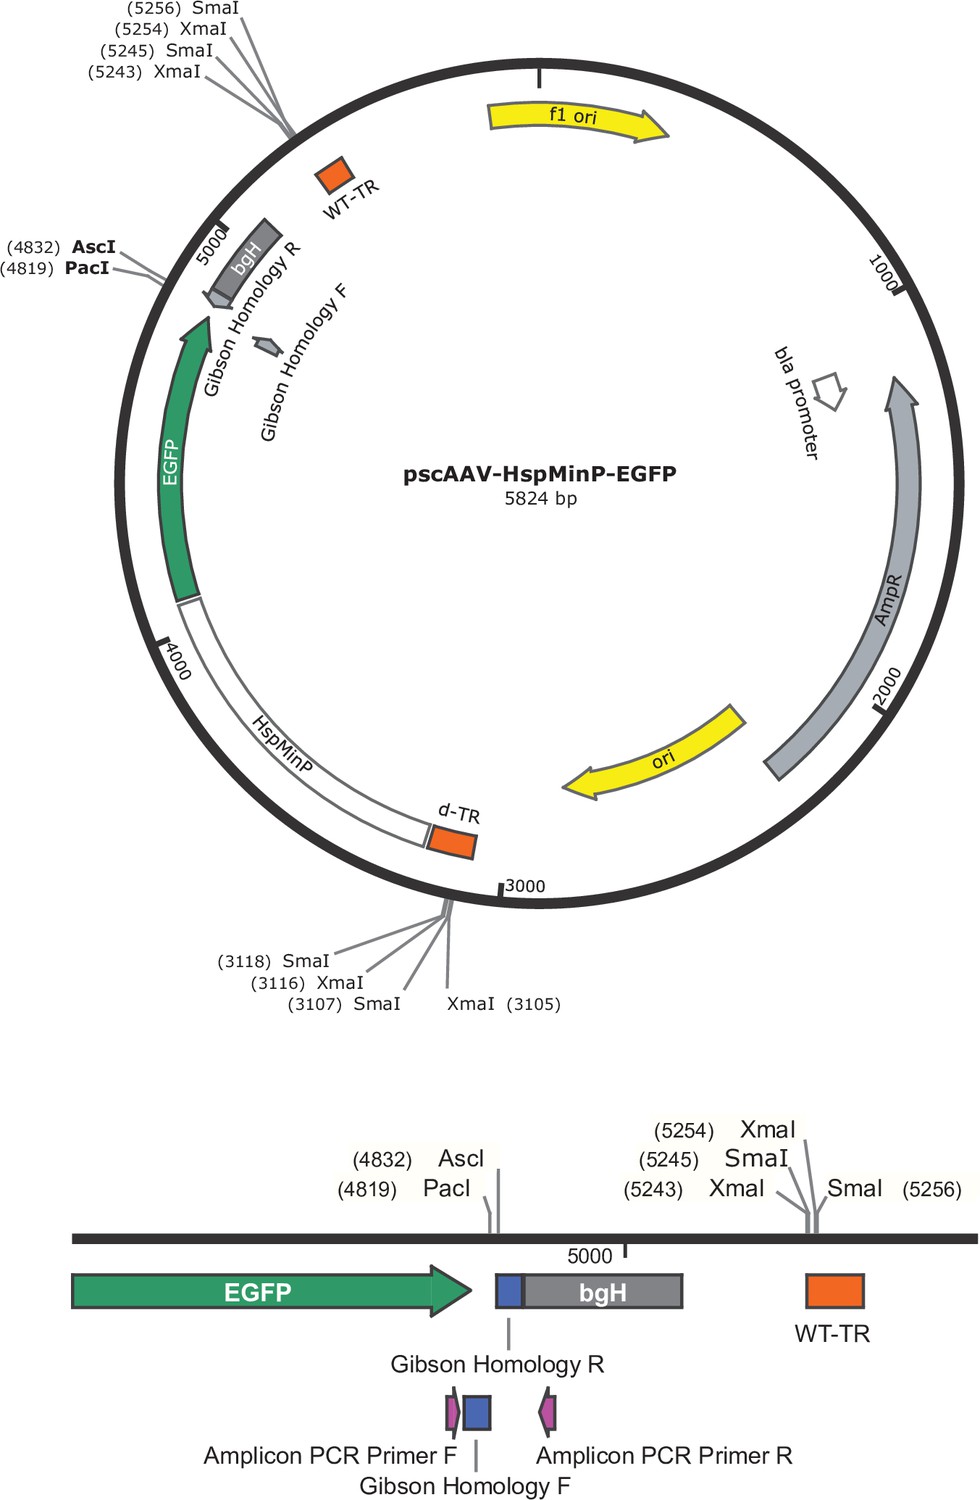
Vector map of pscAAV-HspMinP-EGFP.
Vector map of the self-complementary previral vector used for cloning. Terminal repeat (TR) regions necessary for AAV packaging are highlighted (WT-TR refers to fully functional region for AAV packaging and d-TR refers to mutated TR used for production of scAAV). The termination sequence bgH is noted 3’ of the multiple cloning site. Restriction enzymes used for plasmid linearization during cloning (AscI and PacI) and verification of plasmid structure for AAV packaging (XmaI or SmaI) are also shown. Inset (bottom) shows multiple cloning site for Gibson assembly and amplicon PCR primer locations.
Figure 1—figure supplement 2
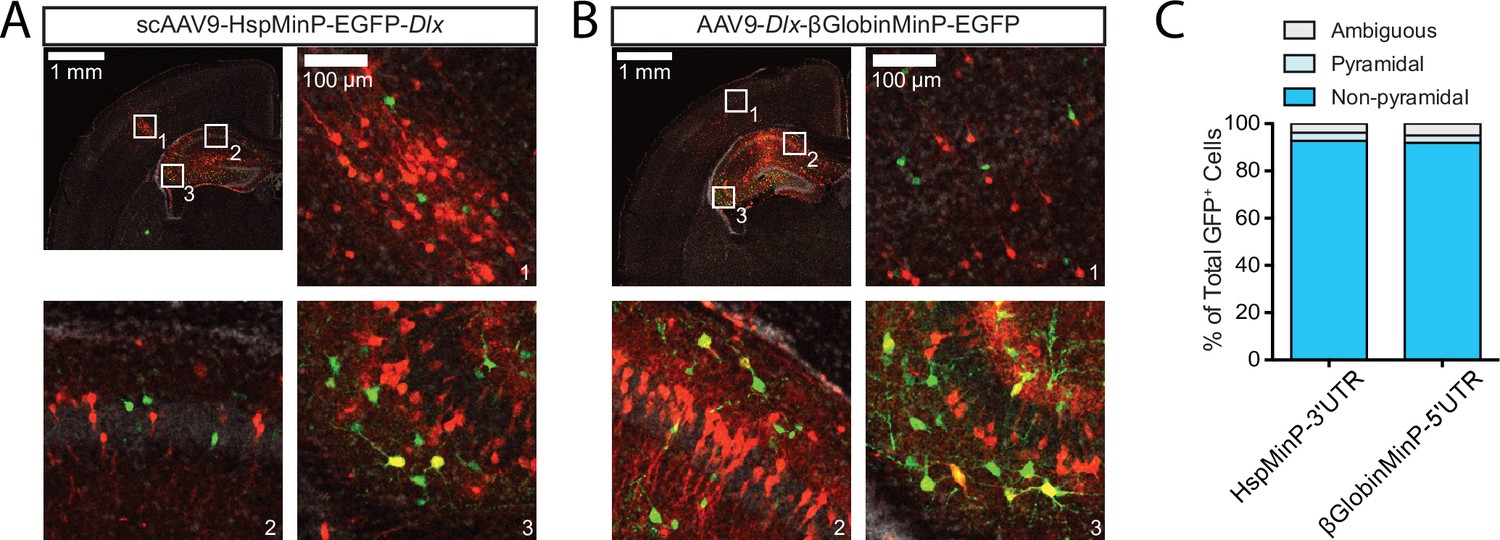
Dlx-driven EGFP expression in excitatory vs inhibitory cells based on cellular morphology in the cortex and hippocampus.
(A, B) Representative confocal images of coronal sections of P7 mouse brain transduced by intracranial injection at P0 with scAAV9-HspMinP-EGFP-Dlx (A) or AAV9-Dlx-βGlobinMinP-EGFP (B) and a CAG-mRuby3-positive control. Sections were stained with an antibody for EGFP for signal amplification. Green, EGFP; red, mRuby3; gray, DAPI. (C) Quantification of the numbers of Pyramidal (light blue), Non-pyramidal (darker blue), and cells of ambiguous morphology (gray) observed in confocal imaging experiment in A and B above; N = 5 animals, 314 cells transduced with HspMinP-EGFP-Dlx (HspMinP-3’-UTR) and N = 4 animals, 972 cells transduced with Dlx-βGlobinMinP-EGFP (βGlobin-5’UTR).
Figure 1—figure supplement 3

Additional biological replicates of Lhx6 co-staining of Dlx-driven EGFP+ cells.
Representative fluorescent images of EGFP+ cells (left panels) and mRuby3+ cells (right panels) in coronal sections of mouse cortex transduced with a mixture of rAAV carrying the constructs HspMinP-EGFP-Dlx and CAG-mRuby3 and counter-stained with an antibody for Lhx6 (two additional independent replicates of the representative images shown in Figure 1C).
Figure 1—figure supplement 4
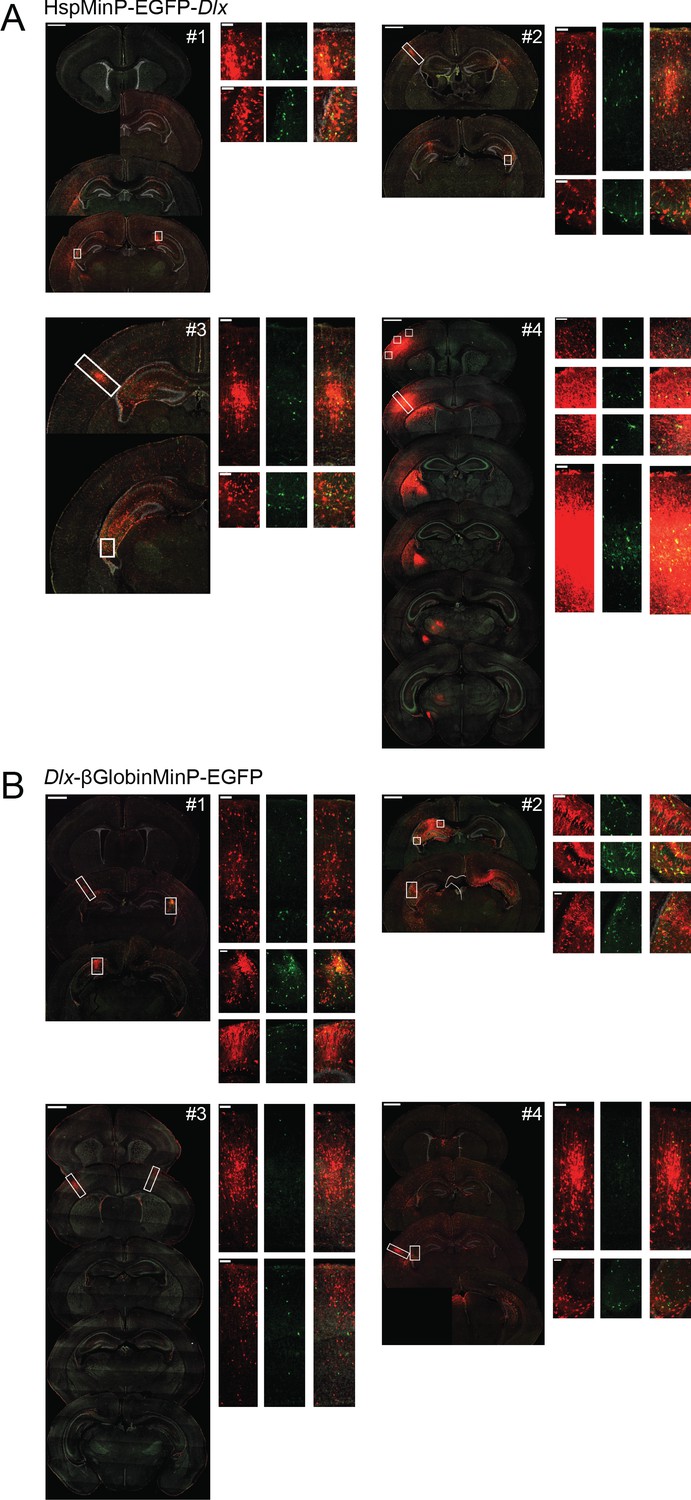
Interneuronal expression of Dlx-driven EGFP expression is consistent despite variable transductions.
Representative replicates (four animals each) of coronal sections from mice transduced at P0 with AAV9-CAG-mRuby3 and either scAAV9-HspMinP-EGFP-Dlx (A) or AAV9-Dlx-βGlobinMinP-EGFP (B). For each brain, the left-hand panel shows a spread of coronal sections sampling the injection site as it appears across multiple sections of the brain (scale bar = 1 mm), and the right-hand panels are closeup views of the boxed regions on the left panel (scale bar = 100 µm). mRuby3 is shown in red, EGFP is shown in green, DAPI is shown in gray.
Figure 2 with 5 supplements
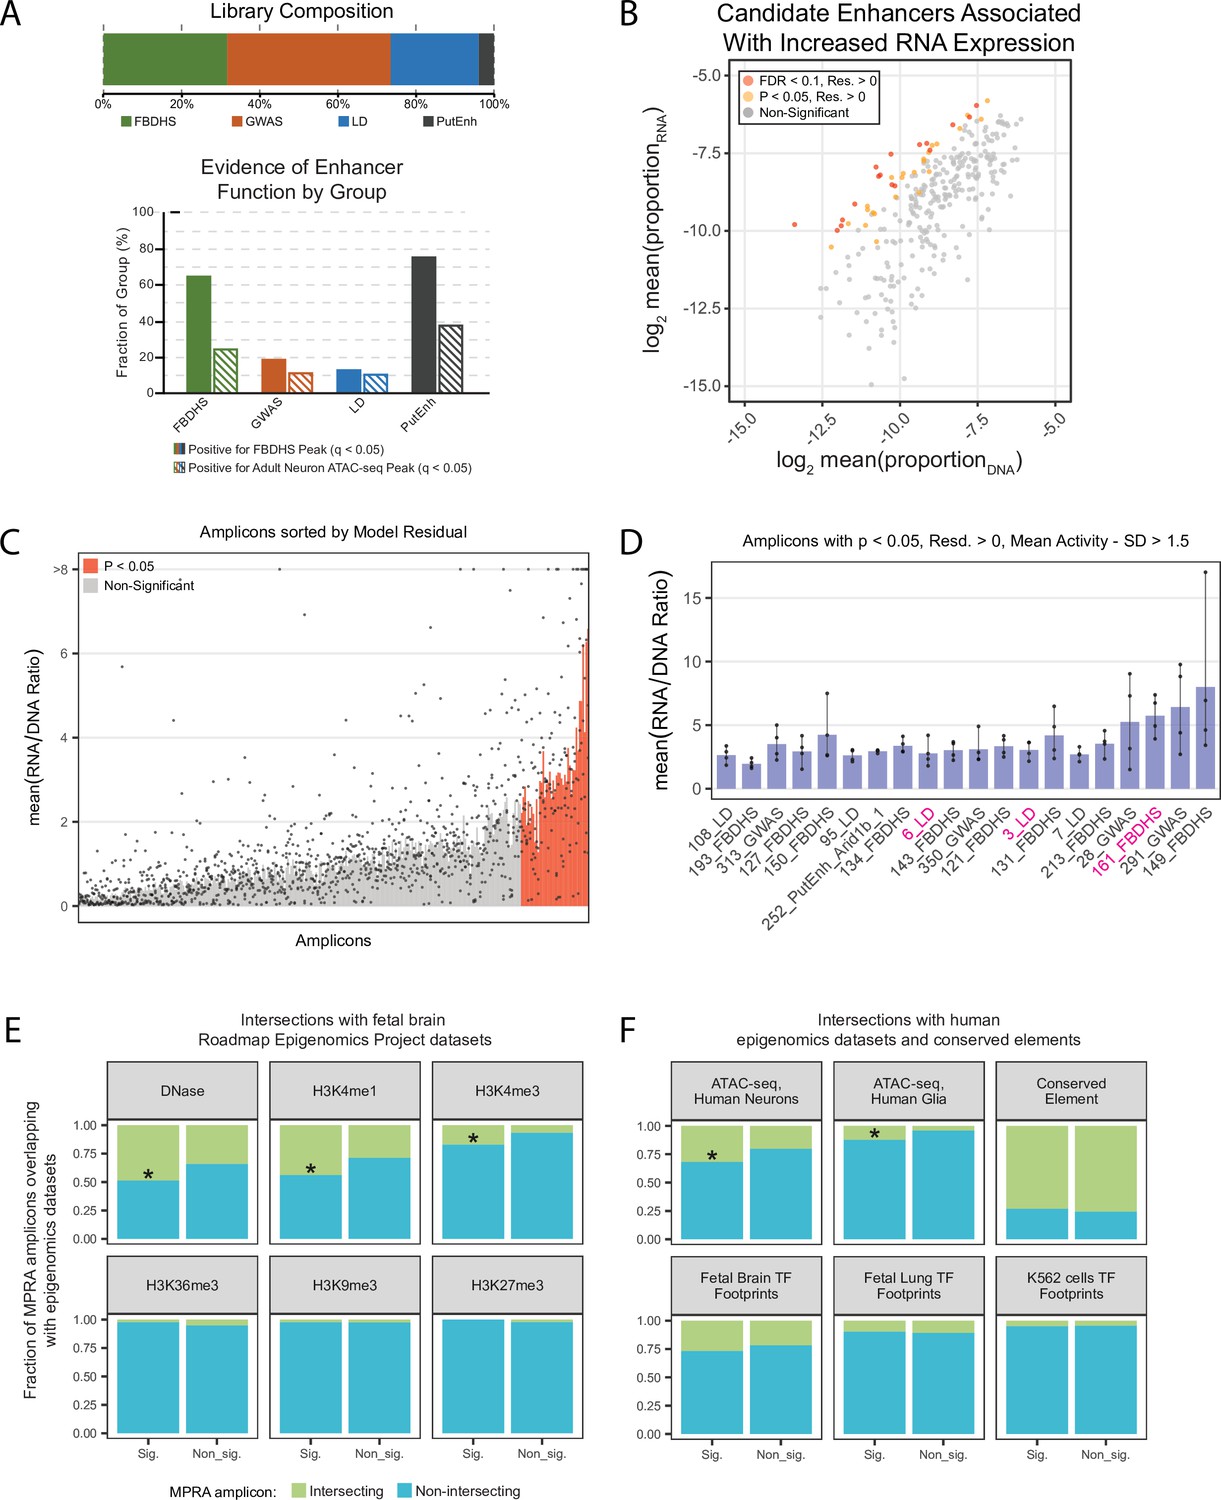
In vivo AAV MPRA yields amplicons capable of enhancing transcription, enriched for signatures associated with enhancers.
(A) Graphical representation of library composition. Top panel shows the fraction of the total library made up by each group of amplicons. Bottom panel shows the fraction of amplicons in each group that were positive for the given epigenomic signature. (B) Mean RNA and DNA representation in the assay for candidates that passed inclusion criteria (N = 308). Amplicons with significantly (p < 0.05, FDR < 0.1) increased model residual value (Res.) in RNA compared to DNA are shown in orange and red. Normal p-values; empirical FDR q-values (See Materials and methods). (C) Bar plot representing mean activity based on RNA/DNA ratio in the test assay with individual replicates shown as dots. Amplicons are sorted by linear model residuals (p < 0.05 colored red). (D) The top 20 active amplicons with consistent activity across both linear and ratiometric models. Bars represent mean activity based on RNA/DNA ratio and individual replicates are shown as dots. Three amplicons were used for downstream validation in single-candidate deliveries (magenta). (E) Amplicon intersection with fetal brain epigenomic datasets including DNase Hypersensitive loci, H3K4me1, H3K4me3, H3K36me3, H3K9me3, and H3K27me3. Amplicons were divided into two groups based on the statistical significance of their activity in the MPRA. (F) Amplicon intersection with human neuron or glia ATAC-seq, vertebrate conserved elements, and digital transcription factor footprints in fetal brain, fetal lung, and K562 cells. Asterisks in E and F indicate significant enrichment for positive amplicons with annotation class (p < 0.05, permutation test).
Figure 2—figure supplement 1
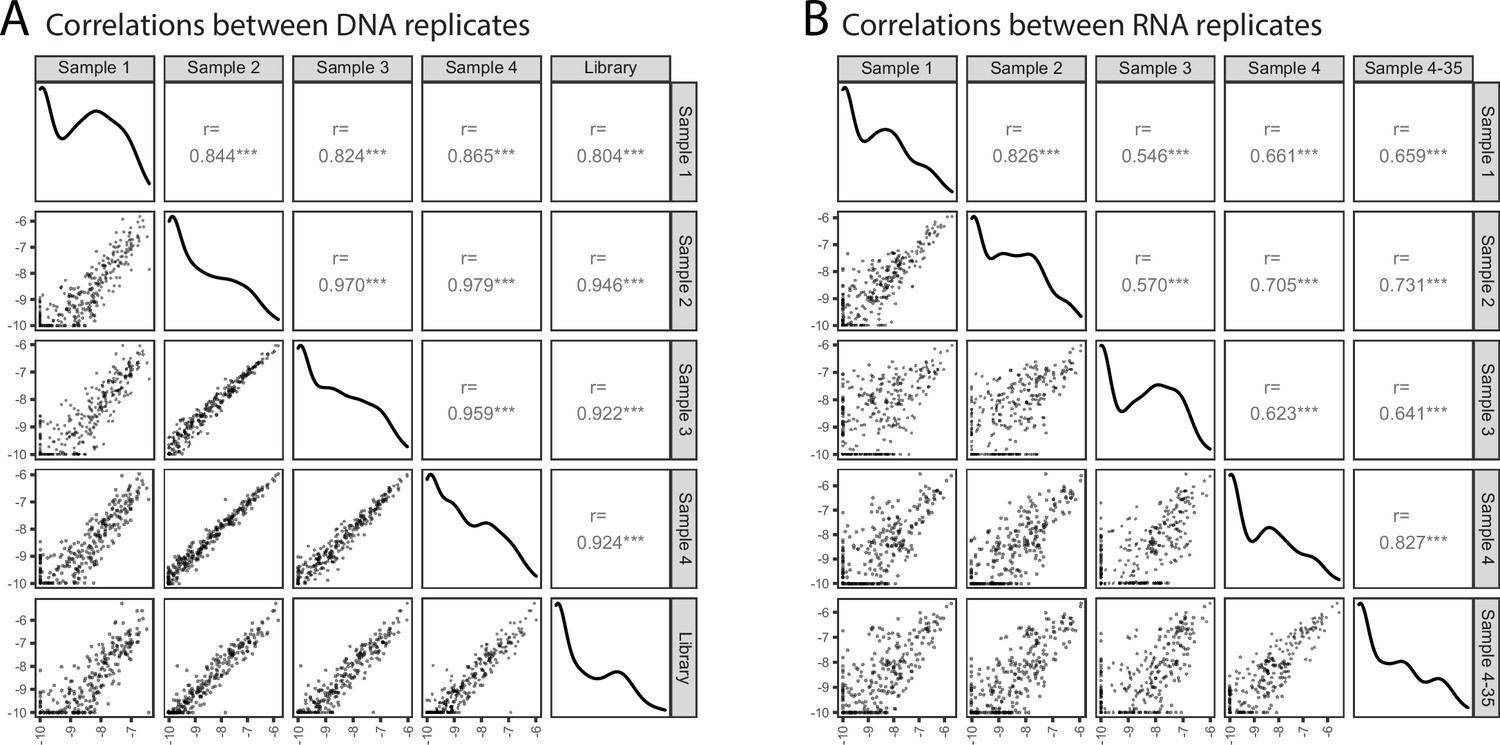
Reproducibility of in vivo MPRA.
(A) Correlation of genomic DNA (‘DNA’) representation across biological replicates and the previral plasmid library. Data is shown as log2(proportion) per amplicon. Pearson correlation is shown for each pairwise comparison over the filtered dataset (n = 308). *** indicates correlation p < 0.001. (B) Correlation of cDNA (“RNA”) representation across biological replicates and a technical replicate of Sample 4 which was subjected to increased PCR cycles during sample preparation (35 cycles instead of 30). Data is shown as log2(proportion) per amplicon. Pearson correlation is shown for each pairwise comparison over the filtered dataset (n = 308). *** indicates correlation p < 0.001.
Figure 2—figure supplement 2
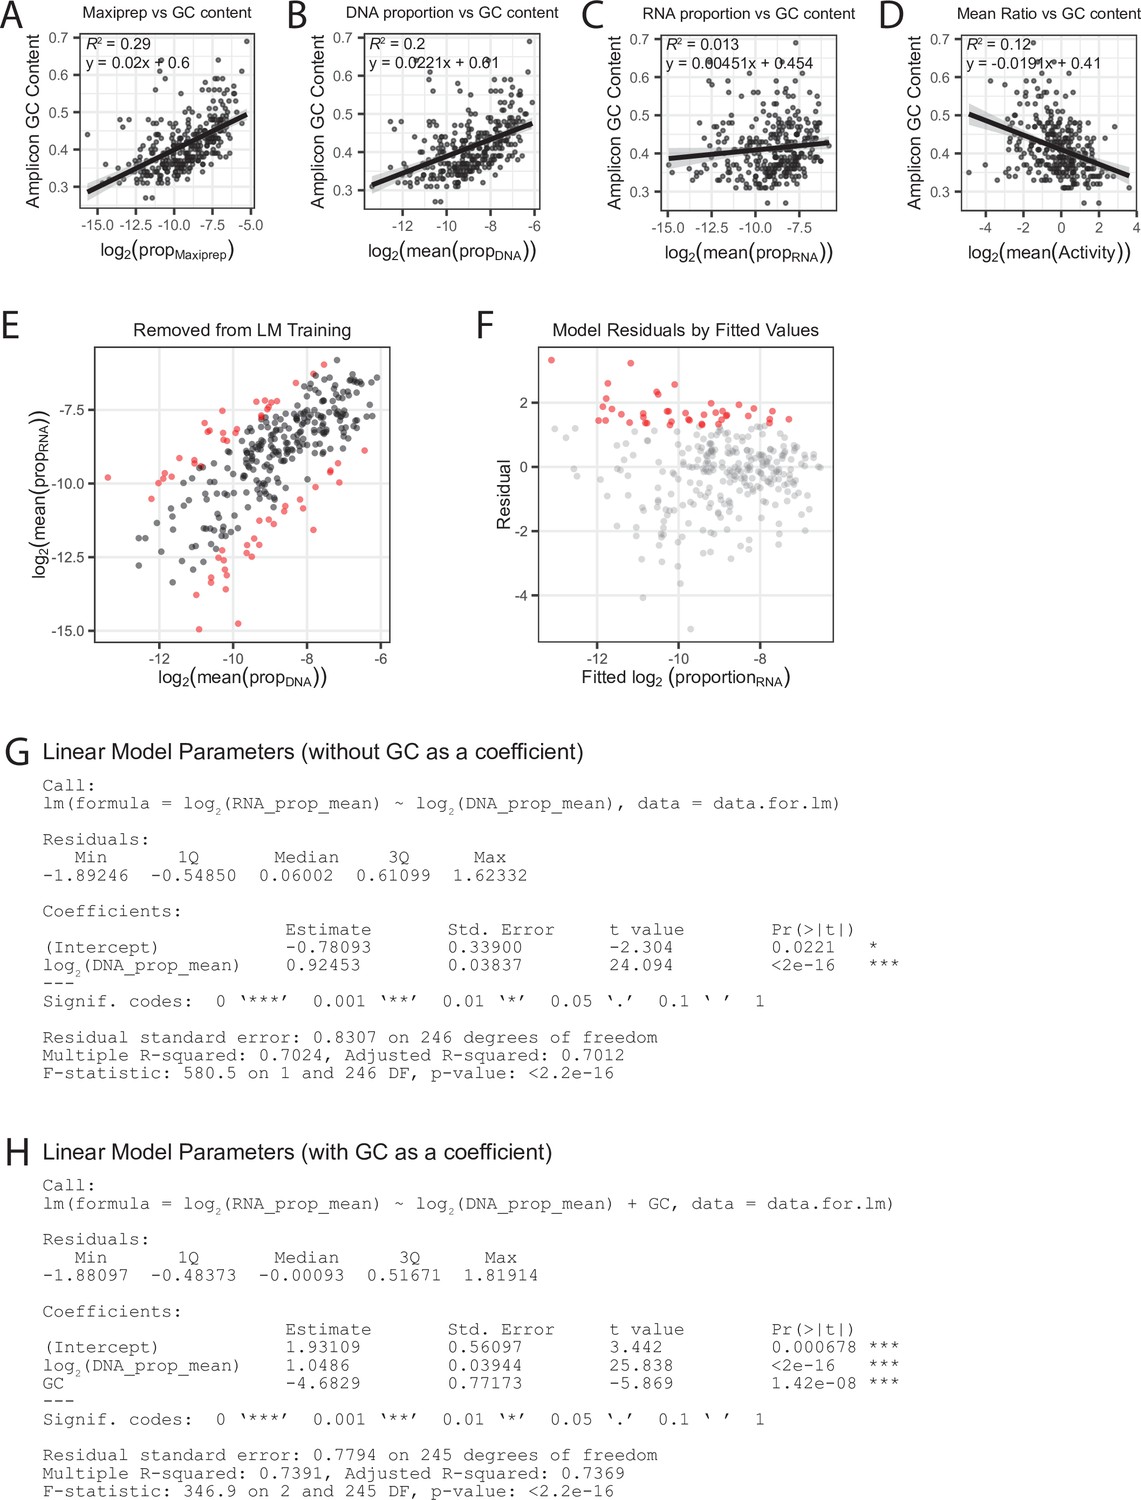
Amplicon selection for linear model building.
(A) GC content per amplicon by previral library maxiprep proportion. (B) GC content per amplicon by mean DNA proportion. (C) GC content per amplicon by mean RNA proportion. (D) GC content per amplicon by mean RNA/DNA ratio. Line represents linear best-fit line for all plots. Shaded area represents standard error. GC content is correlated with the previral library and DNA samples, but not to RNA or ratiometric activity. (E) Removal of the top 10 % and bottom 10 % of amplicons, sorted by log2 mean RNA/DNA ratio, from linear model building. (F) Residuals by fitted log2 mean RNA proportion. Amplicons passing significance (pnorm < 0.05) are colored red. (G) Linear model summary for estimate of background activity without the GC content covariate. (H) Linear model summary for estimate of background activity including the GC content covariate. Addition of the GC content covariate reduces the Bayesian information criteria (BIC) from 626 to 599 indicating that GC content is a valid covariate in the model.
Figure 2—figure supplement 3
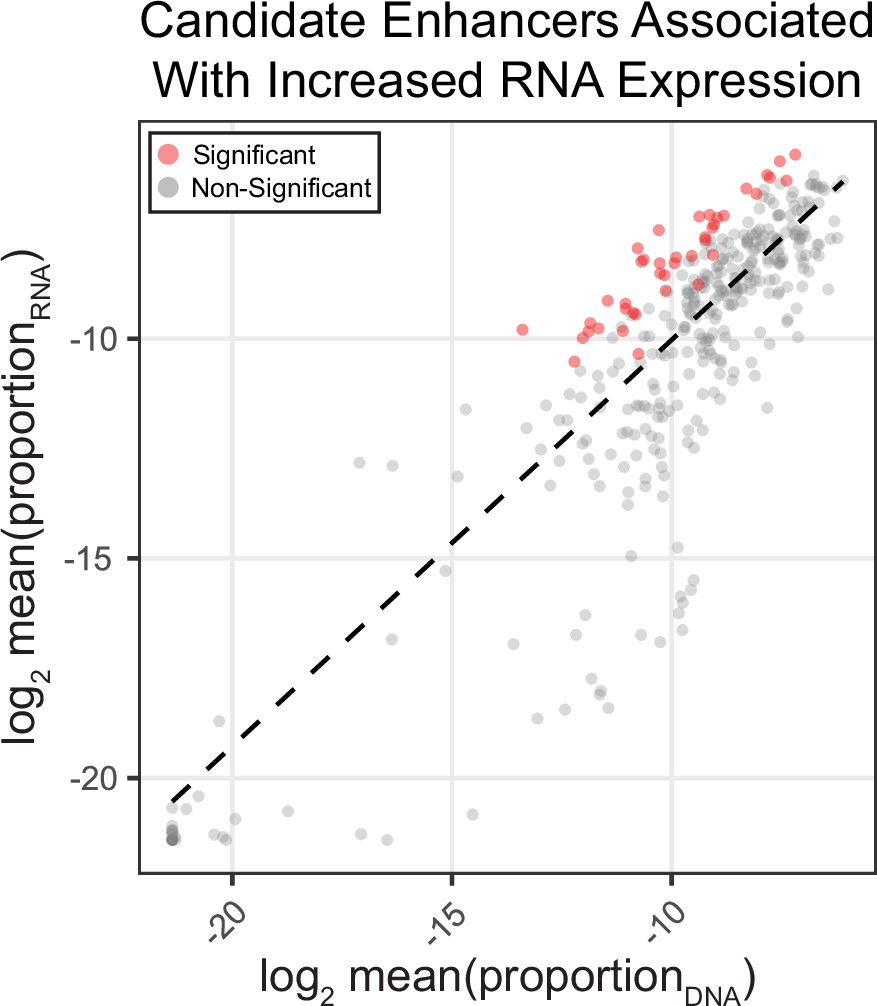
MPRA activity for all amplicons in the library.
Correlation of mean RNA/DNA ratio in the assay as shown in Figure 2B, here showing data for all target amplicons (n = 408). Dashed line represents RNA/DNA best-fit line of the data (n = 248). Amplicons are colored by whether they were found significant (p < 0.05) using the multiple linear model.
Figure 2—figure supplement 4
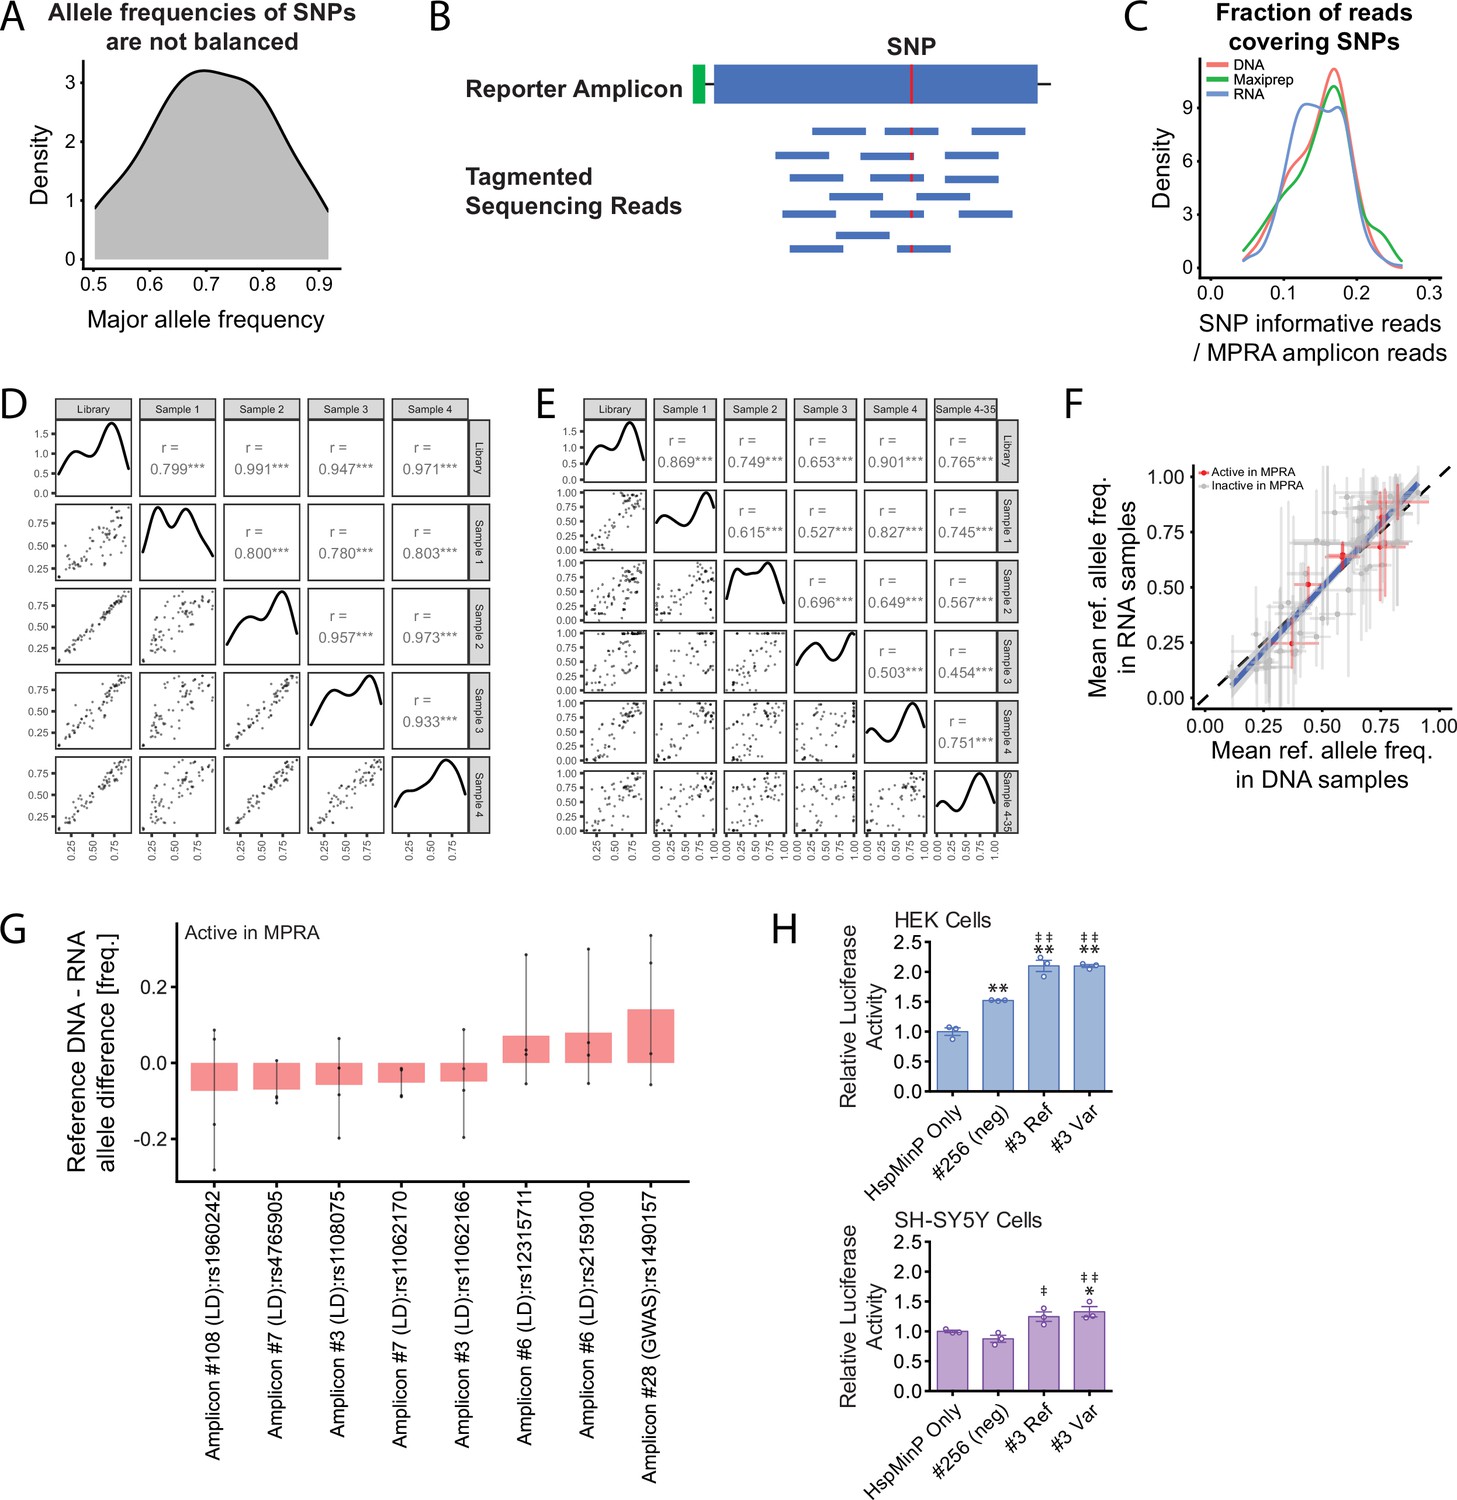
Allele-specific analysis of MPRA activity.
(A) Because pooled DNA from diverse human populations was used to clone the amplicons in the MPRA library, reference and variant alleles present in the population are not balanced in the library. For most amplicons, a major allele dominates the DNA reads. (B) Schematic showing why only a fraction of sequencing library fragments generated by the Nextera tagmentation protocol used here captures the SNP. (C) Distribution of the proportion of SNP-informative reads to all amplicon reads in pre-viral plasmid maxiprep (green), DNA (red), and RNA (blue). (D) Correlation of allele-specific amplicons in genomic DNA (‘DNA’) across biological replicates after filtering for only allele-informative reads. (E) Correlation of allele-specific amplicons in cDNA (“RNA”) across biological and technical replicates after filtering for only allele-informative reads. Data for D and E is shown as log2(proportion) per allelic amplicon. Pearson correlation is shown for each pairwise comparison over the filtered dataset (n = 77 biallelic SNPs). *** indicates correlation p < 0.001. (F) Allele frequencies in DNA and RNA are highly correlated. Indicated in red are SNPs within active (model-based p < 0.05) MPRA amplicons. Error bars represent standard deviation. Blue line indicates the linear model fit with 95 % confidence intervals. Dashed line with a slope of 1 was drawn for reference. Panels (A) – (F) include a set of 77 quality-filtered SNPs covered by over 500 DNA counts, over 1000 RNA counts, and with minor allele frequency above 0.05 in each sample. (G) Difference in reference allele frequencies between DNA and RNA, for the eight SNPs within active MPRA amplicons. Points indicate reference allele frequencies for each replicate. (H) Enhancer activity of reference and variant alleles (rs1108075 and rs11062166) of a novel enhancer in the schizophrenia-associated locus of the CACNA1C intron, amplicon #3 in the in vivo AAV MPRA, using a luciferase assay in HEK293 cells (top panel) and SH-SY5Y cells (bottom panel). * or ‡ indicates p < 0.05 compared to empty HspMinP vector or #256 negative control, respectively. ** or ‡‡ indicates p < 0.01 compared to empty HspMinP vector or #256 negative control, respectively. Statistical significance was determined using one-way ANOVA followed by Tukey’s multiple comparison test. In both HEK cells and SK cells, there were no differences between the relative luciferase activities driven by the reference and variant for amplicon #3.
Figure 2—figure supplement 5
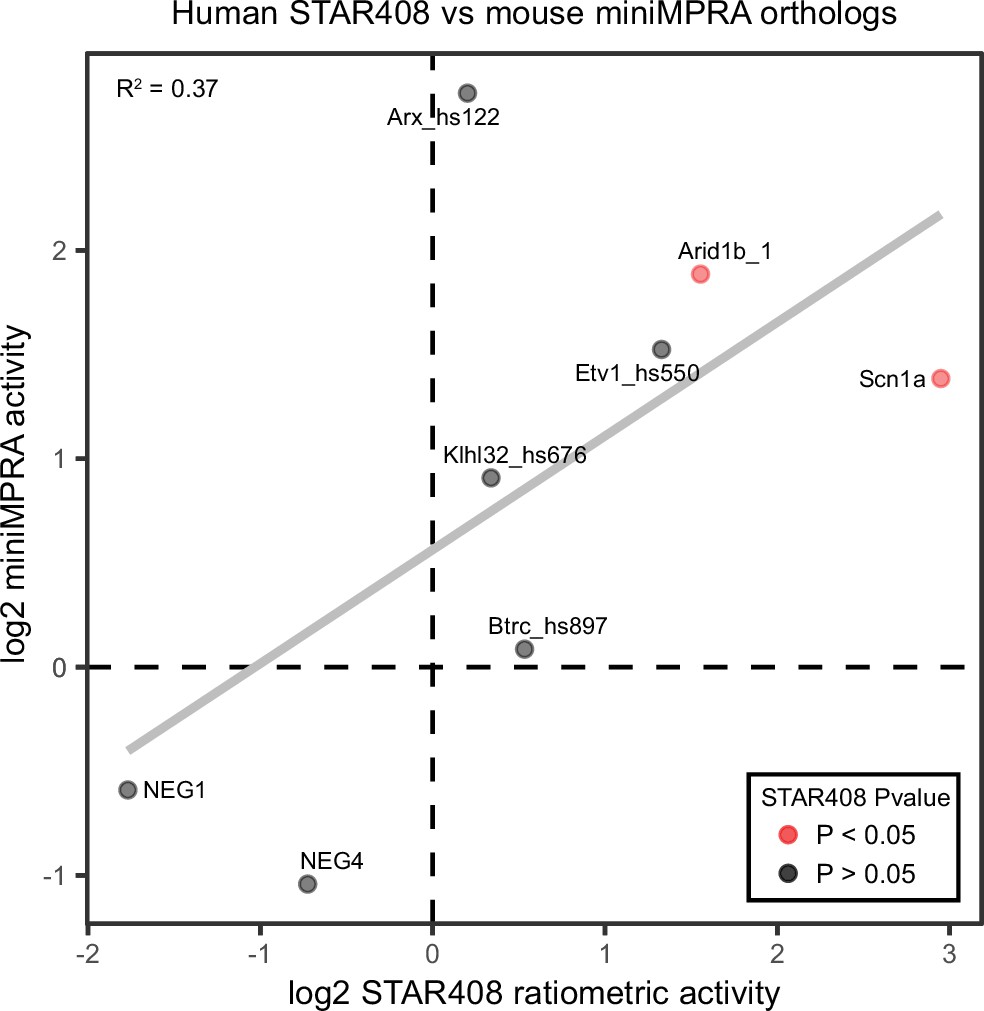
In vivo AAV MPRA replicates findings of the miniMPRA.
Correlation of the mouse orthologue miniMPRA with the human orthologues of the same sequence from the full MPRA library. Only amplicons that passed quality control criteria for both experiments are included.
Figure 3 with 2 supplements
Functional validation of STARR-seq screen.
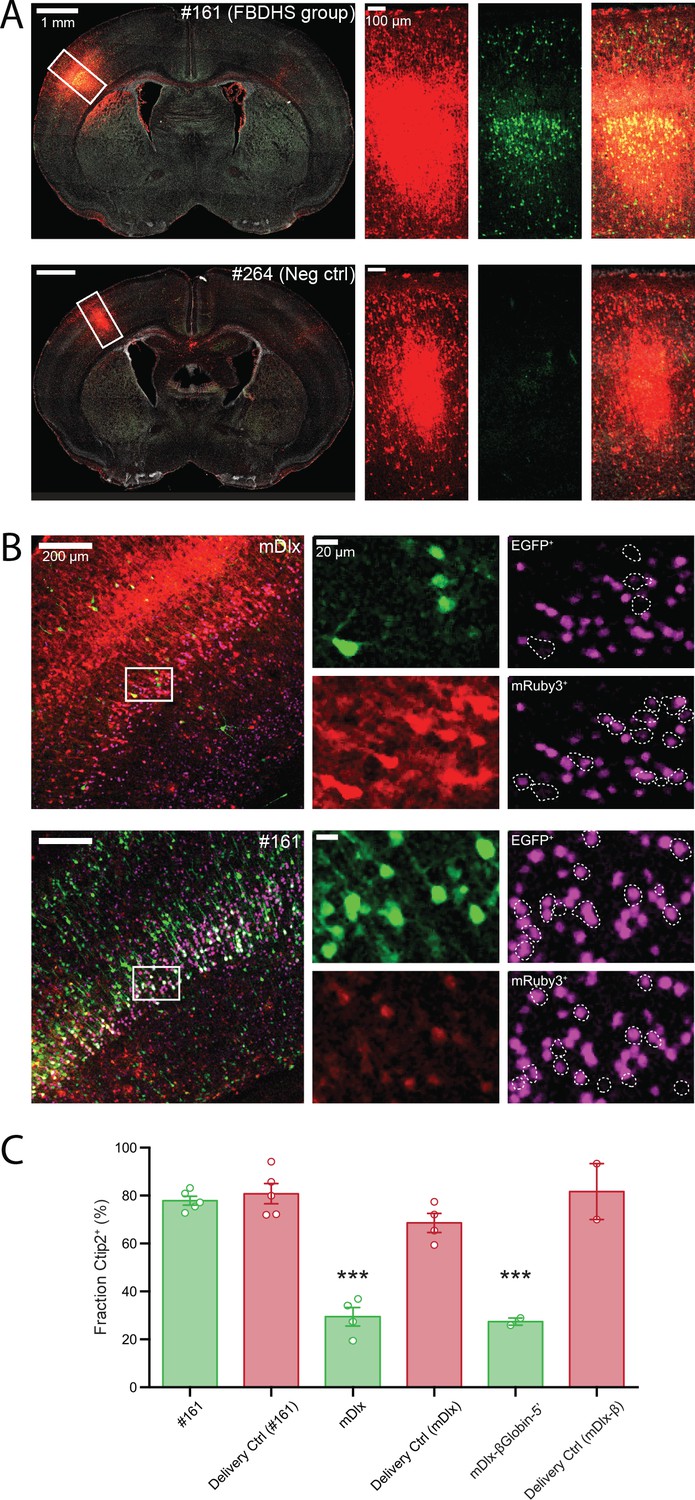
(A) Validation of positive and negative hits from in vivo AAV MPRA screen. Representative images of coronal sections of AAV-transduced P7 brains stained with an anti-GFP antibody is shown (left panels). Closeup of the boxed regions are shown in the panels on the right (from left to right: Red channel, mRuby3 injection control; Green channel, EGFP expression driven by candidate amplicon; Merge with DAPI in gray). The brain shown in the top row was transduced with AAV9-CAG-mRuby3 (injection delivery control) and scAAV9-HspMinP-EGFP carrying in the 3’-UTR Amplicon #161, a highly active amplicon in the AAV MPRA. In the bottom row, a similar transduction is shown for Amplicon #264, a negative control with no predicted enhancer activity that did not display activity in the in vivo AAV MPRA. (B) Functional validation of enhancer activity in different cell types. Brains were transduced as in A with AAV9-CAG-mRuby3 and scAAV9-HspMinP-EGFP carrying either Amplicon #161 or Dlx in the 3’-UTR. Brains were collected at P7 and stained for GFP and Ctip2, a transcription factor necessary for axon development in excitatory projection neurons in Layer V during embryonic development. Representative staining of coronal sections is shown (left panels). Zoomed in views of boxed regions are shown in single-channel images in the panels on the right (Green, EGFP; Red, mRuby3; Magenta, Ctip2). Ctip2 channel images are shown with EGFP+ cells outlined (top) and mRuby3+ cells outlined (bottom). (C) Quantification of Ctip2 co-labeling shown in B with additional animals co-transduced with AAV9-CAG-mRuby3 and AAV9-Dlx-βGlobinMinP-EGFP included for comparison. Individual GFP+ and mRuby3+ cells were counted and scored for whether each cell contained a Ctip2-positive nucleus. Cell counts were summed across images for the same brain. Data is presented as mean ± SEM for the fraction of fluorescent cells that are Ctip2+. Cells that expressed EGFP under the control of the inhibitory interneuron enhancer Dlx displayed a lower frequency of Ctip2+ nuclei compared to cells that drove EGFP under the control of amplicon #161 or drove mRuby3 under the control of the general mammalian promoter CAG (n = 5 animals co-injected with HspMinP-EGFP-#161 and CAG-mRuby3, four animals co-injected with HspMinP-EGFP-Dlx and CAG-mRuby3, and two animals co-injected with Dlx-βGlobinMinP-EGFP and CAG-mRuby3).
Figure 3—figure supplement 1

MPRA results for validated single candidates in genomic context.
UCSC Genome Browser representation of amplicons #161 (A), hg38, chr2:165,494,969–165,503,768 and #264 (B), hg38, chr6:157,260,877–157,269,676. UCSC tracks for GENCODE v36 and 100 vertebrate conservation are shown. Normalized coverage of aligned reads for DNA and RNA samples are shown for the four biological replicates; Y-axis scale is 0–30,000 reads. MPRA analysis is shown as graphs of linear model residuals and -log10 transformed p-values. Amplicon #161 (highlighted in blue) exhibits statistically significant enhancer activity while amplicon #264 does not.
Figure 3—figure supplement 2
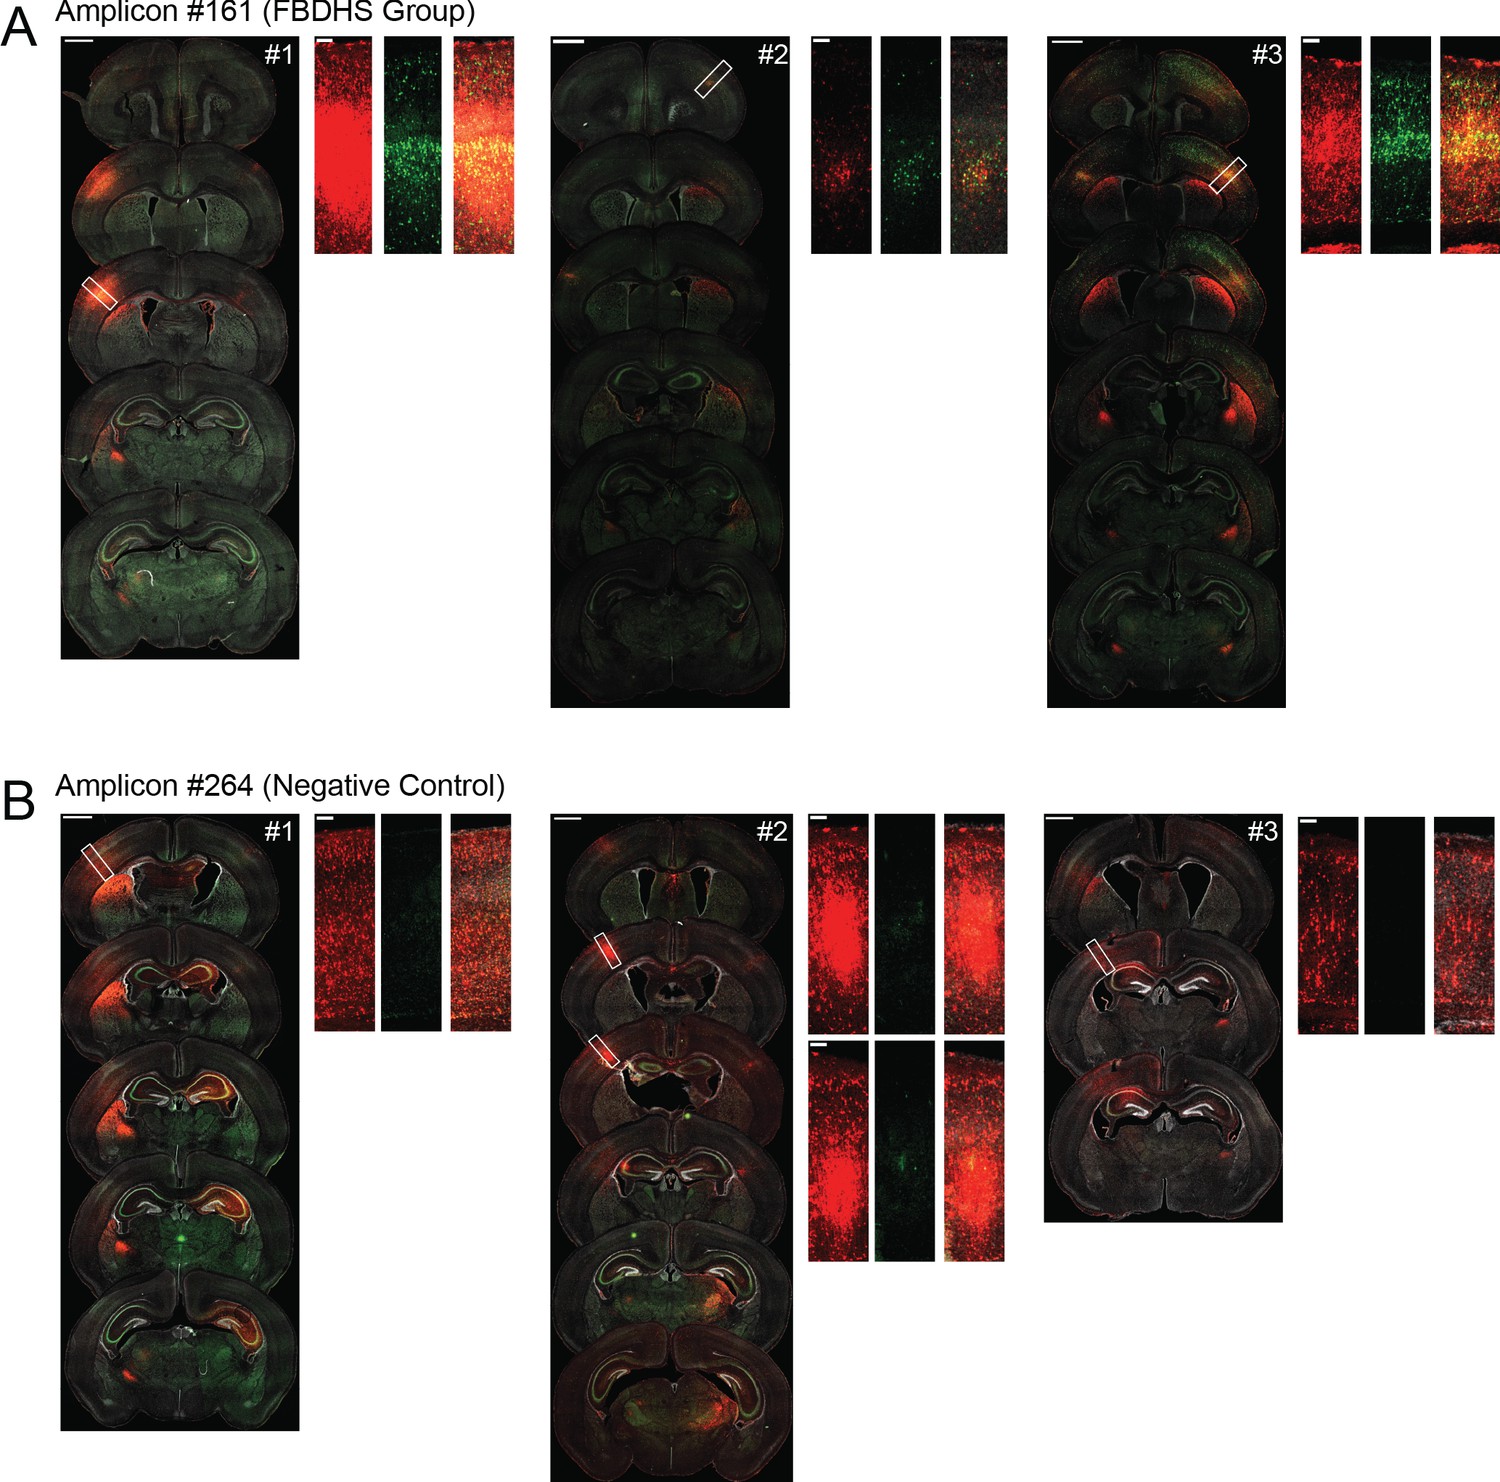
Replicates for validation of positive and negative MPRA hits.
Representative confocal images of coronal sections of brains transduced at P0 with AAV9-CAG-mRuby3 and either scAAV9-HspMinP-EGFP-#161 or scAAV9-HspMinP-EGFP-#264, three replicates for each condition. For each brain, the left panel shows a spread of coronal sections sampling the injection site as it appears across multiple sections of the brain (scale bar = 1 mm), and the right panels are closeup views of the boxed regions on the left panel (scale bar = 100 µm). mRuby3 is shown in red, EGFP is shown in green, DAPI is shown in gray.
Figure 4 with 3 supplements
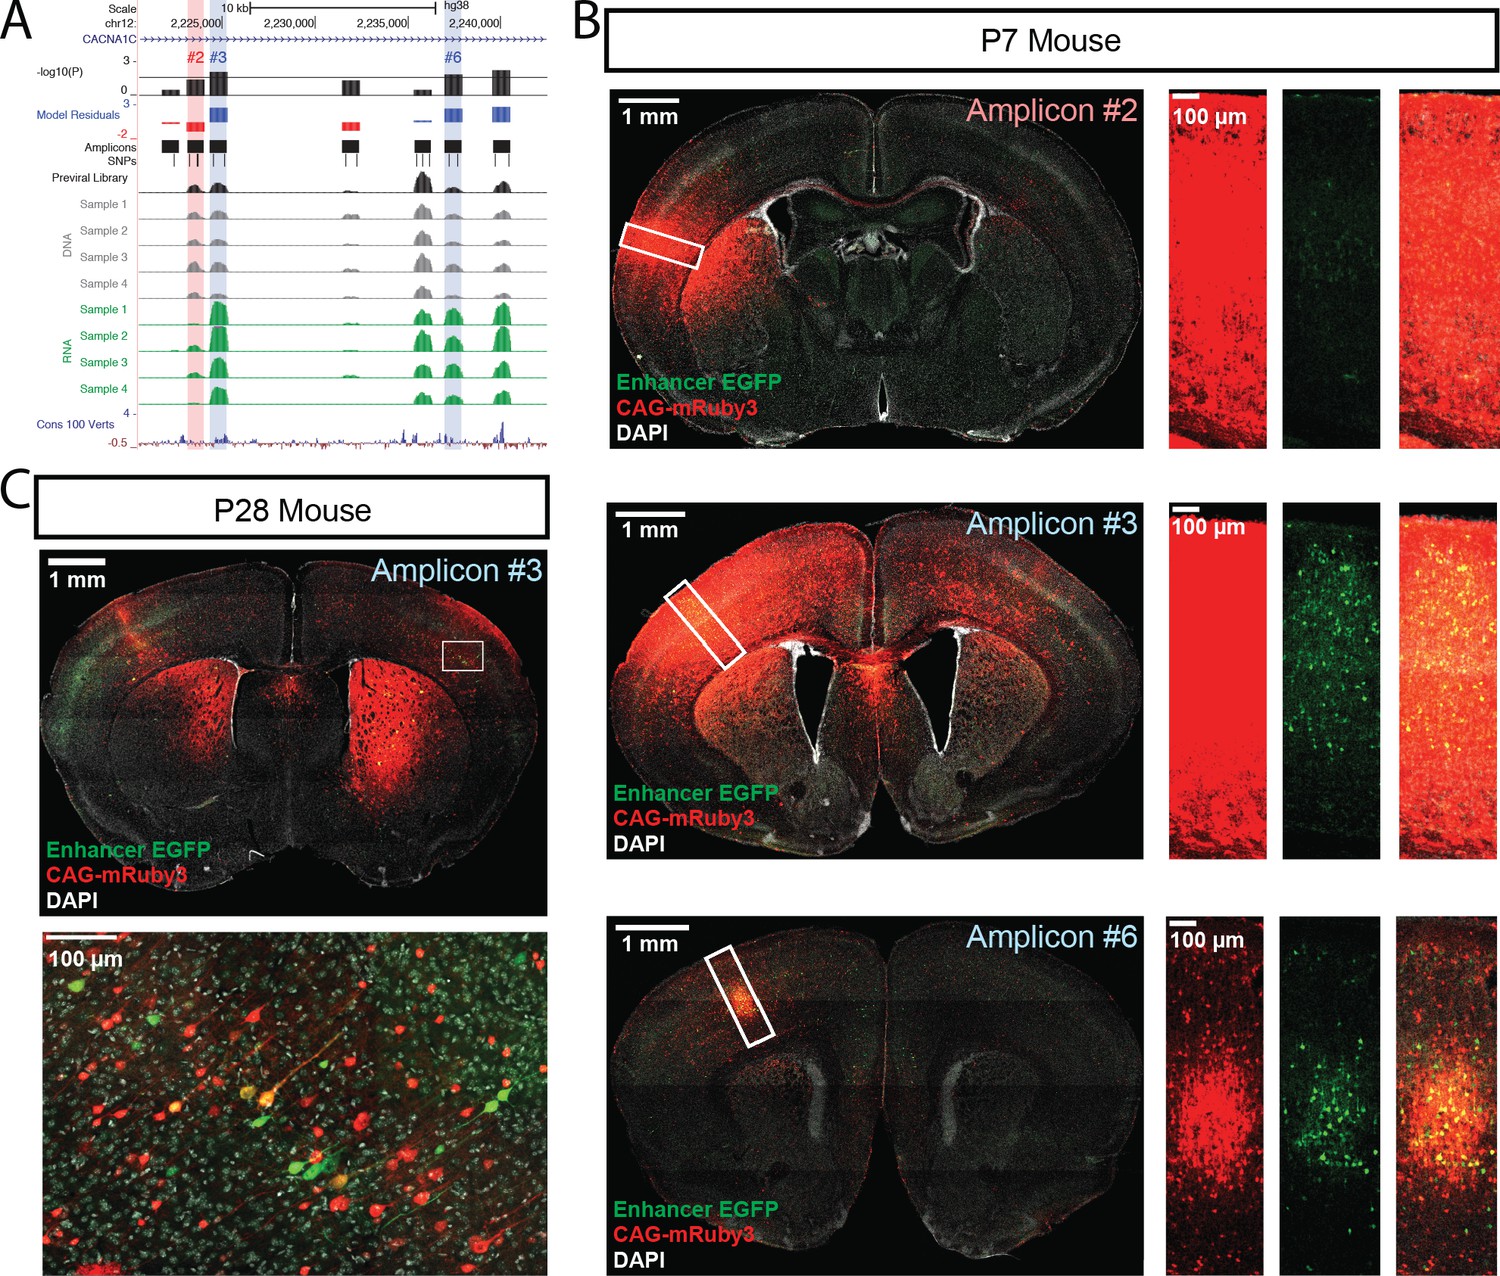
Functional dissection of the large third intron of CACNA1C.
(A) UCSC Genome Browser representation of amplicons #1 through #7 in the third intron of CACNA1C (hg38, chr12:2,220,500–2,242,499). UCSC tracks for GENCODE v36 and 100 vertebrate conservation, normalized coverage of aligned reads for the previral library, and DNA and RNA samples for the four biological replicates are shown; y-axis scale is 0–50,000 reads. MPRA analysis is shown as graphs of linear model residuals and -log10 transformed p-values. Three amplicons, #3, #6, and #7, were found significantly active in our assay. Amplicons which were tested in single-candidate experiments are highlighted (red for no activity in MPRA, blue for significant activity in MPRA) (B) Confocal images of single-candidate validation of amplicons #2, #3, and #6. Mice were transduced at P0 with two AAV vectors: one for an HspMinP-EGFP-3’-UTR enhancer reporter construct carrying the indicated amplicon and a second control vector, CAG-mRuby3. Brains were fixed at P7 and sectioned and stained with an antibody for EGFP for signal amplification. Tiled, whole section images are shown on the left. Closeup of boxed regions are shown in the panels on the right. Green, EGFP; red mRuby3; grey, DAPI. These experiments validated robust EGFP expression driven by the two positive MPRA hits (#3 and #6), with substantial EGFP reduction for the MPRA negative amplicon #2. (C) Mice were transduced with AAV including positive amplicon #3 and processed as in B, but were raised to P28 before fixing, sectioning, and staining.
Figure 4—figure supplement 1

Functional dissection of the third intron of CACNA1C.
UCSC Genome Browser representation of amplicons #1 through #22 in the third intron of CACNA1C (hg38, chr12:2,214,000–2,423,999 shown). UCSC tracks for GENCODE v36 and 100 vertebrate conservation are shown. Normalized coverage of aligned reads for the previral library, and DNA and RNA samples for the four biological replicates are shown; y-axis scale is 0–50,000 reads. MPRA analysis is shown as graphs of linear model residuals and -log10 transformed p-values. Amplicons #18 through #22 (far right) represent regions spanning hematocrit-associated SNPs, which do not show activity in our assay.
Figure 4—figure supplement 2
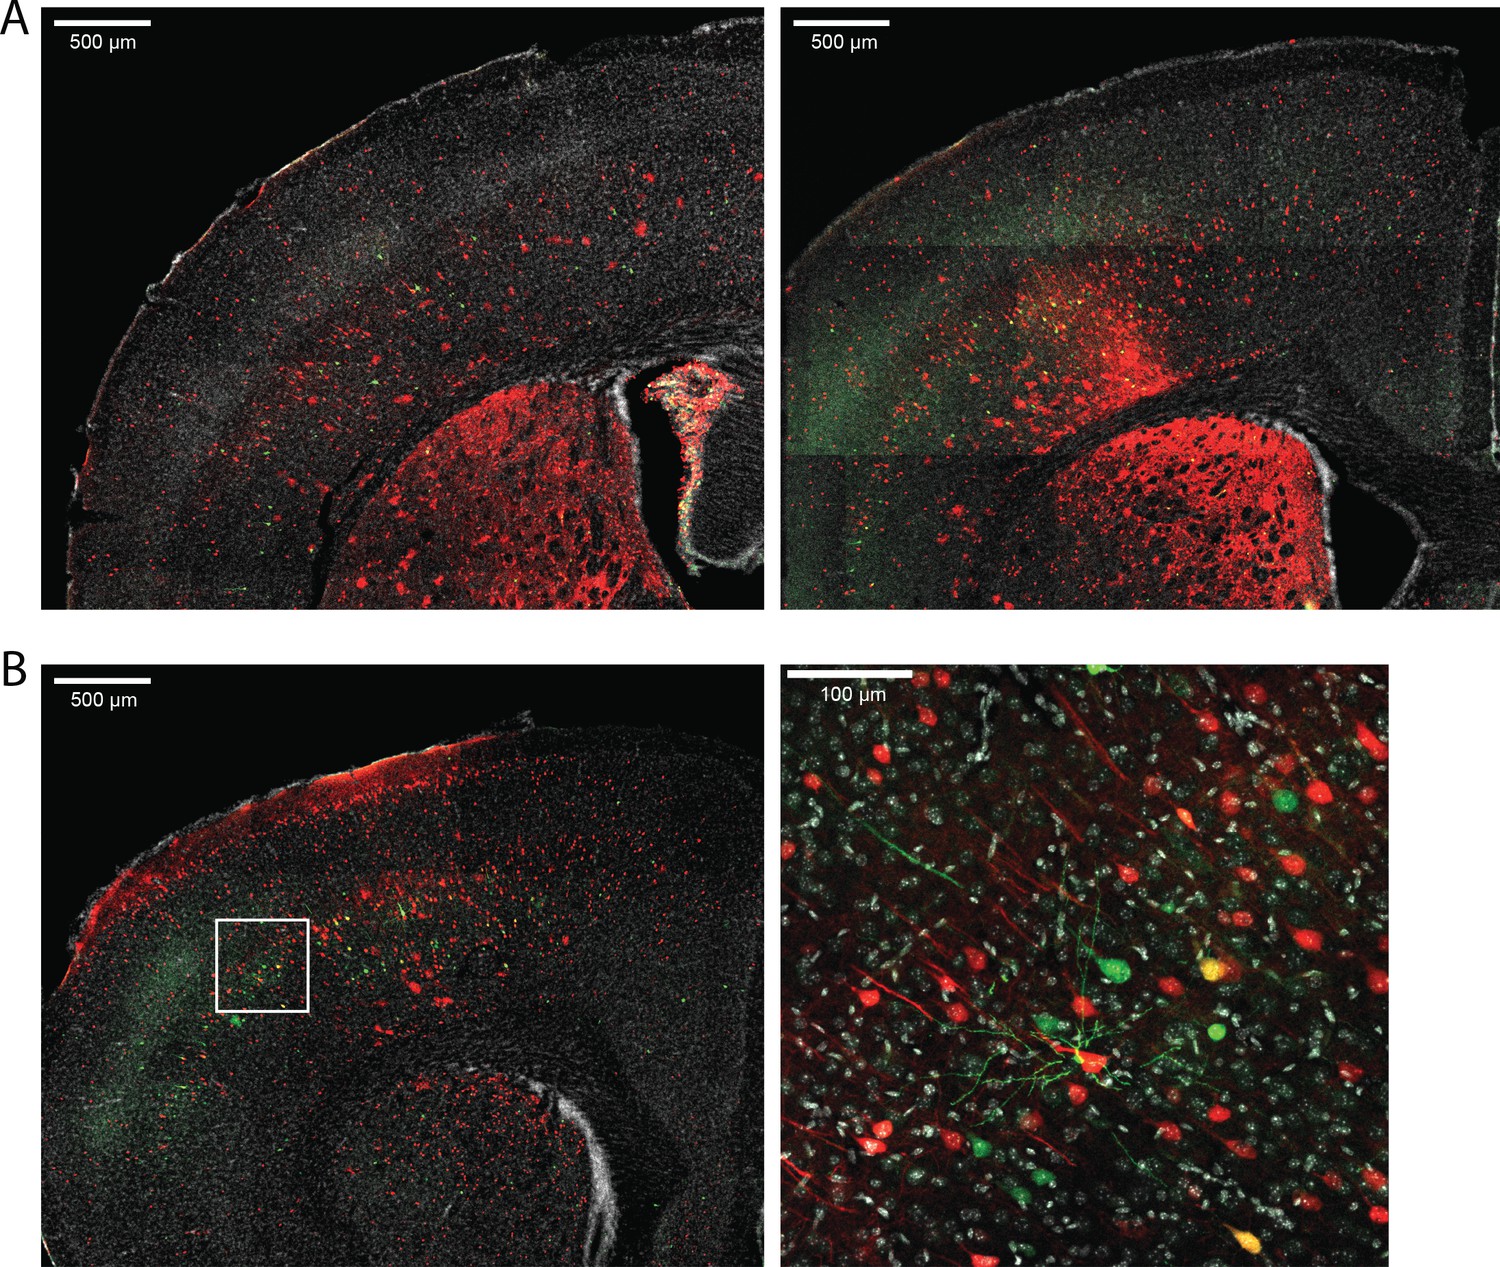
Amplicon #3 in the large intron of CACNA1C continues to drive EGFP expression in mouse brain at P28.
Mice injected intracranially with scAAV9-HspMinP-EGFP-#3 and AAV9-CAG-mRuby3 at P0 show robust expression of EGFP driven by the enhancer candidate Amplicon #3 at P28. (A) 5x confocal images showing EGFP and mRuby3 expression in two representative mice. (B) 5x and 25x images showing expression in a third representative mouse.
Figure 4—figure supplement 3
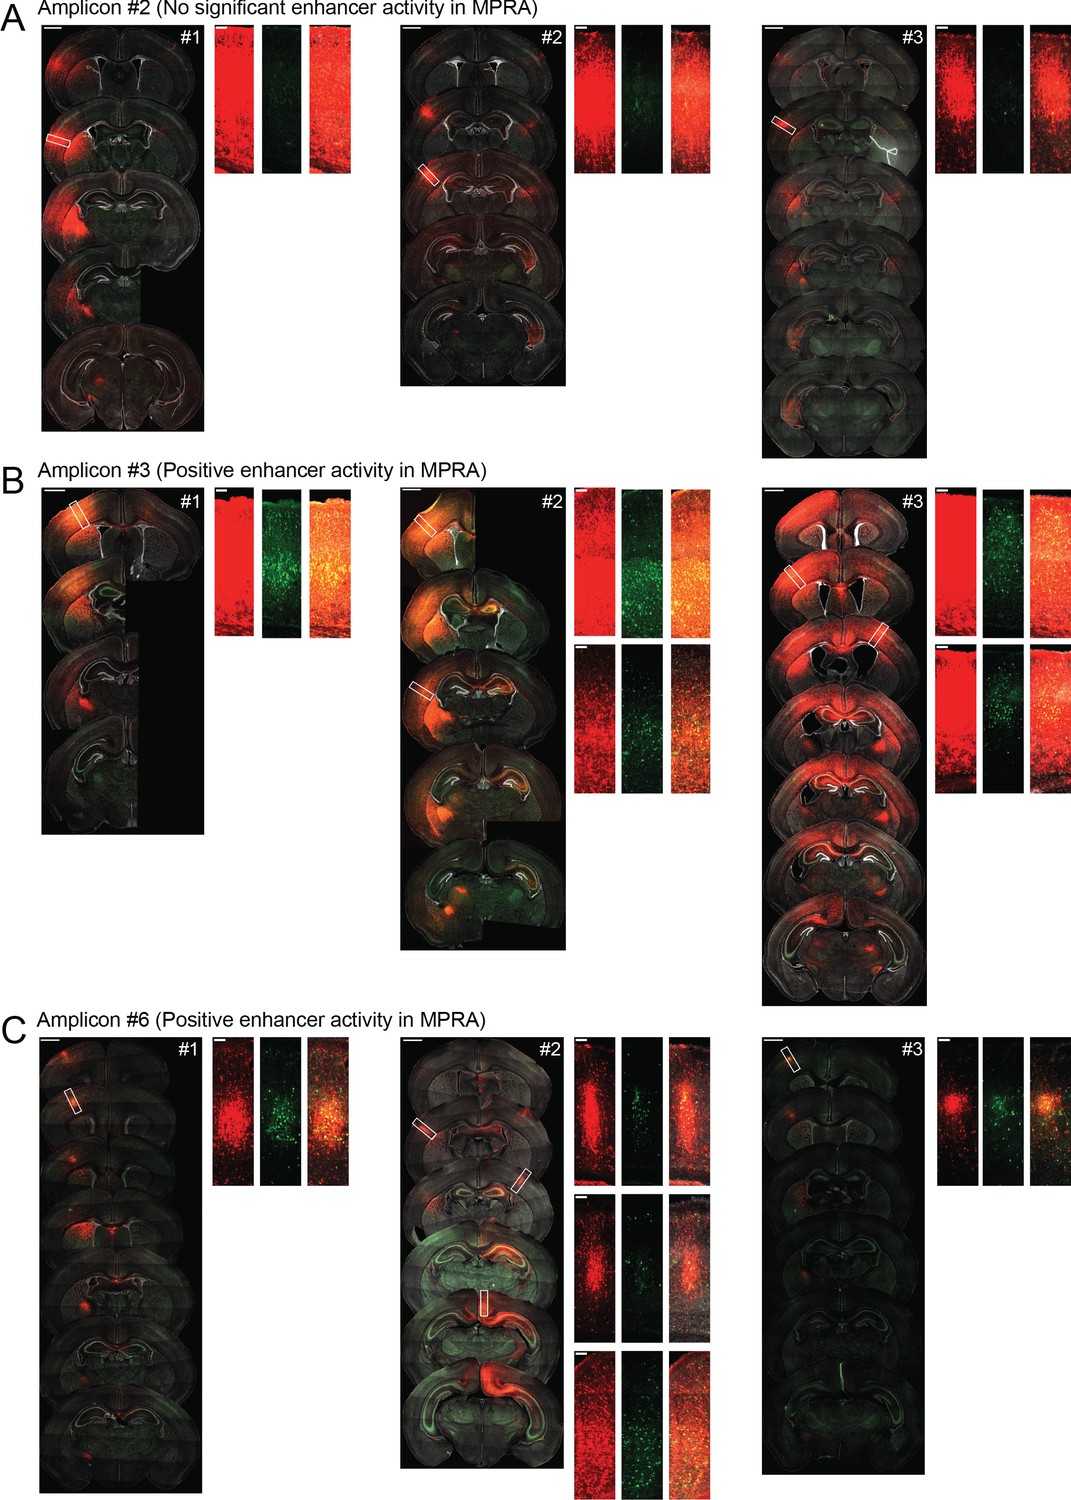
Replicates for functional dissection of CACNA1C LD interval.
Representative confocal images of coronal sections of brains transduced at P0 with AAV9-CAG-mRuby3 and either scAAV9-HspMinP-EGFP-#2, scAAV9-HspMinP-EGFP-#3, or scAAV9-HspMinP-EGFP-#6, three replicates for each condition. For each brain, the left panel shows a spread of coronal sections sampling the injection site as it appears across multiple sections of the brain (scale bar = 1 mm), and the right panels are close up views of the boxed regions on the left panel (scale bar = 100 µm). mRuby3 is shown in red, EGFP is shown in green, DAPI is shown in gray.
Author response image 1
Author response image 2
Additional files
-
Supplementary file 1
miniMPRA_counts_prop_act.csv.
Chr, Start_mm10, End_mm10 – Genomic coordinates of the miniMPRA amplicons;miniMPRA_ID – miniMPRA identifiers;Maxi, S1, S2, S3, S4 – pre-viral library Maxiprep, and RNA library counts of 4 biological replicates;miniMPRA_mean_counts, miniMPRA_SD_counts – mean and standard deviation of sample S1-S4 counts;Maxi_prop, S1_prop, S2_prop, S3_prop, S4_prop – proportions of counts normalized to library depth;miniMPRA_mean_counts_prop, miniMPRA_SD_counts_prop – miniMPRA_mean_counts miniMPRA_SD_counts scaled by their count proportions;miniMPRA_mean_prop, miniMPRA_SD_prop – mean and standard deviation of S1-S4_prop;S1_act, S2_act, S3_act, S4_act – MPRA activity calculated relatively to the Maxi_prop; miniMPRA_mean_act, miniMPRA_SD_act – mean and standard deviation of S1-S4_act;ID – Amplicon number of the orthologous MPRA amplicon in the STAR408 library.
- https://cdn.elifesciences.org/articles/69479/elife-69479-supp1-v2.csv
-
Supplementary file 2
STAR408_bed_GRCh38_coordinates.csv.
Chr, Start_GRCh38, End_GRCh38 – genomic coordinates of MPRA amplicons;Amp_name – amplicon name, including amplicon number;Group – Amplicon group: LD, GWAS, FBDHS, or PutEnh.
- https://cdn.elifesciences.org/articles/69479/elife-69479-supp2-v2.csv
-
Supplementary file 3
STAR408_counts.csv.
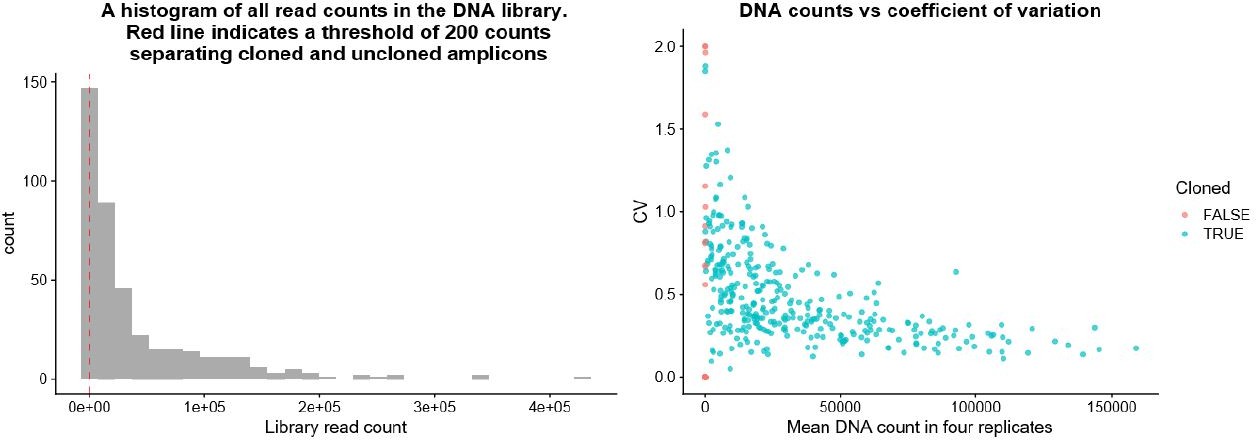
Chr, Start_GRCh38, End_GRCh38 – genomic coordinates of the MPRA amplicons;Amp_name – amplicon name, including amplicon number; Maxi_counts – pre-viral Maxiprep library counts;L1_DNA_count, L2_DNA_count, L3_DNA_count, L4_DNA_count – DNA counts;L1_RNA_count, L2_RNA_count, L3_RNA_count, L4_RNA_count – RNA counts;L4_RNA_count_35 – RNA counts of a technical replicate subjected to 35 PCR cycles;Cloned_successfully – a Boolean flag indicating amplicons with at least 200 counts in the pre-viral Maxiprep library.
- https://cdn.elifesciences.org/articles/69479/elife-69479-supp3-v2.csv
-
Supplementary file 4
lm_308_data.csv.
Amp_number – unique amplicon number; Amp_name - amplicon name, including amplicon number; Chr, Start, End – genomic coordinates of the MPRA amplicons, GRCh38 coordinates; Group – amplicon group: LD, GWAS, FBDHS, or PutEnh; L1_DNA_count, L2_DNA_count, L3_DNA_count, L4_DNA_count – DNA counts; L1_RNA_count, L2_RNA_count, L3_RNA_count, L4_RNA_count – RNA counts; DNA_count_mean, DNA_count_SD, RNA_count_mean, RNA_count_SD – mean and standard deviation of DNA and RNA counts; L1_DNA_prop, L2_DNA_prop, L3_DNA_prop, L4_DNA_prop – DNA proportions; L1_RNA_prop, L2_RNA_prop, L3_RNA_prop, L4_RNA_prop – RNA proportions; DNA_prop_mean, DNA_prop_SD, RNA_prop_mean, RNA_prop_SD – mean and standard deviations of DNA and RNA proportions; L1_Activity, L2_Activity, L3_Activity, L4_Activity – ratiometric activity; Mean_act, Mean_act_SD – mean and standard deviation of ratiometric activity; Maxi_counts, Maxi_prop – pre-viral Maxiprep counts and proportions; GC – GC content in the amplicon sequence; MeanRatio_MoM – mean ratiometric activity calculated as RNA_prop_mean / DNA_prop_mean; MeanRatio, MeanRatio_sd – mean ratiometric activity calculated as means of L1 - L4_Activities, and its standard deviation; Act_Rank – rank of the mean ratiometric activity MeanRatio_MoM; Residuals_Manual – linear model residuals; Residuals_Z_scaled_to_lm – Z-scaled linear model residuals; Pvalue – P values of the lm residuals; qval_lfdr_two_tailed – empirical tail area-based FDR calculated using lfdrtool R package; qval_lfdr_one_tailed_significant_at_0.1 – Boolean flags indicating significance at FDR < 0.1; Pvalue_two_tailed – two-tailed P values; BH_FDR_two_tailed - Benjamini-Hochberg adjusted P values, two-tailed; BH_FDR_one_tailed_significant_at_0.1 – Boolean flags indicating significance at FDR < 0.1; Pvalue_WRS_two_tailed – P values of a two-tailed Wilcoxon rank-sum (WRS) test; WRS_conf_low, WRS_conf_high – confidence intervals for the WRS test; WRS_BH_FDR_two_tailed – WRS Benjamini-Hochberg corrected P values, two-tailed; WRS_sig_one_tailed – descriptors indicating the level of WRS significance;
- https://cdn.elifesciences.org/articles/69479/elife-69479-supp4-v2.csv
-
Supplementary file 5
Epigenomic_intersections.csv.
Amp_number – unique amplicon number; Amp_name – amplicon name, including amplicon number;Group – amplicon group: LD, GWAS, FBDHS, or PutEnh;Residuals_Z_scaled_to_lm – Z-scaled linear model residuals; Pvalue – P values of the linear model residuals; DNase_Roadmap, H3K27me3_Roadmap… – Boolean flags (columns) indicating amplicon intersections with MPRA amplicons (rows); TRUE = amplicon interval intersects with the epigenomic mark.
- https://cdn.elifesciences.org/articles/69479/elife-69479-supp5-v2.csv
-
Supplementary file 6
Epigenomic_predictors_of_activity.csv.
Epigenomic_predictor – epigenomic mark;Epi_GLM_covariate_P_value – T-test P value of the general linear model (GLM) epigenomic covariate;P_0.05, P_0.05_Bonf.corr – Boolean flags indicating P value significance, without and with Bonferroni correction;Point_biserial_cor – Point-biserial correlations between the Residuals_Z_scaled_to_lm and epigenomic marks. Positive values indicate positive correlations with epigenomic signatures;BIC_without_epi_mark – Bayesian information criterion (BIC) values evaluating a general linear model (GLM) without the epigenomic covariate;BIC_with_epi_mark – BIC values evaluating GLMs with each epigenomic covariate;Model_improved_by_BIC – Boolean flags indicating if a GLM prediction improved (reduced BIC) following the epigenomic covariate addition to the model.
- https://cdn.elifesciences.org/articles/69479/elife-69479-supp6-v2.csv
-
Supplementary file 7
SNP_All_440.csv.
Amp_number – unique amplicon number;Name - amplicon name, including amplicon number;Group2 – a secondary MPRA amplicon group designator;Group – amplicon group: LD, GWAS, FBDHS, or PutEnh;chr, position – SNP genomic coordinates, GRCh38 genome; SNP_ID – SNP identifiers;reference_base – wild type allele base at the SNP genomic position, GRCh38 genome;Maxi_depth, Maxi_ref_freq – SNP read coverage and the fraction of the reference allele base at the SNP position in the pre-viral maxiprep library;L1_DNA_depth, L1_DNA_ref_freq…L1_RNA_depth, L1_RNA_ref_freq… - – SNP read coverage and the fraction of reference allele bases at the SNP position in the RNA and DNA samples;Min_DNA_depth – a Boolean flag indicating if a SNP is covered by at least 500 reads in all 4 DNA samples;Min_RNA_depth – a Boolean flag indicating if a SNP is covered by at least 1,000 reads in all 4 RNA samples;Minor_allele_freq_threshold – a Boolean flag indicating if a SNP has minor allele frequency over 0.05.
- https://cdn.elifesciences.org/articles/69479/elife-69479-supp7-v2.csv
-
Supplementary file 8
STAR408_GEO_Metadata.xlsx.
Gene Expression Omnibus metadata file including sample, sequencing library, and fastq file characteristics.
- https://cdn.elifesciences.org/articles/69479/elife-69479-supp8-v2.xlsx
-
Supplementary file 9
In silico PCR.csv.
UNIQID – amplicon name, including amplicon number;Left.Primer / Right.Primer – PCR primer sequences;Tm.Left / Tm.Right – melting temperature of the primers [oC];Amplicon.Length – PCR amplicon length [bp];Primer.ID - unique amplicon number;Amplicon.Range_hg19 – genomic coordinates, hg19 genome;Group - a secondary MPRA amplicon group designator;Notes – notes about the primer design;Chr – chromosome of the designed amplicon;Chr_GRCh38_pred, Amplicon_Start_GRCh38,Amplicon_End_GRCh38 – genomic coordinates of the predicted in-silico PCR products;Amplicon_length_GRCh38 – in-silico PCR predicted amplicon length;PCR_efficiency – predicted in-silico PCR efficiency;Sequence_GRCh38 – amplicon sequence;GC_content – GC content in the amplicon sequence.
- https://cdn.elifesciences.org/articles/69479/elife-69479-supp9-v2.csv
-
Transparent reporting form
- https://cdn.elifesciences.org/articles/69479/elife-69479-transrepform1-v2.pdf
Download links
A two-part list of links to download the article, or parts of the article, in various formats.
Downloads (link to download the article as PDF)
Open citations (links to open the citations from this article in various online reference manager services)
Cite this article (links to download the citations from this article in formats compatible with various reference manager tools)
Parallel functional testing identifies enhancers active in early postnatal mouse brain
eLife 10:e69479.
https://doi.org/10.7554/eLife.69479


