Molecular basis of the PIP2-dependent regulation of CaV2.2 channel and its modulation by CaV β subunits
- Department of Brain Sciences, Daegu Gyeongbuk Institute of Science and Technology (DGIST), Republic of Korea
Figures
Figure 1 with 3 supplements

Current inactivation and PIP2 sensitivity in N-type CaV2.2 channels with different subtypes of the β2 subunit.
(A) Schematic diagram of high-voltage-activated (HVA) calcium channel complex viewed from the intracellular side (left). CaV β subunit is located beside the domain II of α1B in the cytosolic side while CaV α2δ subunit is mostly localized at the extracellular surface of the channel protein (Gao et al., 2021). Schematic model of CaV2.2 channels with plasma membrane (PM)-anchored β2a, cytosolic β2a(C3,4S) and β2c, or N-terminus engineered PM-recruited β2c (right). (B) Representative confocal images of tsA-201 cells expressing the PM marker Lyn-mCh and β2 isoforms or its derivatives fused to GFP without the α1 and α2δ1 subunits. Scale bar, 5 μm. The scatter plot shows a 2D intensity histogram of the red (Lyn-mCh) and green (β2-GFP) pixels in the confocal image. The value indicates the Pearson’s correlation coefficient (R) that is obtained by the Colocalization Threshold plugin of Fiji software (Image J). (C) Summary of Pearson’s coefficient between Lyn-mCh and the β2 construct (n = 10–11). (D) Current inactivation of CaV2.2 channels with β2 isoforms or its derivatives was measured during 500-ms test pulses to +10 mV (top). Current inhibition of CaV2.2 channels by Dr-VSP-mediated PIP2 depletion (bottom). The current traces before (a) and after (b) the strong depolarizing pulse to +120 mV were superimposed. Peak tail current is indicated by arrowheads (trace a, black head; trace b, red head). (E) Summary of current inactivation (top; n = 10–11) and inhibition (%) by PIP2 depletion (bottom; n = 10–11) in CaV2.2 channels with the β2 constructs. r100 indicates the fraction of current remaining after 100-ms depolarization to +10 mV (top). Dots indicate the individual data points for each cell. Data are mean ± standard error of the mean (SEM). ***p < 0.001, using one-way analysis of variance (ANOVA) followed by Tukey post hoc test.
-
Figure 1—source data 1
Current inactivation (r100) and current inhibition (%) by PIP2 depletion in N-type CaV2.2 channels with different subtypes of the β2 subunit.
- https://cdn.elifesciences.org/articles/69500/elife-69500-fig1-data1-v1.xlsx
Figure 1—figure supplement 1
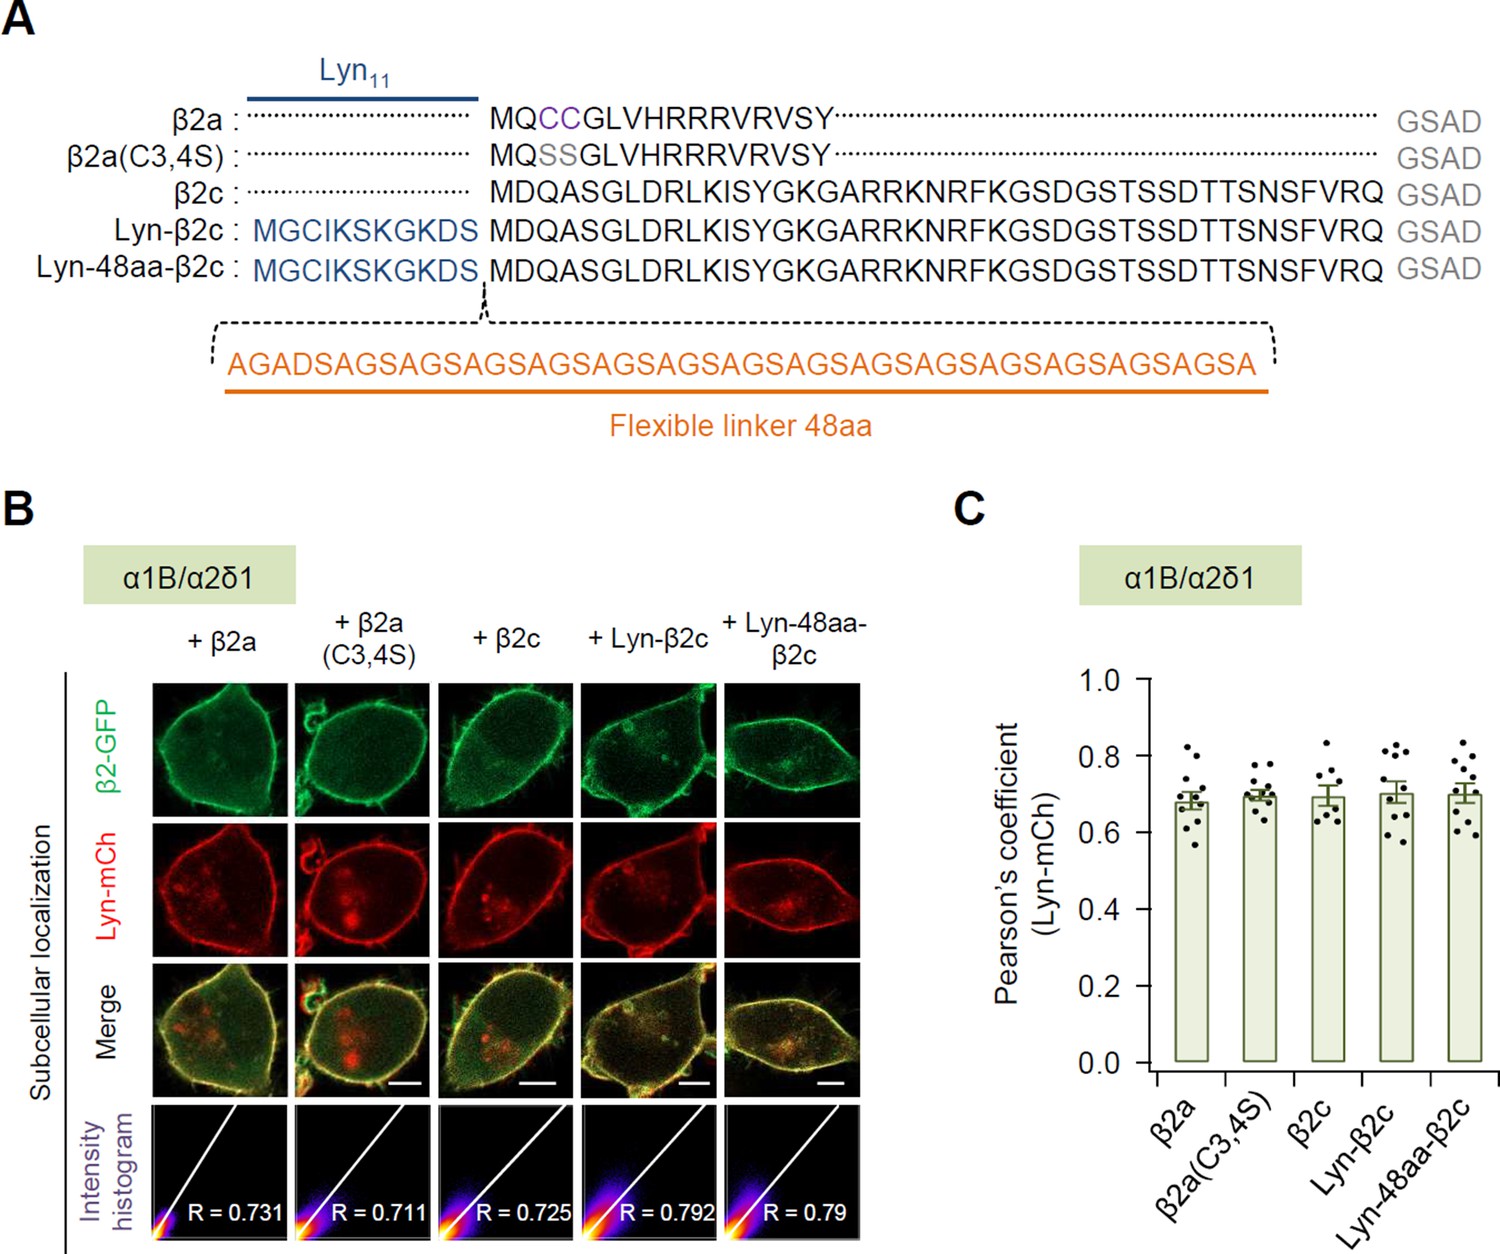
Subcellular localization of N-terminus engineered constructs of β2 subunit in the presence of α1 and α2δ1 subunits.
(A) Comparison of the N-terminal sequences of N-terminus engineered β2 construct. In the palmitoylation-resistant mutant β2a(C3,4S), the palmitoylation residues cysteine 3 and 4 (purple) are replaced with serine (gray). Lyn anchored to the plasma membrane via the myristoylation and palmitoylation modification sequence Lyn11 (blue). Orange indicates flexible linker between Lyn and β2c subunit. (B) Representative confocal images of tsA-201 cells expressing plasma membrane marker Lyn-mCh and β2 engineered derivatives fused to GFP in the presence of α1 and α2δ1 subunits. Scale bar, 5 μm. The scatter plot shows a 2D intensity histogram of the red (Lyn-mCh) and green (β2-GFP) pixels in the confocal image. The text indicates the Pearson’s correlation coefficient (R) values. (C) Summary of Pearson’s coefficient between the Lyn-mCh and each β2 engineered derivatives with α1 and α2δ1 subunits. Dots indicate the individual data points for each cell (n = 8–11). Data are mean ± standard error of the mean (SEM). No significant difference among the cells.
-
Figure 1—figure supplement 1—source data 1
Pearson’s coefficient between Lyn-mCh and the β2 construct in the presence of α1 and α2δ1 subunit.
- https://cdn.elifesciences.org/articles/69500/elife-69500-fig1-figsupp1-data1-v1.xlsx
Figure 1—figure supplement 2
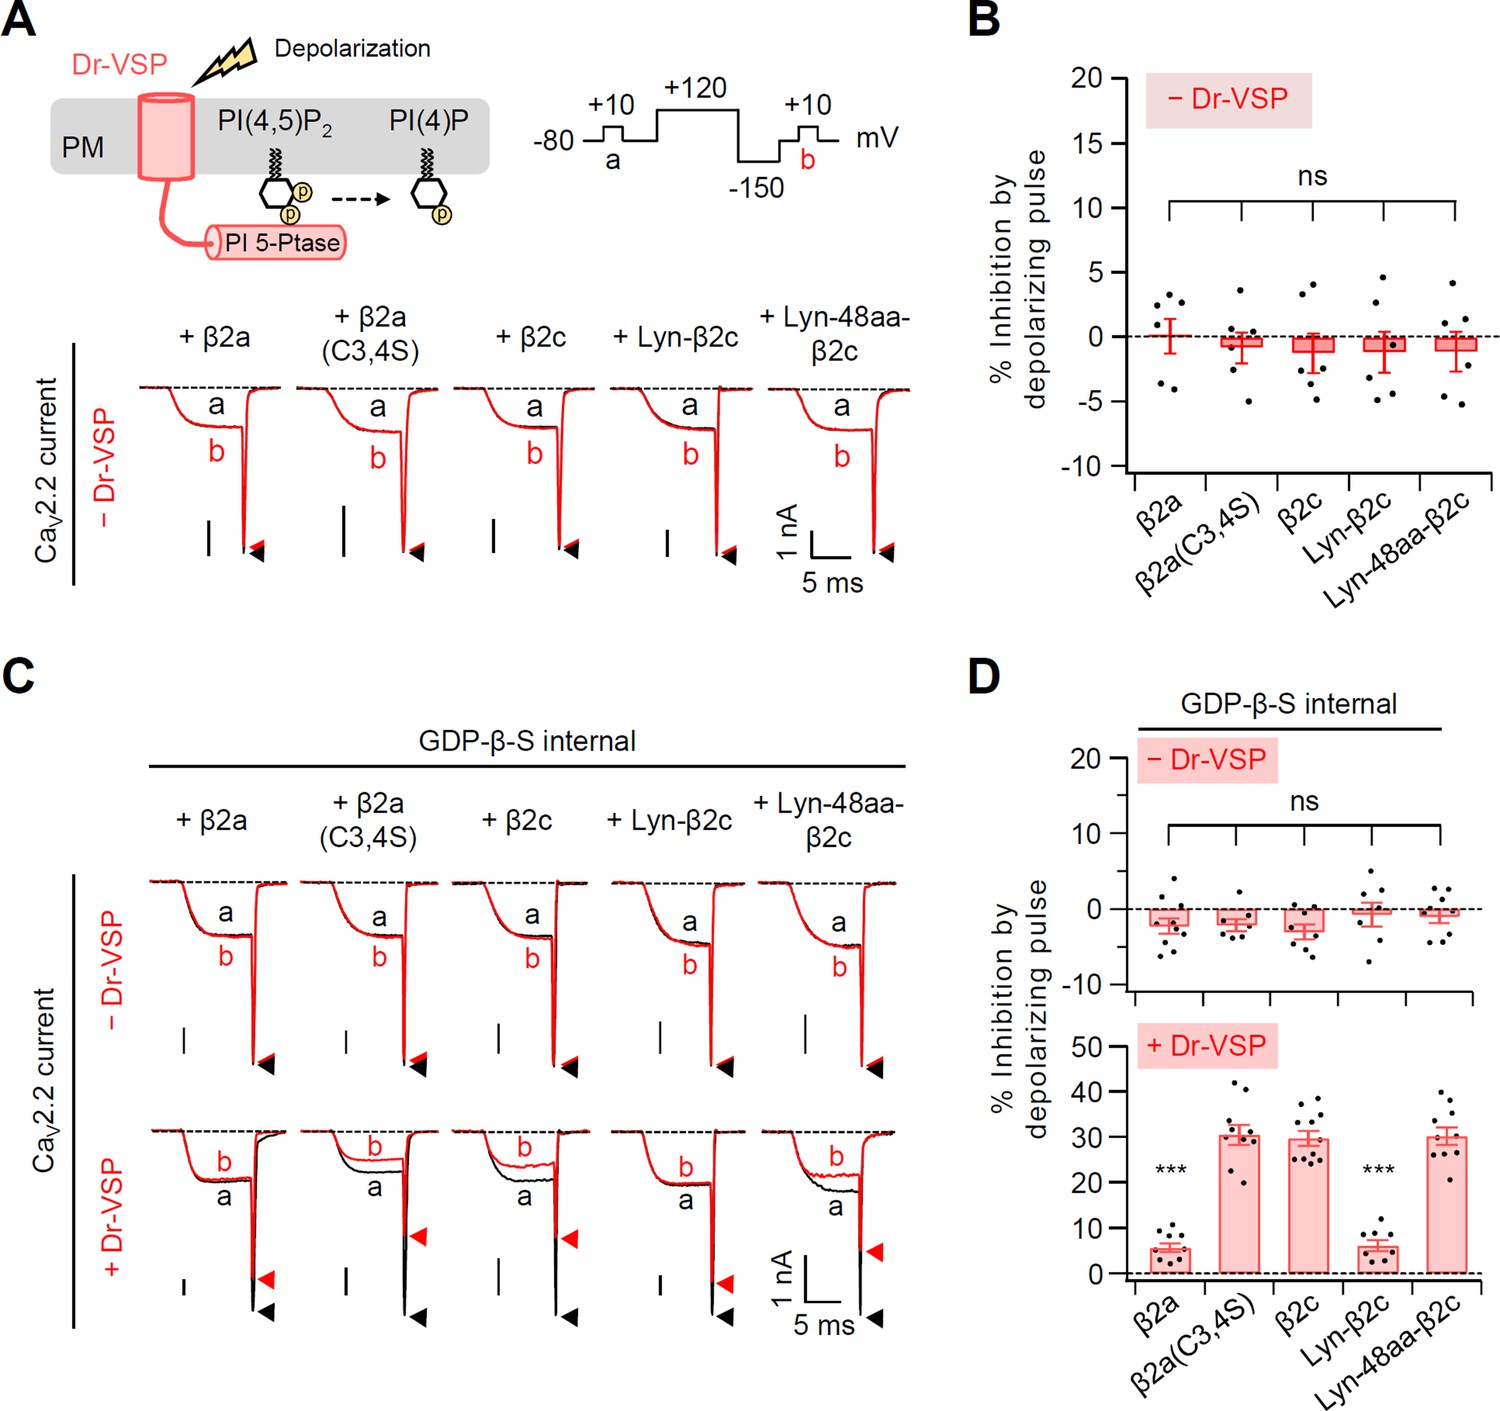
Summary of the CaV2.2 current inhibition by a 120-mV-depolarizing pulse in cells without or with Dr-VSP.
(A) Schematic diagram showing the Dr-VSP activation by depolarizing pulse protocol (top). CaV2.2 currents before (a) and after (b) the depolarizing pulse are superimposed in cells intracellularly perfused with 0.1 mM GTP without Dr-VSP expression (bottom). Peak tail current is indicated by arrowheads (trace a, black head; trace b, red head). (B) Summary of the CaV2.2 current inhibition (%) by a depolarizing pulse to +120 mV in cells without Dr-VSP (n = 6). (C) Current inhibition by a 120-mV-depolarizing pulse was recorded in cells intracellularly perfused with 1 mM GDP-β-S without (top) or with (bottom) Dr-VSP expression. (D) Summary of the CaV2.2 current inhibition (%) by depolarizing pulse without (top) and with (bottom) Dr-VSP expression (n = 8–11). Dots indicate the individual data points for each cell. Data are mean ± standard error of the mean (SEM). ***p < 0.001, using one-way analysis of variance (ANOVA) followed by Tukey post hoc test.
-
Figure 1—figure supplement 2—source data 1
Current inhibition (%) by a depolarizing pulse in cells in the absence of Dr-VSP.
- https://cdn.elifesciences.org/articles/69500/elife-69500-fig1-figsupp2-data1-v1.xlsx
-
Figure 1—figure supplement 2—source data 2
Summary of the CaV2.2 current inhibition by Dr-VSP-mediated PIP2 depletion in cells were recorded with pipette solution containing GDP-β-S.
- https://cdn.elifesciences.org/articles/69500/elife-69500-fig1-figsupp2-data2-v1.xlsx
Figure 1—figure supplement 3
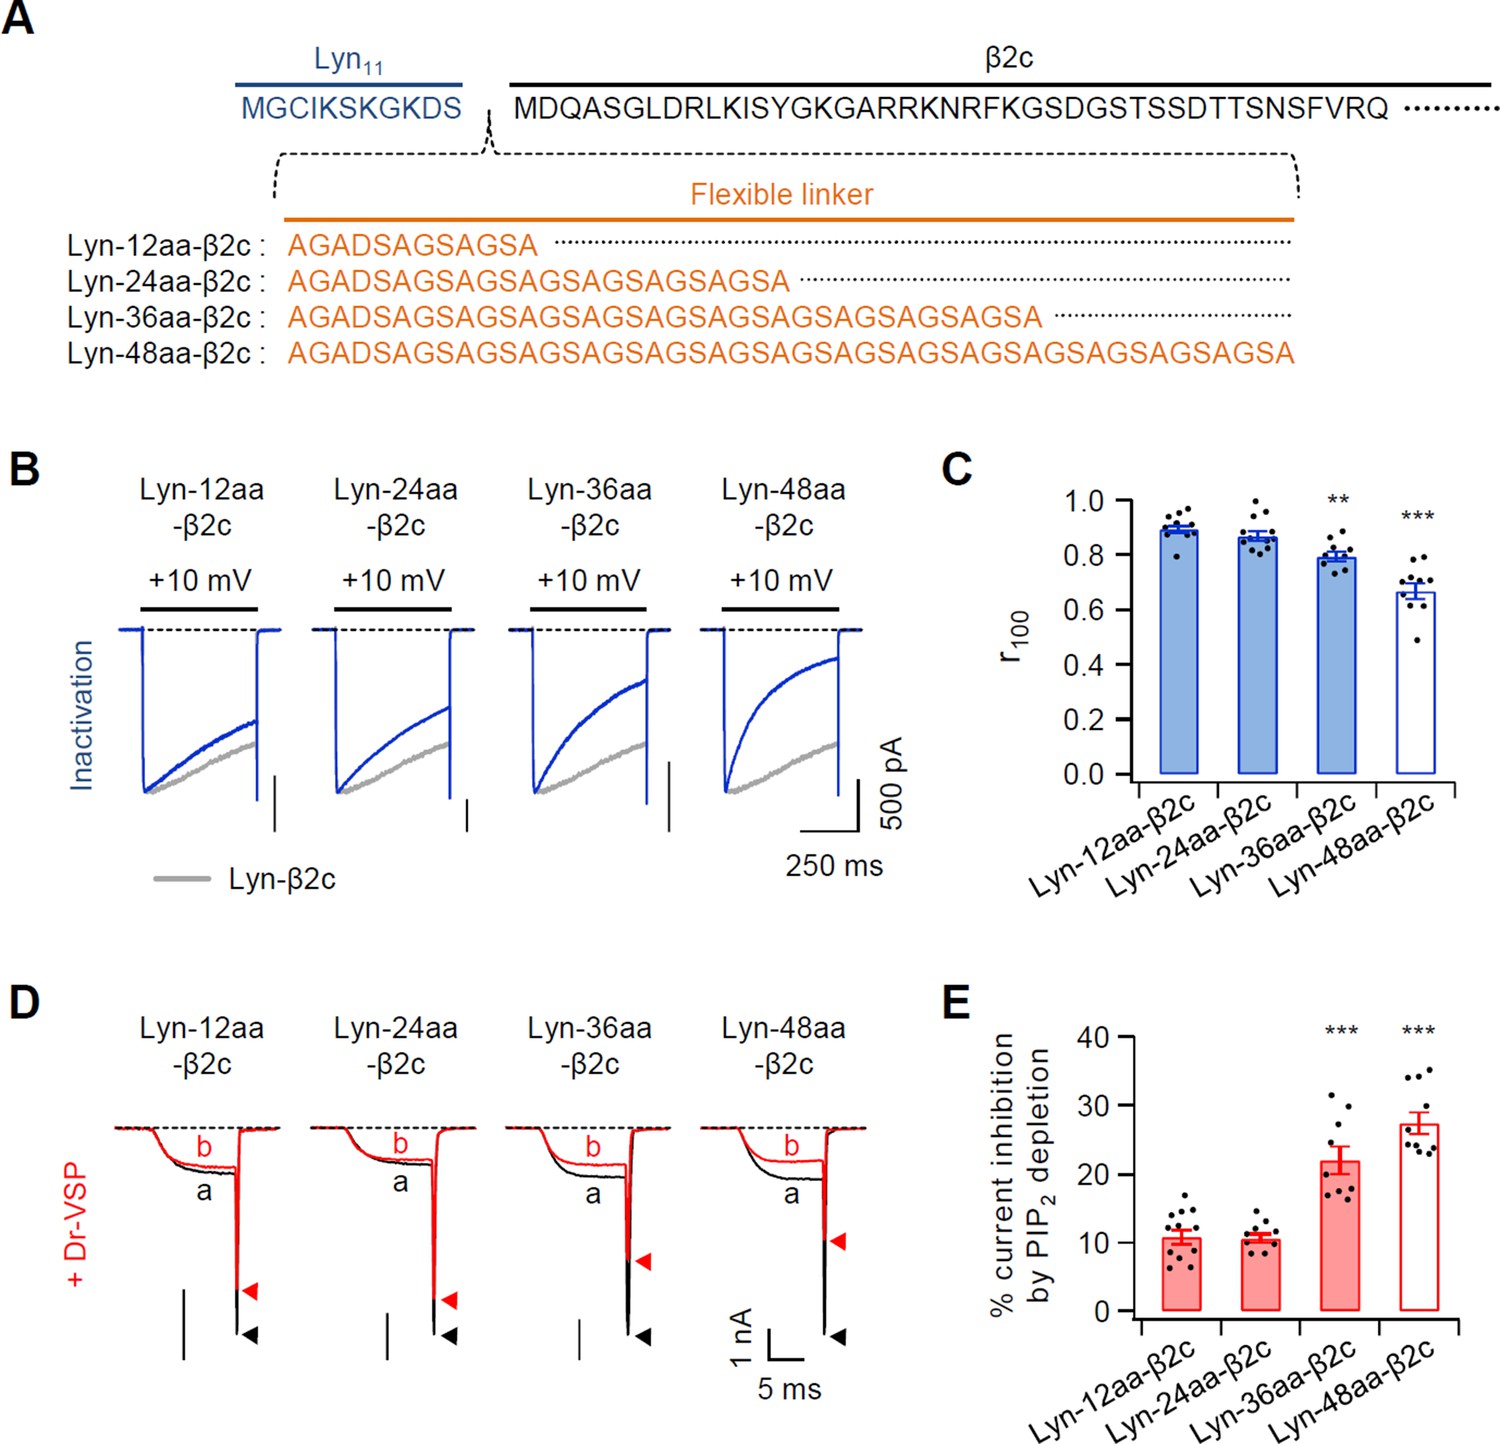
Effects of inserting a flexible linker between Lyn and β2c subunit on current inactivation and PIP2 sensitivity of CaV2.2 channels.
(A) Amino acid sequences of inserting a linker (orange) between Lyn11 (blue) and N-terminus of β2c subunit (black). (B) Representative currents of CaV2.2 channels were measured during 500-ms test pulses to 10 mV in cells with chimeric Lyn-linker-β2c derivatives. Data of Figure 1C from Lyn-β2c (gray trace) are reproduced to facilitate visual comparison. (C) Summary of CaV2.2 current inactivation with Lyn-linker-β2c derivatives (n = 9–12). Summary data of Figure 1E from Lyn-β2c (white bar) are reproduced to facilitate visual comparison. The fraction of current remaining after 100-ms depolarization (r100) to +10 mV. (D) Current inhibition of CaV2.2 channels with chimeric Lyn-linker-β2c derivatives by Dr-VSP-mediated PIP2 depletion. The traces before (a) and after (b) the strong depolarizing pulse to 120 mV were superimposed. Peak tail current is indicated by arrowheads (trace a, black head; trace b, red head). (E) Summary of CaV2.2 current inhibition (%) by PIP2 depletion in Dr-VSP-expressing cells (n = 9–12). Summary data of Figure 1E from Lyn-β2c (white bar) are reproduced to facilitate visual comparison. Dots indicate the individual data points for each cell. **p < 0.01, ***p < 0.001, using one-way analysis of variance (ANOVA) followed by Tukey post hoc test. Data are mean ± standard error of the mean (SEM).
-
Figure 1—figure supplement 3—source data 1
Current inactivation (r100) and current inhibition (%) by PIP2 depletion in CaV2.2 channels with chimeric Lyn-linker-β2c derivatives.
- https://cdn.elifesciences.org/articles/69500/elife-69500-fig1-figsupp3-data1-v1.xlsx
Figure 2 with 1 supplement
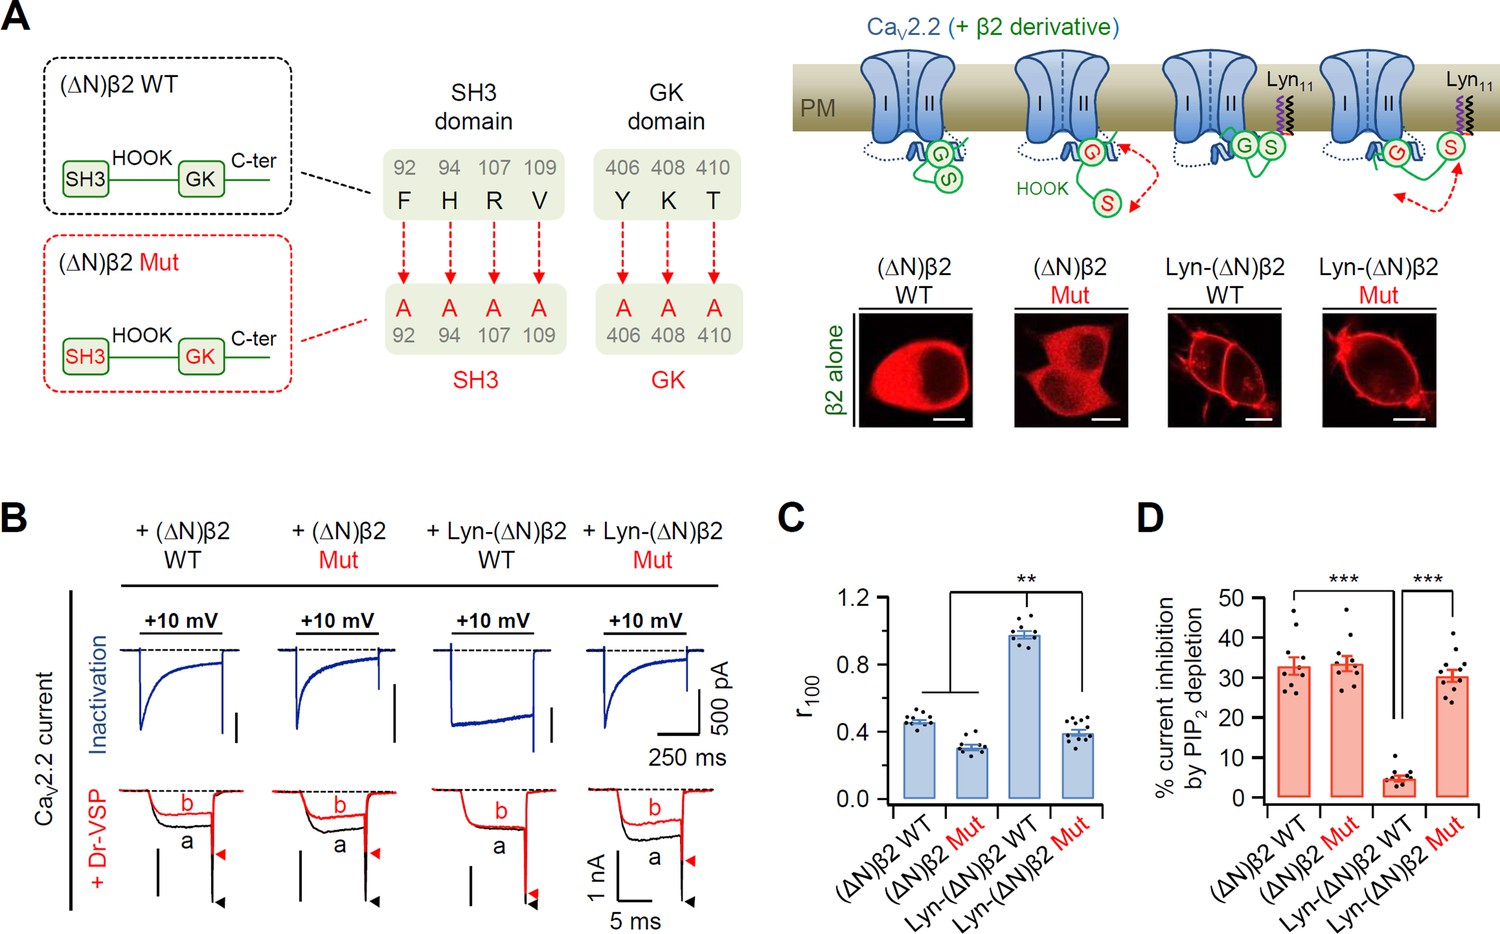
Disruption of SH3–GK interaction in the plasma membrane (PM)-recruited CaV β2 subunit leads to an increase in both current inactivation and PIP2 sensitivity of CaV2.2 channels.
(A) Left, a diagram showing how the SH3–GK intramolecular interaction is disrupted in β2 constructs (top). Phenylalanine 92, histidine 94, arginine 107, and valine 109 residues in the SH3 domain and tyrosine 406, lysine 408, and threonine 410 residues in the GK domain are replaced with alanine. Schematic model of CaV2.2 channels with engineered β2 constructs in which the SH3–GK intramolecular interaction is disrupted. Lyn-(∆N)β2: Lyn-labeled N-terminus-deleted β2 construct. Lyn-(∆N)β2 Mut: Lyn-(∆N)β2 construct with a disrupted SH3–GK intramolecular interaction. Inset: confocal images of tsA-201 cells expressing engineered β2 constructs labeled with mCherry without α1B and α2δ1 subunits. Scale bar, 5 μm. (B) Representative currents of CaV2.2 channels with engineered β2 constructs. The currents were measured during 500-ms test pulses to +10 mV (top). Current traces before (a) and after (b) a + 120-mV depolarizing pulse in cells expressing CaV2.2 channels with engineered β2 constructs and Dr-VSP (bottom). Peak tail current is indicated by arrowheads (trace a, black head; trace b, red head). (C) Summary of CaV2.2 current inactivation (n = 9–12). r100 indicates the fraction of current remaining after 100-ms depolarization to +10 mV. (D) Summary of CaV2.2 current inhibitions (%) by PIP2 depletion in Dr-VSP-expressing cells (n = 9–11). Dots indicate the individual data points for each cell. Data are mean ± standard error of the mean (SEM). **p < 0.01, ***p < 0.001, using one-way analysis of variance (ANOVA) followed by Tukey post hoc test.
-
Figure 2—source data 1
Current inactivation (r100) and current inhibition (%) by PIP2 depletion in N-type CaV2.2 channels with the engineered β2 construct.
- https://cdn.elifesciences.org/articles/69500/elife-69500-fig2-data1-v1.xlsx
Figure 2—figure supplement 1
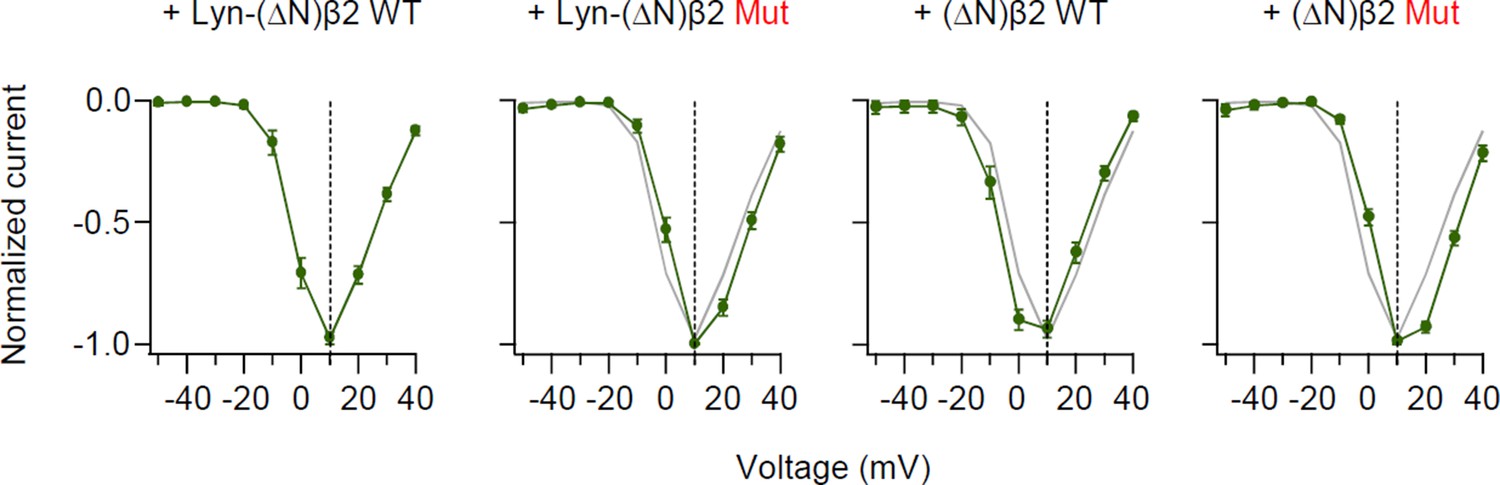
Disruption of the SH3–GK intramolecular interaction of β2 subunit does not shift current–voltage (I–V) curve of CaV2.2 current.
Normalized peak current–voltage (I–V) relations of CaV2.2 currents evoked by voltage steps to the indicated potential (mV) in cells with β2 engineered derivatives. Data from Lyn-(∆N)β2 WT (gray trace) are reproduced for visual comparison. Data are mean ± standard error of the mean (SEM) (n = 8–11).
-
Figure 2—figure supplement 1—source data 1
Current–voltage (I–V) curve of CaV2.2 current.
- https://cdn.elifesciences.org/articles/69500/elife-69500-fig2-figsupp1-data1-v1.xlsx
Figure 3 with 1 supplement
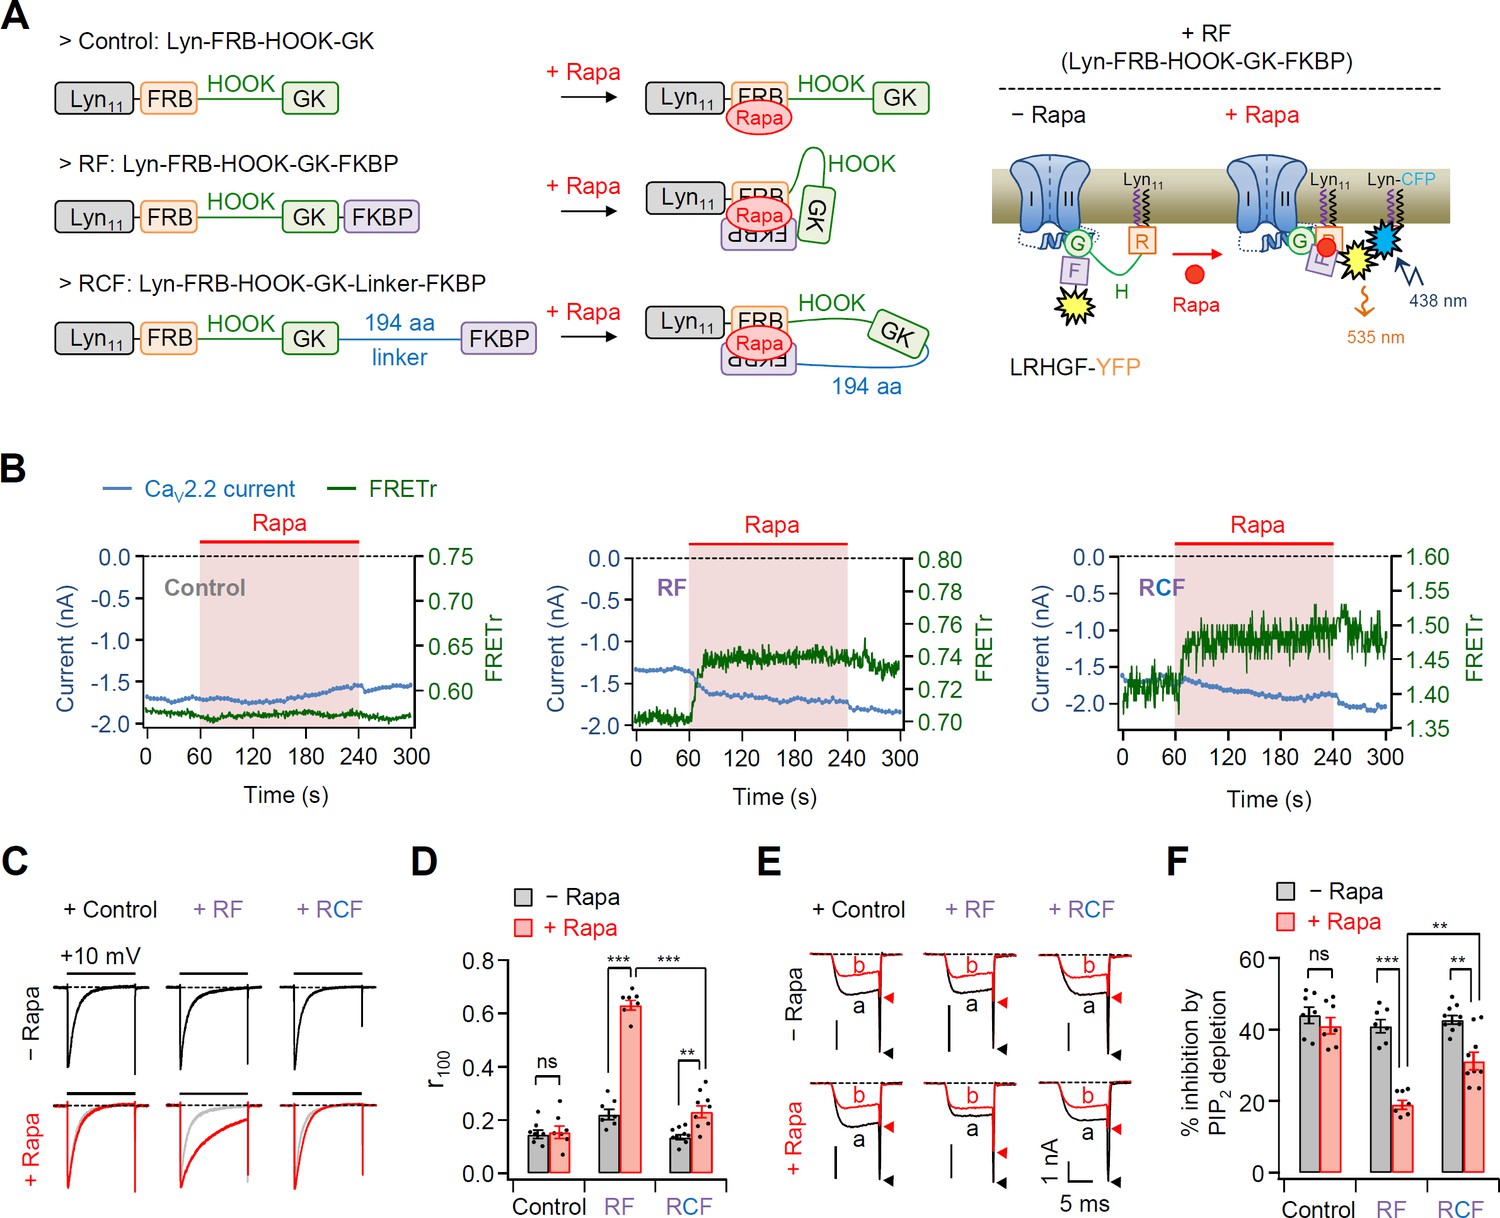
Effects of the real-time translocation of the GK domain to the plasma membrane (PM) on CaV2.2 channel gating.
(A) Left, a schematic diagram showing rapamycin-induced translocatable β2 chimeric constructs. Translocatable β2 chimeric constructs were invented by fusing FRB or FKBP to the N- and C-termini of the GK domain, respectively. The new constructs were tagged with Lyn11 (RF or Lyn-FRB-Hook-GK-FKBP) to be tethered to the PM. Rapamycin (Rapa) addition triggers the formation of a tripartite FRB–rapamycin–FKBP complex, resulting in the movement of the FKBP domain to the PM (right). For Förster resonance energy transfer (FRET) imaging, chimeric β constructs labeled with YFP in the C-terminus and PM-targeting Lyn-CFP were coexpressed. Right, schematic model of CaV2.2 channels with RF before and after rapamycin application. Rapamycin induces the formation of the tripartite complex, resulting in a shift of the FKBP domain to the PM and an enhanced FRET signal. (B) Time courses of CaV2.2 currents (blue traces) and FRET ratio (green traces) were measured simultaneously in single cells expressing CaV2.2 channels with Cont (left), RF (middle), or RCF (right) and the membrane marker Lyn-CFP. (C) Current inactivation of CaV2.2 channels with Cont (left), RF (middle), and RCF (right) was measured during 500-ms test pulses to +10 mV before (black traces) and after (red traces) rapamycin addition. (D) Summary of inactivation of CaV2.2 currents before (black bars) and after (red bars) rapamycin application (n = 7–9). The fraction of the current remaining after 100-ms depolarization (r100) to +10 mV. (E) Current inhibition of Dr-VSP-mediated PIP2 depletion on CaV2.2 channels with Cont (left), RF (middle), and RCF (right) before and after rapamycin addition. The traces before (a) and after (b) the depolarizing pulse to +120 mV were superimposed. Peak tail current is indicated by arrowheads (trace a, black head; trace b, red head). (F) Summary of Dr-VSP-induced CaV2.2 current inhibition before (black bars) and after (red bars) rapamycin addition (n = 7–9). Dots indicate the individual data points for each cell. Data are mean ± standard error of the mean (SEM). **p < 0.01, ***p < 0.001, using two-way analysis of variance (ANOVA) followed by Sidak post hoc test.
-
Figure 3—source data 1
Time courses of CaV2.2 currents and Förster resonance energy transfer (FRET) ratio.
- https://cdn.elifesciences.org/articles/69500/elife-69500-fig3-data1-v1.xlsx
-
Figure 3—source data 2
Current inactivation (r100) and current inhibition (%) by PIP2 depletion in CaV2.2 channels with rapamycin-induced translocatable β2 chimeric constructs before and after rapamycin.
- https://cdn.elifesciences.org/articles/69500/elife-69500-fig3-data2-v1.xlsx
Figure 3—figure supplement 1

The real-time translocation of the GK domain to the plasma membrane increased the current amplitude of CaV2.2 channels.
(A) CaV2.2 currents before (black trace) and during (red trace) the rapamycin application in cells expressing CaV2.2 channels with Cont (left), RF (middle), or RCF (right). The currents were obtained before and 30 s after rapamycin addition. (B) Summary of the rapamycin effects on the peak current amplitude of CaV2.2 with Cont, RF, or RCF. Rapamycin application increased the current amplitude only in channels with RF construct. Dots indicate the individual data points for each cell (n = 6–7). ***p < 0.001, using one-way analysis of variance (ANOVA) followed by Tukey post hoc test. Data are mean ± standard error of the mean (SEM).
-
Figure 3—figure supplement 1—source data 1
Relative peak current amplitudes of CaV2.2 channels with chimeric Lyn-linker-β2c derivatives.
- https://cdn.elifesciences.org/articles/69500/elife-69500-fig3-figsupp1-data1-v1.xlsx
Figure 4 with 4 supplements
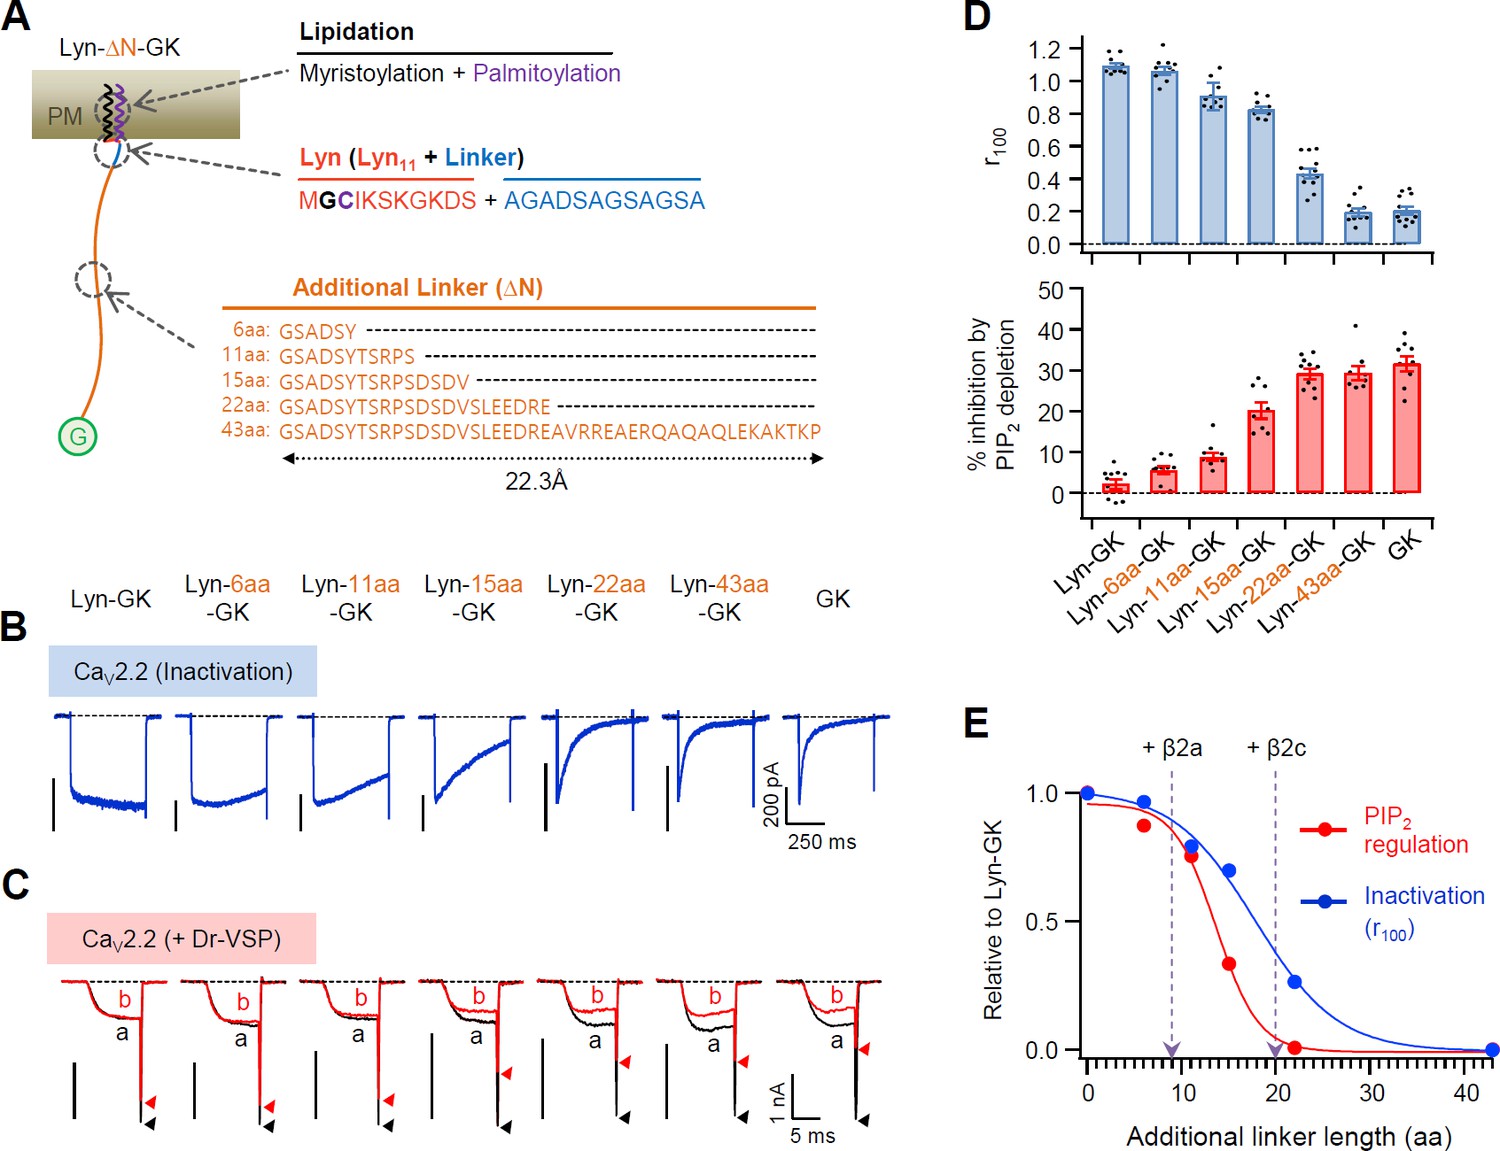
Flexible linker length between Lyn and the GK domain of the β subunit performs a key role in determining both the current inactivation and the PIP2 sensitivity of CaV2.2 channels.
(A) Schematic diagram of diverse flexible linkers (∆N) inserted between Lyn and GK (G) domain. The length of each linker is calculated by the worm-like chain (WLC) model (see Methods). Amino acid sequences of Lyn (Lyn11 plus 12 aa linker) and the additional linkers are listed. (B) Current inactivation of CaV2.2 channels with diverse CaV β-GK derivatives was measured during 500 ms test pulses to +10 mV. (C) Effects of Dr-VSP-mediated PIP2 depletion on CaV2.2 channels with GK domain derivatives. Peak tail current is indicated by arrowheads (trace a, black head; trace b, red head). (D) Summary of current inactivation (blue bars; n = 9–12) and inhibition (%) by PIP2 depletion (red bars; n = 8–10) in CaV2.2 channels with CaV β GK derivatives. Data are mean ± standard error of the mean (SEM). Dots indicate the individual data points for each cell. (E) Normalized mean current inactivation and mean current inhibition by PIP2 depletion versus additional linker length (aa) of CaV β GK derivatives measured in CaV2.2 channels. The normalized current regulation in cells expressing CaV2.2 with β2a and β2c is indicated with dashed arrows.
-
Figure 4—source data 1
Current inactivation (r100) and current inhibition (%) by PIP2 depletion in CaV2.2 channels with the engineered β2 GK derivatives.
- https://cdn.elifesciences.org/articles/69500/elife-69500-fig4-data1-v1.xlsx
Figure 4—figure supplement 1
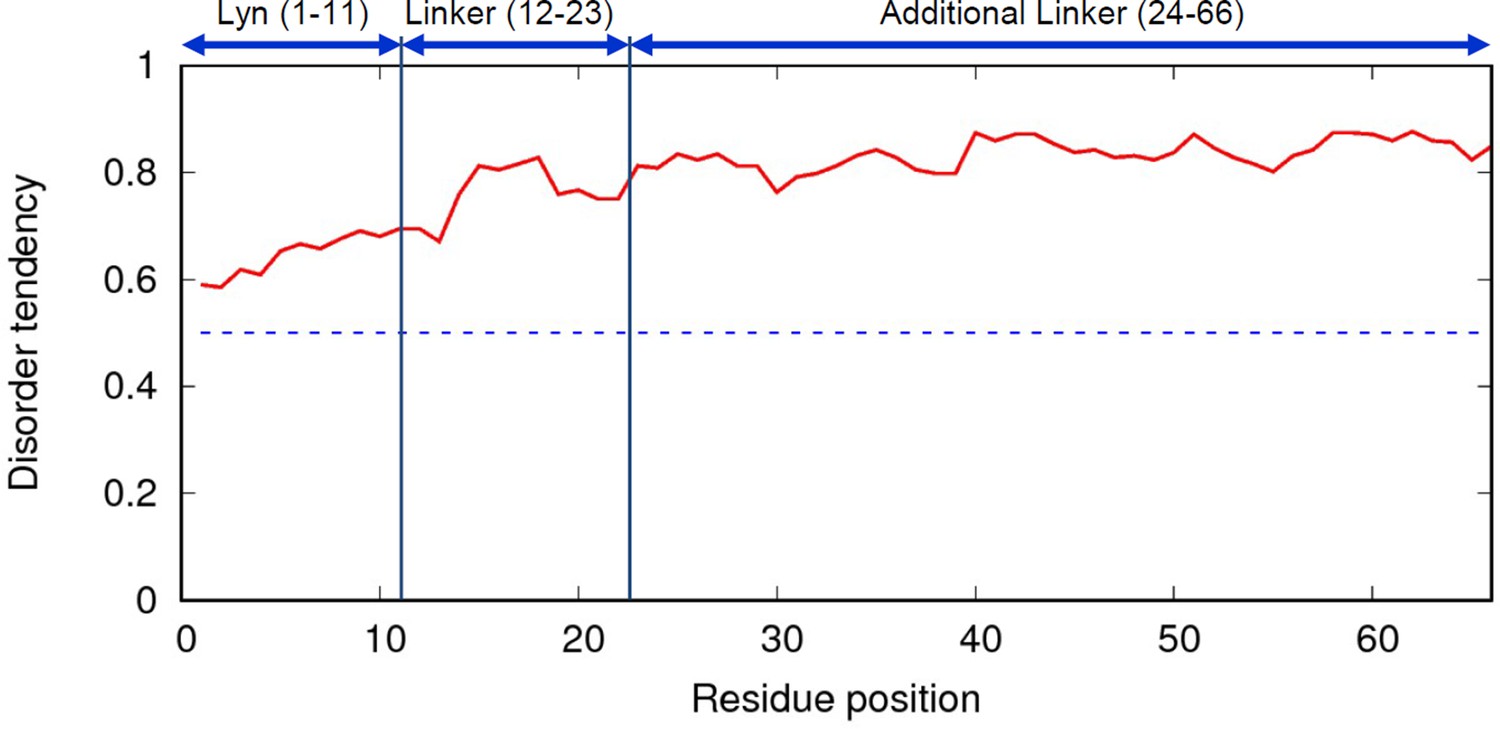
IUPRED web-server result of inserted linker.
Red line is disorder tendency of the linker and blue dotted line is 0.5. Higher disorder tendency (>0.5) suggests that the linker is intrinsically disordered protein and random coil structure. The full amino acid sequence of the linker is indicated in Figure 4A.
Figure 4—figure supplement 2
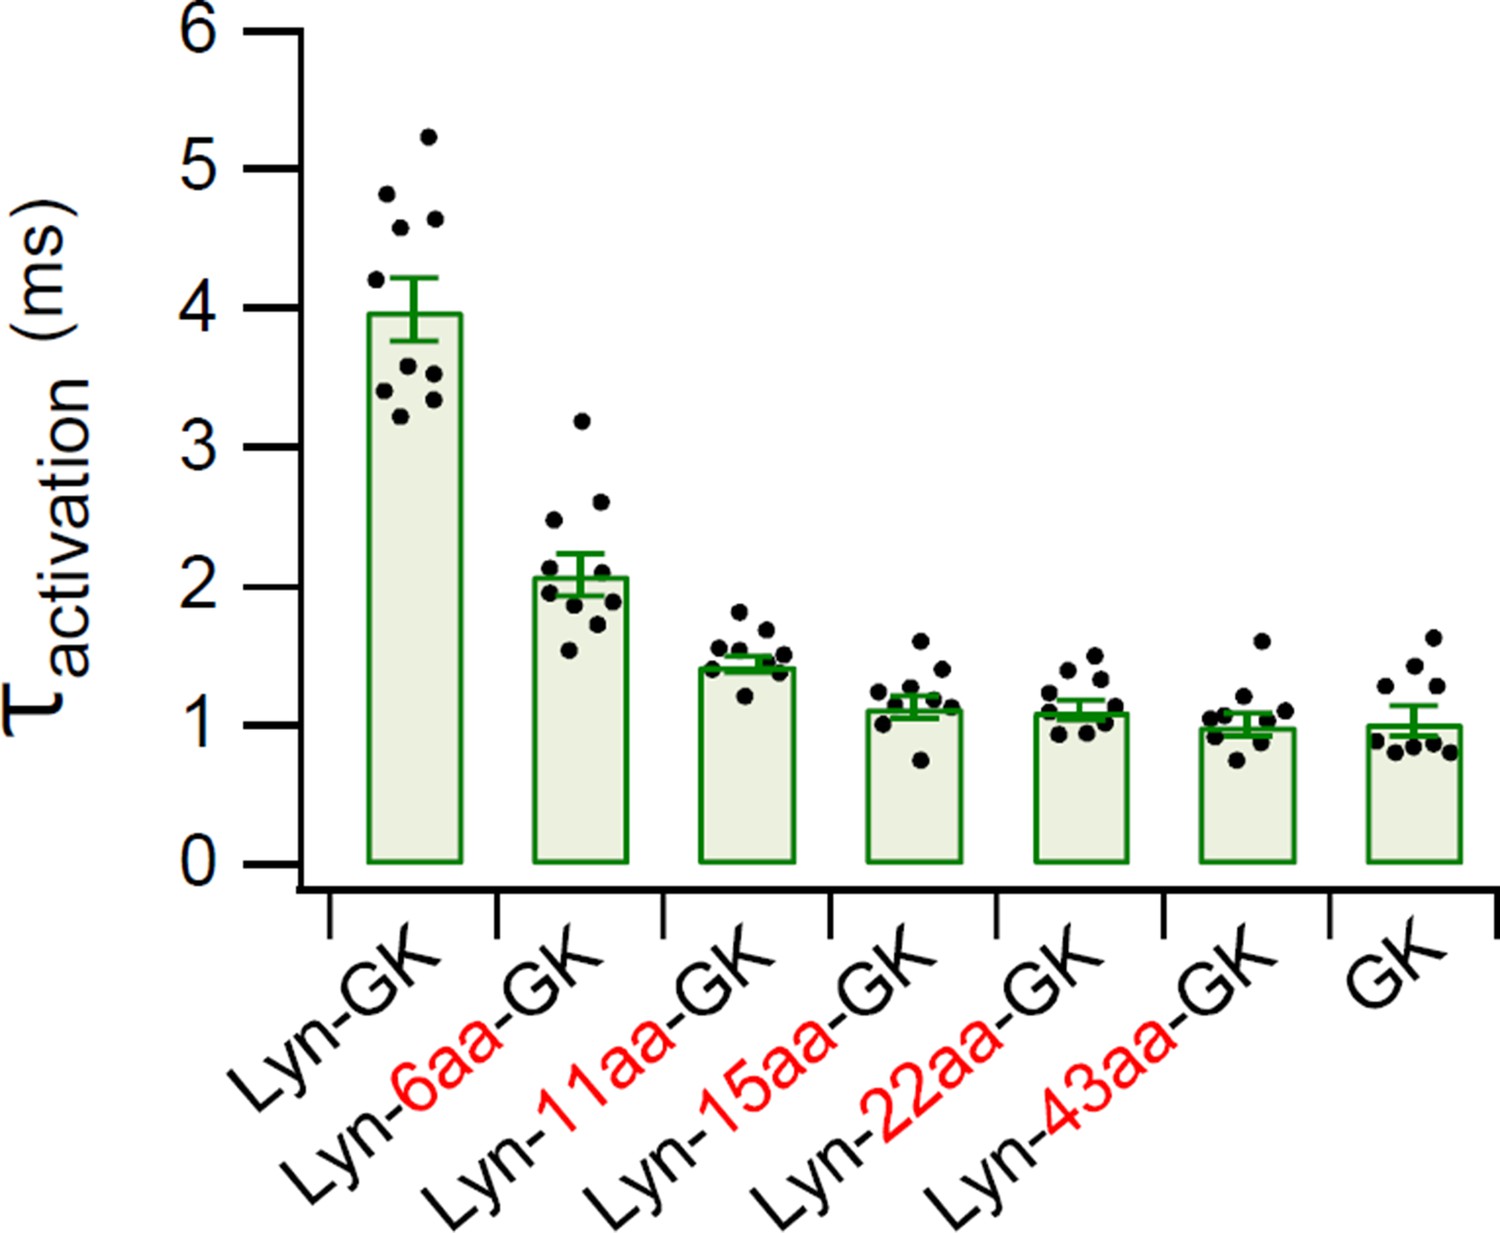
Summary of time constants for CaV2.2 current activation.
Time constants of current activation in CaV2.2 channels with diverse CaV β-GK derivatives were measured from the data shown in Figure 4B. Data are mean ± standard error of the mean (SEM). Dots indicate the individual data points for each cell (n = 9–10). The online version of this article includes the source data, Figure 4—figure supplement 2—source data 1.
-
Figure 4—figure supplement 2—source data 1
Time constants of current activation in CaV2.2 channels with diverse CaV β-GK derivatives.
- https://cdn.elifesciences.org/articles/69500/elife-69500-fig4-figsupp2-data1-v1.xlsx
Figure 4—figure supplement 3
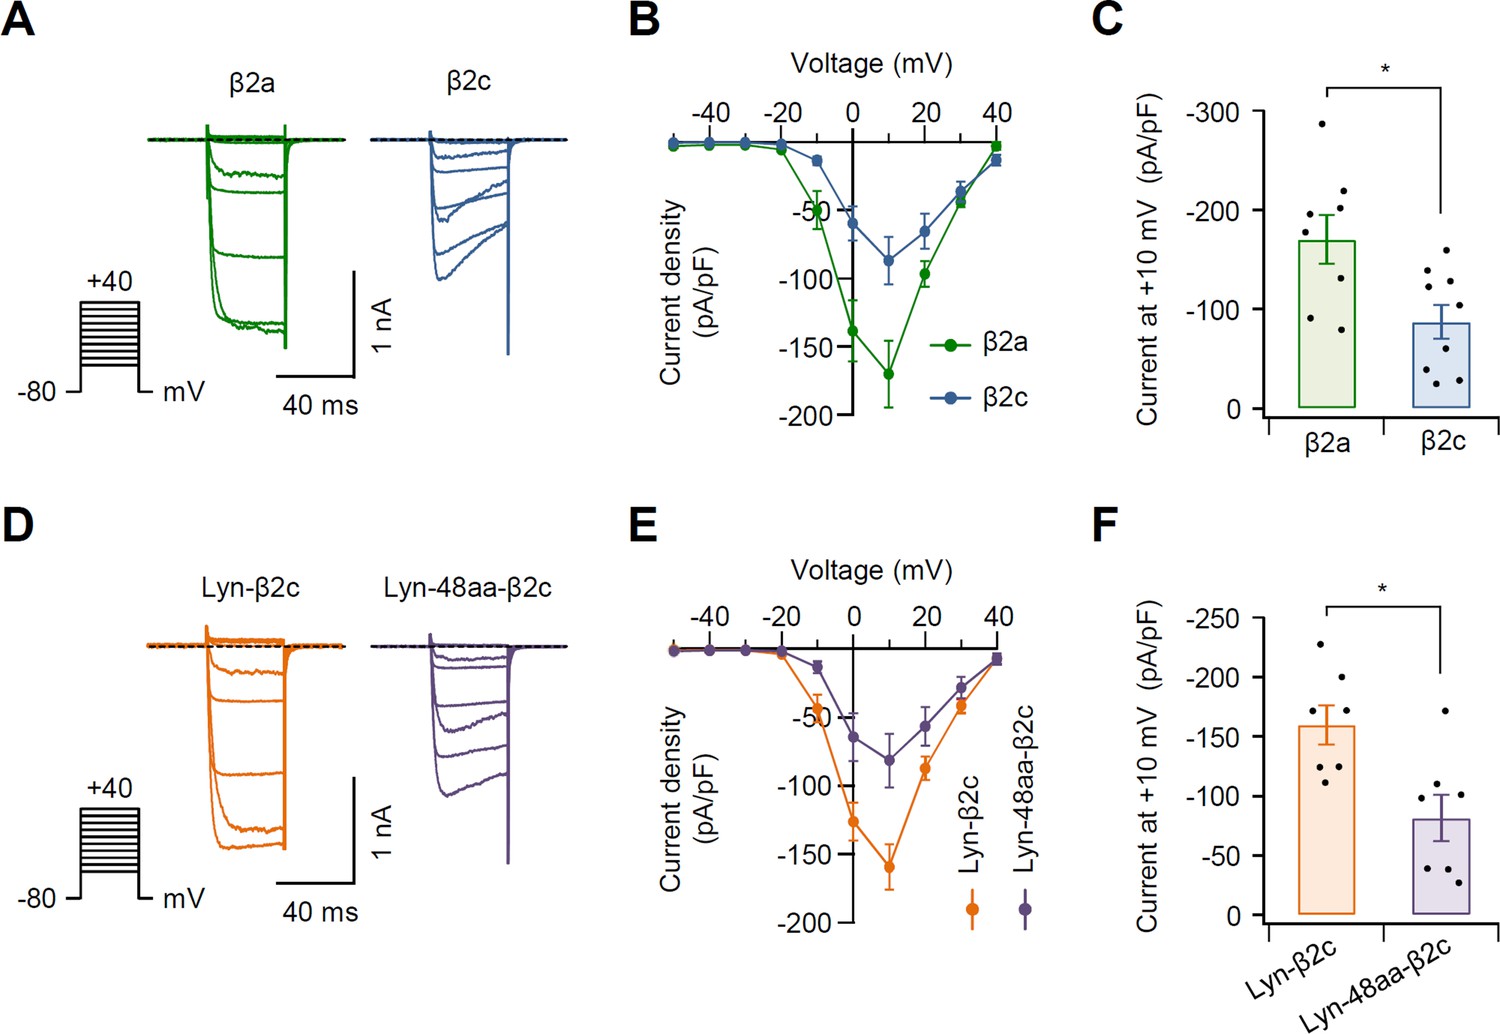
Current density in N-type CaV2.2 channels with β2 variants.
(A) Representative Ba2+ current traces elicited by voltage steps from −50 and +40 mV in 10 mV steps (see pulse protocol) in cells expressing CaV2.2 channels with β2a (green trace, left) and β2c (blue trace, right). Holding potential is −80 mV and dashed line is zero current. (B) Population current density versus voltage relations for CaV2.2 channels with β2a (green trace) and β2c (blue trace). (C) Summary of current density (pA/pF) of CaV2.2 channels with β2a and β2c (n = 8–9). Cells were transfected with the same amount of cDNA. (D) Representative Ba2+ current traces elicited between −50 and +40 mV in 10 mV steps (see pulse protocol) in cells expressing CaV2.2 channels with Lyn-β2c (orange trace, left) and Lyn-48aa-β2c (purple trace, right). Holding potential is −80 mV and dashed line is zero current. (E) Population current density versus voltage relations for CaV2.2 channels with Lyn-β2c (orange trace) and Lyn-48aa-β2c (purple trace). (F) Summary of current density (pA/pF) of CaV2.2 channels with Lyn-β2c and Lyn-48aa-β2c (n = 7). Cells were transfected with the same amount of cDNA. Dots indicate the individual data points for each experiment. *p < 0.05, using Student’s t-test. Data are mean ± SEM.
-
Figure 4—figure supplement 3—source data 1
Population current density versus voltage relations for CaV2.2 channels with β2 variants.
Peak current density at 10 mV (pA/pF) of CaV2.2 channels with β2 variants.
- https://cdn.elifesciences.org/articles/69500/elife-69500-fig4-figsupp3-data1-v1.xlsx
Figure 4—figure supplement 4
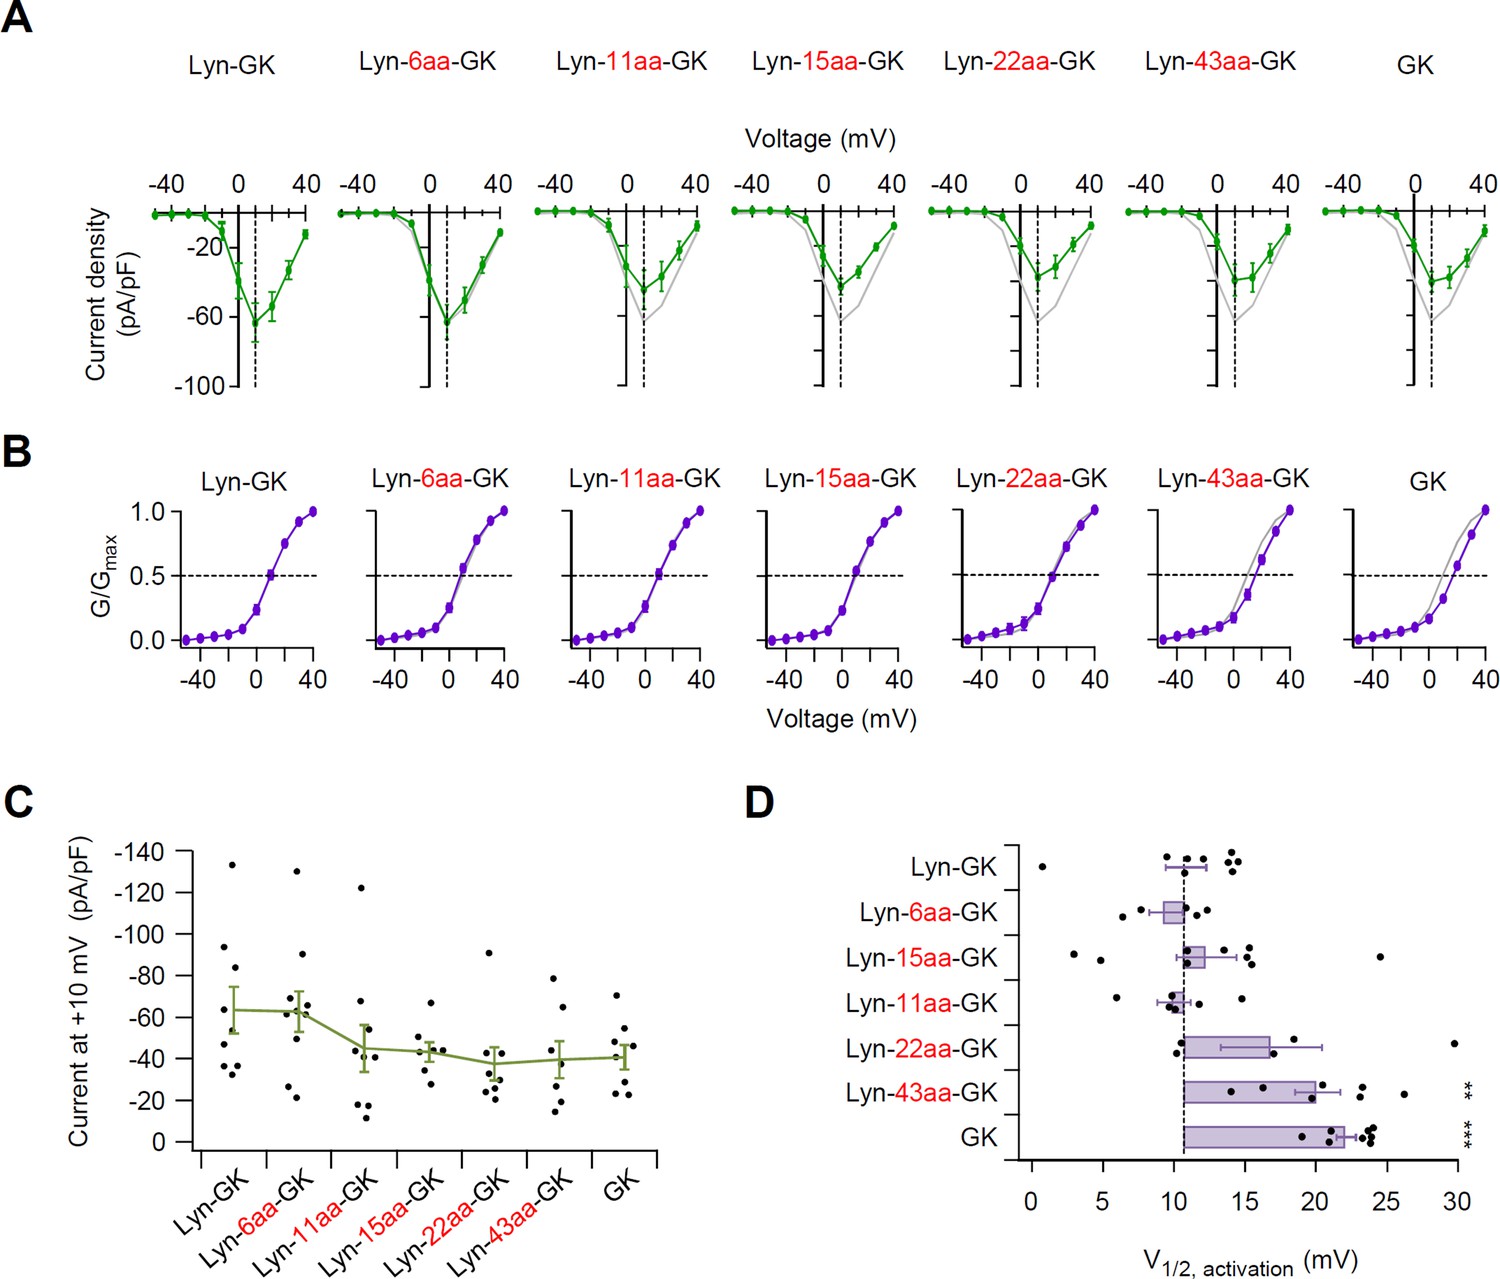
Flexible linker length between Lyn and GK domain of β subunit is important in determining the current density and the voltage-dependent gating of CaV2.2 channels.
(A) Population current density versus voltage relations for CaV2.2 channels with diverse flexible linker inserted between Lyn and GK constructs. Data from Lyn-GK (gray trace) are reproduced to facilitate visual comparison. (B) Representative CaV2.2 current traces elicited between −50 and +40 mV in 10 mV steps, from a holding potential of −80 mV. Tail currents following test pulses were normalized to the largest tail current in each series of test pulse. The curves were fitted by a Boltzmann function. The voltage dependence of normalized steady-state activation (G/Gmax) for CaV2.2 channels with GK domain derivatives. Data from Lyn-GK (gray trace) are reproduced for visual comparison. Dashed line indicates the V1/2 of normalized steady-state activation. (C) Summary of current density (pA/pF) of CaV2.2 channels with GK domain derivatives (n = 7–10). (D) The magnitude of fluctuation in the V1/2 of normalized steady-state activation from the mean of Lyn-GK in cells expressing CaV2.2 channels with GK domain derivatives (n = 5–9). Dashed line indicates Lyn-GK level. Dots indicate the individual data points for each cell. Data are mean ± standard error of the mean (SEM). **p < 0.01, ***p < 0.001, using one-way analysis of variance (ANOVA) followed by Tukey post hoc test.
-
Figure 4—figure supplement 4—source data 1
Population current density versus voltage relations and the voltage dependence of normalized steady-state activation for CaV2.2 channels with the engineered β2 GK derivatives.
- https://cdn.elifesciences.org/articles/69500/elife-69500-fig4-figsupp4-data1-v1.xlsx
Figure 5 with 3 supplements
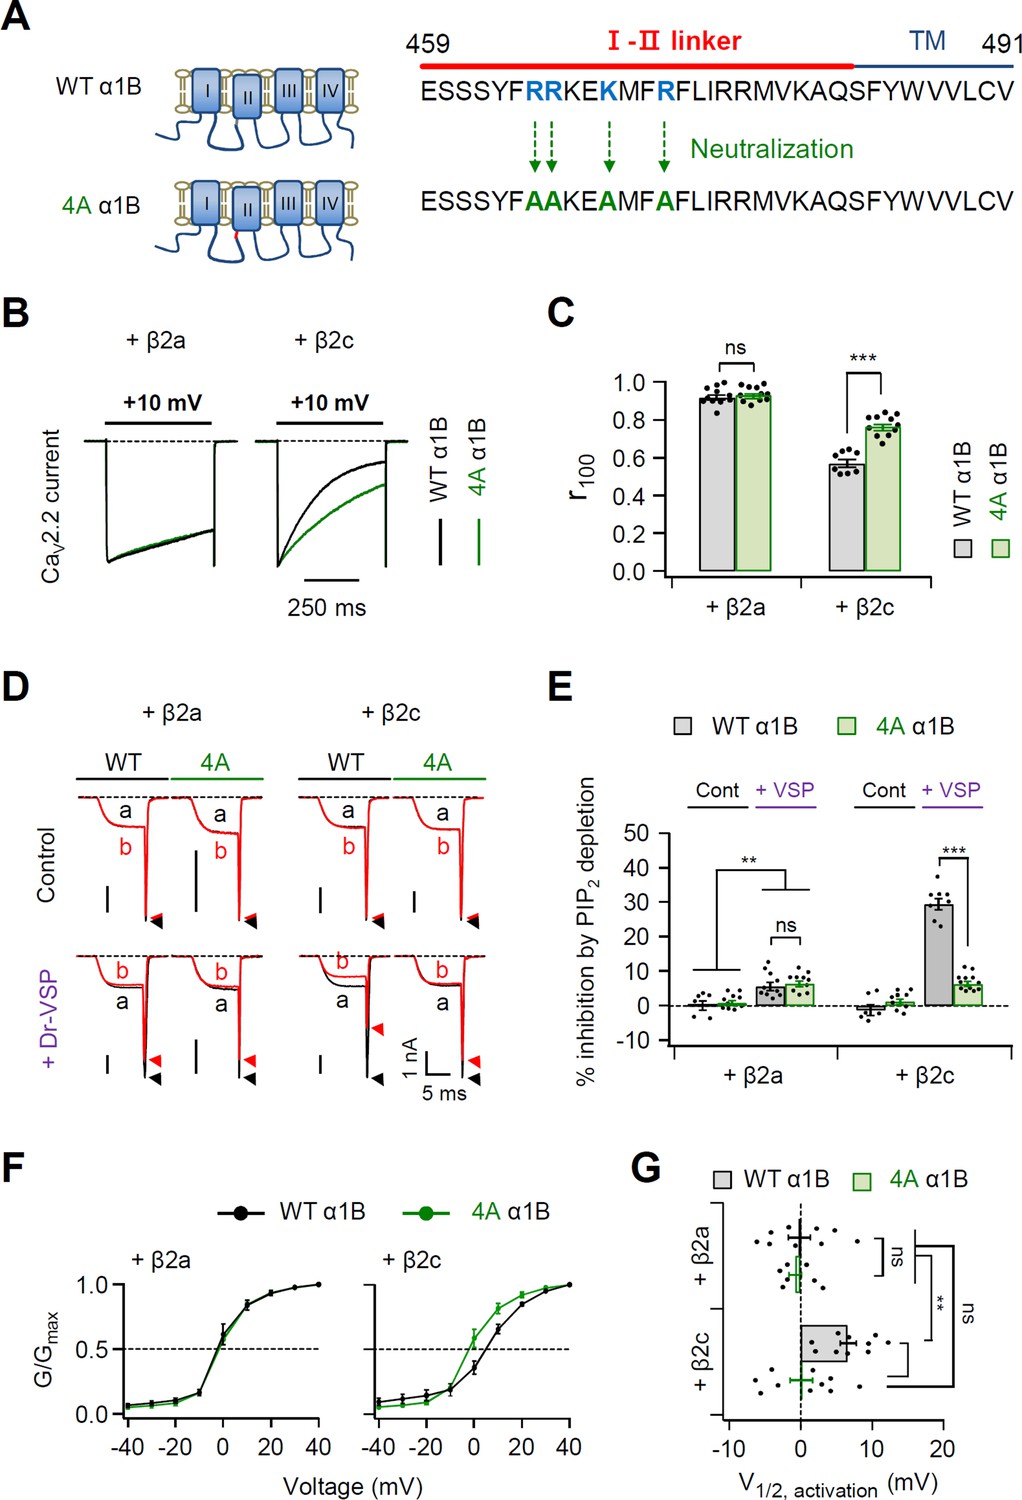
Polybasic motif at the C-terminal end of the I–II loop influences determination of steady-state activation, current inactivation, and PIP2 sensitivity of CaV2.2 channels.
(A) Schematic diagram of phospholipid-binding residue-neutralizing mutations within the C-terminal end of the I–II loop in the α1B subunit. The phospholipid-binding residues (R465, R466, K469, and R472) highlighted in blue were mutated to alanine (4A). (B) Current inactivation was measured during 500-ms test pulses to +10 mV in cells expressing α1B WT (black traces) and 4A mutants (green traces) with β2a (left) or β2c (right) subunits. (C) Summary of current inactivation of CaV2.2 WT (black bars) and 4A (red bars) with β2 subunits (n = 8–11). r100 indicates the fraction of current remaining after 100-ms depolarization to +10 mV. (D) Current inhibition by Dr-VSP-mediated PIP2 depletion in cells expressing CaV2.2 WT and 4A with the β2a (left) or β2c subunit (right). CaV2.2 currents before (a) and after (b) the depolarizing pulse to +120 mV are superimposed in control (top) and Dr-VSP-expressing (bottom) cells. Peak tail current is indicated by arrowheads (trace a, black head; trace b, red head). (E) Summary of current inhibition (%) of CaV2.2 WT (black bars) and 4A (red bars) by PIP2 depletion in control (n = 10) and Dr-VSP-transfected cells (n = 8–12). (F) The voltage dependence of normalized steady-state activation (G/Gmax) for α1B WT (black) and 4A mutants (green) with β2a (left) or β2c (right) subunits. Tail currents elicited between −40 and +40 mV in 10 mV steps, from a holding potential of −80 mV were normalized to the largest tail current in each series of test pulse. The curves were fitted by a Boltzmann function. Dashed line indicates the V1/2 of normalized steady-state activation. (G) Summary of the V1/2 of normalized steady-state activation in cells expressing α1B WT (black bars) and 4A mutants (green bars) with β2a (upper) or β2c (bottom) subunits (n = 7–10). Dots indicate the individual data points for each cell. Data are mean ± standard error of the mean (SEM). **p < 0.01, ***p < 0.001, using two-way analysis of variance (ANOVA) followed by Sidak post hoc test.
-
Figure 5—source data 1
Current inactivation (r100) and current inhibition (%) by PIP2 depletion in cells expressing α1B WT and 4A mutants with β2a and β2c.
- https://cdn.elifesciences.org/articles/69500/elife-69500-fig5-data1-v1.xlsx
Figure 5—figure supplement 1
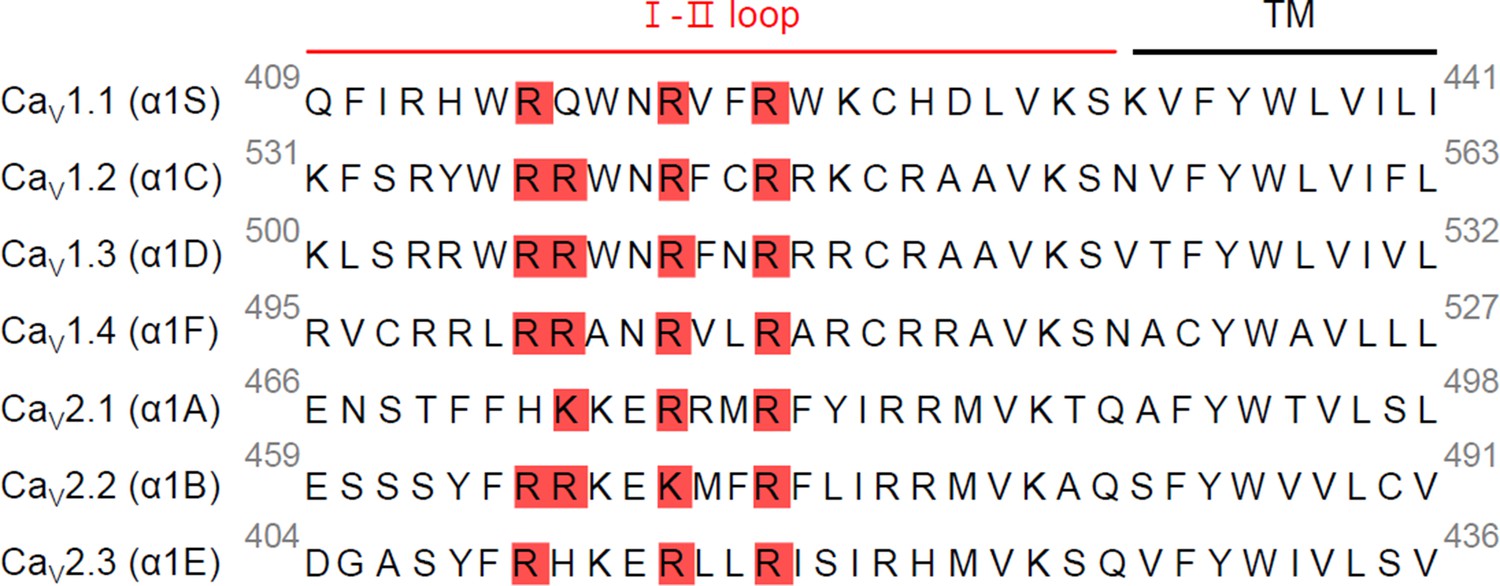
Sequence alignment of the C-terminal end of the I–II loop in CaV α1 subunits.
Putative PIP2-binding residues within the C-terminal end of I–II loop were highlighted in red. The calcium channel subunits α1S of rat CaV1.1, α1C of rat CaV1.2, α1D of human CaV1.3, α1F of human CaV1.4, α1A of rat CaV2.1, α1B of rat CaV2.2, and α1E of rat CaV2.3.
Figure 5—figure supplement 2

Current inactivation and PIP2 sensitivity of mutant CaV2.2 channels with Lyn-β2c and Lyn-48aa-β2c.
(A) Current inactivation was measured during 500-ms test pulses to +10 mV in cells expressing α1B WT (black traces) and 4A (red traces) with Lyn-β2c (left) or Lyn-48aa-β2c subunit (right). (B) Summary of current inactivation of CaV2.2 WT (black bars) and 4A (red bars) with Lyn-β2c or Lyn-48aa-β2c subunits (n = 8–11). r100 indicates the fraction of current remaining after 100-ms depolarization to +10 mV. (C) Current inhibition of CaV2.2 WT and 4A with Lyn-β2c (left) or Lyn-48aa-β2c subunits (right) by Dr-VSP-mediated PIP2 depletion. CaV2.2 currents before (a) and after (b) the depolarizing pulse to +120 mV are superimposed in control (top) and Dr-VSP-expressing (bottom) cells. Peak tail current is indicated by arrowheads (trace a, black head; trace b, red head). (D) Summary of current inhibition (%) of CaV2.2 WT (black bars) and 4A (red bars) by PIP2 depletion in control (n = 6–11) and Dr-VSP-transfected cells (n = 10–11). Dots indicate the individual data points for each cell. Data are mean ± standard error of the mean (SEM). **p < 0.01, ***p < 0.001, using two-way analysis of variance (ANOVA) followed by Sidak post hoc test.
-
Figure 5—figure supplement 2—source data 1
Current inactivation (r100) and current inhibition (%) by PIP2 depletion in CaV2.2 channels with Lyn-β2c and Lyn-48aa-β2c.
- https://cdn.elifesciences.org/articles/69500/elife-69500-fig5-figsupp2-data1-v1.xlsx
Figure 5—figure supplement 3
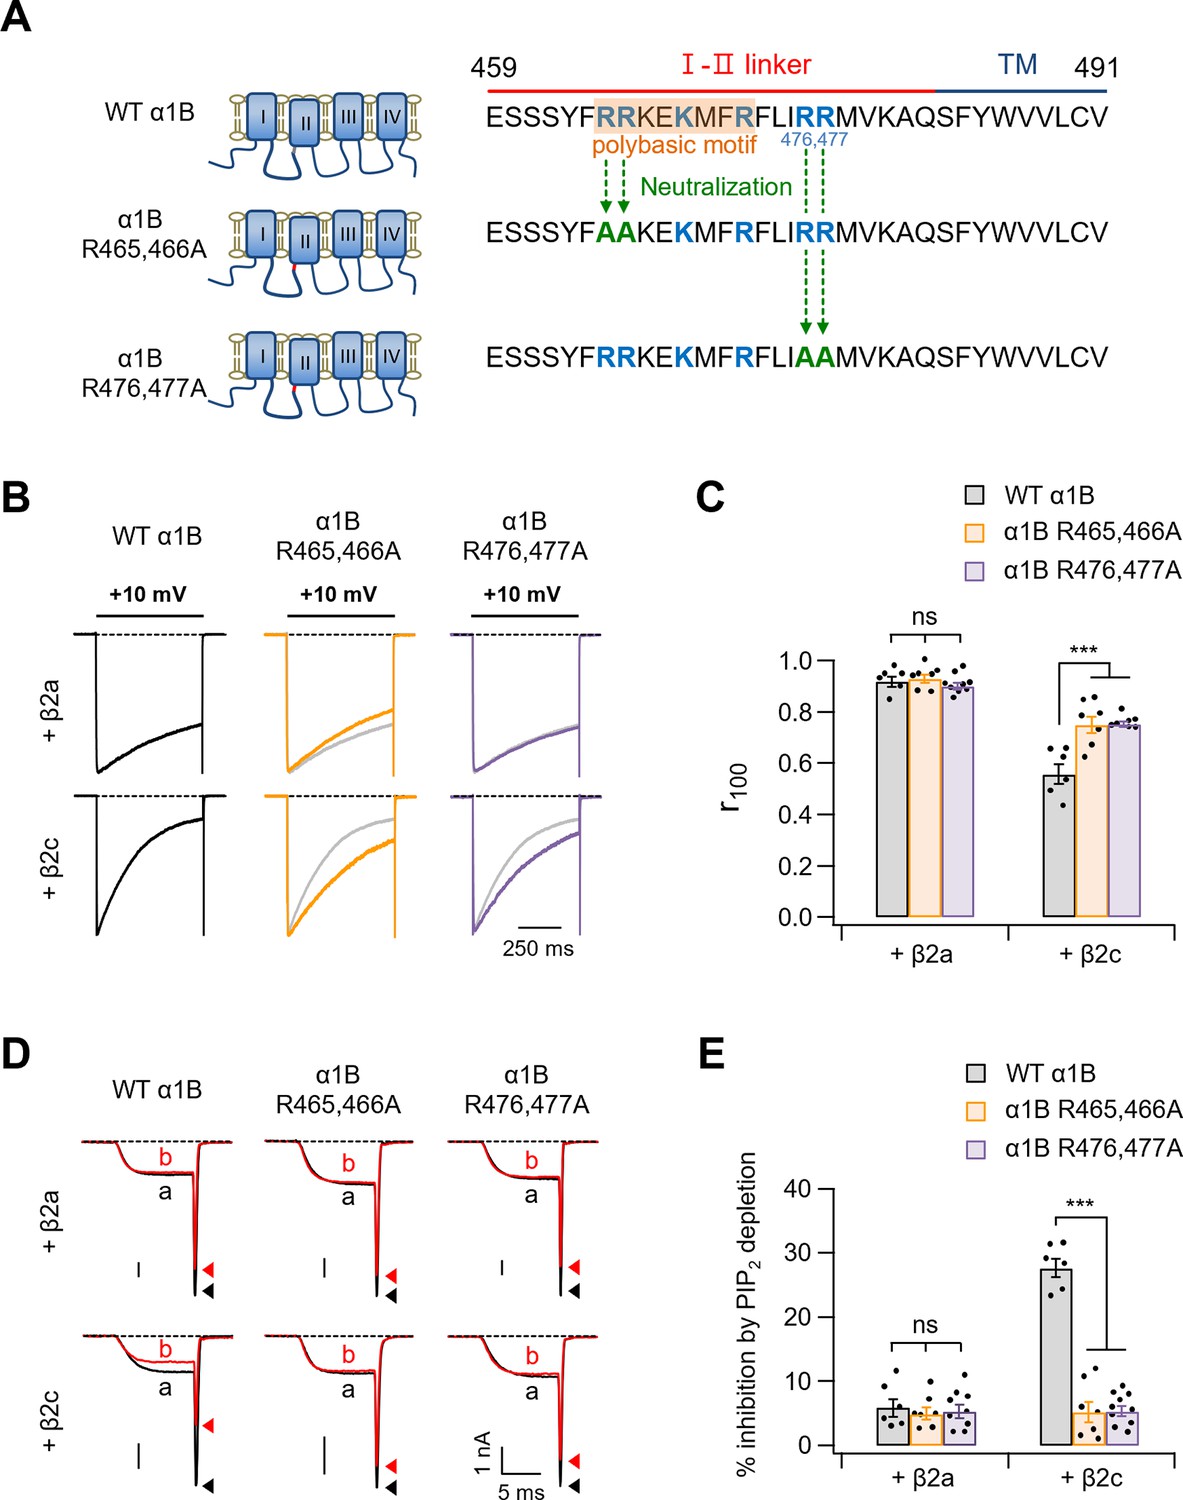
Neutralization of polybasic residues in the distal end of the I–II loop domain plays a crucial role in determining current inactivation and PIP2 sensitivity of CaV2.2 channels with β2c.
(A) Schematic diagram of the C-terminal end of the I–II loop in CaV α1B subunits. Two positive amino acids (R465 and R466) were neutralized to alanine residues (α1B R465,466A) and two positive amino acids (R476 and R477) were replaced with alanine (α1B R476,477A). (B) Current inactivation was measured during 500-ms test pulses to +10 mV in cells expressing WT α1B (black traces), α1B R465,466A (orange traces), and α1B R476,477A (purple traces) with β2a (upper) or β2c (bottom). Gray traces present the curve of WT α1B for comparison. (C) Summary of current inactivation of CaV2.2 channel in cells expressing indicated α1B with β2a or β2c (n = 6–9). The r100 indicates the fraction of current remaining after 100-ms depolarization to +10 mV. (D) Current inhibition by Dr-VSP-mediated PIP2 depletion in cells expressing WT α1B, α1B R465,466A, and α1B R476,477A with β2a (upper) or β2c (bottom) subunits. CaV2.2 currents before (a) and after (b) the depolarizing pulse to +120 mV are superimposed in Dr-VSP-expressing cells. Peak tail current is indicated by arrowheads (trace a, black head; trace b, red head). (E) Summary of the CaV2.2 current inhibition (%) by PIP2 depletion in cells expressing indicated α1B with β2a (n = 6–9) or β2c (n = 6–10). Dots indicate the individual data points for each cell. Data are mean ± standard error of the mean (SEM). ***p < 0.001, using two-way analysis of variance (ANOVA) followed by Sidak post hoc test.
-
Figure 5—figure supplement 3—source data 1
Current inactivation (r100) and current inhibition (%) by PIP2 depletion in cells expressing WT α1B, α1B R465,466A, and α1B R476,477A with β2a and β2c.
- https://cdn.elifesciences.org/articles/69500/elife-69500-fig5-figsupp3-data1-v1.xlsx
Figure 6 with 1 supplement
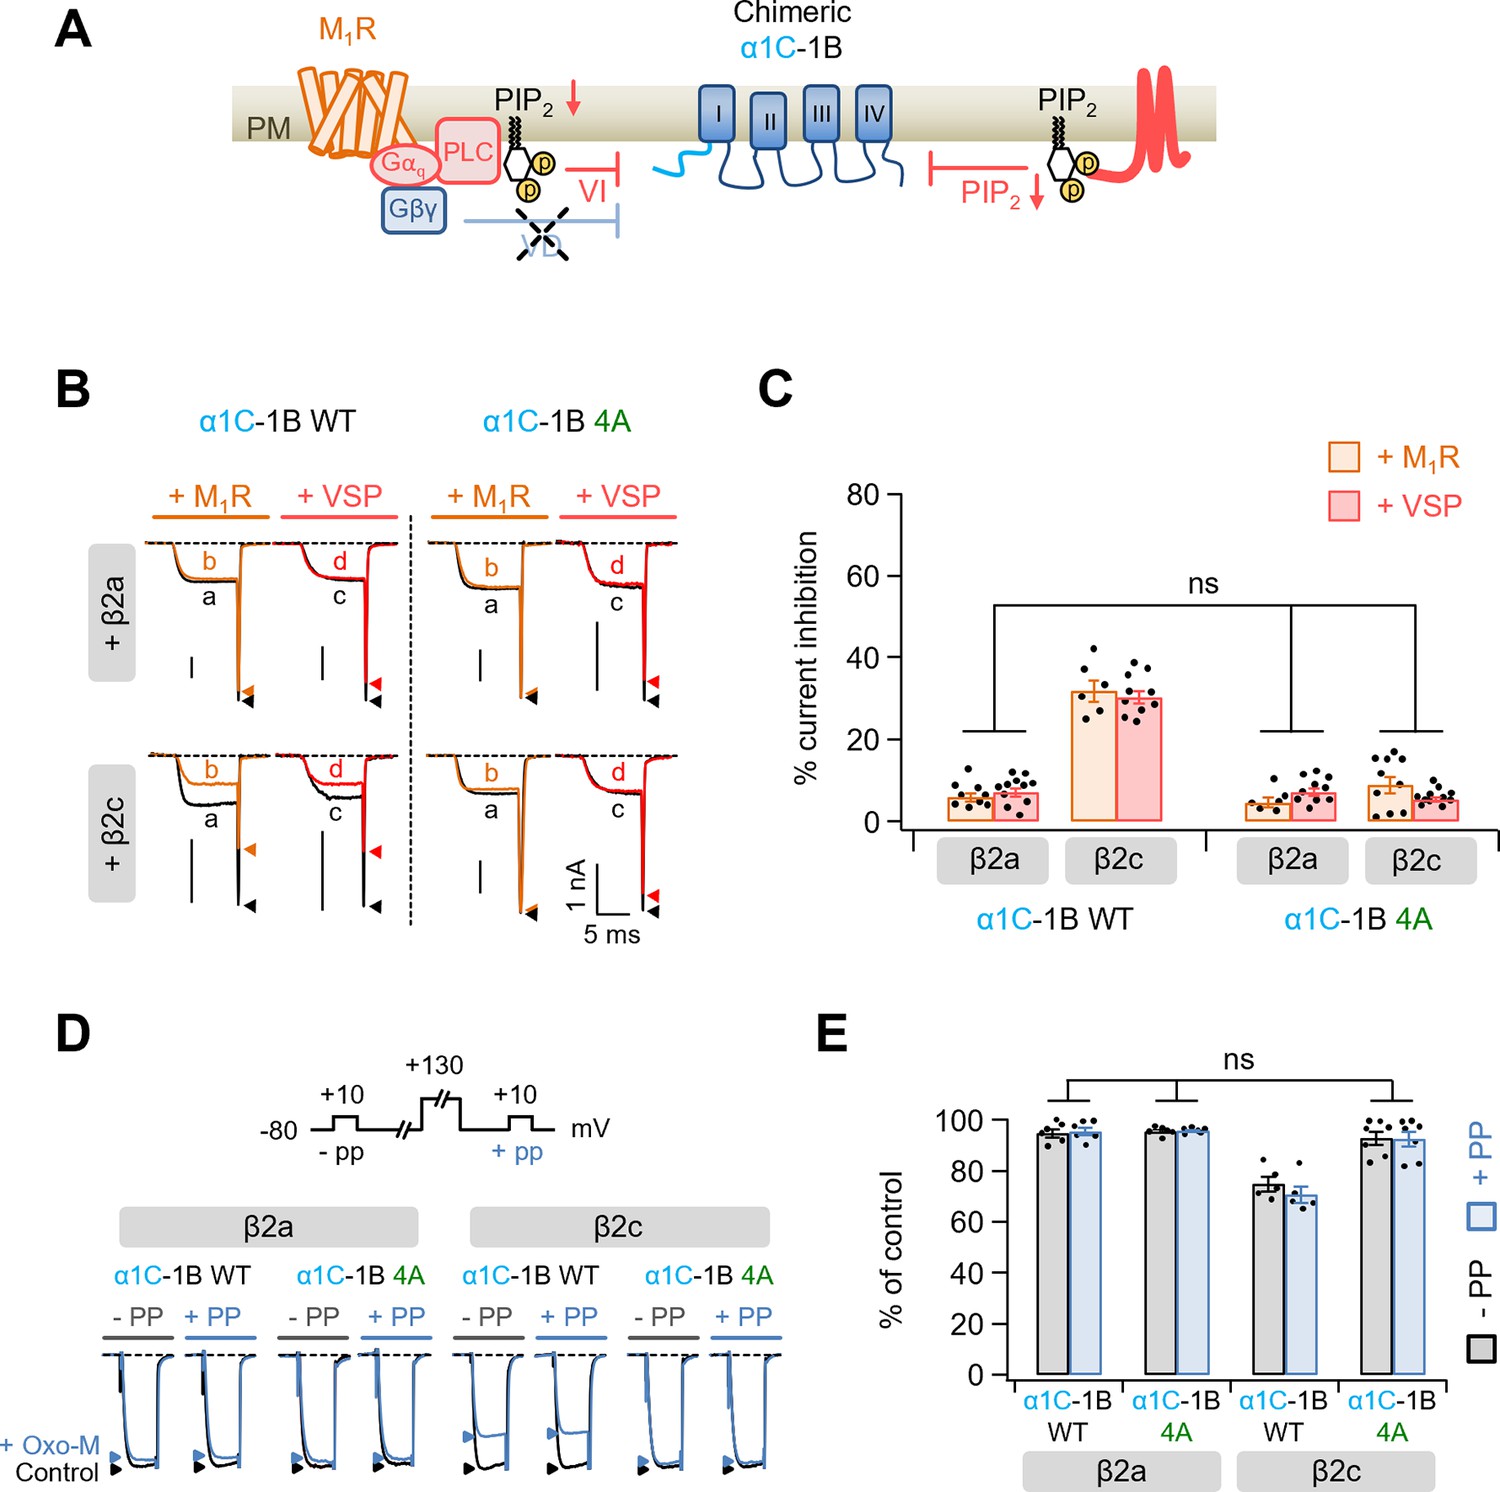
Modulation by M1 muscarinic stimulation and Dr-VSP activation in Gβγ-insensitive chimeric α1C-1B CaV2.2 channel.
(A) Schematic diagram showing the inhibitory signaling from M1 muscarinic acetylcholine receptor (M1R) and Dr-VSP to Gβγ-insensitive chimeric α1C-1B channel. VI, voltage-independent inhibition; VD, voltage-dependent inhibition. (B) Current traces before (a, black) and during (b, orange) the 10 µM Oxo-M application or before (c, black) and after (d, red) the Dr-VSP activation in cells expressing the α1C-1B WT and α1C-1B 4A with β2a or β2c subunits. Peak tail current is indicated by arrowheads (trace a, black head; trace b, orange head; trace c, black head; trace d, red head). (C) Summary of current inhibition (%) of α1C-1B WT and α1C-1B 4A by M1R stimulation (orange bars) or Dr-VSP activation (red bars) in cells with β2a or β2c subunits (n = 6–11). (D) Current traces before (control, black) and during the Oxo-M application (+Oxo-M, blue) were superimposed. Cells were given a test pulse (−PP) and then depolarized to +130 mV, followed by the second test pulse after 20 ms (+PP). Peak current is indicated by arrowheads (control, black head; +Oxo-M, blue head). (E) Summary of the prepulse experiments in before and Oxo-M perfused cells with α1C-1B WT and α1C-1B 4A with β2a or β2c subunits (n = 5–7). The current amplitude after Oxo-M application is given as percentage of the initial control. Dots indicate the individual data points for each cell. Data are mean ± standard error of the mean (SEM).
-
Figure 6—source data 1
Current inhibition (%) of α1C-1B WT and 4A mutants by M1R or Dr-VSP activation in cells expressing with β2a and β2c.
Summary of the prepulse experiments in before and Oxo-M perfused cells with α1C-1B WT and 4A mutants with β2a or β2c subunits.
- https://cdn.elifesciences.org/articles/69500/elife-69500-fig6-data1-v1.xlsx
Figure 6—figure supplement 1
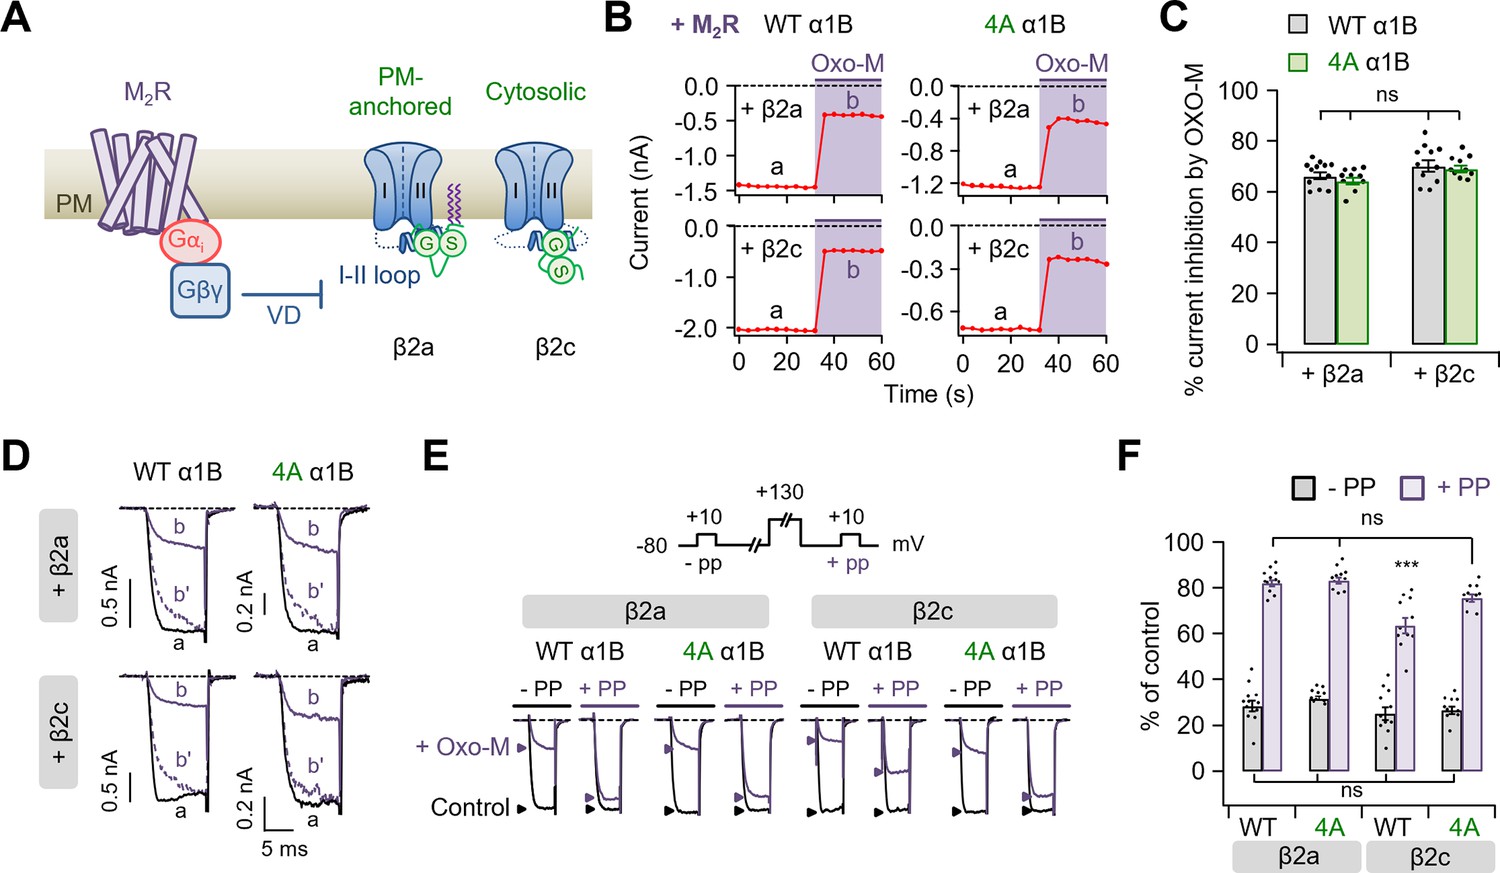
Polybasic motif at the C-terminal end of the I–II loop affects in determining the M2 muscarinic modulation of CaV2.2 channels.
(A) Schematic diagram showing the M2 muscarinic acetylcholine receptor (M2R)-mediated inhibitory signaling to CaV2.2 channels. VD, voltage-dependent inhibition. (B) Current inhibition by M2R activation with 10 µM Oxo-M in cells expressing CaV2.2 WT (left) and 4A (right) with β2a (top) or β2c subunits (bottom). Inward Ba2+ current was measured every 4 s by applying a test pulse to +10 mV. (C) Summary of current inhibition (%) of CaV2.2 WT (black bars) and 4A (green bars) by M2 muscarinic inhibition in cells with β2a or β2c subunits (n = 10–12). (D) Superimposed WT (left) and 4A (right) CaV2.2 current trace (a, black) and (b, purple) from C. The (b′) dashed trace is a scaled version of (b). (E) Current traces before (control, black) and during the Oxo-M application (+Oxo-M, purple) were superimposed. Cells were given a test pulse (−PP) and then depolarized to +130 mV, followed by the second test pulse after 20 ms (+PP). Peak current is indicated by arrowheads (control, black head; +Oxo-M, purple head). (F) Summary of the prepulse experiments in before and Oxo-M perfused cells with α1B WT and 4A mutants with β2a or β2c subunits (n = 8–10). The current amplitude after Oxo-M application is given as percentage of the initial control. Dots indicate the individual data points for each cell. Data are mean ± standard error of the mean (SEM). ***p < 0.001 compared to the others, using two-way analysis of variance (ANOVA) followed by Sidak post hoc test.
-
Figure 6—figure supplement 1—source data 1
Current inhibition (%) of α1B WT and 4A mutants by M2R activation in cells expressing with β2a and β2c.
Summary of the prepulse experiments in before and Oxo-M perfused cells with α1B WT and 4A mutants with β2a or β2c subunits.
- https://cdn.elifesciences.org/articles/69500/elife-69500-fig6-figsupp1-data1-v1.xlsx
Figure 7 with 1 supplement
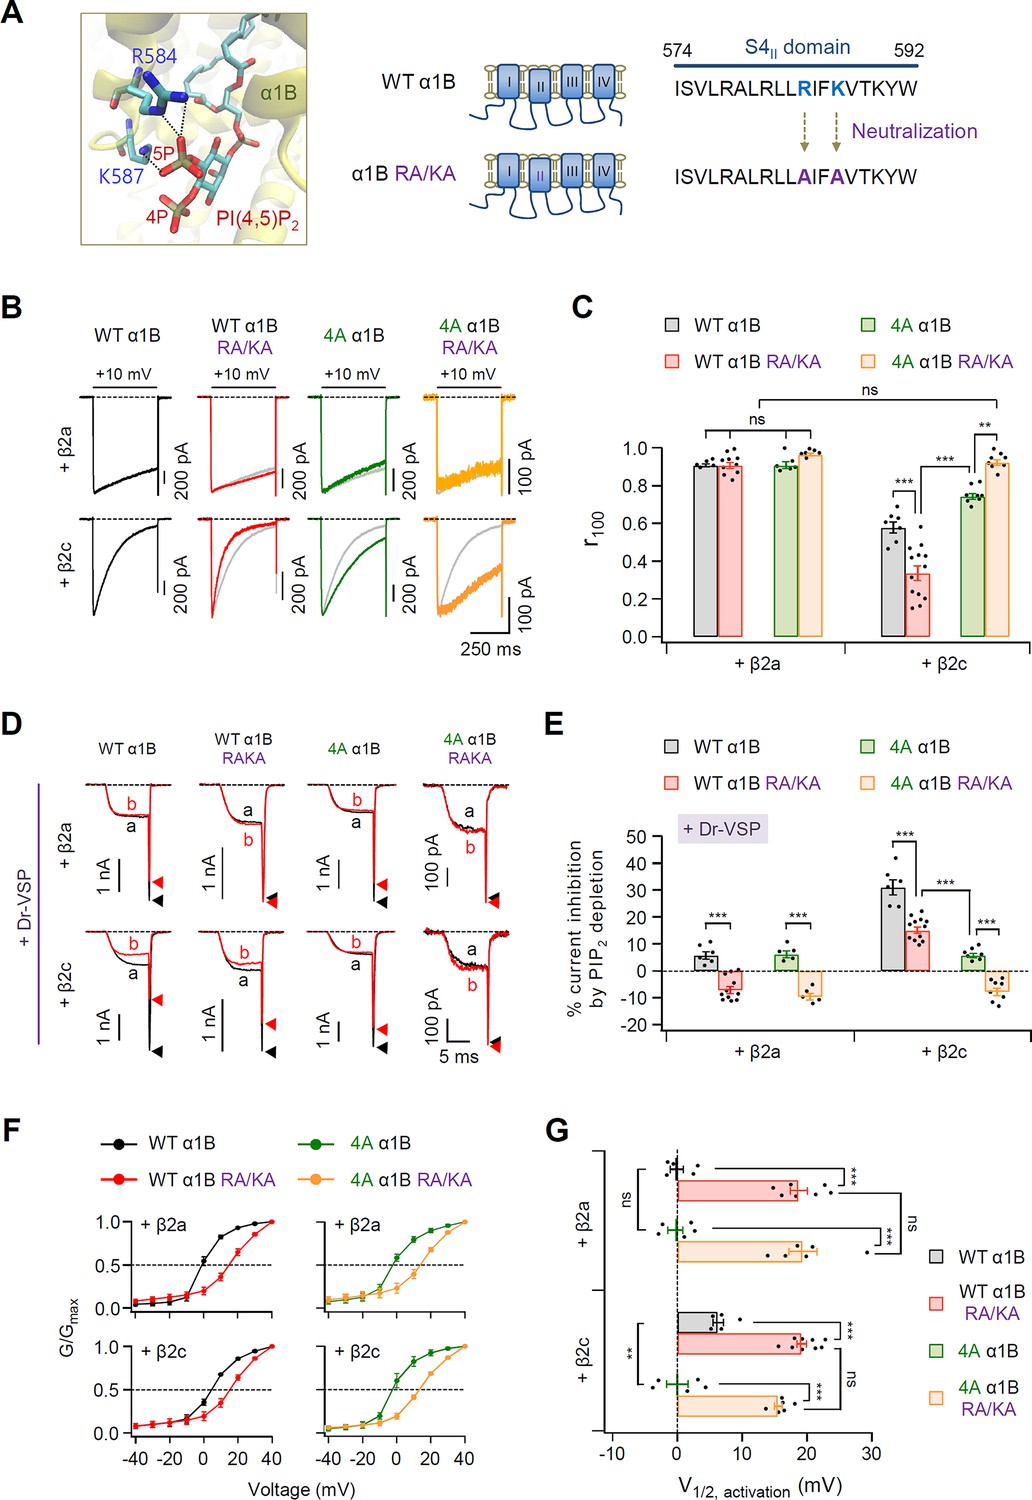
PIP2-binding residues within the S4II domain plays an important role in determining steady-state activation and PIP2 sensitivity of CaV2.2 channels.
(A) Distance analysis of PIP2-binding site in the S4II domain of α1B subunit. Two amino acids (R584 and K587) interacting with the 5-phosphate of PIP2 were neutralized to alanine residues (RA/KA). (B) Current inactivation was measured during 500-ms test pulses to +10 mV in cells expressing WT α1B (black traces), WT α1B RA/KA (red traces), 4A α1B (green traces), and 4A α1B RA/KA (orange traces) with β2a (upper) or β2c (bottom). Gray traces present the curve of WT α1B for comparison. (C) Summary of current inactivation of CaV2.2 channel in cells expressing indicated α1B with β2a (n = 5–10) or β2c (n = 7–13). The r100 indicates the fraction of current remaining after 100-ms depolarization to +10 mV. (D) Current inhibition by Dr-VSP-mediated PIP2 depletion in cells expressing WT α1B, WT α1B RA/KA, 4A α1B, and 4A α1B RA/KA with β2a (upper) or β2c (bottom) subunits. CaV2.2 currents before (a) and after (b) the depolarizing pulse to +120 mV are superimposed in Dr-VSP-expressing cells. Peak tail current is indicated by arrowheads (trace a, black head; trace b, red head). (E) Summary of the CaV2.2 current inhibition (%) by PIP2 depletion in cells expressing indicated α1B with β2a (n = 6–12) or β2c (n = 5–11). (F) The voltage dependence of normalized steady-state activation (G/Gmax) for WT α1B (black), WT α1B RA/KA (red), 4A α1B (green), and 4A α1B RA/KA (orange) with β2a (left) or β2c (right). Tail currents elicited between −40 and +40 mV in 10 mV steps, from a holding potential of −80 mV were normalized to the largest tail current in each series of test pulse. The curves were fitted by a Boltzmann function. Dashed line indicates the V1/2 of normalized steady-state activation. (G) Summary of the V1/2 of normalized steady-state activation in F (n = 5–9). Dots indicate the individual data points for each cell. Data are mean ± standard error of the mean (SEM). **p < 0.01, ***P<0.001, using two-way analysis of variance (ANOVA) followed by Sidak post-hoc test.
-
Figure 7—source data 1
Current inactivation (r100), current inhibition (%) by PIP2 depletion and the V1/2 of normalized steady-state activation in cells expressing WT α1B, WT α1B RA/KA, 4A α1B, and 4A α1B RA/KA with β2a or β2c.
- https://cdn.elifesciences.org/articles/69500/elife-69500-fig7-data1-v1.xlsx
Figure 7—figure supplement 1
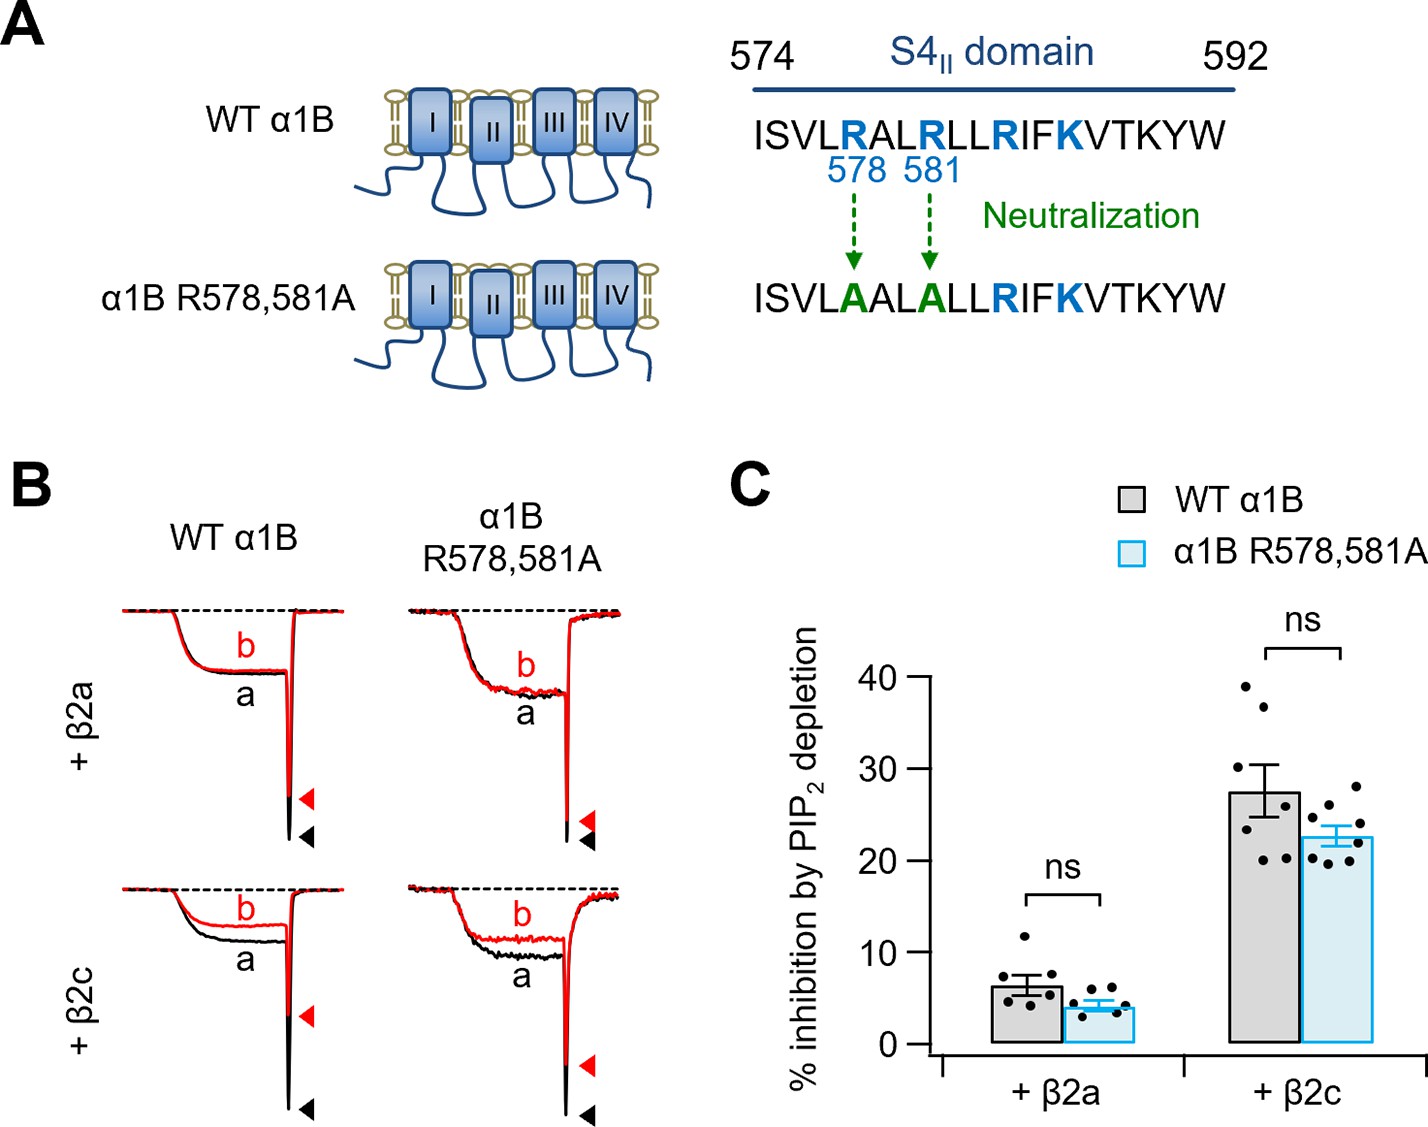
PIP2 sensitivity of α1B R578,581A with β2a or β2c subunits.
(A) Schematic diagram of two positive amino residues (R578 and R581) replaced with alanine residues (α1B R578,581A) within S4II domain of α1B subunit. (B) Current inhibition by Dr-VSP-mediated PIP2 depletion in cells expressing WT α1B, and α1B R578,581A with β2a (upper) or β2c (bottom) subunits. CaV2.2 currents before (a) and after (b) the depolarizing pulse to +120 mV are superimposed in Dr-VSP-expressing cells. Peak tail current is indicated by arrowheads (trace a, black head; trace b, red head). (C) Summary of the CaV2.2 current inhibition (%) by PIP2 depletion in cells expressing WT α1B (black bars) and α1B R578,581A (blue bars) with β2a (n = 6) or β2c (n = 7–8). Dots indicate the individual data points for each cell. Data are mean ± standard error of the mean (SEM). There is no statistical significance with two-way analysis of variance (ANOVA) followed by Sidak post hoc test.
-
Figure 7—figure supplement 1—source data 1
Current inhibition (%) by PIP2 depletion in cells expressing WT α1B and α1B R578,581A with β2a or β2c.
- https://cdn.elifesciences.org/articles/69500/elife-69500-fig7-figsupp1-data1-v1.xlsx
Figure 8

Schematic model showing the differential regulation of CaV2.2 channels with membrane-anchored and cytosolic β subunits by PIP2.
The channel possesses two distinct PIP2-interacting sites: the PIP2-binding pocket in the S4II domain and the nonspecific phospholipid-biding site in the I–II loop C-terminus. When the CaV2.2 channel is coupled with membrane-anchored β2a (upper panel), the proximal interaction of N-terminus of β2a with plasma membrane (PM) via its lipid anchor eliminates the binding of PIP2 to the polybasic phospholipid site on I–II loop, leading to the state less sensitive to PIP2 (upper left). In this condition, mutation of the PIP2-interacting phospholipid site in the I–II loop does not change the PIP2 sensitivity (upper 4A α1B). In contrast, when the CaV2.2 channel is coupled with cytosolic β2c (lower panel), there is no interaction of β subunit with the PM, leading to the higher PIP2-sensitive state through the association of the polybasic phospholipid-binding site with acid phospholipids in the PM (lower left). In 4A mutant channels, PIP2 interaction with the phospholipid-binding site is abolished, changing the channels to a state that shows only PIP2 binding to the binding pocket in S4II domain. PIP2 depletion in the PM or mutations of both PIP2-interacting sites alter channels to the nonconducting state by shifting the voltage-dependent activation to the depolarization direction (lower right). The approximate PIP2 sensitivity of each channel state in response to Dr-VSP activation is indicated as % inhibition at the bottom of each panel.
Author response image 1
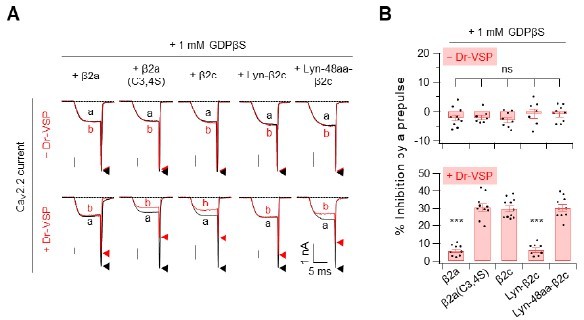
Summary of the Cav2.
2 current inhibition by Dr-VSP-mediated PIP2 depletion in cells were recorder with pipette solution containing GDP-β-S. (A) Cells received a test pulse (a), then a depolarisation of 120mV, a hyperpolarisation to -150mV, followed by the second test pulse (b). Cav2.2 currents before (a) and after (b) the depolarizing pulse are superimposed in cells without Dr-VSP (Upper) and with DR-VSP (bottom). (B) Summary of the Cav2.2 current inhibition (%) by a depolarizing pulse to +120mV in cells without Dr-VSP (Upper) and with DR-VSP (bottom). Dots indicate the individual data points for each cell (n=8-11). Data are mean ± SEM.
Additional files
-
Supplementary file 1
Primers for β2 chimera constructs.
- https://cdn.elifesciences.org/articles/69500/elife-69500-supp1-v1.xlsx
-
Supplementary file 2
Primers for deletion or mutagenesis of CaV α1B and β2 constructs.
- https://cdn.elifesciences.org/articles/69500/elife-69500-supp2-v1.xlsx
-
Transparent reporting form
- https://cdn.elifesciences.org/articles/69500/elife-69500-transrepform1-v1.pdf
Download links
A two-part list of links to download the article, or parts of the article, in various formats.
Downloads (link to download the article as PDF)
Open citations (links to open the citations from this article in various online reference manager services)
Cite this article (links to download the citations from this article in formats compatible with various reference manager tools)
Molecular basis of the PIP2-dependent regulation of CaV2.2 channel and its modulation by CaV β subunits
eLife 11:e69500.
https://doi.org/10.7554/eLife.69500


