A precisely adjustable, variation-suppressed eukaryotic transcriptional controller to enable genetic discovery
- Computational Systems Biology and Swiss Institute of Bioinformatics, ETH Zurich, Switzerland
- Division of Basic Sciences, Fred Hutchinson Cancer Research Center, United States
Figures
Figure 1 with 1 supplement
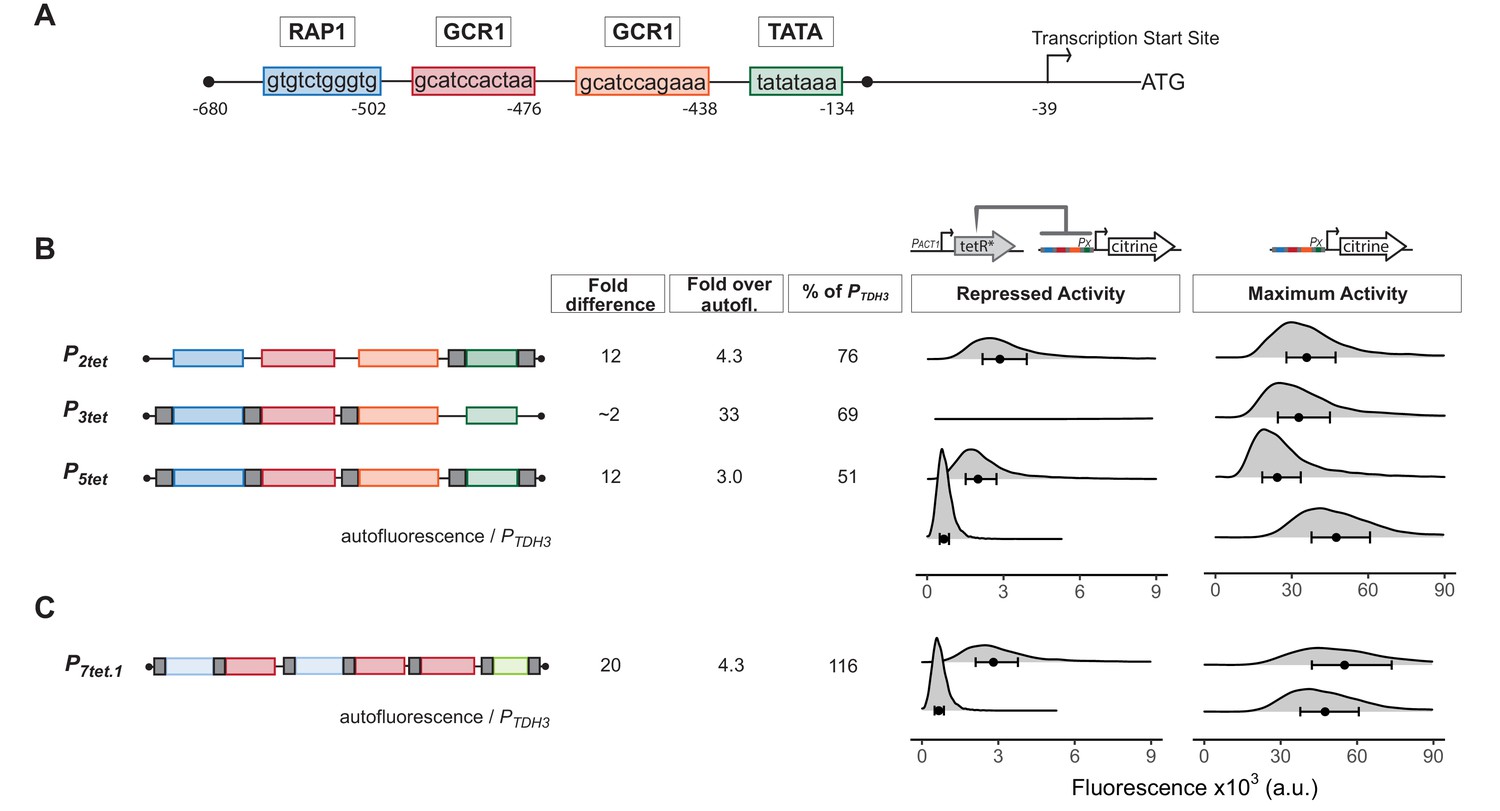
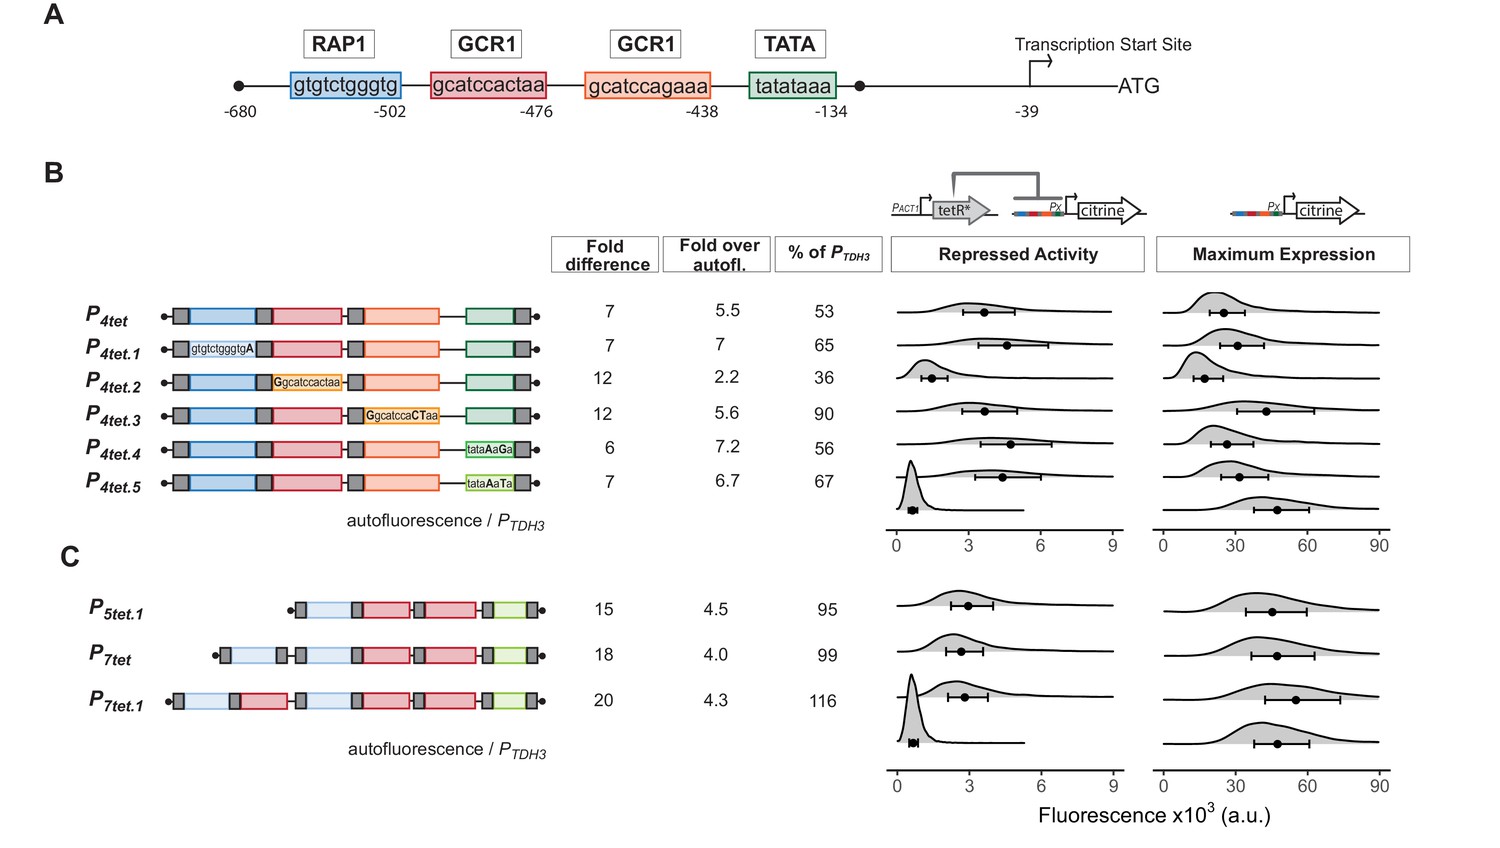
Repression of engineered PTDH3 derivatives by TetR.
(A) Structure of the starting promoter, PTDH3. Diagram shows the nucleotide positions of the binding sites for the endogenous transcription factors Rap1 and Gcr1, the TATA-sequence, and the transcription start site relative to the start codon of the TDH3 gene. (B) Repression and maximum activity of engineered PTDH3 derivatives. Diagrams above the plots display the genetic elements of strains used in B and C. Left diagram depicts strains used to test repressed activity, right diagram maximum activity. Px denotes any TetR repressible promoter. The * in TetR indicates a SV40 Nuclear Localization Sequence. In all strains, the PTDH3 derivative promoters diagrammed on the left directed the synthesis of Citrine integrated into the LEU2 locus. Grey boxes inside the diagrams denote tetO1 TetR-binding sites. For measurement of repressed activity, an additional PACT1-directed TetR was integrated into the HIS3 locus. Citrine fluorescent signal was detected by flow cytometry. Fold difference refers to the median of the maximum activity divided by the median of the repressed activity signal. Fold over autofluorescence refers to median repressed activity signal divided by the median autofluorescent background signal. Maximum promoter activity is quantified as percentage of PTDH3 signal using the medians. x axis shows intensity of fluorescence signal. Plots are density distributions of the whole population, such that the area under the curve equals 1 and the y axis indicates the proportion of cells at each fluorescence value. The circles inside each density plot show the median, and the upper and lower bounds of the bar correspond to the first and third quartiles of the distribution. Repressed activity of P3tet is above the x axis depicted in this figure, but can be seen in Figure 1—figure supplement 1. (C) Repression and maximum activity of the optimized P7tet.1. Diagrams and plots as in (B). P7tet.1 contained additional binding sites for Rap1 and Gcr1 selected for higher activity, as well as an alternative TATA sequence as described in the Supplementary Information. It shows the highest fold difference, maximum activity comparable to PTDH3, and low repressed activity.
-
Figure 1—source data 1
Numerical data for Figure 1.
- https://cdn.elifesciences.org/articles/69549/elife-69549-fig1-data1-v2.zip
Figure 1—figure supplement 1
A promoter with three tetO1 sequences in the UAS of PTDH3 is only minimally repressed by TetR.
We constructed P3tet, a PTDH3 derivative that carried three tetO1 TetR binding sites, adjacent to the endogenous transcription binding sites (one for Rap1, two for Gcr1) in the UAS. We used this to construct Y2564, a strain that carried the P3tet-Citrine construct integrated into the LEU2 locus (unrepressed), and the otherwise isogenic strain Y2573, in which a PACT1-TetR construct was additionally integrated at the HIS3 locus (repressed). We measured Citrine fluorescence using flow cytometry. Plot shows density of cells at each fluorescence value, such that the area under the curve is 1. By comparison of medians, as described, repression by TetR was only 1.5-fold. As described in the main text, the inference from this result is either that TetR cannot efficiently prevent endogenous transcription factors Rap1 and Gcr1 from occupying their binding sites in the UAS, or that interfering with binding to UAS sites without blocking PIC assembly near the TATA-sequence is not sufficient to significantly repress transcription from this promoter.
Figure 2 with 4 supplements
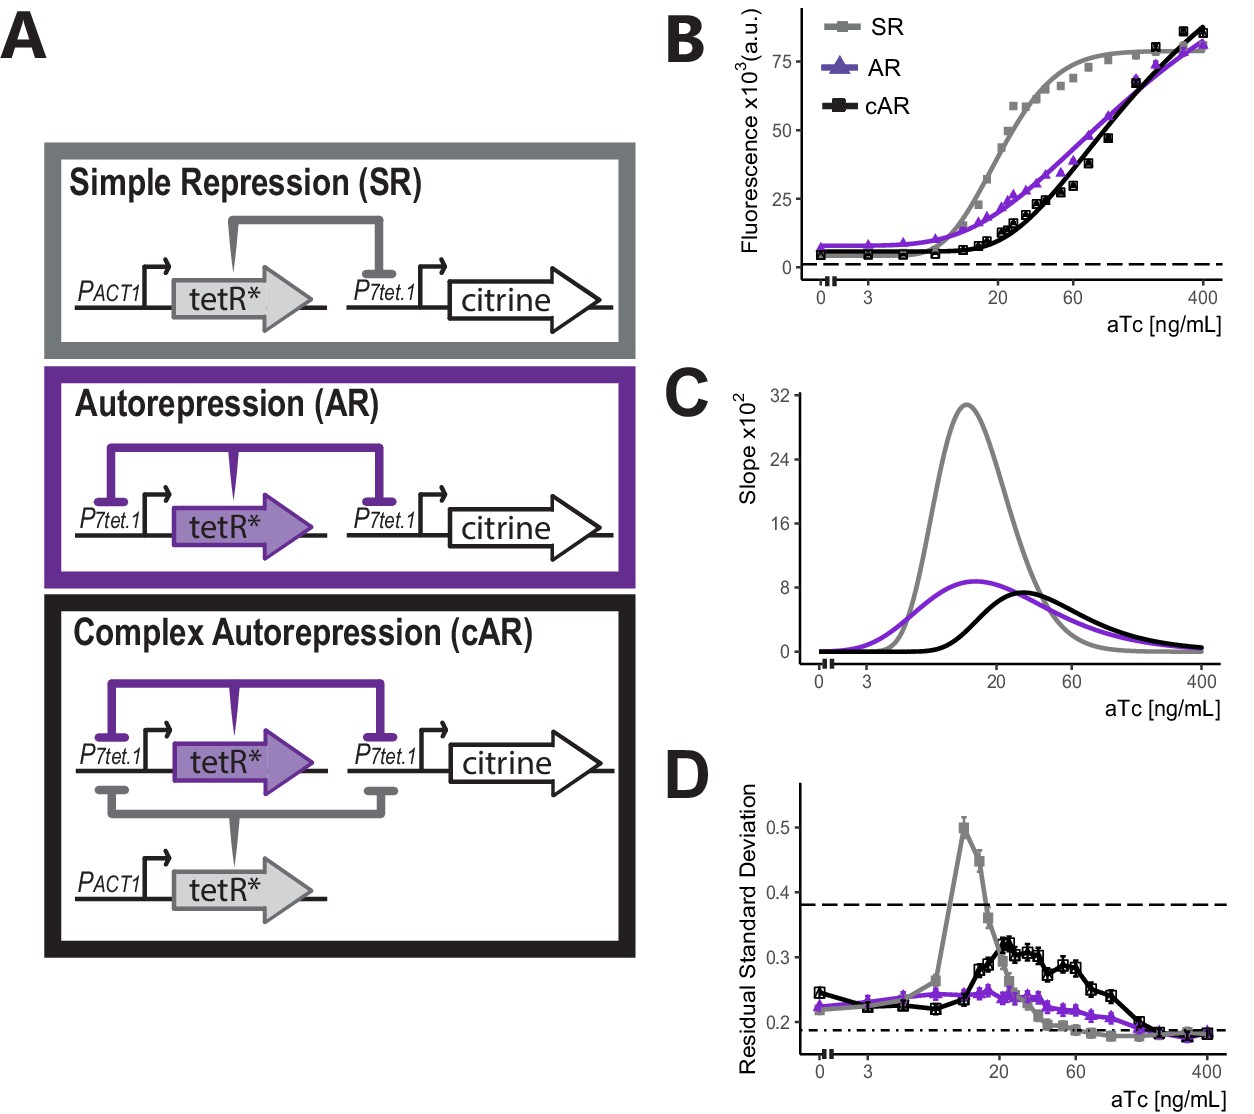
Comparison of the three controller architectures.
(A) Genetic elements of the different controller architectures used in these experiments. The * next to TetR indicates SV40 Nuclear Localization Sequence and flat headed arrows indicate repression. In all cases, P7tet.1 drives Citrine expression integrated at the LEU2 locus. In SR, the repressor of P7tet.1, tetR, is integrated at the HIS3 locus and is constitutively expressed. In AR, tetR is again integrated at the HIS3 locus, but is now expressed by P7tet.1. cAR has the same constructs as AR and an additional, constitutively expressed zeroing repressor integrated at the URA3 locus. (B) aTc dose response curves of Citrine expression for the three different architectures. Citrine fluorescence from strains bearing these architectures was measured at steady state using flow cytometry after 7 hr of induction with different concentrations of aTc. Symbols indicate the median fluorescence at each dose. Lines are fitted using a five-parameter log logistic function as explained in Materials and methods. Dashed line indicates autofluorescence signal measured from the parental strain without Citrine. (C) Slopes of the dose response curves in (B). The x axis range with non-zero slopes defines the useful input dynamic range. (D) Cell-to-cell variation of expression by these three architectures. We calculated single-reporter cell-to-cell variation (VIV) as described. Higher Residual Standard Deviation (RSD) values (y axis) correspond to greater VIV. Dot-dash line indicates the VIV of the strain where Citrine is constitutively expressed from PTDH3 and dashed line indicates VIV of autofluorescence in the parent strain without Citrine. Error bars indicate 95% confidence interval calculated using bootstrapping (n=1000) as described in Materials and methods.
-
Figure 2—source data 1
Numerical data for Figure 2 panels B and D.
- https://cdn.elifesciences.org/articles/69549/elife-69549-fig2-data1-v2.zip
Figure 2—figure supplement 1
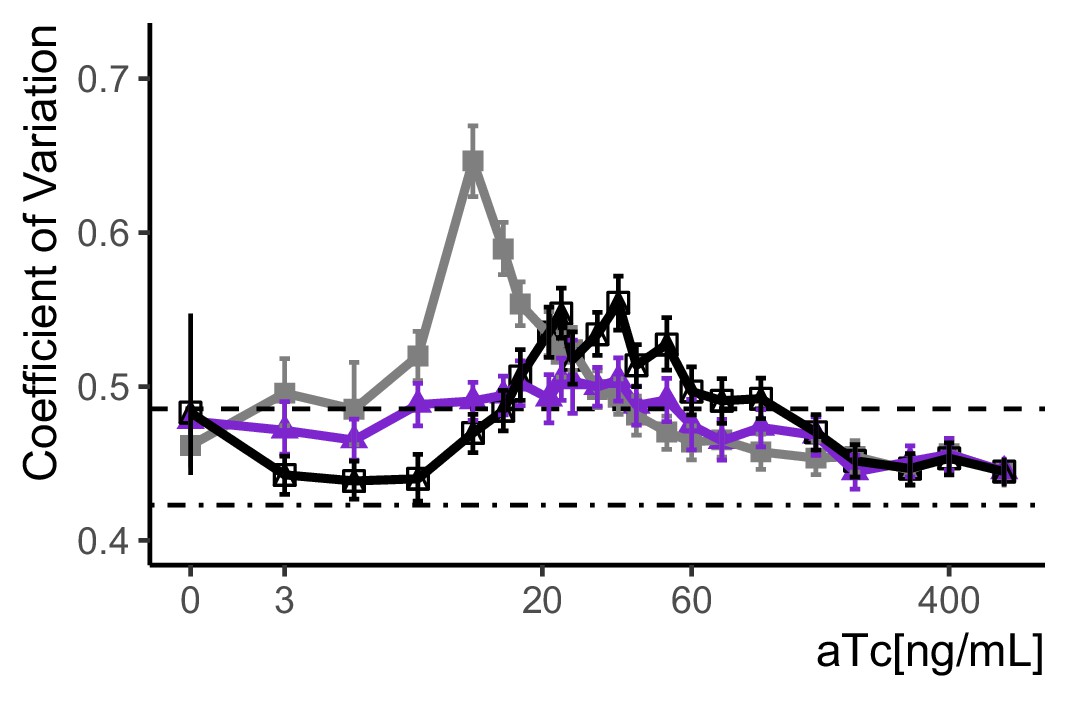
Variation in expression for the SR, AR, and cAR architectures.
We calculated the CoV in fluorescence signal using the data shown in main Figure 2B, to test whether the volume-corrected RSD measure described in Appendix 2 and Figure 2—figure supplement 2 agrees with it. The plot shows observed CoV at each aTc concentration tested for the strains carrying different architectures. SR(Y2663), grey, AR(Y2674), purple, and cAR(Y2741), black. Bootstrapping (n=1000) as described in Materials and methods was used to estimate 95% confidence intervals as indicated by the error bars. Dashed line indicates the CoV of the parent cell (autofluorescence control, Y70) and dot-dash line the strain where Citrine was constitutively expressed from PTDH3 (Y2683). The CoV provides a direct measure of the total CCV in expression, and includes variation due to larger cells having had a longer time to produce more fluorescent protein. For each architecture, both this simple CoV and the VIV measure in Main Figure 2B show maximum variation at the same aTc concentrations.
-
Figure 2—figure supplement 1—source data 1
Numerical data for Figure 2—figure supplement 1.
- https://cdn.elifesciences.org/articles/69549/elife-69549-fig2-figsupp1-data1-v2.zip
Figure 2—figure supplement 2
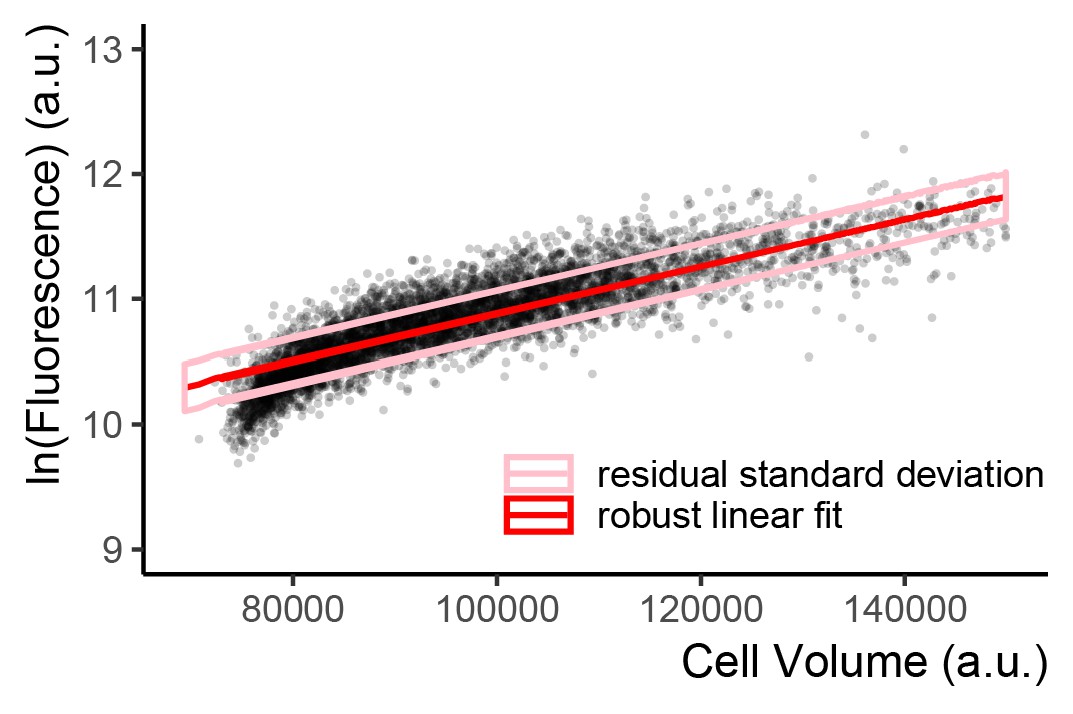
Single-reporter VIV measure of CCV in expression.
Scatter plot of flow cytometry cell volume proxy vs. Citrine fluorescence in a strain where Citrine is constitutively expressed from PTDH3 at the LEU2 locus (Y2683) shows a positive correlation between the two quantities. Fluorescence and the volume proxy are positively correlated because, in cycling populations larger cells have had more time to express more fluorescent protein. Each point represents a single cell. Volume proxy was calculated as the vector of the SSC-H and FSC-W signals (Materials and methods). The red line indicates the robust linear fit, the ideal linear correlation between volume and fluorescence in this population if there was no cell-to-cell variation. Pink lines represent +1 and −1 one residual standard deviation from this fitted correlation line. The RSD value can be interpreted as the fraction of variation in expression in the population that is not explained by the cell volume proxy/inferred progress through the cell cycle. We therefore named this measure Volume-Independent Variation (VIV).
Figure 2—figure supplement 3
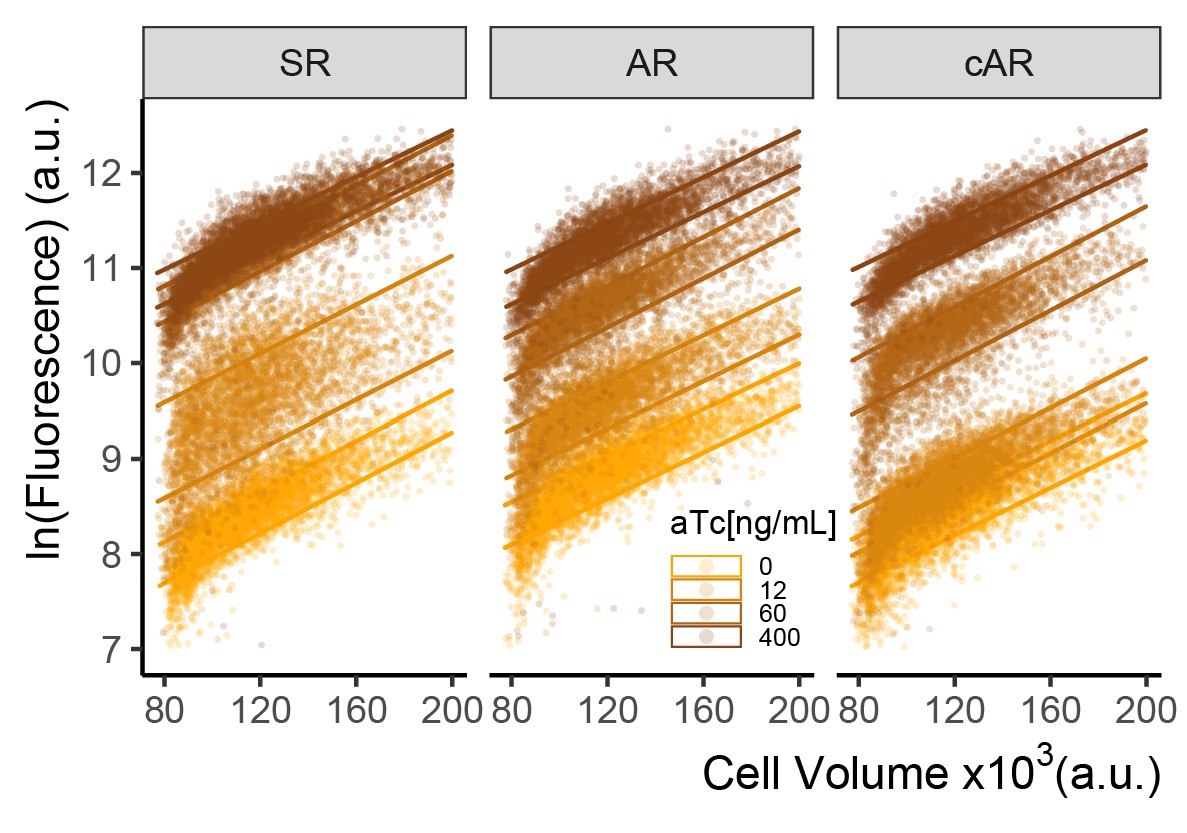
Autorepression loop reduces cell-to-cell variability at intermediate concentrations of aTc.
Plot of flow cytometry cell volume proxy vs Citrine fluorescence in whole (ungated) populations of cells of SR, AR, and cAR architectures (Y2663,2674,2741) grown for 7 hr at different aTc concentrations. Each point indicates an individual cell. The two lines of the same color are drawn at +1 and 1- RSD for the fitted robust line of each population, same as in Figure 2—figure supplement 2. By this measure, at intermediate induction concentrations, the SR architecture shows around twofold increased cell-to-cell variability compared to AR and cAR architectures, both of which contain an autorepression loop.
Figure 2—figure supplement 4
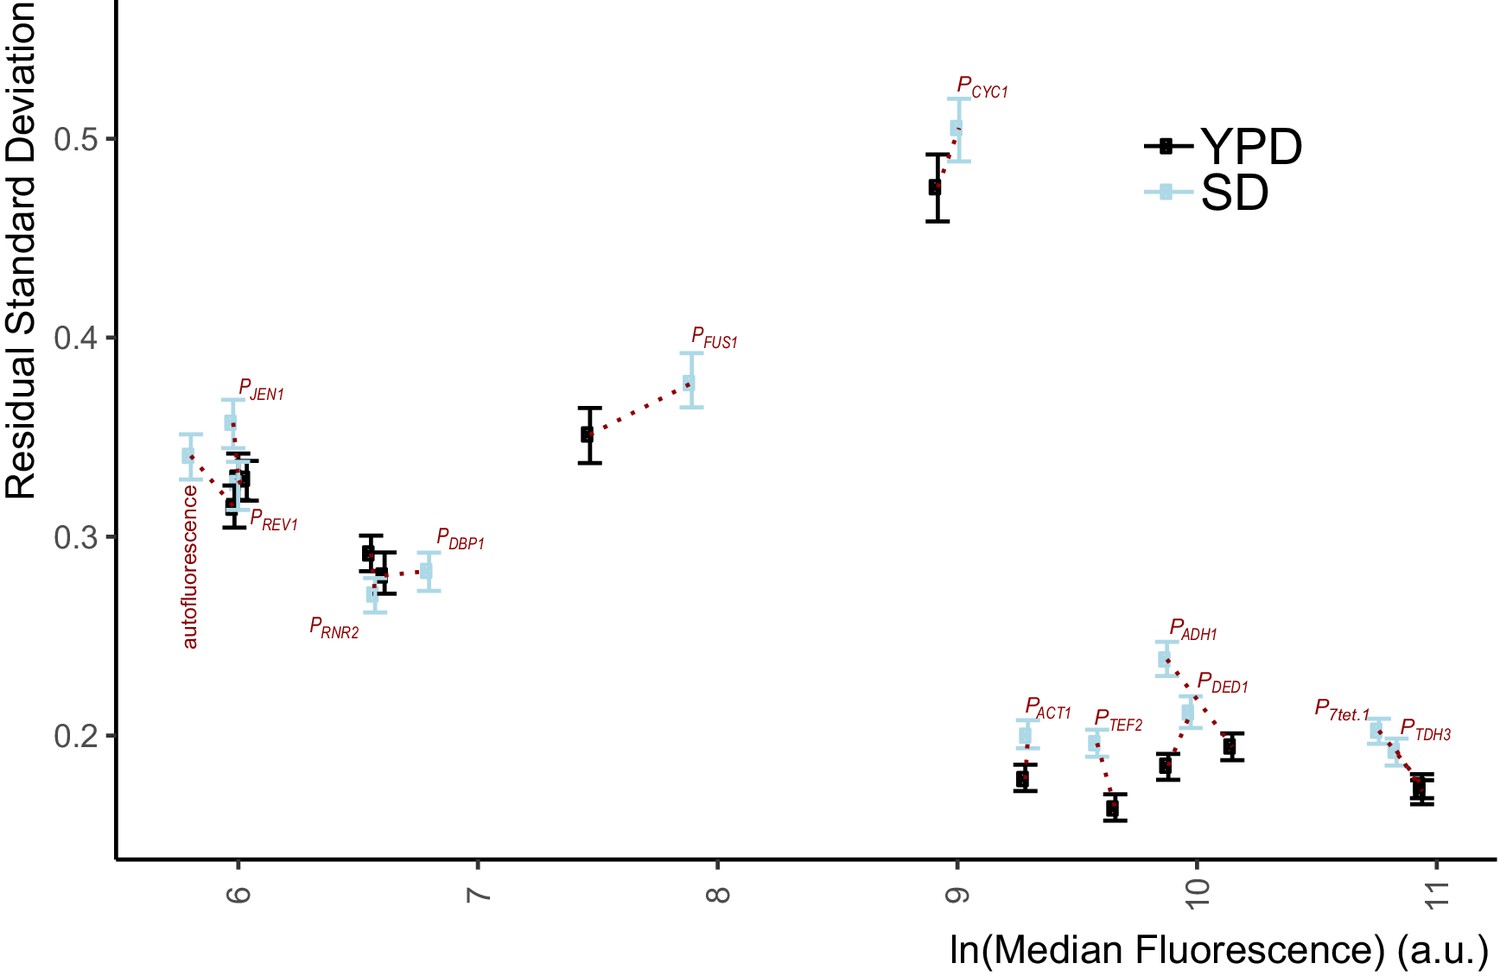
Single-reporter VIV measure of variation in expression from native yeast promoters.
We measured Citrine expression and its VIV in otherwise isogenic haploid cells that carried integrated constructs at various auxotrophic marker loci, in which the indicated native yeast promoters drove Citrine expression. All strains used here are indicated in Supplementary file 1 - Table S1 as ‘promoter name-const’. Autofluorescence was strain Y70. We grew cells to exponential phase in Rich medium (YPD) and synthetic medium (SD Full [minimal glucose media with complete amino acid complement]) and measured fluorescent signal with flow cytometry. RSD values were calculated as explained in Appendix 2. Error bars indicate 95% confidence intervals on the RSD measurement as calculated by bootstrapping (See Materials and methods). For most promoters, the the VIV is lower in YPD. For all strong promoters except CYC1 promoter (PCYC1), VIV is around 20%. For promoters with lower endogenous activity (as inferred from expression levels of the endogenous proteins they control Ho et al., 2018) VIV was roughly 30%, similar to the variation measured from the autofluorescence signal of the strain without Citrine. For PCYC1, measured VIV was about 50%.
-
Figure 2—figure supplement 4—source data 1
Numerical data for Figure 2—figure supplement 4.
- https://cdn.elifesciences.org/articles/69549/elife-69549-fig2-figsupp4-data1-v2.zip
Figure 3 with 3 supplements
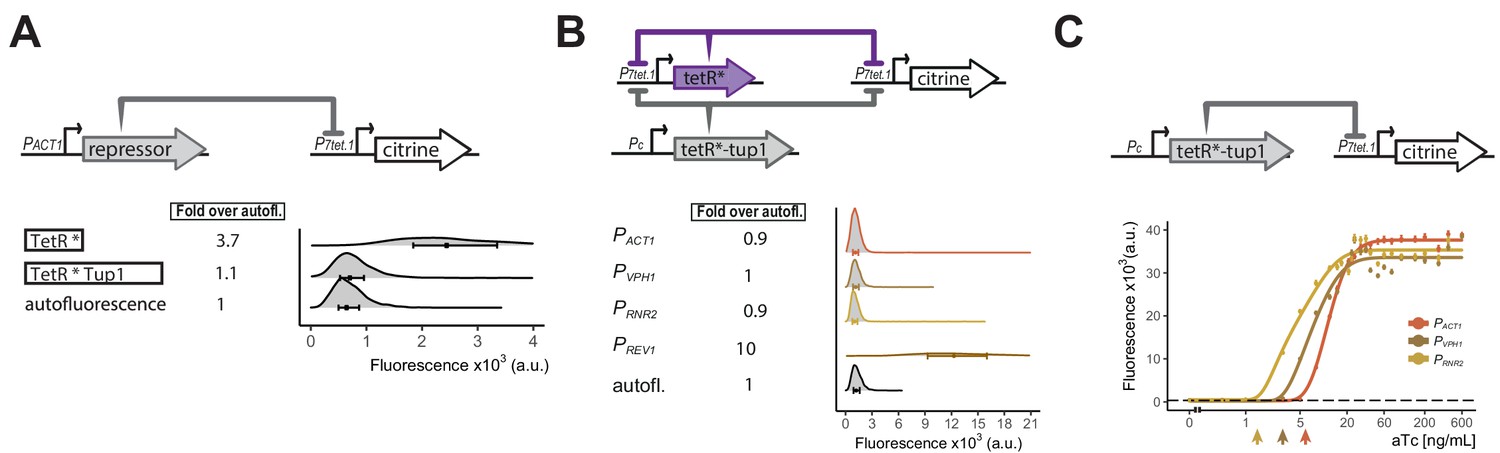
Repressor optimization to abolish P7tet.1 basal expression.
A) Testing repression by the TetR-Tup1 fusion. The top diagram indicates the genetic elements of the SR architecture used to test the ability of the TetR-Tup1 fusion to abolish basal expression from P7tet.1. Diagrams to the left of the plot show the different repressors used. Each * indicates one SV40 Nuclear Localization Sequence. For both (A) and (B), Citrine fluorescence from P7tet.1 repressed by the repressors indicated was measured using flow cytometry. Plots as in Figure 1. The circles inside each density plot show the median and the upper and lower bounds of the bar correspond to the first and third quartiles of the distribution. Numbers to the left of the plot indicate fold expression over autofluorescence, that is, the median of the Citrine fluorescence detected divided by the median of the autofluorescence signal. (B) Finding the lowest expression level of the zeroing repressor TetR-nls-Tup1 that abolishes basal expression from P7tet.1 . The top diagram shows the genetic elements of the cAR architecture in the strains tested. Pc indicates a constitutive promoter. Promoters driving TetR-nls-Tup1 expression are indicated to the left of the plot. Numbers to the left of the plot as in (A). (C) Reducing expression of TetR-nls-Tup1 lowers induction threshold. The top diagram shows genetic elements of SR architecture in which synthesis of TetR-nls-Tup1 was directed by different promoters. The plot shows Citrine fluorescence measured using flow cytometry at steady state, 7 hr after induction with different aTc concentrations. Arrows indicate induction thresholds, defined as the lowest aTc dose where an increase in fluorescence signal was detected. Dashed line indicates autofluorescence control (parent strain without Citrine), circles indicate the median of the experimentally measured population, lines are fitted. Error bars indicate 95% confidence interval calculated using bootstrapping (n=1000) as explained in Materials and methods.
-
Figure 3—source data 1
Numerical data for Figure 3.
- https://cdn.elifesciences.org/articles/69549/elife-69549-fig3-data1-v2.zip
Figure 3—figure supplement 1
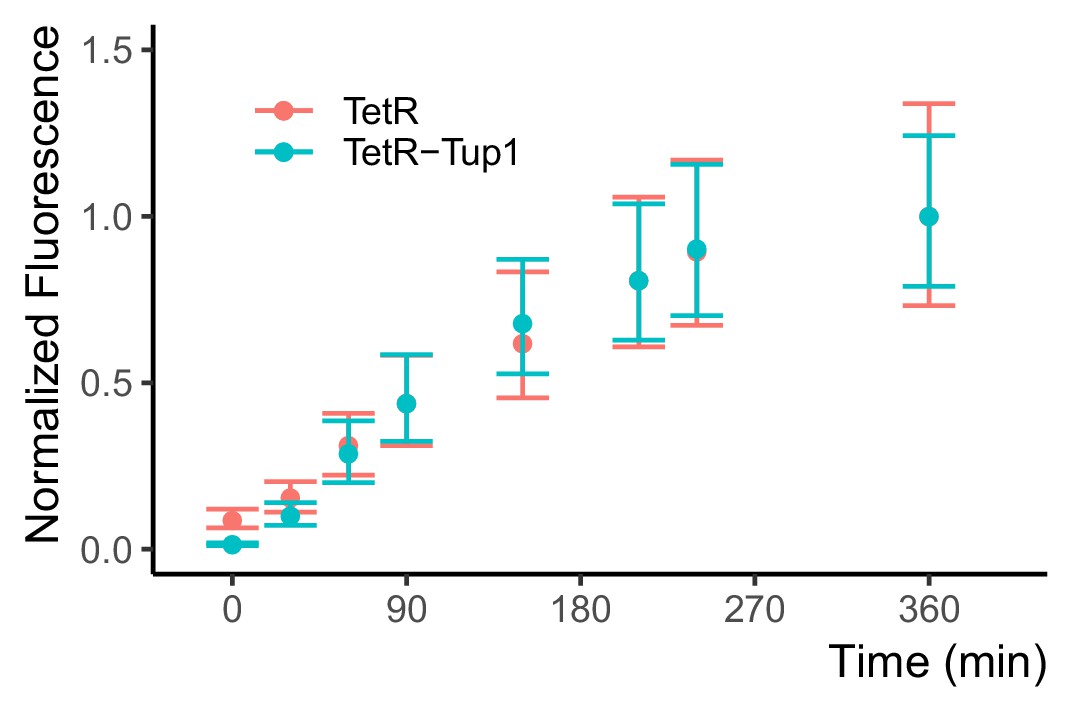
The zeroing repressor TetR-nls-Tup1 does not affect the induction speed of P7tet.1.
Citrine signal after induction in P7tet.1-Citrine strains. Both strains carried a P7tet.1-Citrine integrated at the LEU2 locus, in conjunction with two different repressors. One strain (red, Y2674) carried an autorepressing P7tet.1-TetR construct integrated at the MET15 locus. The second strain (blue, Y2717) was otherwise isogenic, but had no TetR. Instead it carried a constitutively expressed PRNR2-TetR-nls-Tup1 construct integrated at HIS3 locus. We induced both strains with 600 ng/mL aTc at time zero during exponential growth phase. We quantified Citrine fluorescent signal in flow cytometry, and normalized to maximum level reached at 360 min. The dots indicate the median normalized fluorescence, error bars span the range between the first and the third quartiles. The results show that TetR-nls-Tup1 does not reduce induction speed, nor the time needed to reach steady state.
-
Figure 3—figure supplement 1—source data 1
Numerical data for Figure 3—figure supplement 1.
- https://cdn.elifesciences.org/articles/69549/elife-69549-fig3-figsupp1-data1-v2.zip
Figure 3—figure supplement 2
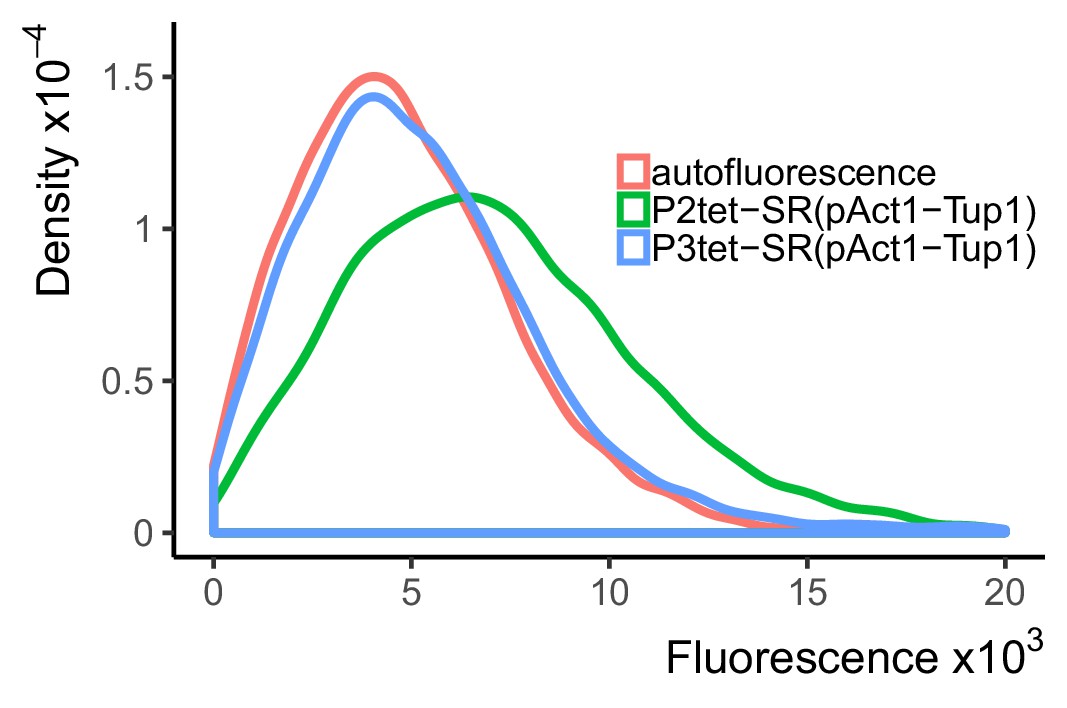
A TetR-nls-Tup1 fusion protein fully represses expression when binding only at the UAS, but not only at the TATA.
Strains carried a PACT1 construct that directed the expression of TetR-nls-Tup1 integrated at HIS3 locus. Y2702 (blue line) also carried P3tet-Citrine construct, which bears three TetR binding sites adjacent to each Gcr1 and Rap1-binding site in the UAS, integrated at LEU2. Y2662 (green line) carried P2tet-Citrine construct, in which TetR binding sites flank the TATA-sequence, integrated at LEU2. Y70 (red line) is a control strain with no integrated constructs. Repressed expression was measured using flow cytometry at maximum voltage, that is maximum sensitivity. Plot shows density of cells at each fluorescence value, such that the area under each curve is 1. TetR-nls-Tup1 completely repressed fluorescent signal driven by the P3tet, in which the TetR sites are in the UAS, but not from P2tet construct, in which the TetR binding sites flank the TATA-sequence. For comparison, repressed expression in the P2tet strain (Y2662) was 1.38-fold higher than in the P3tet strain (Y2702), even though the expression in the unrepresssed P2tet strain was only 1.14-fold more than P3tet. This fact shows that, even given the difference in promoter strength, P3tet is repressed more effectively than P2tet.
Figure 3—figure supplement 3
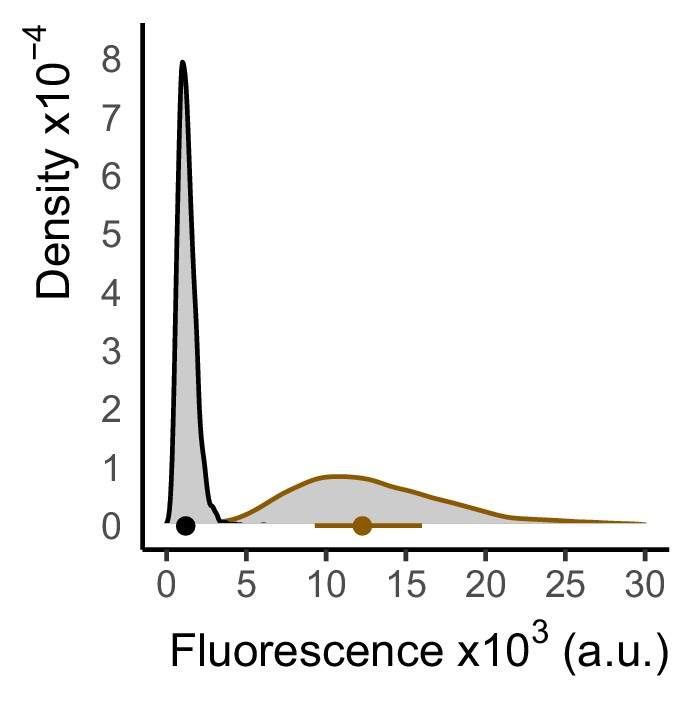
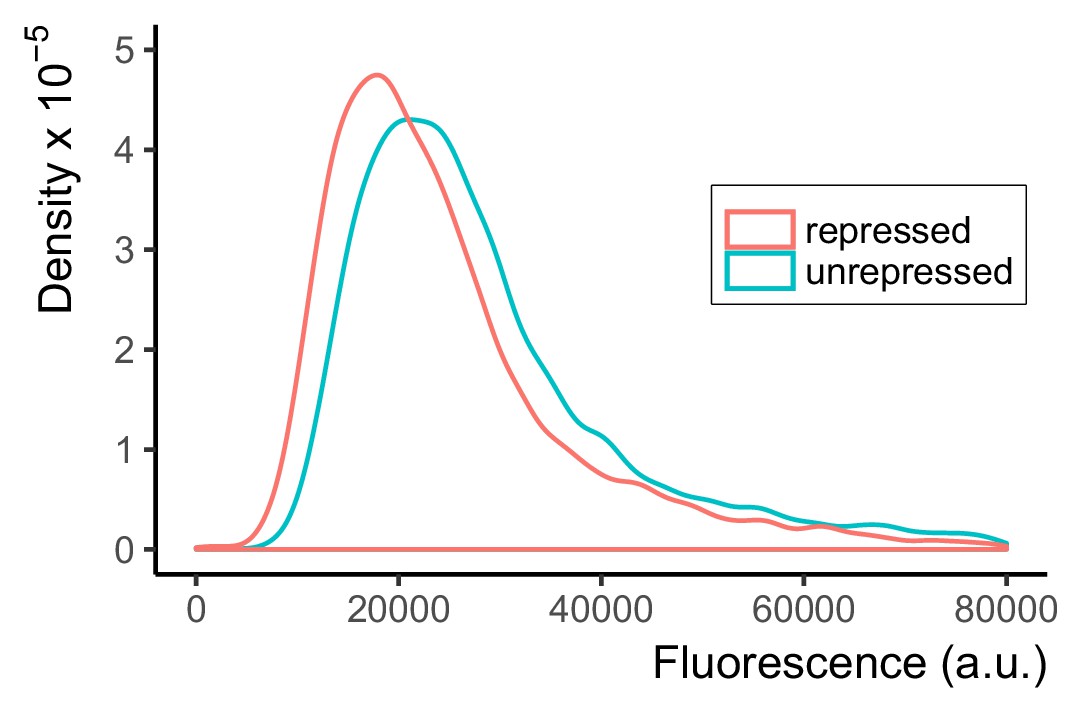
Low level TetR-nls-Tup1 expression results in incomplete repression of P7tet.1.
Fluorescence signal from a strain where a P7tet.1-Citrine construct was integrated at the LEU2 locus and repressed by PREV1-driven TetR-nls-Tup1 integrated at HIS3 and P7tet.1 driven TetR integrated at the MET15 locus (brown, Y2715) was measured using flow cytometry, and autofluorescence signal (black, Y70) was measured from an otherwise isogenic strain that lacked Citrine, TetR, and TetR-nls-Tup1 expression. Plot shows density of cells at each fluorescence value, such that the area under the curve is 1. The dot inside the plot indicates the median, the bar spans the range from the first to the third quartile. TetR-nls-Tup1 can only repress P7tet.1 activity to 10-fold above autofluorescence when expressed from PREV1 in the WTC846 architecture. This result indicated that the TetR-nls-Tup1 needed to be expressed at a higher level to fully repress P7tet.1. Taken together with the results presented in Figure 3B, this result suggests that the lowest abundance of TetR-nls-Tup1 able to fully repress P7tet.1 lies between that expressed from constructs driven by PREV1 and constructs driven by PRNR2.
Figure 4 with 9 supplements
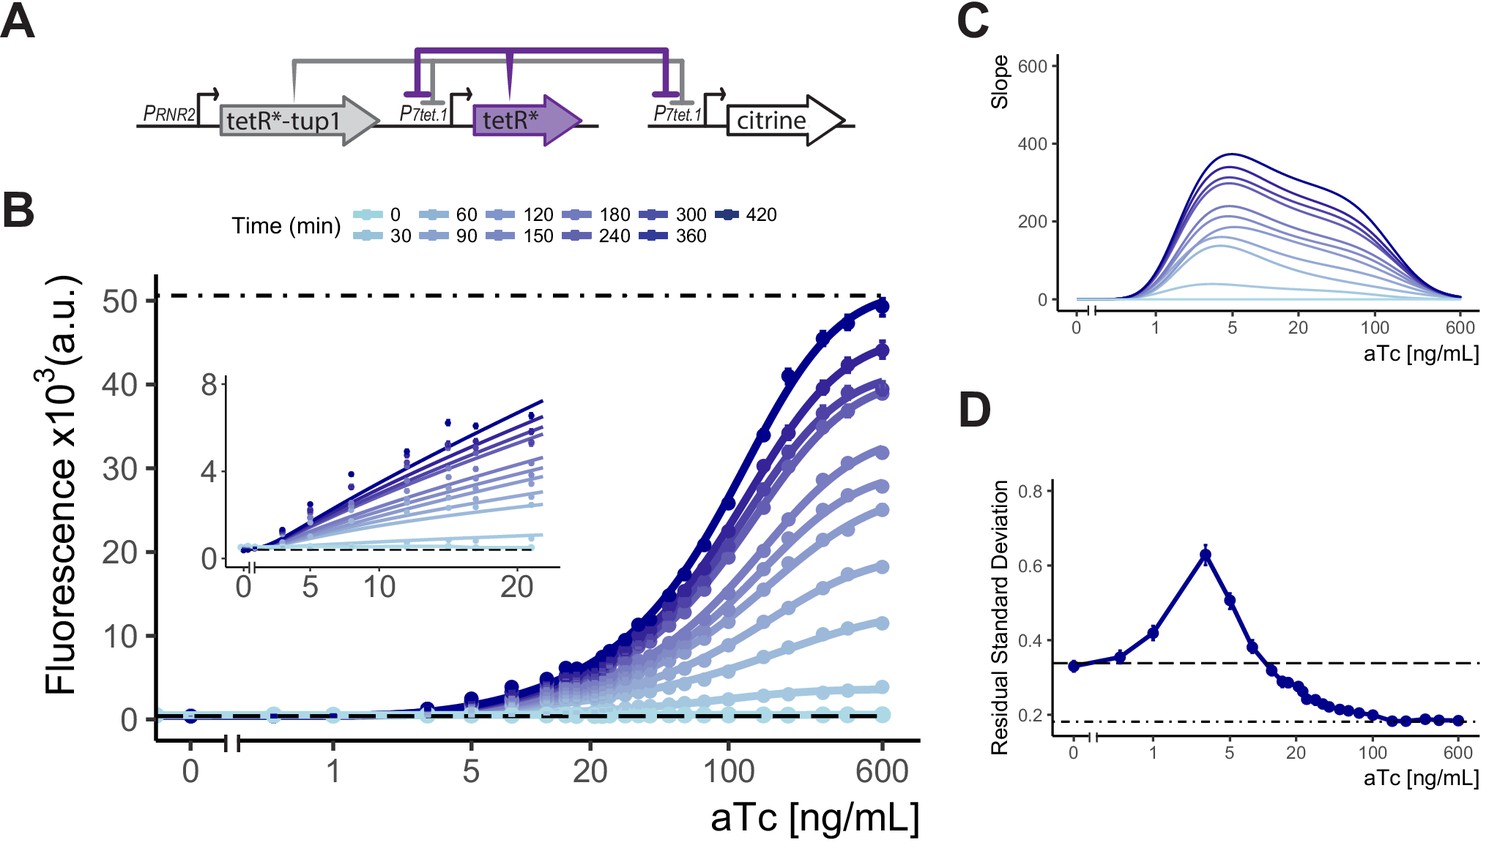
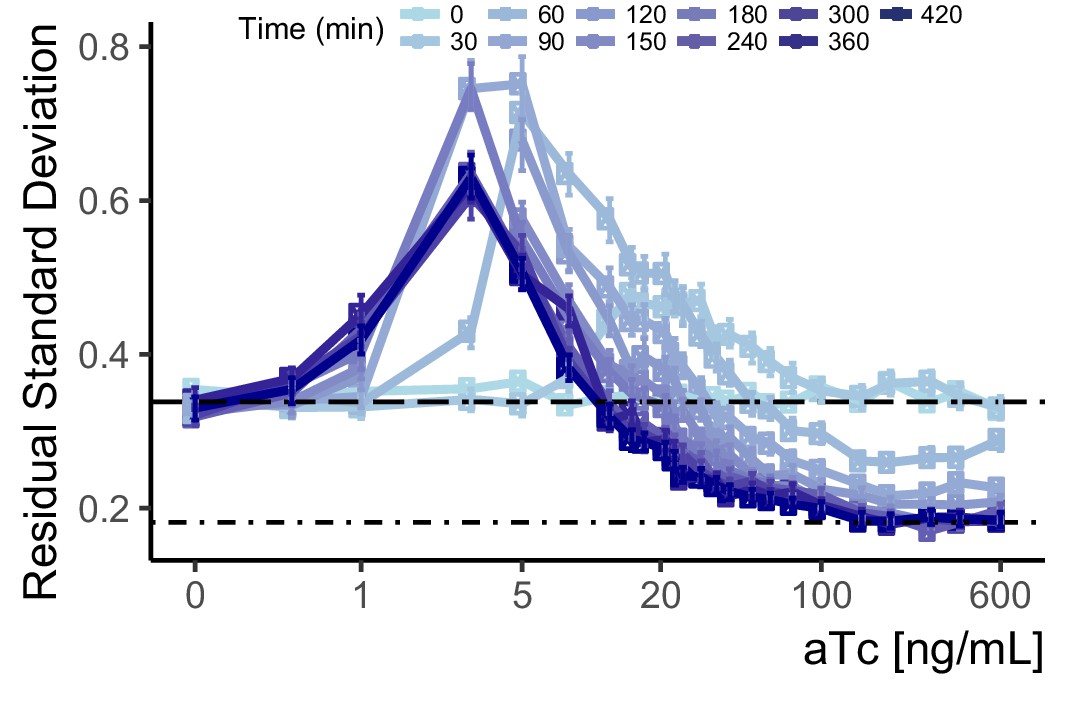
Controlled gene expression from WTC846.
(A) Architecture of WTC846. The final WTC846 system is composed of a single integrative plasmid bearing TetR and TetR-Tup1 driven by the promoters indicated. This plasmid was integrated at the URA3 locus. P7tet.1-driven Citrine was integrated at the LEU2 locus. * indicates SV40 Nuclear Localization Sequence. Repression of promoters is indicated by flat headed arrows. (B) Time dependent dose response of WTC846-controlled expression. Citrine fluorescence was measured using flow cytometry at 30 min intervals after induction with different concentrations of aTc (ng/mL). Dashed line indicates median autofluorescence (parent strain without Citrine) and dot dashed line fluorescent signal from wild type PTDH3 (Y2683). Circles show the median of the experimentally measured population, and the lines were fitted as explained in Figure 2B. The inset shows response at low input aTc doses. (C) The slopes of the dose response curves in (A), as a visual representation of the input dynamic range, defined as the range of doses where the slope of the dose response curve is non-zero. (D) Cell-to-cell variation of WTC846-controlled expression. Single reporter CCV quantified using the VIV measure at 7 hr calculated as in 2D. Dashed line shows VIV of autofluorescence, dot-dashed line VIV of PTDH3-driven Citrine signal. Where present, error bars indicate 95% confidence interval calculated using bootstrapping (n=1000) as described in Materials and methods.
-
Figure 4—source data 1
Numerical data for Figure 4 panels B and D.
- https://cdn.elifesciences.org/articles/69549/elife-69549-fig4-data1-v2.zip
Figure 4—figure supplement 1
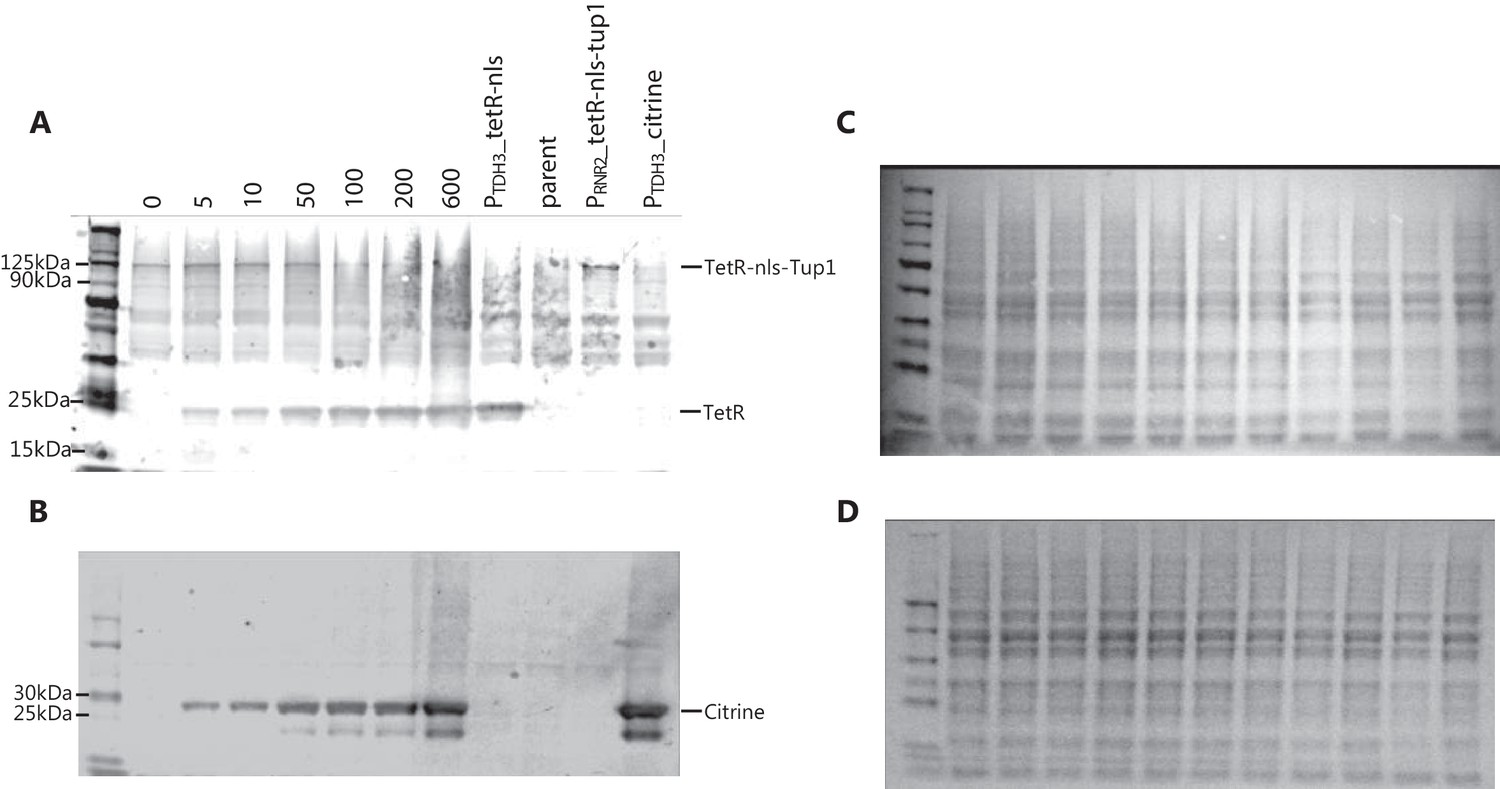
Direct observation of dose response for WTC846-controlled protein expression.
The strain WTC846::citrine (Y2759), in which both TetR and Citrine were expressed from P7tet.1, and TetR-nls-Tup1 was expressed constitutively from PRNR2, was grown in YPD to stationary phase with different aTc concentrations. TetR and TetR-nls-Tup1 were integrated at the URA3, and the P7tet.1-Citrine construct at the LEU2 locus. Protein extracts from 2.5 million cells were loaded per lane for western blotting from either these samples, or from otherwise isogenic control strains that constitutively expressed either TetR (Y2611) or Citrine (Y2683) under the control of PTDH3, TetR-nls-Tup1 (Y2717) under the control of PRNR2 (HIS3 locus), or no non-endogenous protein was expressed (Y70). In this experiment, we used Ponceau staining to confirm uniform sample loading (C,D). The primary antibodies were mouse monoclonal anti-TetR and anti-GFP. The secondary antibody was IRDye 800CW Goat anti-Mouse IgG. We quantified protein level by infrared signal in the the Li-Cor reader as explained in Materials and methods. Numbers indicate aTc concentrations in ng/ mL. In Y2759, both the TetR(A) and Citrine(B) expression was higher at higher aTc concentrations, and neither protein was expressed in the absence of aTc. The result shows that uninduced WTC846 has no detectable repressed expression of either protein at the protein level, and the level of the expressed protein can be precisely adjusted.
-
Figure 4—figure supplement 1—source data 1
Raw and uncropped images for western blots in Figure 4—figure supplement 1.
- https://cdn.elifesciences.org/articles/69549/elife-69549-fig4-figsupp1-data1-v2.zip
Figure 4—figure supplement 2

Dose response of WTC846-controlled expression in cells grown in different media.
(A) Strain carrying WTC846::citrine construct (Y2759) grown in different media. Dots represent the median fluorescence of each population, and the lines were fitted using a five parameter log-logistic model as explained in Materials and methods. Since dose responses were measured in separate experiments, the absolute fluorescence values of cells grown in different media are not comparable. (B) Slopes of the fit of the dose response curves depicted in (A). This plot provides a visual estimate of the input dynamic range, which is the range of aTc concentrations where the slope is non-zero. (C) Dose response of VIV measure of CCV in WTC846::citrine expression in cells grown in different media (in A) at different aTc doses, calculated as in Materials and methods and Appendix 2. (D) VIV of two control strains in the same media conditions: one (Y2683), that carried a PTDH3-citrine construct integrated at LEU2, and a parent strain without any non-endogenous gene expression (Y70, labeled autofluorescence). Where present, error bars indicate 95% confidence interval calculated using bootstrapping (n=1000) as explained in Materials and methods. In all media, cell-to-cell variation in WTC846-driven Citrine expression is less than the variation measured in autofluorescence and comparable to that for constitutive expression throughout the majority of the precisely titratable input dynamic range. This shows that WTC846 can reliably titrate proteins under different media conditions.
-
Figure 4—figure supplement 2—source data 1
Numerical data for Figure 4—figure supplement 2.
- https://cdn.elifesciences.org/articles/69549/elife-69549-fig4-figsupp2-data1-v2.zip
Figure 4—figure supplement 3
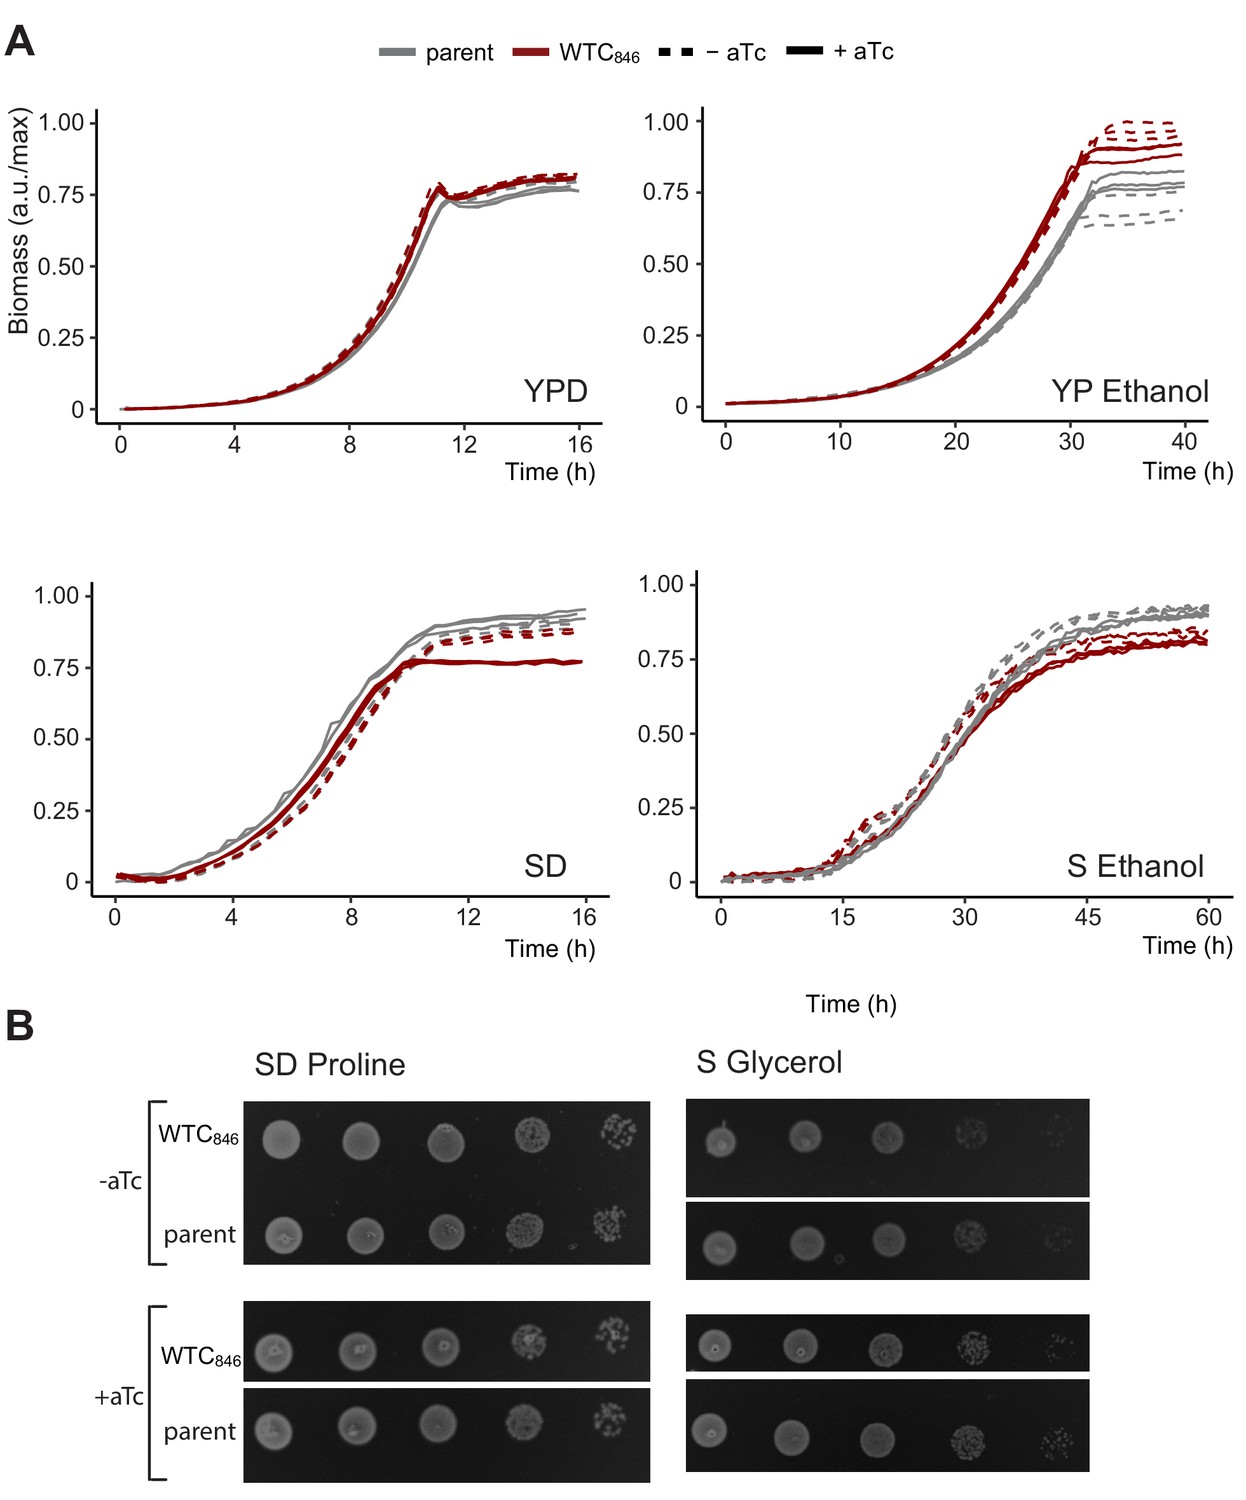
WTC846-directed expression does not affect gross measures of cell physiology.
We measured the effect of WTC846 on growth rate and on cell viability by ability of single cells to form colonies. To do so, we used the WTC846:: strain Y2761, in which a construct bearing P7tet.1-TetR and PRNR2-TetR-nls-Tup1 was genomically integrated at the URA3 locus, but no controlled gene was present. Growth compared to that of Y70, an otherwise isogenic parent in which these components were not integrated, was used as a proxy for cellular physiology and well-being. (A) Growth curves were obtained using back scatter using a Biolector for YPD, SD Full and YP Ethanol with a total culture volume of 1 mL, a Growth Profiler (Enzyscreen) for S Ethanol with a total culture volume of 250 μL. In (A), y axis shows culture density as measured by the device in arbitrary units. Values were normalized such that the highest value recorded corresponds to 1. Seeding density for liquid cultures were 50,000 cells per mL for all media except when ethanol was used as carbon source, in which case it was 500,000 cells per mL. (B) Colony formation assays for SD Proline and S Glycerol. Spotting assays were on solid SD Proline and S Glycerol media as described. For spotting assays, 500,000 cells were spotted on the left column, and each subsequent spot was from a 1:10 dilution in cell numbers. Pictures were taken after 48 hr of growth at 30°C. These assays showed no significant differences between the parent and the WTC846 strain, except in YP Ethanol, in which the WTC846 strain consistently reached a slightly higher density for unknown reasons.
-
Figure 4—figure supplement 3—source data 1
Raw data and raw plate images for Figure 4—figure supplement 3.
- https://cdn.elifesciences.org/articles/69549/elife-69549-fig4-figsupp3-data1-v2.zip
Figure 4—figure supplement 4
Cell-to-cell variation of WTC846-driven expression during induction.
We used data from the Time Dependent Dose Response (TDDR) experiment shown in Figure 4B to calculate single reporter VIV during the course of induction of the WTC846::citrine strain (Y2759) at different doses of aTc. We compared this with VIV in autofluorescence (dashed line, Y70) and in constitutive Citrine signal driven by a PTDH3-Citrine construct integrated at LEU2 (dot dash line, Y2683). Error bars indicate 95% confidence interval calculated using bootstrapping (n=1000) as explained in Materials and methods. VIV was calculated as explained in Appendix 2. At earlier time points, the peak in VIV is observed at higher doses than steady state, but it stabilizes at steady state levels within 2–2.5 hr after induction.
-
Figure 4—figure supplement 4—source data 1
Numerical data for Figure 4—figure supplement 4.
- https://cdn.elifesciences.org/articles/69549/elife-69549-fig4-figsupp4-data1-v2.zip
Figure 4—figure supplement 5
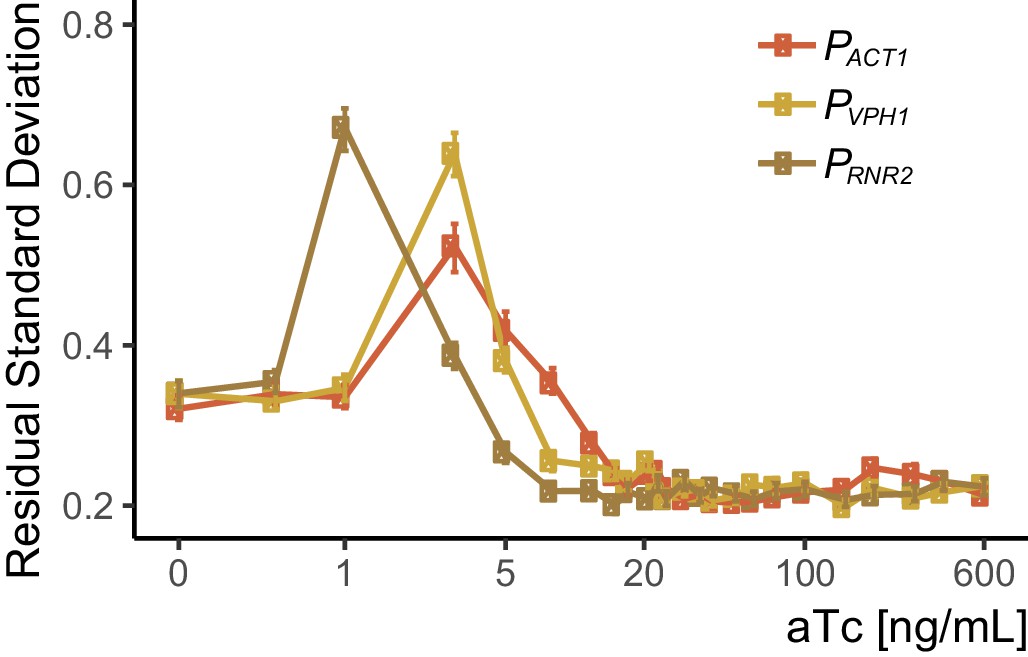
Peak CCV in SR strains corresponds to higher doses at higher expression levels of TetR-nls-Tup1.
We used data from the dose response experiment shown in Figure 3C to calculate single-reporter VIV to quantify CCV as described in the Appendix 2. We induced three strains (Y2669, Y2676, and Y2717) which carried a P7tet.1-Citrine construct integrated at LEU2, and which carried constructs integrated at HIS3 in which the PACT1, PVPH1 and PRNR2 promoters drove TetR-nls-Tup1 expression. Induction was done with different concentrations of aTc and Citrine fluorescence signal was measured after seven hours using flow cytometry. Error bars indicate the 95% confidence interval as calculated by bootstrapping (see Materials and methods). For each strain, peak cell-to-cell variation corresponds to the steepest part of each dose response curve in Figure 3C, and occurs at higher aTc concentrations at higher TetR-nls-Tup1 expression levels (TetR-nls-Tup1 expression level inferred from the endogenous protein abundance of Act1, Vph1, and Rnr2 Ho et al., 2018).
-
Figure 4—figure supplement 5—source data 1
Numerical data for Figure 4—figure supplement 5.
- https://cdn.elifesciences.org/articles/69549/elife-69549-fig4-figsupp5-data1-v2.zip
Figure 4—figure supplement 6

Fluorescence and volume of the WTC846::citrine strain induced with different aTc concentrations.
We grew cells of WTC846::citrine strain (Y2759) to exponential phase, and measured Citrine fluorescence with flow cytometry 7 hr after induction with aTc. The complete dose response is presented in main text Figure 4B. For this plot, we calculated the cell volume proxy as the vector of SSC-H and FSC-W signals as described (Materials and methods and Appendix 2). Each dot represents a single cell. Legend indicates aTc concentration in ng/mL. The boxes were drawn as explained in Figure 2—figure supplement 2. The height of these boxes spans +/- one RSD and indicate the magnitude of variaton in the population. As explained in main text Figure 4D, at lower aTc concentrations the CCV is slightly higher due to the effect of the SR regime of the WTC846 architecture, however for most of the input dynamic range, variation in fluorescence at a given volume is low, as was observed for the AR architecture in main Figure 2D.
Figure 4—figure supplement 7

CCV of WTC846-controlled expression in cells grown in different media.
CCV of WTC846 was measured in different media conditions using the WTC846::citrine strain (Y2759) and the VIV measure. Cells were grown in different media at different aTc concentrations, and Citrine fluorescence was recorded with flow cytometry at steady state. Time to reach steady state depends on the growth rate of the cells in the media condition, and is longer the slower the growth rate is. We calculated the single reporter VIV measure of CCV as explained in the Appendix 2. Error bars indicate 95% confidence interval calculated using bootstrapping (n=1000) as explained in Materials and methods. In all media, CCV peaked at around the same level of expression (same fluorescence signal value), and was lower at higher expression levels. For all media, variation in signal at higher expression levels was comparable to that for a PTDH3-Citrine construct integrated at the LEU2 locus (Y2683, shown in Figure 4—figure supplement 2D).
Figure 4—figure supplement 8
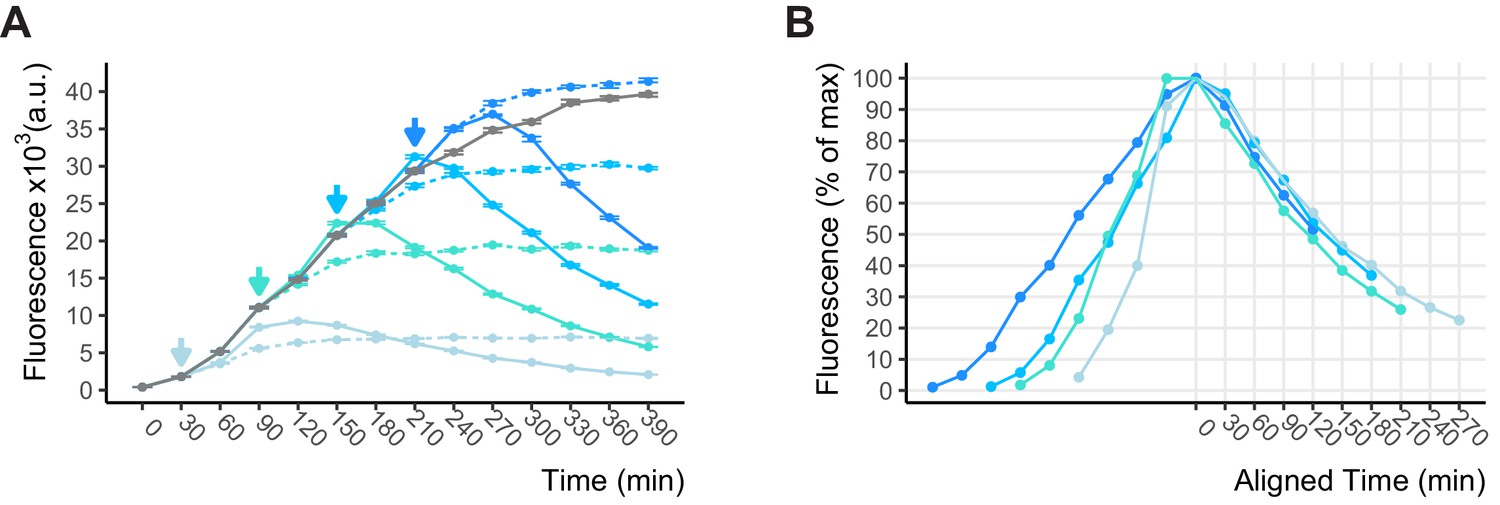
Shutoff of WTC846 expression.
(A) Shutoff upon aTc removal from an exponentially growing, recently induced culture of WTC846::citrine (Y2759). Induction of the main culture (gray) with 600 ng/mL aTc was performed at time 0 and shutoff samples were transferred to (a) medium without aTc (colored solid lines) and (b) medium without aTc that contained 70 μg/mL of translation inhibitor cycloheximide (colored dashed lines), at time points indicated by the colored arrows. Citrine fluorescence was measured with flow cytometry. Error bars indicate the 95% confidence interval as calculated by bootstrapping (see Materials and methods) (B) Shutoff samples from A were aligned such that maximum measured Citrine fluorescence corresponds to time 0. The time it takes for the measured fluorescence to drop by half is an estimate of the rate of dilution+degradation of Citrine.
-
Figure 4—figure supplement 8—source data 1
Numerical data for Figure 4—figure supplement 8.
- https://cdn.elifesciences.org/articles/69549/elife-69549-fig4-figsupp8-data1-v2.zip
Figure 4—figure supplement 9

Comparison of cell-to-cell variation between WTC846, a previously published, β-estradiol induced transcriptional control system, and expression driven by PGAL1.
Overlaid fluorescence and cell-to-cell variation curves are shown for each system (A) Dose response and cell-to-cell variation curves of the β-estradiol-induced LexA-hER-B112-control system after 24 hr of induction. (B) Dose response and cell-to-cell variation of WTC846 after 7 hr of induction. Data plotted from the experiment presented in main Figure 4. (C) Dose response and cell-to-cell variation of a strain (Y3268) where the PGAL1 promoter drives Citrine expression after 24 hr of induction. Cells were grown overnight in syntethic full media with 2% raffinose and the galactose concentrations indicated, and diluted into the same media the next day. Fluorescence was measured 8 hr after dilution. For all systems, fluorescence was measured using flow cytometry and cell-to-cell variation was calculated using our VIV measure as explained. Where present, error bars indicate 95% confidence interval calculated using bootstrapping (n=1000) as described in Materials and methods. For the β-estradiol-induced system, cell-to-cell variation is above an RSD of 0.4 for most of the dynamic range of the system. For the galactose-inducible promoter PGAL1, cell-to-cell variation is always above 0.6 upon induction. For WTC846 variation is below 0.4 at all but low levels of the input dynamic range. While all three systems show a peak in cell-to-cell variation, this peak spans most of the dynamic range for the β-estradiol induced system, and all of the dynamic range for the galactose-inducible system, whereas it is limited to very low doses for the WTC846.
-
Figure 4—figure supplement 9—source data 1
Numerical data for Figure 4—figure supplement 9.
- https://cdn.elifesciences.org/articles/69549/elife-69549-fig4-figsupp9-data1-v2.zip
Figure 5 with 7 supplements
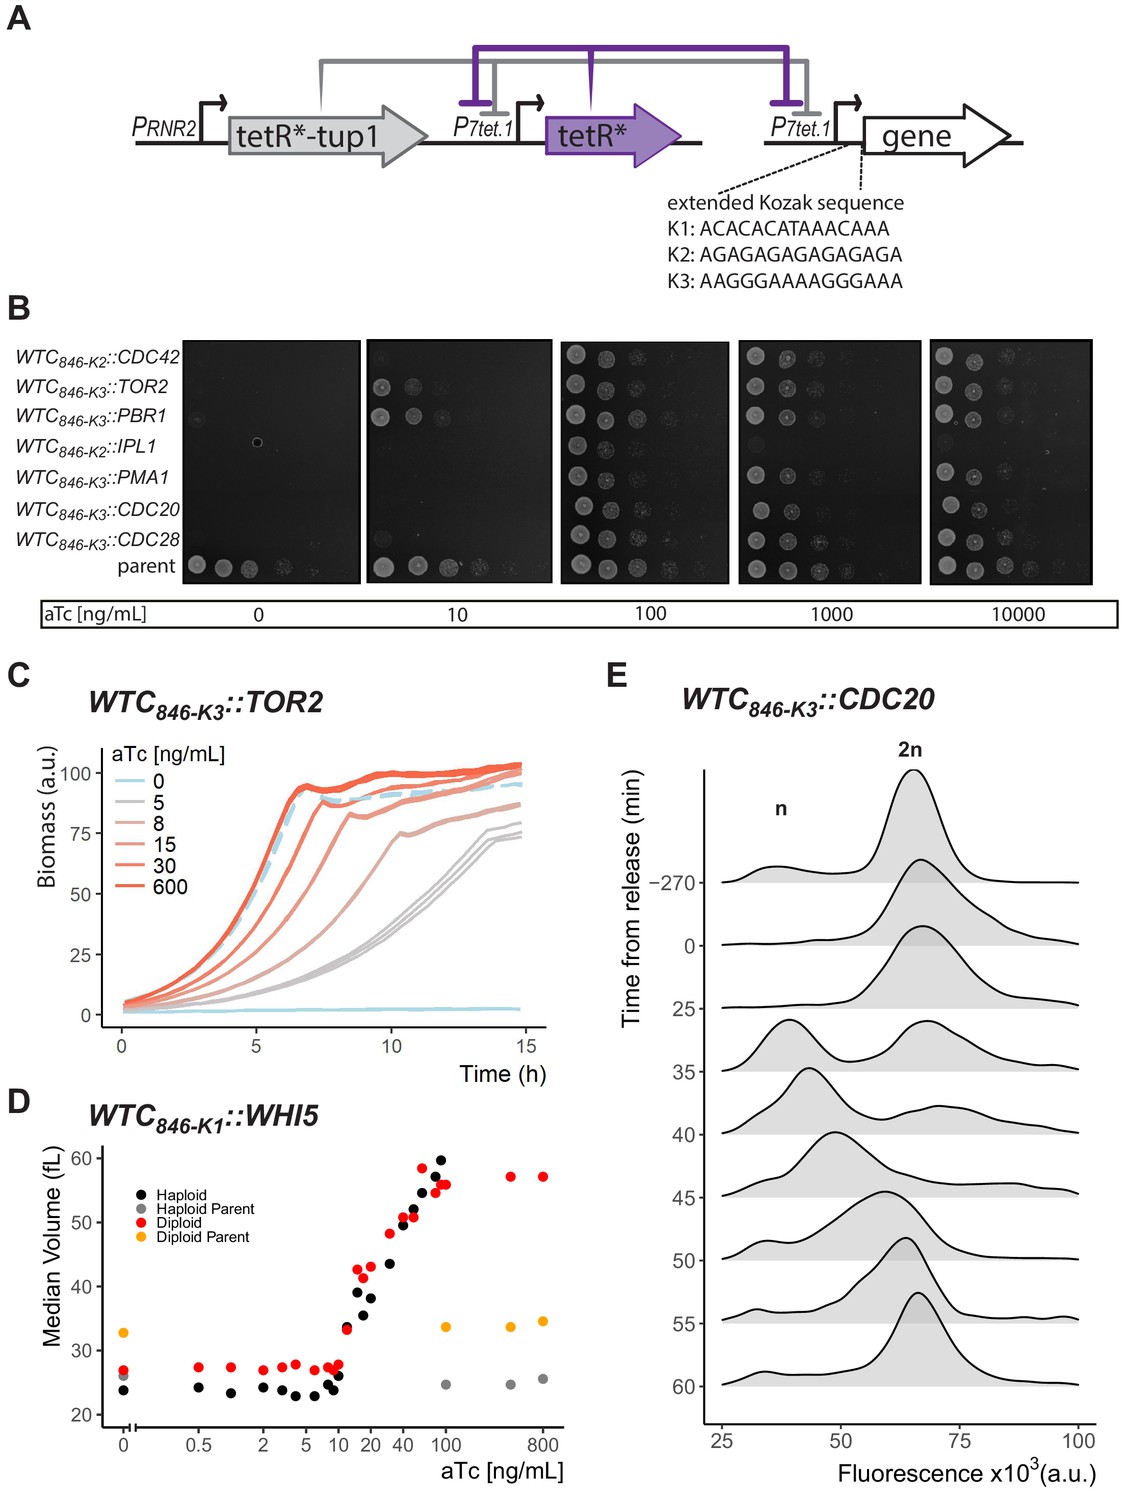
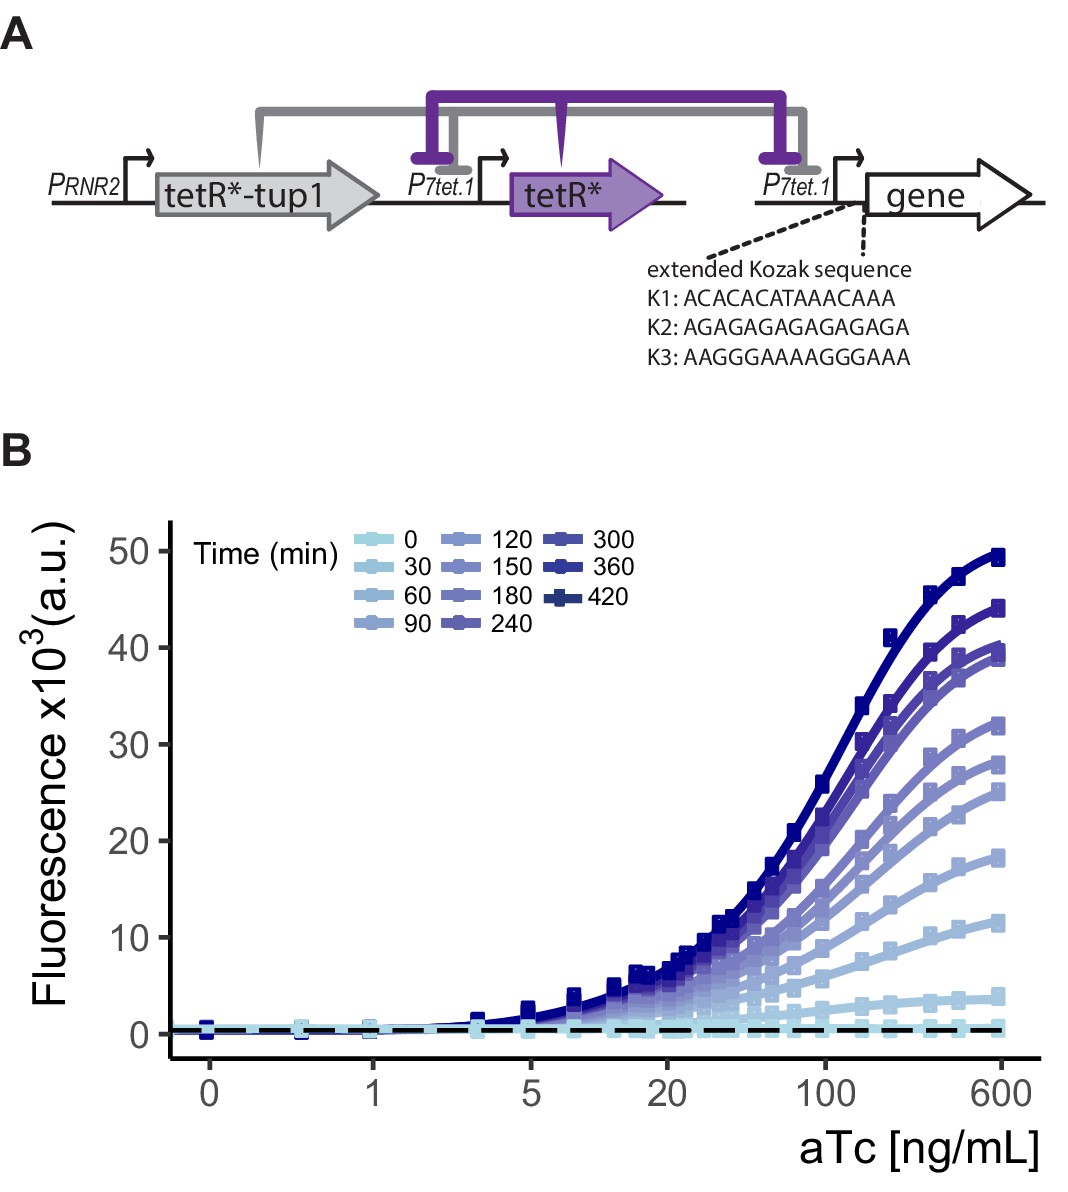
Controlled protein dosage of WTC846-driven yeast genes.
(A) The WTC846 architecture used, as in Figure 4A. Figure also shows the three extended Kozak sequences used to control translation efficiency. (B) WTC846 alleles of essential yeast genes show null and quantitative expression phenotypes. The genes whose expression is controlled by WTC846 are indicated on the left. Cells growing in liquid medium were spotted onto different YPD plates, such that the leftmost circle on each plate had 2.25x10⁶ cells and each subsequent column is a 1:10 dilution. aTc concentration in each plate is indicated below each image. Parent refers to the strain where all components of WTC846 except the P7tet.1 that directs expression of the controlled gene was present (Y2769). (C) Precise control of growth rate by adjusting Tor2 protein dosage. Growth of the WTC846-K3::TOR2 strain was measured by scattered light intensity using a growth reader. Cells were grown in liquid YPD, three replicate wells per aTc concentration were measured. Dashed line indicates the growth curve of the parent strain, where Tor2 was under endogenous control. The y-axis was normalized to a range between 0 and 100 and indicates culture density. (D) Precise control of cell volume by titrating dosage of Whi5. Haploid and Diploid refer to WTC846-K1::WHI5 alleles grown in S Ethanol with varying concentrations of aTc. Haploid and diploid parent indicates strains where Whi5 was under endogenous control. Median cell volume was measured using a Coulter Counter. (E) Batch culture cell cycle synchronization. A batch culture of WTC846-K3::CDC20 strain growing in 20 ng/mL aTc was arrested and synchronized by aTc withdrawal. Cells were released from the cell cycle block by addition of aTc at time 0. Cells were stained with Sytox and analyzed with flow cytometry. A total of 10,000 cells per time point were recorded. The plots are density distributions of the Sytox fluorescent signal of the whole population, such that the area under the curve equals 1. The peaks corresponding to one and two sets of chromosomes are labeled. These indicate the cells that are in G1 and G2/M phases of the cell cycle, respectively.
-
Figure 5—source data 1
- https://cdn.elifesciences.org/articles/69549/elife-69549-fig5-data1-v2.zip
-
Figure 5—source data 2
Numerical data for Figure 5D.
- https://cdn.elifesciences.org/articles/69549/elife-69549-fig5-data2-v2.zip
Figure 5—figure supplement 1

Regulated protein dosage from WTC846 alleles controls growth on different solid media.
Cells of MATa haploid strains bearing genes whose expression was controlled by WTC846 were spotted onto solid media. Names of the genes are given on the left, which correspond to the ‘Name’ column in Supplementary file 1 - Table S1. Spotting protocol is explained in Materials and methods. Briefly, cells were grown in liquid medium that supported growth (YPD with aTc), followed by media allowing WTC846 shutoff (YPD without aTc). Cells were grown in YPD without aTc for 6 hr to allow WTC846 to fully shut off and any residual gene products to be degraded or diluted. Cells were then spotted onto different plates, such that the leftmost spot on each plate had 2.25x10⁶ cells and each subsequent spot was a 1:10 dilution. The aTc concentration in each plate is indicated below each image. 'Parent' refers to strain Y2769, which only has the P7tet.1 directed TetR and PRNR2 directed TetR-nls-Tup1 expression from the LEU2 locus. Plates were imaged after 24 hr for SD, and 42 hr for YPE, S Glycerol and SD Proline. For all but one strain, no growth (as assayed both by increase in optical density of cells in spots and formation of single colonies) was observed without induction. That exception was the WTC846-K3::PBR1 strain, which showed slight increase in optical density of the most concentrated spot, indicating very slow growth or residual protein activity. This could be either due to slow degradation kinetics of the protein upon aTc removal, or very low, residual expression even without induction. No single colonies were observed. The fact that strains bearing WTC846 controlled essential genes did not grow without aTc confirms that in the absence of the inducer, these WTC846 alleles are operationally nulls. In all media tested, growth as assayed by increase in density of the spot and increased frequency of formation of single colonies increased with increasing aTc concentration, indicating titratability of the protein dosage in these alleles. In one strain (i.e. WTC846-K2::IPL1), decreased growth at high-protein dosage was observed as indicated by lighter spots and reduced single colony formation.
-
Figure 5—figure supplement 1—source data 1
Raw plate images for Figure 5—figure supplement 1.
- https://cdn.elifesciences.org/articles/69549/elife-69549-fig5-figsupp1-data1-v2.zip
Figure 5—figure supplement 2
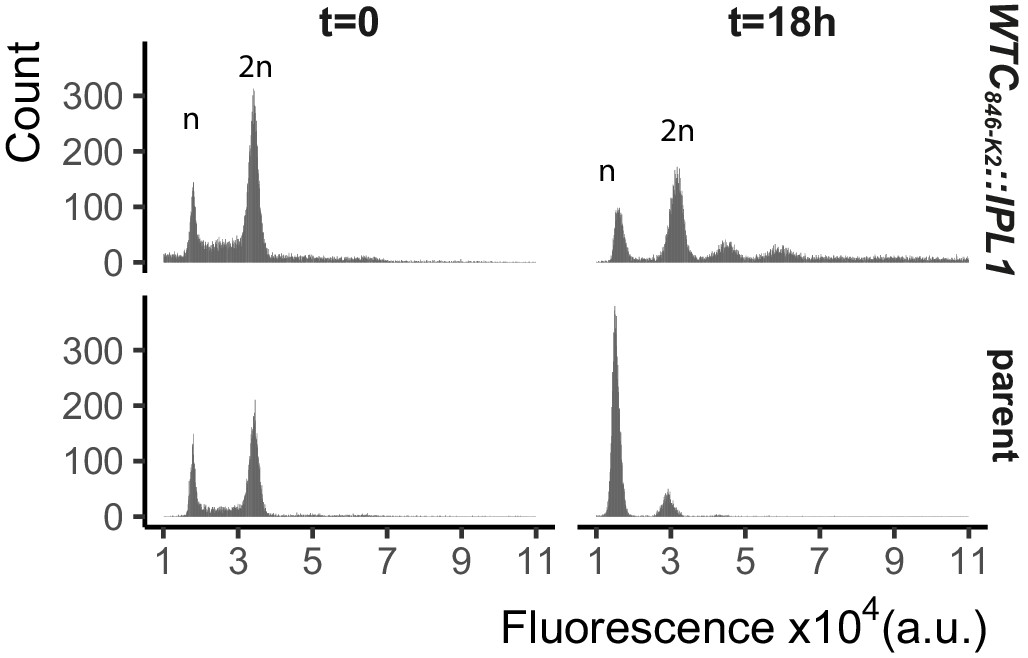
WTC846-driven overexpression of Ipl1 prolongs G2/M and produces cells with >2 n ploidy.
We grew WTC846-K2::IPL1 (Y2789) and an otherwise isogenic parent strain (Y2769), where Ipl1 was under the control of its native promoter, in YPD with 400 ng/mL aTc for 18 hr. At each time point cells were fixed with 70% ethanol, stained for DNA content with Sytox and measured using flow cytometry. We recorded 20,000 WTC846-K2::IPL1 cells and 10,000 parent cells at each time point. Plots show counts of cells for each fluorescence value. Peaks corresponding to one set and two sets of chromosomes, indicating cells in G1 and in G2/M are labeled n and 2 n. Results indicate that overexpression of Ipl1 leads to a prolonged G2/M phase and cells with aberrant chromosome numbers above 2 n.
Figure 5—figure supplement 3
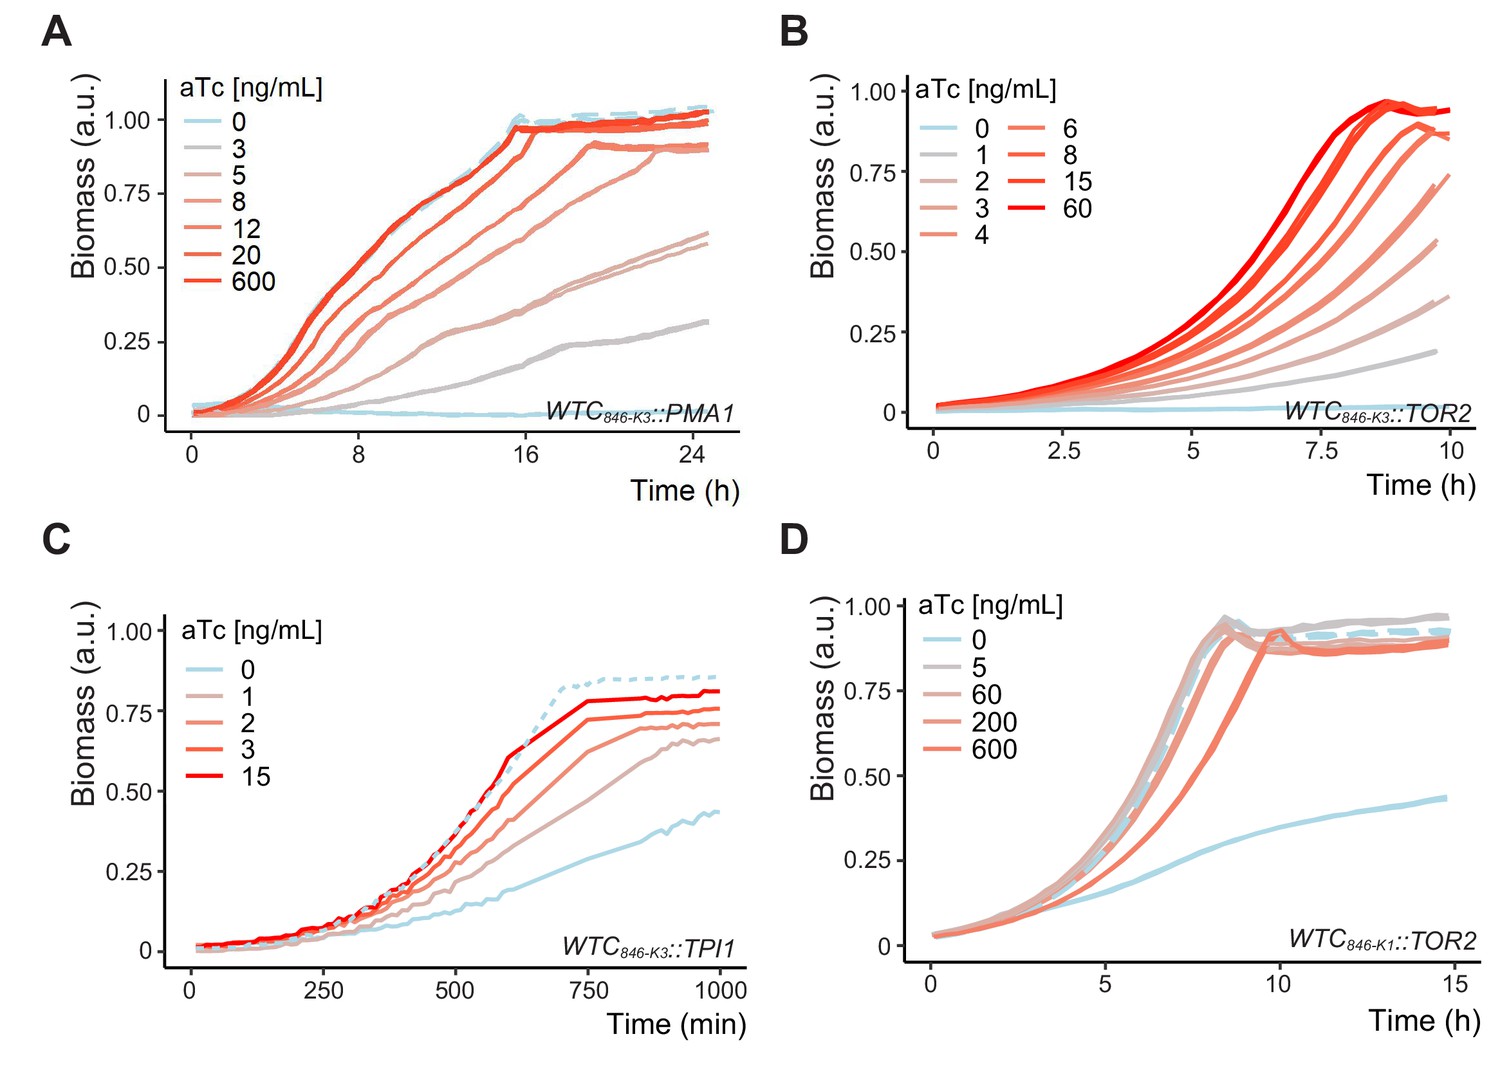
Adjustable protein dosage from WTC846 alleles of essential and metabolic genes controls growth rates in different liquid media.
Plots show growth curves of (A) Y2828/ WTC846-K3::PMA1 in SD Full, pH 4.5, (B) Y2773/WTC846-K3::TOR2 in YPD medium (in triplicate), (C) Y2849/WTC846-K3::TPI1 in YPD, and (D) Y2772/WTC846-K1::TOR2 strain in YPD (in duplicates). Solid lines indicate the WTC846 alleles, dashed lines, where present, indicate the otherwise isogenic comparison strain in which the gene of interest was under endogenous control (Y2769). Data in (A,B and D) was acquired with a Biolector device, and 1 mL total culture volume. Data in (C) was acquired with a Growth Profiler and 250 µL total culture volume as described in Materials and methods. Both devices were seeded with 50,000 cells per mL at the start of the experiment. y axis indicates the culture density measured by the device, normalized such that the highest recorded value equals 1. Growth at different aTc concentrations and different dosages of these essential (Pma1,Tor2) and non-essential metabolic (Tpi1) protein products leads to different growth rates. Comparison of panel D Y2772/WTC846-K1::TOR2 and panel B Y2773/WTC846-K3::TOR2 demonstrates that the range of adjustable protein dosages achievable by WTC846 alleles can be further enlarged by choice of Kozak sequences (translation initiation sequences), and that, in the absence of inducer, the reduced translation WTC846-K3::TOR2 allele is a null.
-
Figure 5—figure supplement 3—source data 1
Raw data for Figure 5—figure supplement 3.
- https://cdn.elifesciences.org/articles/69549/elife-69549-fig5-figsupp3-data1-v2.zip
Figure 5—figure supplement 4
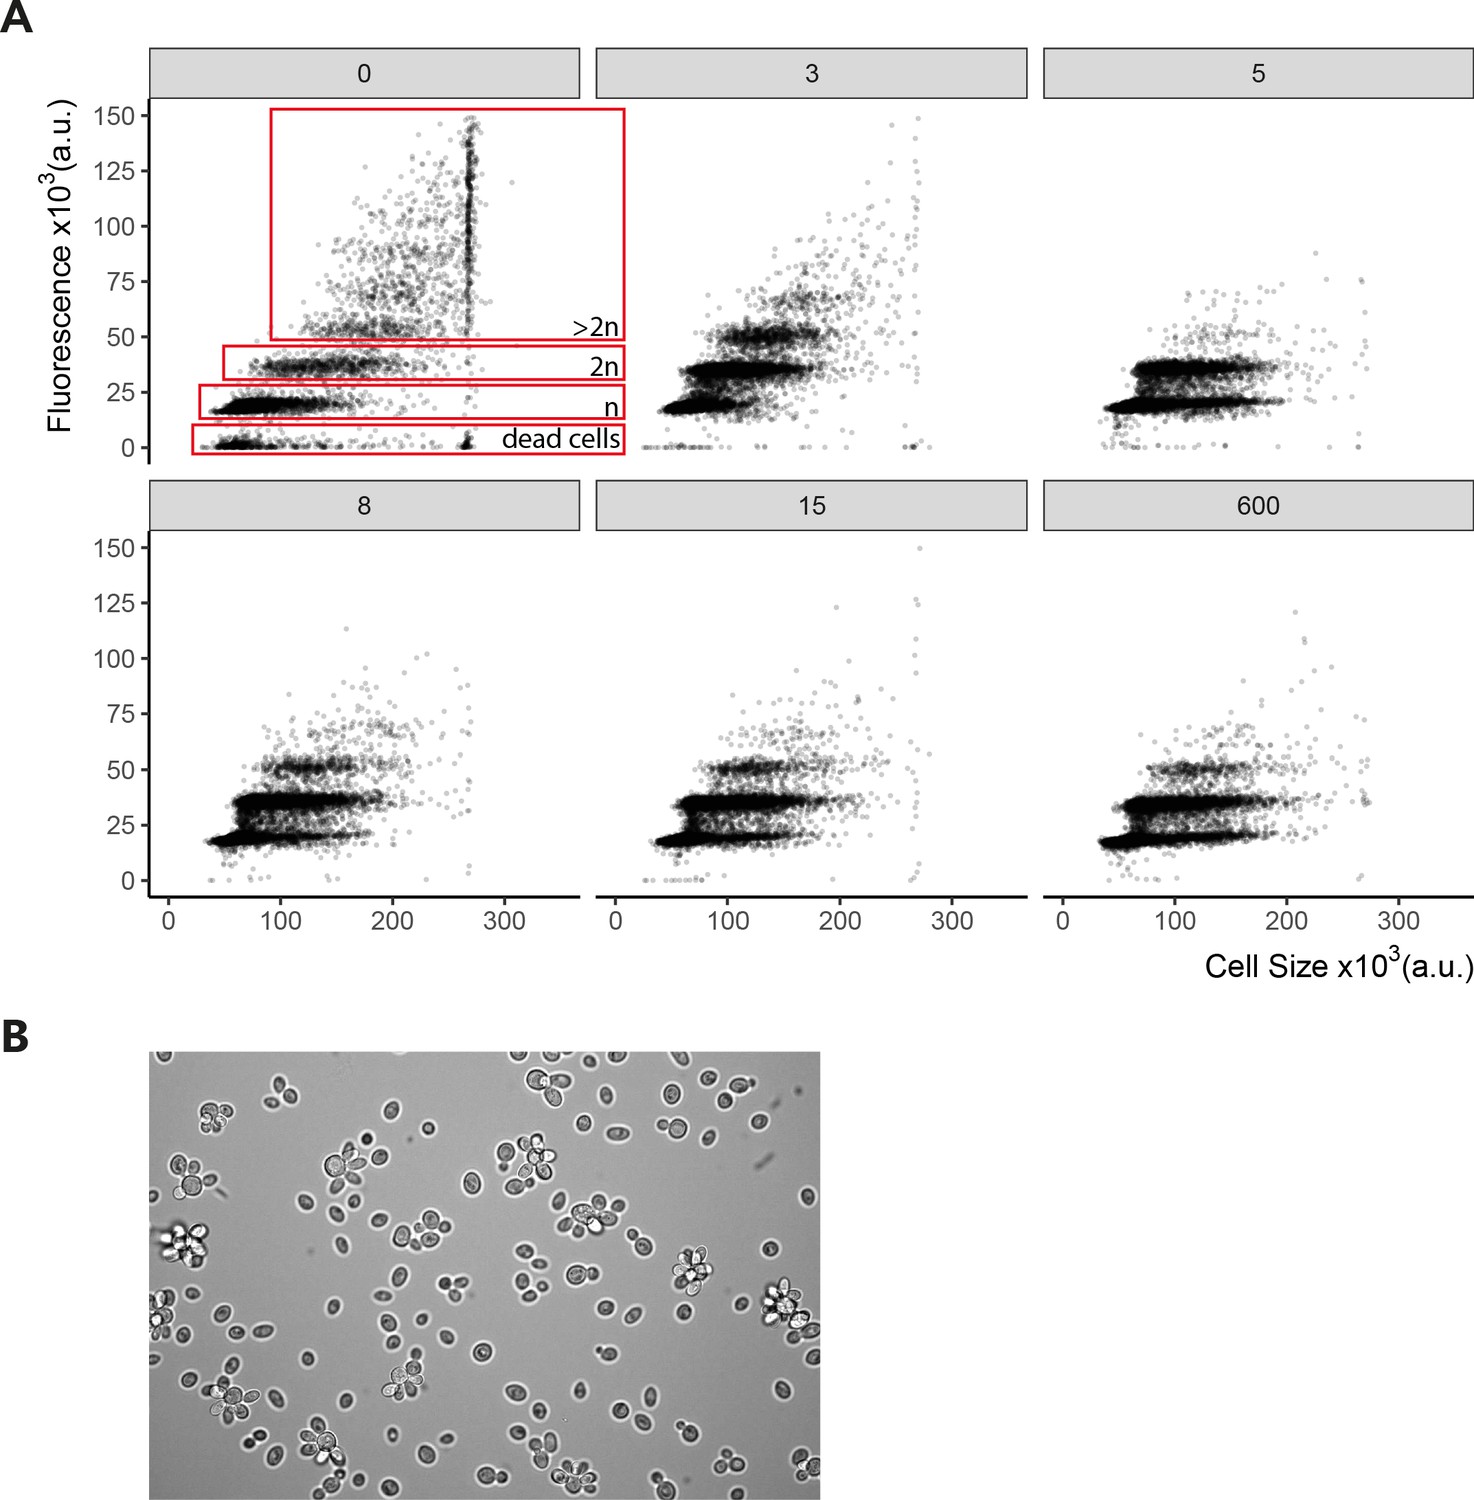
Regulated clamped hypomorphic expression of WTC846::PMA1 allele causes cell separation defect.
We grew Y2828/WTC846-K3::PMA1 in SD Full media with the aTc concentrations indicated as ng/mL in the grey boxes above the panels. We fixed the samples with 70% ethanol for Sytox staining. We used flow cytometry to analyze the cells and fluorescence was used as a proxy for DNA content. Figure shows peaks in fluorescence corresponding to one (n) and two (2n) sets of chromosomes indicating cells in G1 and G2/M. Figure also shows peaks corresponding to cells with >2 sets of chromosomes, and dead cells/debris. We calculated cell volume as the vector of SSC-H and FSC-W signals as explained in Materials and methods. Each dot corresponds to a single-cell measurement. Values above 280,000 saturated the measurement device, and this fact resulted in an apparent increase in the number of cells around this value. At no or low aTc concentrations and thus low Pma1 abundance, daughter cells fail to separate from the mother, leading to an apparent increase in cell volume and ploidy as shown in panel (B) using microscopic observation of a representative sample of WTC846-K3::PMA1 cells grown without aTc. Image was acquired using ×40 magnification.
Figure 5—figure supplement 5
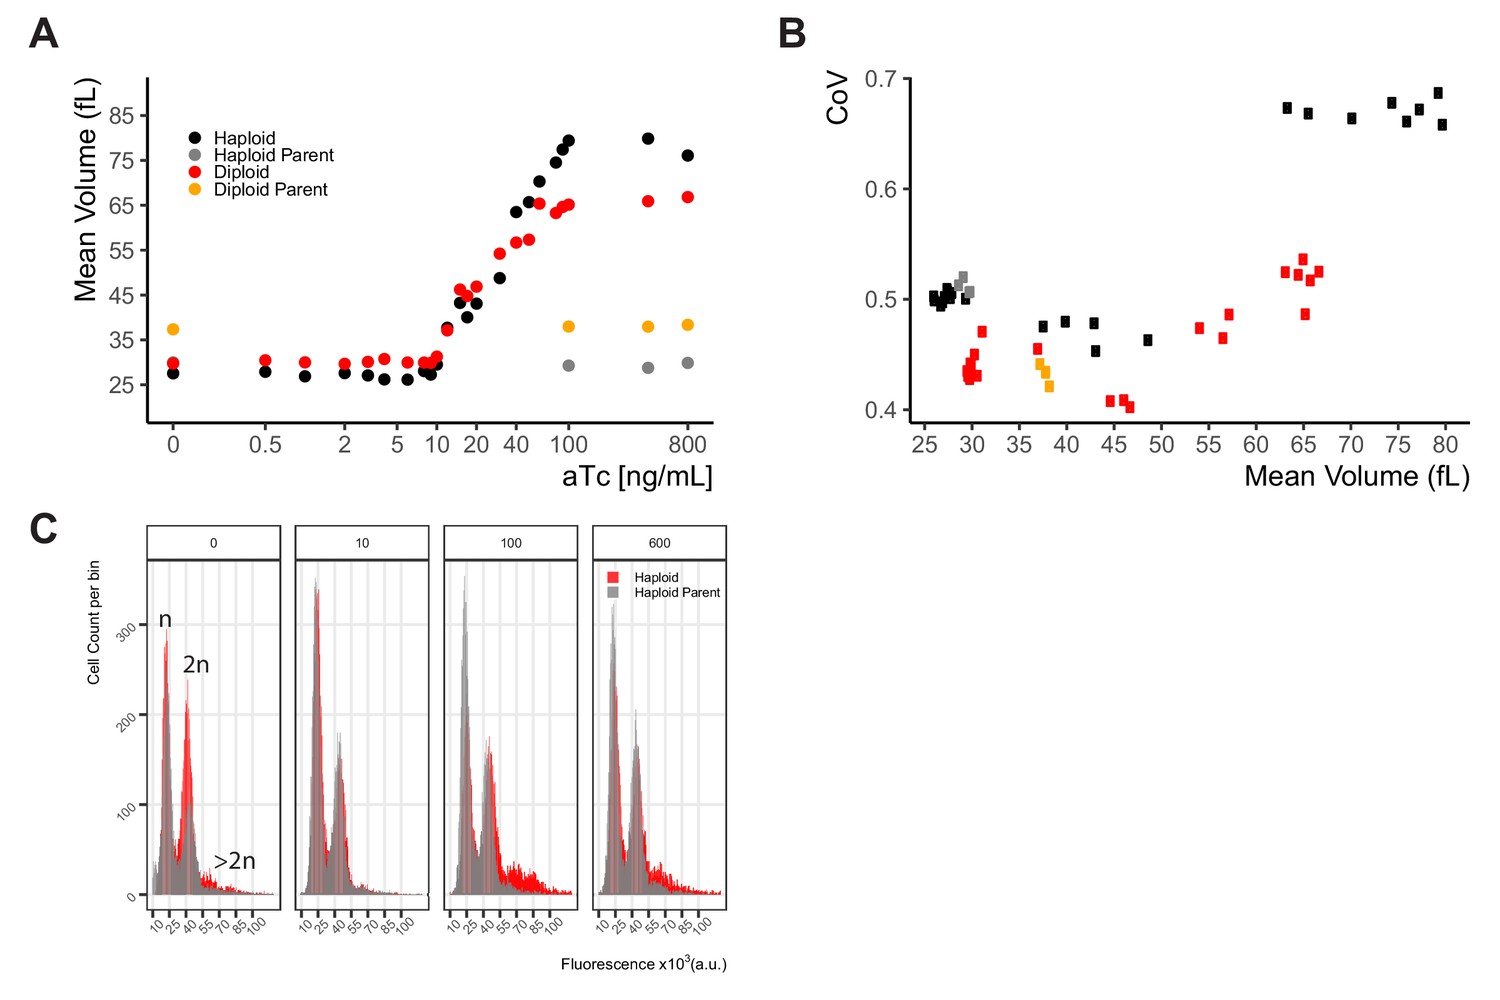
Whi5 titration leads to increased cell volume without an increase in cell-to-cell variation.
(A) Expression of Whi5 was clamped at different levels by growth of Y2791, a haploid WTC846-K1::WHI5 strain, of Y2929, a WTC846-K1::WHI5/WTC846-K1::WHI5 diploid strain, and otherwise-isogenic control strains in which Whi5 was expressed from its endogenous promoter (Y2769). Cells were grown in S Ethanol medium at different concentrations of aTc to yield different cell volumes, measured by a Coulter counter. (B) We calculated and plotted the CoV of the mean cell volume at each aTc dose as a measure of CCV. CoV of this WTC846 controlled phenotype is at or around the same level as WT variation, except when Whi5 is heavily overexpressed. (C) DNA content of the haploid WTC846-K1::WHI5 strain cells (Y2791, red) at mid-exponential phase in S Ethanol media, grown with four different aTc concentrations as marked on top of each plot. These concentrations result in cells without Whi5 (0 ng/mL aTc), with approximately endogenous levels of Whi5 (10 ng/mL), and with two different levels of overexpressed Whi5 (100 and 600 ng/mL). DNA content was quantified using Sytox staining and flow cytometry. As control, DNA content of the parent strain with endogenous Whi5 control (Y2769, gray) was quantified. Without Whi5 there was a reduction of G1 cells with onw n DNA content in the Y2791 strain, and upon overexpression of Whi5 aneuploid cells with >2n DNA content are observed.
Figure 5—figure supplement 6
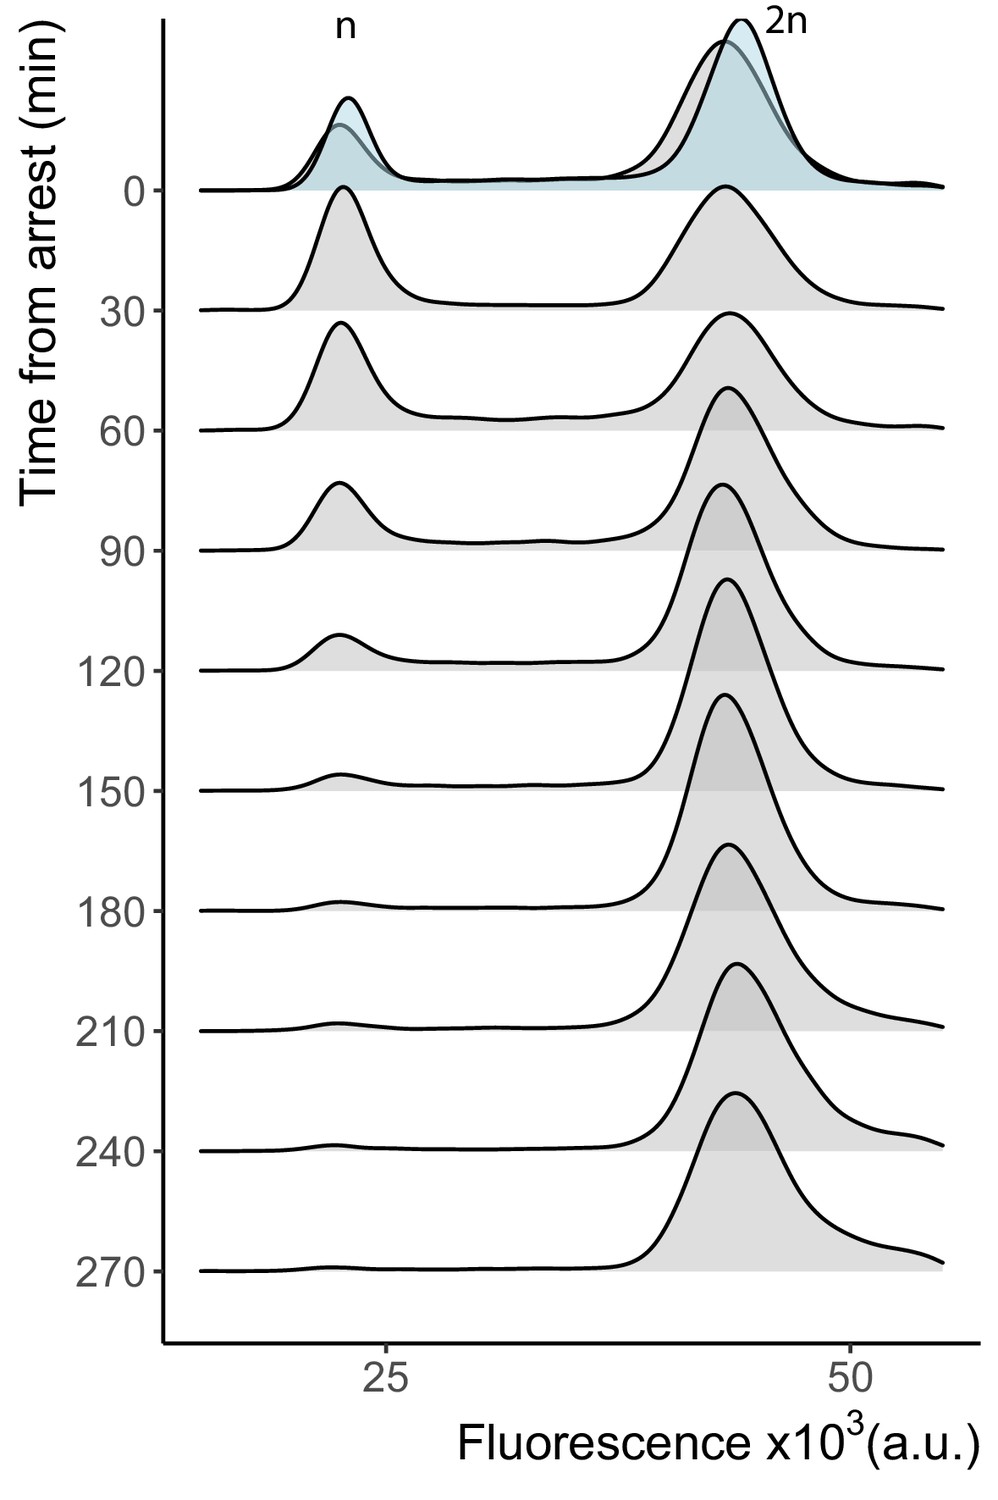
Cell cycle arrest in the WTC846-K3::CDC20 strain.
Cells growing in 3 ng/mL aTc were arrested by aTc withdrawal to compare the time to reach arrest to that in Main Figure 5E, in which cells were grown in 20 ng/mL aTc and time to arrest was around 8 hr. Samples were taken at indicated time points after aTc withdrawal. Cells were fixed in 70% ethanol, stained with Sytox and analyzed with flow cytometry. A total of 10,000 cells per time point were recorded. The plots are density distributions of the Sytox fluorescent signal of the whole population, such that the area under the curve in each line (blue for the strain with endogenous Cdc20 control (Y2769), gray for the WTC846-K3::CDC20 strain (Y2837) ) equals 1. The peaks corresponding to one and two sets of chromosomes are labeled. These indicate the cells that are in G1 and G2/M phases of the cell cycle, respectively. Arrest of this strain starts within 90 min, and complete arrest of the batch culture is reached within 3– 4 hr.
Figure 5—figure supplement 7
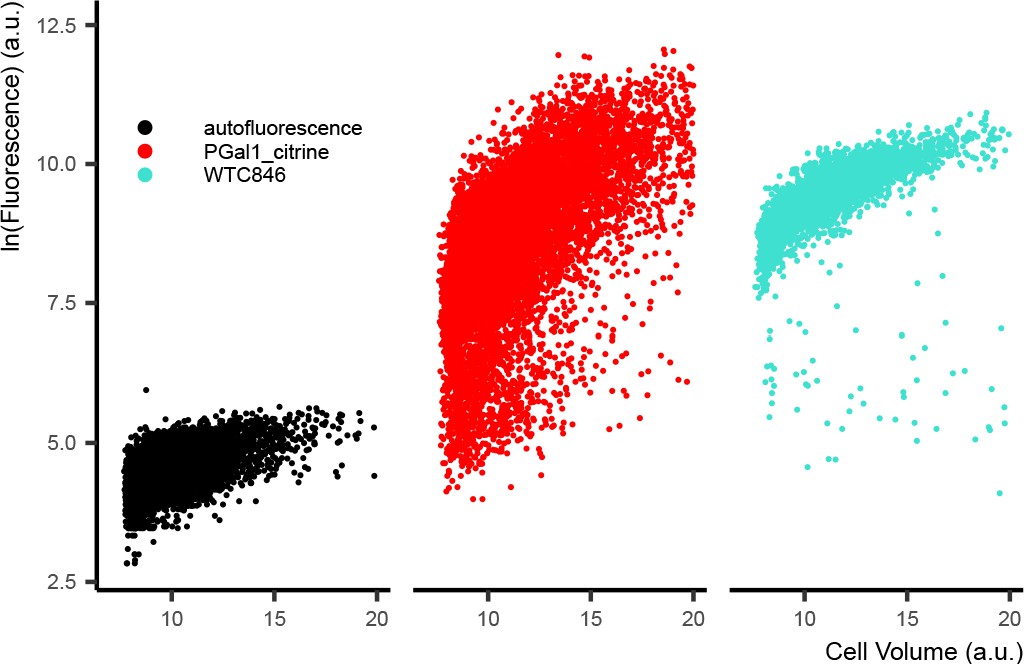
PGAL1-driven expression from a centromeric plasmid results in high cell-to-cell variation.
PGAL1 was used to drive Citrine expression in strain Y3281 from a centromeric plasmid. The strain was grown in synthetic media lacking uracil with 2% Raffinose and 2% Galactose. For comparison of expression levels, the WTC846::citrine strain (Y2759) was grown in YPD with 400 ng/mL aTc. Median Citrine fluorescence in the Y3281 strain was 2-fold lower than that of Y2759 and cell-to-cell variation in expression was approximately ∼4.5-fold higher when calculated using the VIV measure. Autofluorescence was measured in strain Y70 grown in synthetic full media with 2% Raffinose.
Appendix 1—figure 1
Optimization of tetO1 placements and endogenous transcription factor binding sites to increase maximum activity of a TetR-repressible derivative of PTDH3.
(A) Diagram of PTDH3 shows the nucleotide positions of the binding sites for the endogenous transcription factors Rap1 and Gcr1, the TATA-sequence, and the transcription start site relative to the TDH3 start codon. Gcr1 binding sites were found in reference Yagi et al., 1994 and confirmed in reference Kuroda et al., 1994. (B) Repression and maximum activity of the PTDH3 derivatives tested for optimization. Diagrams above the plots display the genetic elements of strains used (Y2565, 2575,2598,2647,2599,2648,2601,2649,2602,2650,2603,2656,70,2683). Left diagram depicts strains used to test repressed activity, right diagram maximum activity. Px denotes any tetR repressible promoter. The * in TetR indicates a SV40 Nuclear Localization Sequence. In all strains, the PTDH3 derivative promoters diagrammed on the left directed the synthesis of Citrine integrated into the LEU2 locus. Grey boxes inside the diagrams denote tetO1 TetR-binding sites. For measurement of repressed activity, otherwise-isogenic strains carried a PACT1-TetR construct integrated in the HIS3 locus. Citrine fluorescent signal was detected by flow cytometry. For the measurements, 'fold difference’ measures the median of the maximum activity signal divided by the median of the repressed activity. 'Fold over autofluorescence’ refers to median repressed activity signal divided by the median autofluorescence background signal. Maximum promoter activity is quantified as median fluorescence signal expressed as percentage of signal from otherwise-isogenic PTDH3-Citrine strain. For the plots, x axis shows intensity of fluorescence signal. Plots are density distributions of the whole population, such that the area under the curve equals one and the y axis indicates the proportion of cells at each fluorescence value. The circles inside each density plot show the median and the upper and lower bounds of the bar show the first and third quartiles of the distribution. (C) Repression and maximum activity of optimized P5tet derivatives. Diagrams and plots as in (B). These promoter variants contained additional binding sites for Rap1 and Gcr1 selected for higher activity, as well as an alternative TATA sequence as described.
-
Appendix 1—figure 1—source data 1
Numerical data for Appendix 1—figure 1.
- https://cdn.elifesciences.org/articles/69549/elife-69549-app1-fig1-data1-v2.zip
Appendix 2—figure 1
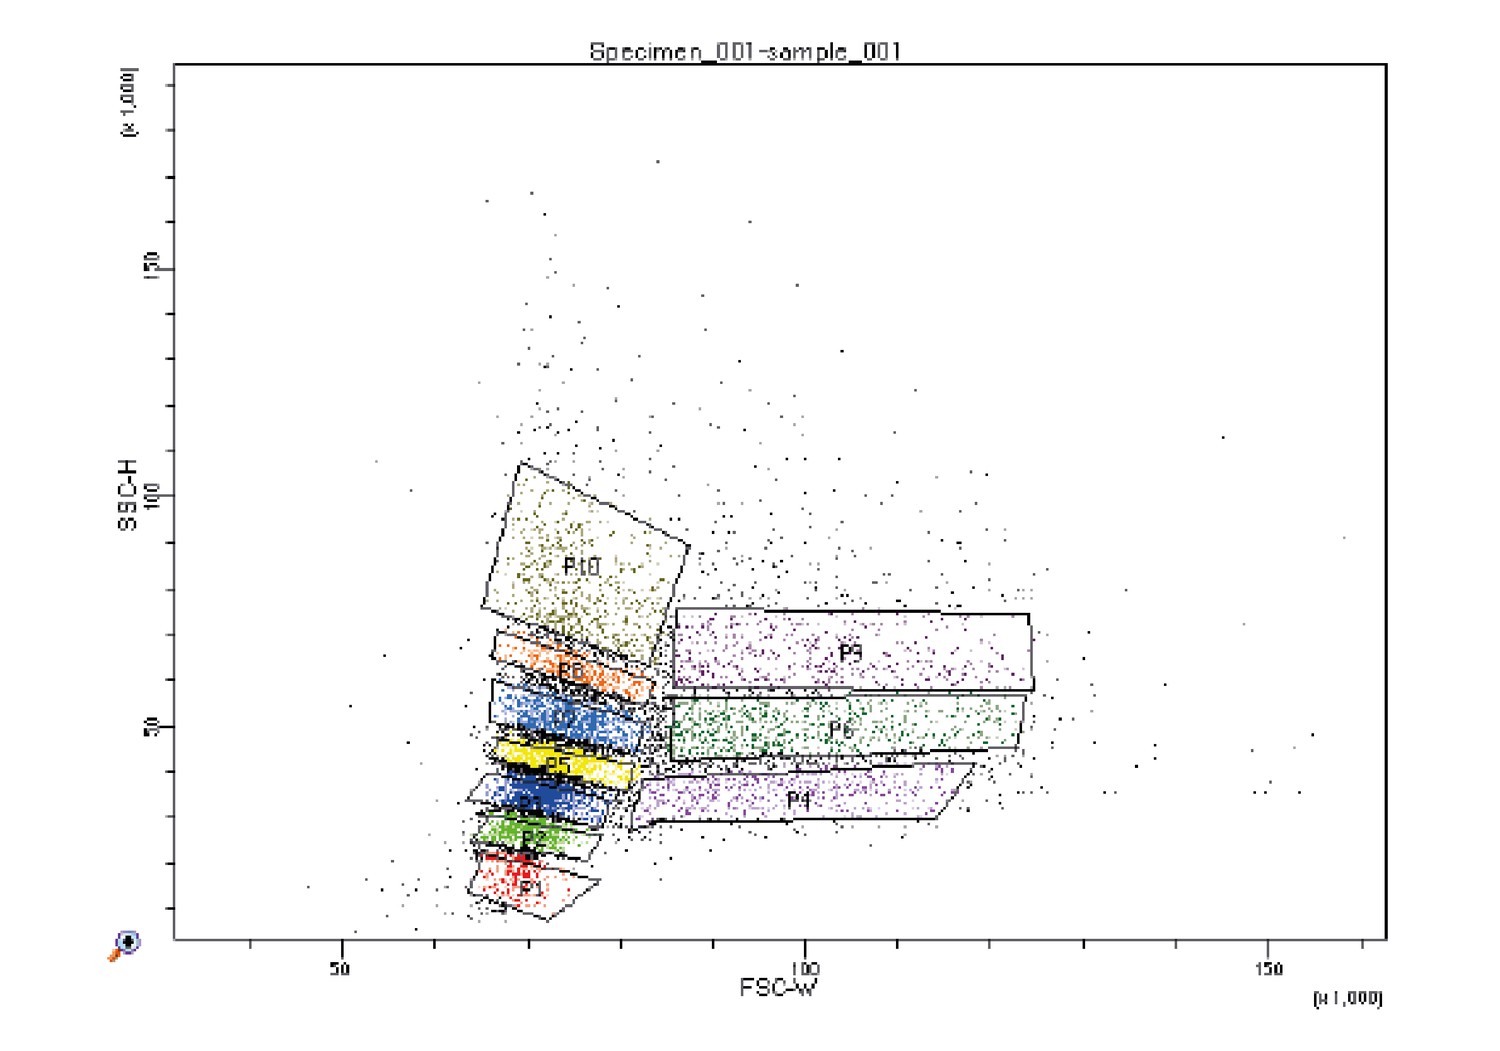
Sub-populations collected by FACS for validating the cell volume proxy measure.
Strain Y2683 was grown to exponential phase in YPD and was run through the sorter at a concentration of 2 million cells per mL. 10 separate gates were set on the FSC-W and SSC-H signals for collecting sub-populations as depicted in the figure.
Appendix 2—figure 2
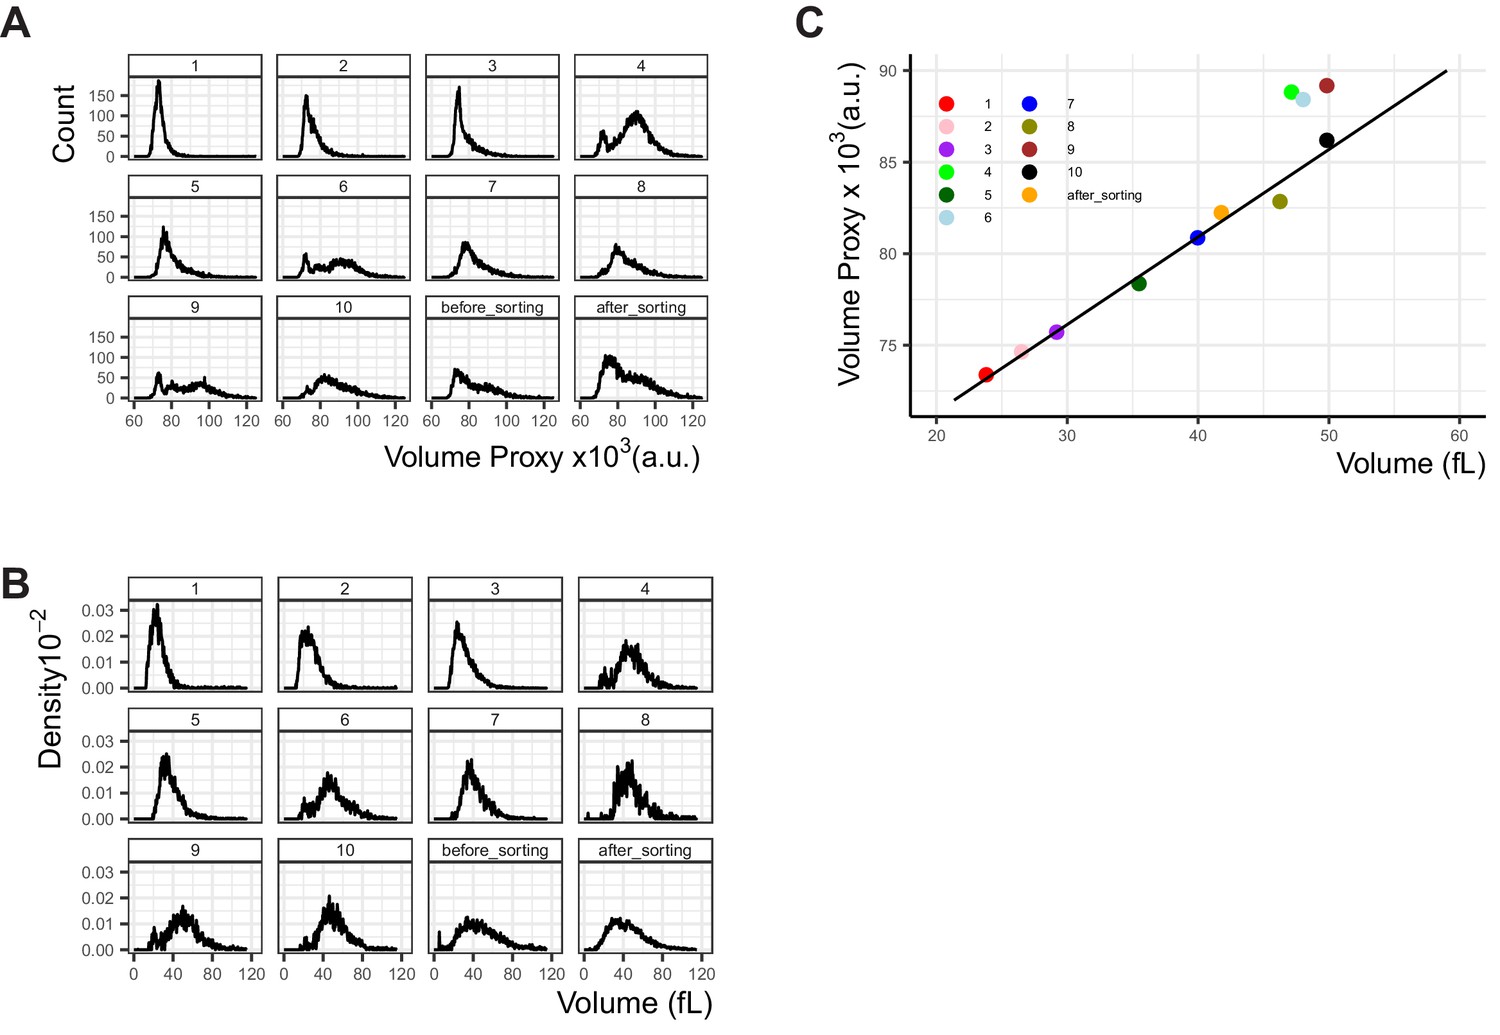
Comparison of the flow-cytometry-based cell volume proxy to cell volume measured by Coulter counter.
10 sub-populations were collected from an exponentially growing culture used as constitutive Citrine expression control in other experiments (Y2683), using FACS as described in Figure Appendix 2—figure 1. Each of the sub-populations were (A) measured in the LSRII Fortessa LSR flow cytometer used for all other experiments and the proxy for cell volume calculated and (B) measured in a Coulter counter. The sub-population numbers are indicated above the plots and correspond to the gates seen in Figure Appendix 2—figure 1. The culture was kept on ice throughout the sorting process, and the full population was measured twice, once before the sorting process began (before_sorting) and once after (after_sorting) to ensure the volume distribution in the population did not change over the course of the experiment. No significant difference was observed. (C) The median volume of each sub-population was plotted, as measured by flow cytometry (y axis) or Coulter counter (x axis). The linear fit was generated as explained in Materials and methods (R2=0.98, p=7.37x10⁻⁷), without taking into account gates 4, 6, and 9 where the distribution is bimodal and the median is not a good descriptor of the population. (A) displays cell counts per volume proxy, and (B) displays density plots where the area under the curve is 1.
-
Appendix 2—figure 2—source data 1
Numerical data for Appendix 2—figure 2C.
- https://cdn.elifesciences.org/articles/69549/elife-69549-app2-fig2-data1-v2.zip
Appendix 3—figure 1

Effect of increased nuclear concentration and size of TetR on repression.
The top diagram indicates the genetic elements of the SR architecture used to test the ability of various TetR derivatives to abolish basal activity of P7tet.1. Diagrams to the left of the plots show the different repressors used. Each * indicates one SV40 Nuclear Localization Sequence. GST refers to Glutathione S-transferase, and MBP to Maltose Binding Protein, both of E. coli. Citrine fluorescence from P7tet.1 repressed by the repressors indicated was measured using flow cytometry (Y2657,2681,2664,2665,2666,2667,70). Plots are density distributions of the whole population, such that the area under the curve equals one and the y axis indicates the proportion of cells at each fluorescence value. The circles inside each density plot show the median and the upper and lower bounds of the bar correspond to the first and third quartiles of the distribution. Numbers to the left of the plot indicate fold expression over autofluorescence, that is, the median of the Citrine fluorescence detected divided by the median of the autofluorescence signal. Although increased nuclear concentration and size of TetR increase repression efficiency, these strategies are not enough to fully abolish basal expression from P7tet.1.
-
Appendix 3—figure 1—source data 1
Numerical data for Appendix 3—figure 1.
- https://cdn.elifesciences.org/articles/69549/elife-69549-app3-fig1-data1-v2.zip
Appendix 4—figure 1
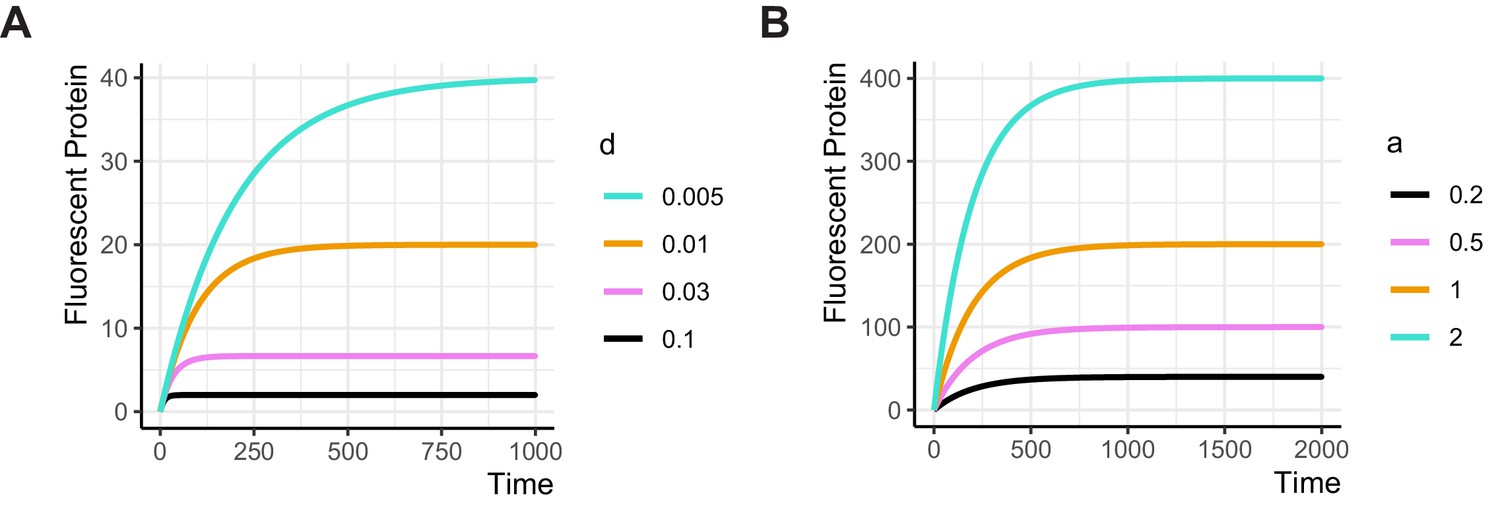
Simulations showing the relationship between production and degradation rates and time to steady state.
The ODE model presented in Appendix 4 was simulated with (A) constant production rate a = 0.2, and a varying degradation rate d, or (B) with constant degradation rate d = 0.005 and a varying production rate. Both parameters affect the maximum level of Protein produced, but only the degradation rate determines the time required to reach the steady state expression. The lower the degradation rate (i.e. the more stable the protein is), the longer it takes to reach steady state.
Appendix 5—figure 1
The configuration of and an example of gene expression control by WTC846.
(A) Genetic elements of the WTC846 controller. On the integrative plasmid, TetR is driven by the P7tet.1, TetR-nls-Tup1 is driven by the RNR2 promoter. The promoter of the gene of interest is replaced with P7tet.1 in the genome. (B) WTC846 controlled Citrine expression. Flow cytometry measurements from a strain where WTC846 regulates expression of Citrine. aTc was added to exponentially growing cells, and samples were taken every 30 min for flow cytometry analysis. Circles represent the median of the fluorescence signal, lines were fitted. The dashed line indicates autofluorescence control, that is, the parent strain without any Citrine integrated.
Appendix 5—figure 2
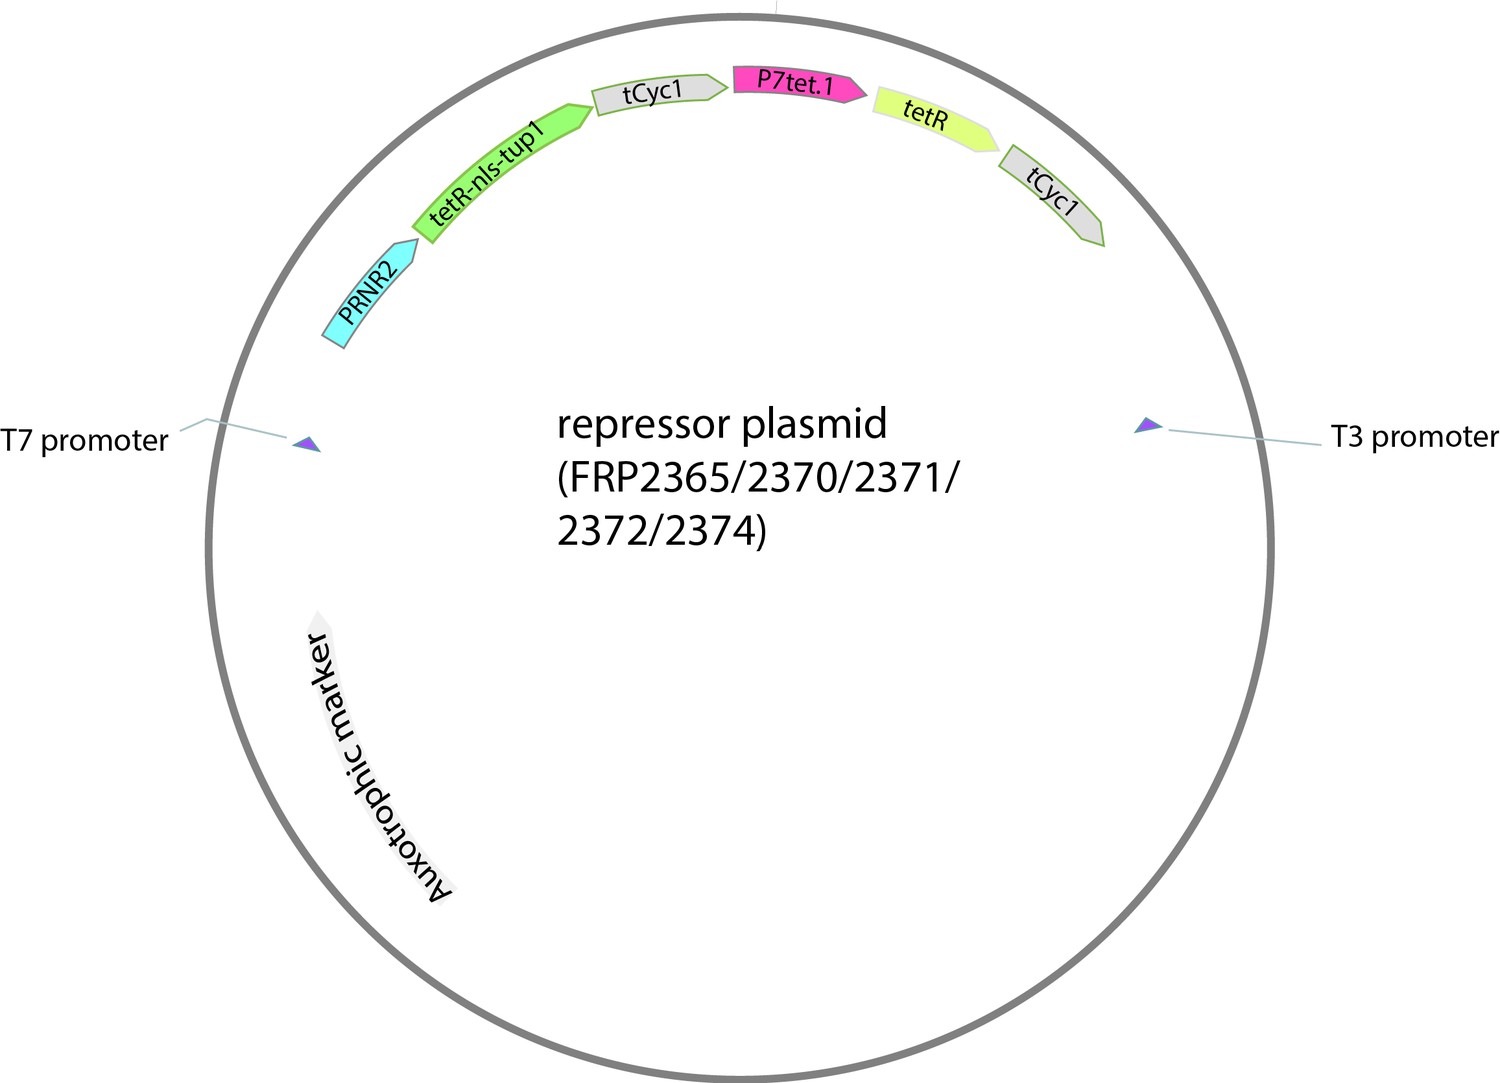
Map of the repressor plasmid.
Auxotrophic marker is different depending on the plasmid backbone.
Appendix 5—figure 3
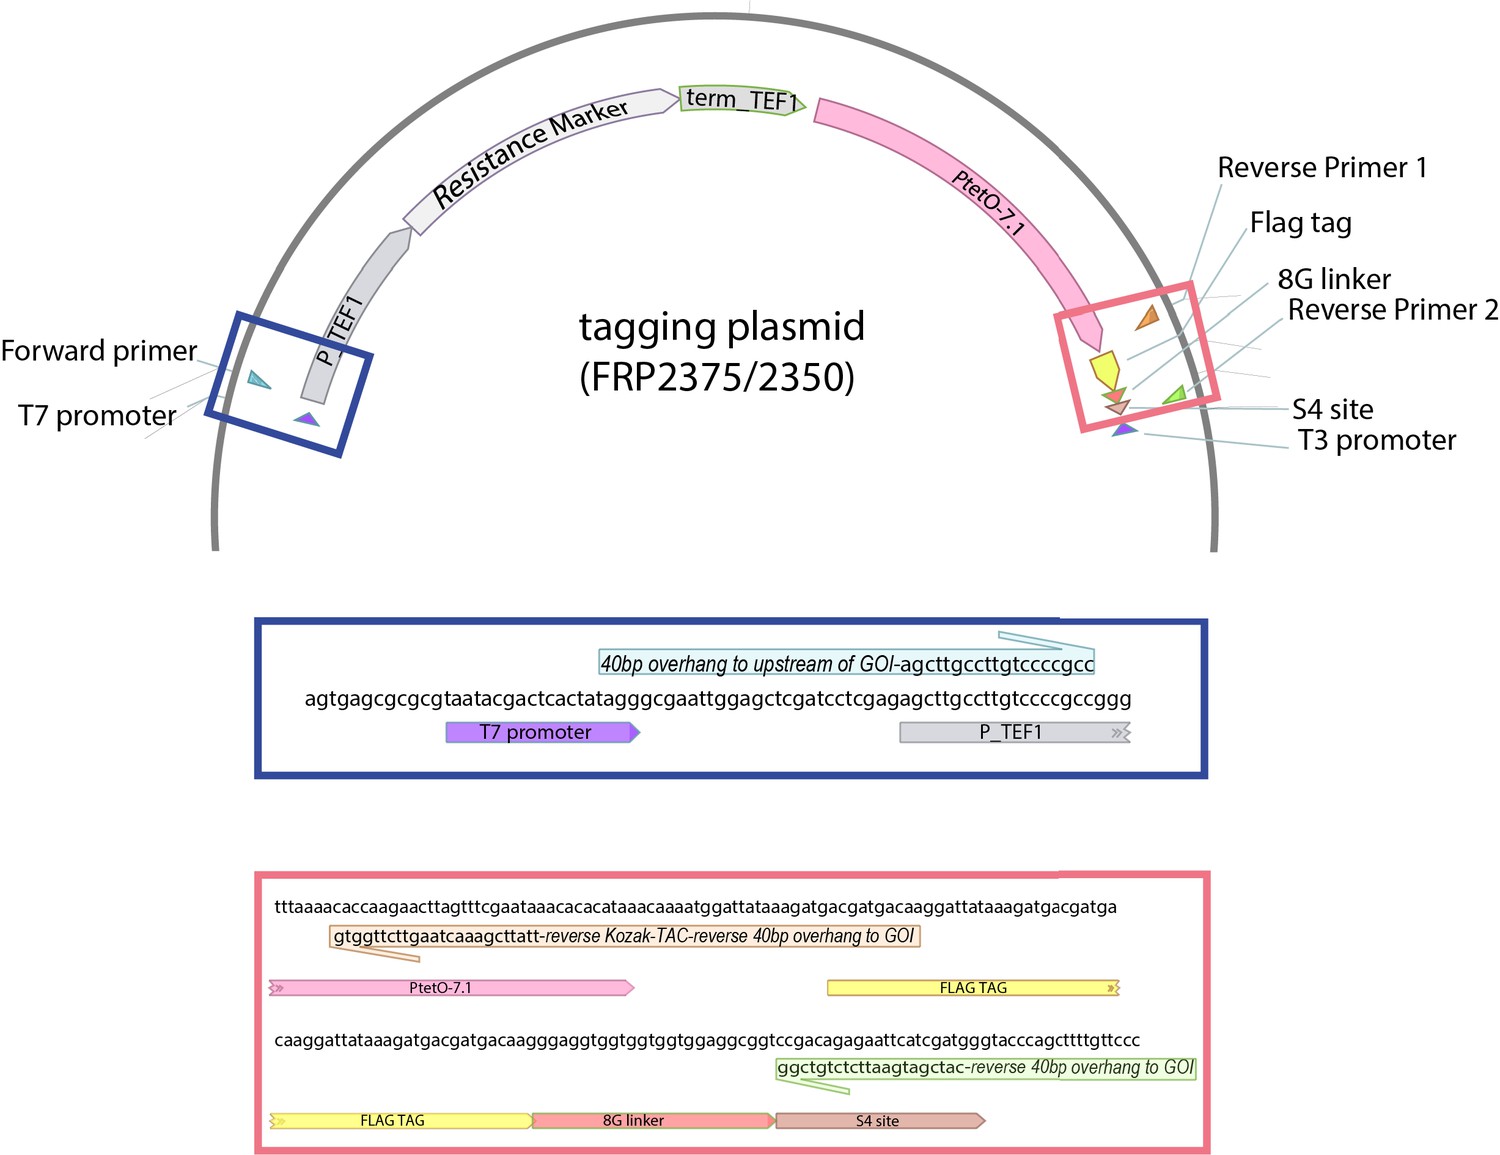
Map of the tagging plasmid.
Resistance marker is NAT or HygR depending on the plasmid number. The colored boxes zoom in to the marked regions to demonstrate how the primers anneal to the plasmid.
Tables
Table 1
Main strains used in this work and their relevant genotype.
A detailed table including all strains used in the figure supplements can be found in Supplementary file 1.
| Y | Name | Relevant genotype |
|---|---|---|
| 70 | autofluorescence | BY4743 derivative, haploid, MATa his3Δ1 leu2Δ0 met15Δ0 ura3Δ0 lys2Δ0 |
| 2683 | PTDH3-const | leu2Δ::PTDH3_citrine-LEU2 |
| 2551 | P2tet-const | leu2Δ::P2tet_citrine-LEU2 |
| 2564 | P3tet-const | leu2Δ::P3tet_citrine-LEU2 |
| 2566 | P5tet-const | leu2Δ::P5tet_citrine-LEU2 |
| 2562 | P2tet-SR | leu2Δ::P2tet_citrine-LEU2 his3Δ::PACT1_tetR-NLS-HIS3 |
| 2573 | P3tet-SR | leu2Δ::P3tet_citrine-LEU2 his3Δ::PACT1_tetR-NLS-HIS3 |
| 2577 | P5tet-SR | leu2Δ::P5tet_citrine-LEU2 his3Δ::PACT1_tetR-NLS-HIS3 |
| 2659 | P5tet.1-const | leu2Δ::P5tet.1_citrine-LEU2 |
| 2656 | P5tet.1-SR | leu2Δ::P5tet.1_citrine-LEU2 his3Δ::PACT1_tetR-NLS-HIS3 |
| 2661 | P7tet.1-const | leu2Δ::P7tet.1_citrine-LEU2 |
| 2663 | P7tet.1-SR | leu2Δ::P7tet.1_citrine-LEU2 his3Δ::PACT1_tetR-NLS-HIS3 |
| 2674 | P7tet.1-AR | leu2Δ::P7tet.1_citrine-LEU2 met15Δ::P7tet.1_tetR-NLS-MET15 |
| 2741 | P7tet.1-cAR | leu2Δ::P7tet.1_citrine-LEU2 met15Δ::P7tet.1_tetR-NLS-MET15 his3Δ::PACT1_tetR-NLS-HIS3 |
| 2673 | P7tet.1-cAR(PACT1-TUP1) | leu2Δ::P7tet.1_citrine-LEU2 his3Δ::PACT1_tetR-NLS-tup1-HIS3 met15Δ::P7tet.1_tetR-NLS-MET15 |
| 2684 | P7tet.1-cAR(PVPH1-TUP1) | leu2Δ::P7tet.1_citrine-LEU2 his3Δ::PVPH1_tetR-NLS-tup1-HIS3 met15Δ::P7tet.1_tetR-NLS-MET15 |
| 2749 | P7tet.1-cAR(PRNR2-TUP1) | leu2Δ::P7tet.1_citrine-LEU2 his3Δ::PRNR2_tetR-NLS-tup1-HIS3 met15Δ::P7tet.1_tetR-NLS-MET15 |
| 2715 | P7tet.1-cAR(P_PREV1-TUP1) | leu2Δ::P7tet.1_citrine-LEU2 his3Δ::P_PREV1_tetR-NLS-tup1-HIS3 met15Δ::P7tet.1_tetR-NLS-MET15 |
| 2669 | P7tet.1-SR(PACT1-TUP1) | leu2Δ::P7tet.1_citrine-LEU2 his3Δ::PACT1_tetR-NLS-tup1-HIS3 |
| 2676 | P7tet.1-SR(PVPH1-TUP1) | leu2Δ::P7tet.1_citrine-LEU2 his3Δ::PVPH1_tetR-NLS-tup1-HIS3 |
| 2717 | P7tet.1-SR(PRNR2-TUP1) | leu2Δ::P7tet.1_citrine-LEU2 his3Δ::PRNR2_tetR-NLS-tup1-HIS3 |
| 2759 | WTC846::citrine | leu2Δ::P7tet.1_citrine-LEU2 ura3Δ::PRNR2_tetR-NLS-tup1_P7tet.1_tetR-NLS-URA3 |
| 2761 | WTC846:: | ura3Δ::PRNR2_tetR-NLS-tup1_P7tet.1_tetR-NLS-URA3 |
| 2769 | parent | whi5Δ::WHI5-mKOkappa-HIS3, myo1Δ::MYO1-mKate(3x)-KanMX, leu2Δ::PRNR2_tetR-NLS-tup1_P7tet.1_tetR-NLS-LEU2 |
| 2772 | WTC846-K1::TOR2 | whi5Δ::WHI5-mKOkappa-HIS3, myo1Δ::MYO1-mKate(3x)-KanMX, leu2Δ::PRNR2_tetR-NLS-tup1_P7tet.1_tetR-NLS-LEU2 P_TOR2::P7tet.1-K1-HygMX |
| 2775 | WTC846-K2::CDC28 | whi5Δ::WHI5-mKOkappa-HIS3, myo1Δ::MYO1-mKate(3x)-KanMX, leu2Δ::PRNR2_tetR-NLS-tup1_P7tet.1_tetR-NLS-LEU2 P_CDC28::P7tet.1-K2-NatMX |
| 2837 | WTC846-K3::CDC20 | whi5Δ::WHI5-mKOkappa-HIS3, myo1Δ::MYO1-mKate(3x)-KanMX, leu2Δ::PRNR2_tetR-NLS-tup1_P7tet.1_tetR-NLS-LEU2 P_CDC20::P7tet.1-K3-NatMX |
| 2788 | WTC846-K2::CDC42 | whi5Δ::WHI5-mKOkappa-HIS3, myo1Δ::MYO1-mKate(3x)-KanMX, leu2Δ::PRNR2_tetR-NLS-tup1_P7tet.1_tetR-NLS-LEU2 P_CDC42::P7tet.1-K2-NatMX |
| 2789 | WTC846-K2::IPL1 | whi5Δ::WHI5-mKOkappa-HIS3, myo1Δ::MYO1-mKate(3x)-KanMX, leu2Δ::PRNR2_tetR-NLS-tup1_P7tet.1_tetR-NLS-LEU2 P_IPL1::P7tet.1-K2-NatMX |
| 2828 | WTC846-K3::PMA1 | whi5Δ::WHI5-mKOkappa-HIS3, myo1Δ::MYO1-mKate(3x)-KanMX, leu2Δ::PRNR2_tetR-NLS-tup1_P7tet.1_tetR-NLS-LEU2 P_PMA1::P7tet.1-K3-NatMX |
| 2773 | WTC846-K3::TOR2 | whi5Δ::WHI5-mKOkappa-HIS3, myo1Δ::MYO1-mKate(3x)-KanMX, leu2Δ::PRNR2_tetR-NLS-tup1_P7tet.1_tetR-NLS-LEU2 P_TOR2::P7tet.1-K3-HygMX |
| 2827 | WTC846-K3::CDC28 | whi5Δ::WHI5-mKOkappa-HIS3, myo1Δ::MYO1-mKate(3x)-KanMX, leu2Δ::PRNR2_tetR-NLS-tup1_P7tet.1_tetR-NLS-LEU2 P_CDC28::P7tet.1-K3-NatMX |
| 2830 | WTC846-K3::PBR1 | whi5Δ::WHI5-mKOkappa-HIS3,myo1Δ::MYO1-mKate(3x)-KanMX, leu2Δ::PRNR2_tetR-NLS-tup1_P7tet.1_tetR-NLS-LEU2 P_PBR1::P7tet.1-K3-NatMX |
| 2849 | WTC846-K3::TPI1 | leu2Δ::PRNR2_tetR-NLS-tup1_P7tet.1_tetR-NLS-LEU2 P_TPI1::P7tet.1-K3-NatMX |
| 2791 | WTC846-K1::WHI5 | whi5Δ::WHI5-mKOkappa-HIS3, myo1Δ::MYO1-mKate(3x)-KanMX, leu2Δ::PRNR2_tetR-NLS-tup1_P7tet.1_tetR-NLS-LEU2 P_WHI5::P7tet.1-K1-NatMX |
| 2929 | WTC846-K1::WHI5(diploid) | BY4743, whi5Δ::WHI5-mKokappa-HIS3/WHI5 myo1Δ::MYO1-mKate(3x)-KanMX/MYO1 leu2Δ::PRNR2_tetR-NLS-tup1_P7tet.1_tetR-NLS-LEU2/leu2Δ0 ura3Δ::PRNR2_tetR-NLS-tup1_P7tet.1_tetR-NLS-URA3/ura3Δ0 P_WHI5::P7tet.1-K1-HygMX/P_WHI5::P7tet.1-K1-NatMX |
Appendix 5—table 1
Repressor plasmids.
| P number | Marker | Backbone pRG number from Gnügge et al., 2016 |
|---|---|---|
| P2365 | URA3 | pRG206 |
| P2370 | LEU2MX | pRG205MX |
| P2371 | HIS3MX | pRG203MX |
| P2372 | LYS2 | pRG207 |
| P2374 | MET15 | pRG201 |
Additional files
-
Supplementary file 1
Table S1 Strains used in this study.
Kozak sequence is the last 15 bp before the start codon. Table S2 Plasmids used in this study. * indicates plasmids available through Addgene. These plasmids are sufficient to allow construction of WTC846 strains carrying the cAR architecture without any further construction. They can also be modified to construct strains with genes controlled by the Simple Repression (SR) and Autorepression (AR) architectures presented in this manuscript. Construction of SR strains would require deletion of the negative feedback-controlled TetR from (P2365/2370/2371/2372/2374), and construction of AR strains would require deletion of the constitutively expressed TetR-Tup1 from the same plasmids. Table S3 Oligos used in this study to create strains where WTC846 controls endogenous gene expression. See Appendix 5 for the protocol used for endogenous gene promoter replacement through homology directed repair. These oligos were used in conjunction with P2375 (NatMX) or P2350 (HygMX) to create the linear PCR fragment necessary for promoter replacement, or as colony PCR oligos to confirm correct promoter replacement. Table S4 Sequences used in this study. (*) indicates a shortened t_CYC1 used to avoid homology in plasmids where there are more than one t_CYC1 sequences. (**) indicates the linker sequence used between TetR-nls and the fusion partners MBP and Tup1. (***) indicates the linker sequence used between TetR-nls and the fusion partner GST. Table S5 Parameters used to fit 5-parameter sigmoid curves to experimental data. See Materials and methods for the 5-parameter log logistic forumula.
- https://cdn.elifesciences.org/articles/69549/elife-69549-supp1-v2.tex
-
Transparent reporting form
- https://cdn.elifesciences.org/articles/69549/elife-69549-transrepform-v2.docx
-
Appendix 1—figure 1—source data 1
Numerical data for Appendix 1—figure 1.
- https://cdn.elifesciences.org/articles/69549/elife-69549-app1-fig1-data1-v2.zip
-
Appendix 2—figure 2—source data 1
Numerical data for Appendix 2—figure 2C.
- https://cdn.elifesciences.org/articles/69549/elife-69549-app2-fig2-data1-v2.zip
-
Appendix 3—figure 1—source data 1
Numerical data for Appendix 3—figure 1.
- https://cdn.elifesciences.org/articles/69549/elife-69549-app3-fig1-data1-v2.zip
Download links
A two-part list of links to download the article, or parts of the article, in various formats.
Downloads (link to download the article as PDF)
Open citations (links to open the citations from this article in various online reference manager services)
Cite this article (links to download the citations from this article in formats compatible with various reference manager tools)
A precisely adjustable, variation-suppressed eukaryotic transcriptional controller to enable genetic discovery
eLife 10:e69549.
https://doi.org/10.7554/eLife.69549


