Innate immune activation by checkpoint inhibition in human patient-derived lung cancer tissues
- Center for Environmental and Systems Biochemistry (CESB), University of Kentucky, United States
- Department of Toxicology and Cancer Biology, University of Kentucky, United States
- Markey Cancer Center, University of Kentucky, United States
- Departement of Surgery, University of Kentucky, United States
- Departement of Pathology and Laboratory Medicine, University of Kentucky, United States
- Department of Neurosurgery, University of Kentucky, United States
- Department Internal Medicine, University of Kentucky, United States
Figures
Figure 1 with 1 supplement
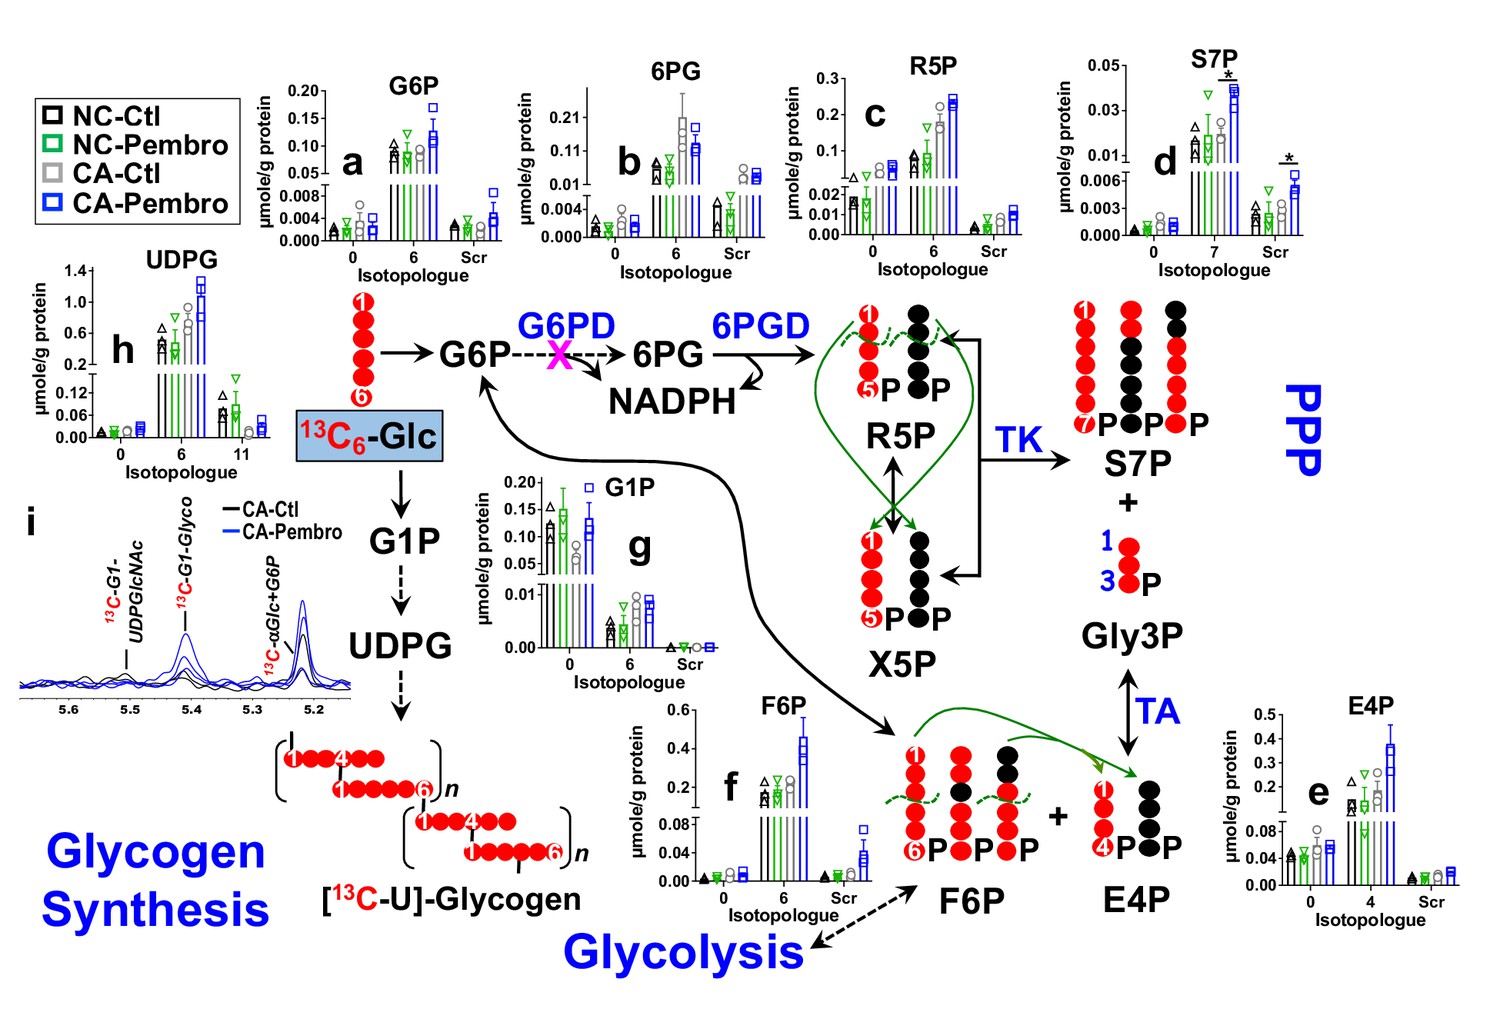
Pembro activates the PPP and glycogen synthesis in primary CA, but not in NC lung tissues.
Matched pairs of fresh cancerous (CA) and non-cancerous (NC) lung tissue slice cultures of UK131 patient were treated with 40 μg/mL Pembro + 13C6-glucose (13C6-Glc) for 24 hr before extraction for polar metabolites, as described in the Experimental. The diagram traces the atom-resolved 13C6-Glc transformation through the PPP and glycogen synthesis, the green arrows and dashed curves delineate the reactions of transketolase (TK) and transaldolose (TA) that scramble 13C labeling in PPP metabolites, and  denotes the block at glucose-6-phosphate dehydrogenase (G6PD) step. Panels (a–h) were obtained from IC-UHR-FTMS analysis and panel (i) from 1D HSQC NMR analysis (n = 3). X-axis denotes the number of 13C or scrambled 13C (Scr) in each metabolite.
  : 13C;
  : 12C;
  : NC control (Ctl);
  : NC Pembro;
  : CA Ctl;
  : CA Pembro; G6P: glucose-6-phosphate; 6 PG: 6-phosphogluconate; R5P: ribulose/ribose-5-phosphates; S7P: sedoheptulose-7-phosphate; Gly3P: glyceraldehye-3-phosphate; E4P: erythrose-4-phosphate; F6P: fructose-6-phosphate; G1P: glucose-1-phosphate; UDPG: UDP-glucose; Glyco: glycogen; UDPGlcNAc: UDP-N-acetylglucosamine. Panels (a–h) show mean ± sem (n = 3). *p<0.05.
Figure 1—figure supplement 1
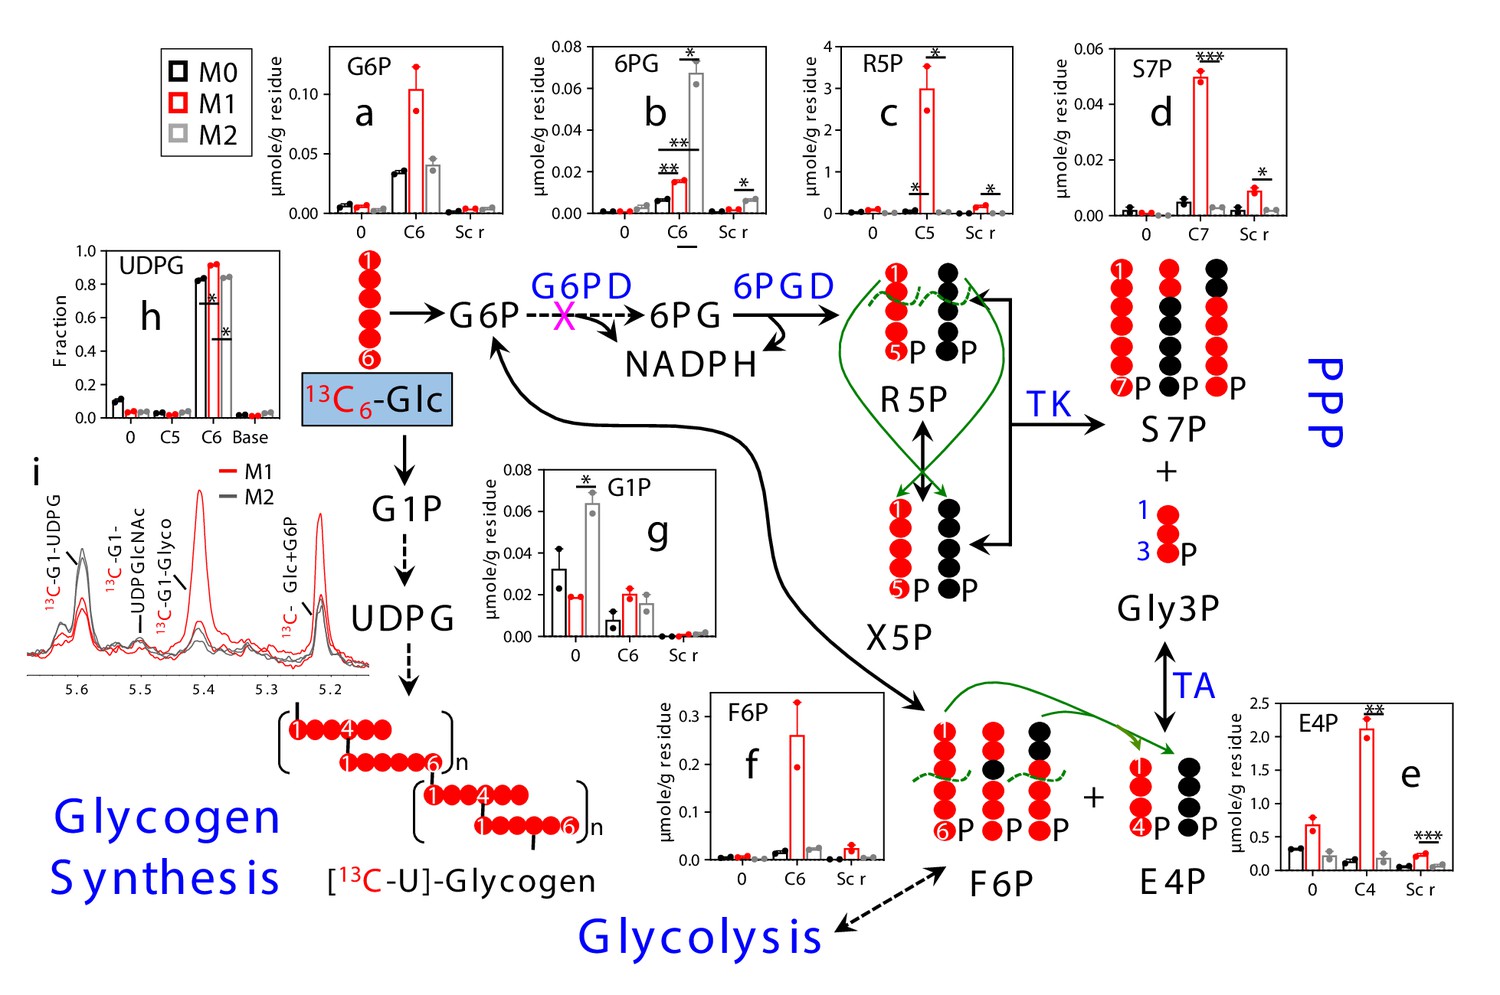
M1 polarization of human MΦ activates the PPP and glycogen synthesis.
Two-day polarized M1–MΦ ( ) and M2–MΦ (
 ) plus naïve MΦ (M0,
  ) prepared from a 65 year old male donor were treated with 13C6-Glc for 24 hr before extraction for polar metabolites and analysis by IC-UHR-FTMS (a–h) and 1D HSQC NMR (i), as described in Materials and methods. All symbols and abbreviations are as in Figure 1. Data are displayed as mean ± sem. *p<0.05; **p<0.01; ***p<0.005.
Figure 2 with 1 supplement
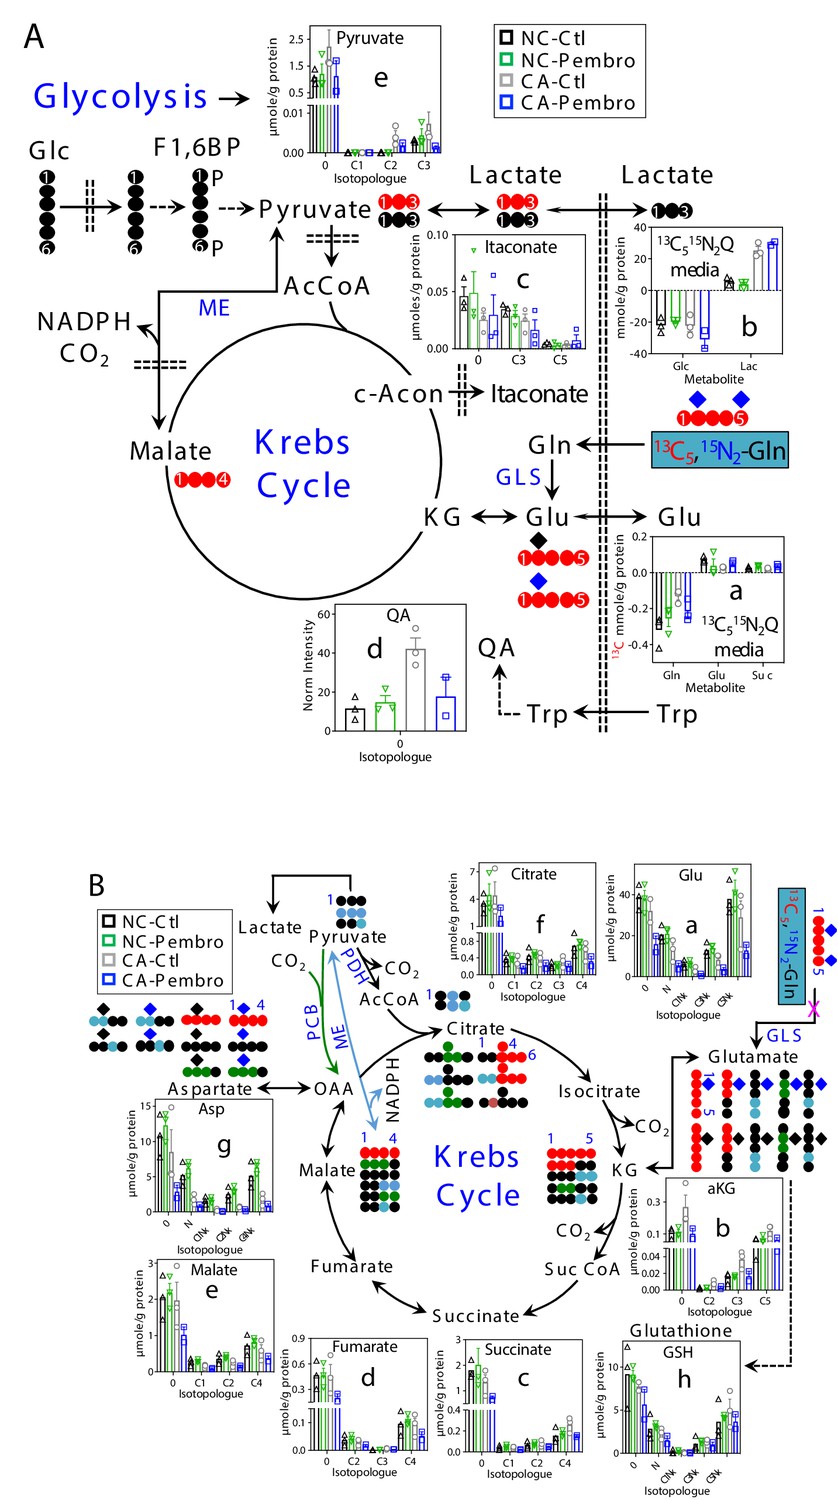
Pembro enhances Gln uptake/release of glutaminolytic products while blocking Gln-fueled Krebs cycle activity in primary CA but not in NC lung tissues.
A separate set of CA and NC lung tissue slices from UK131 was treated with 40 μg/mL Pembro plus 13C5,15N2-Gln (13C515N2Q) for 24 hr before extraction and analysis for polar metabolites as in Figure 1. Diagram in (A) depicts the glutaminolytic production of 13C-Glu and release into the medium, 13C5-Glu transformation through the Krebs cycle, and 13C3-pyruvate/lactate production from the malic enzyme (ME) pathway, 13C-itaconate production from c-aconitate (c-Acon), Trp uptake and oxidation to quinolinate (QA) as well as unlabeled lactate production from glucose (Glc) via glycolysis. The diagram in (B) traces atom-resolved transformation of 13C5,15N2-Gln through the Krebs cycle (both PDH-  and PCB
  -initiated) and ME (
 ) pathway. Panels (a, b) in (A) were obtained from 1D HSQC analysis while the rest of all panels from IC-UHR-FTMS analysis. Numbers in X-axis denote those of 13C while x indicates 1–2 15N and N is 15N1.
  : 12C;
  : 14N;
  : 15N; F1,6BP: fructose-1,6-bisphosphate; Lac: lactate; AcCoA: acetyl coenzyme A; αKG: α-ketoglutarate; Suc: succinate; Suc CoA: succinyl CoA; GSH: glutathione; GLS: glutaminase; PDH: pyruvate dehydrogenase; PCB: pyruvate carboxylase. Panels a-h display mean ± sem, with n = 3.
Figure 2—figure supplement 1
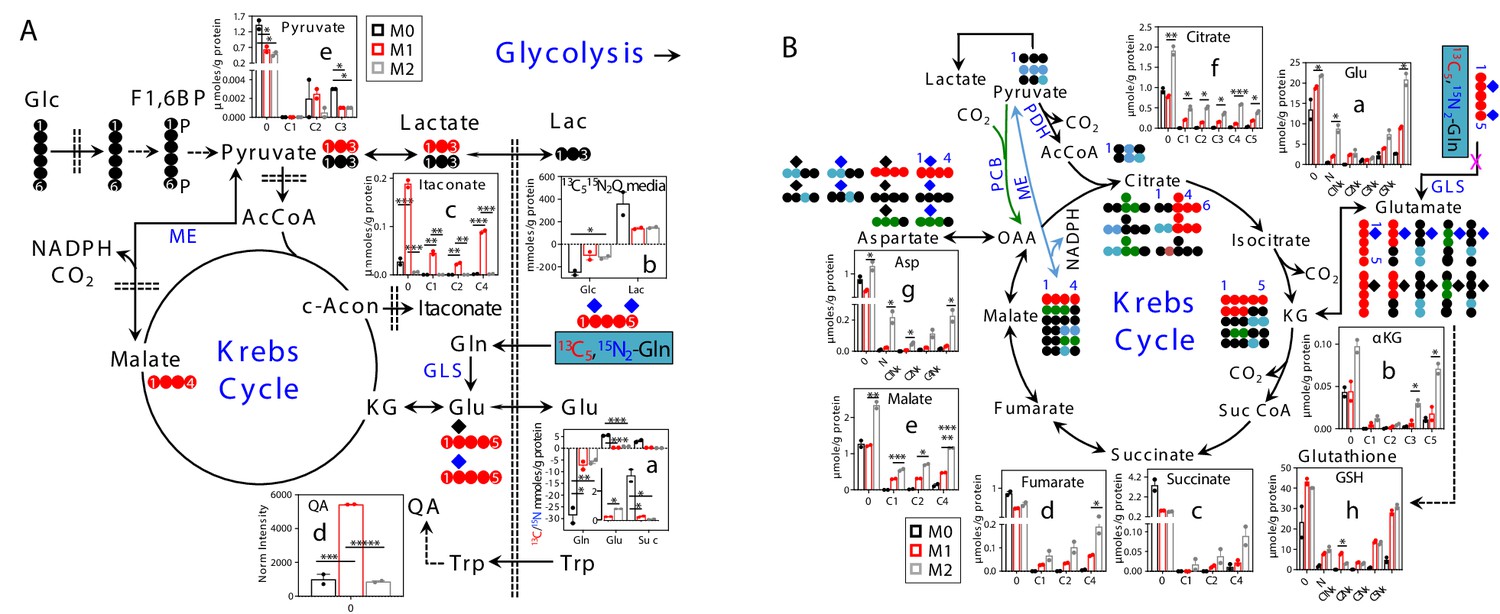
M1 polarization of human MΦ attenuates glutaminolysis and subsequent oxidation through the Krebs cycle but activates itaconate and quinolinate production.
Separate preparations of M0-, M1-, and M2-MΦ for the same donor as in Figure 1—figure supplement 1 were treated with 13C5,15N2-Gln for 24 hr before extraction for polar metabolites and analysis by IC-UHR-FTMS (A–c to e; B–a to h) and 1D 1H (A–b) and HSQC (A–a) NMR, as described in Materials and methods. All symbols and abbreviations are as in Figure 2. Data are displayed as mean ± sem. *p<0.05; **p<0.01; ***p<0.005; *****p<0.00005.
Figure 3 with 1 supplement
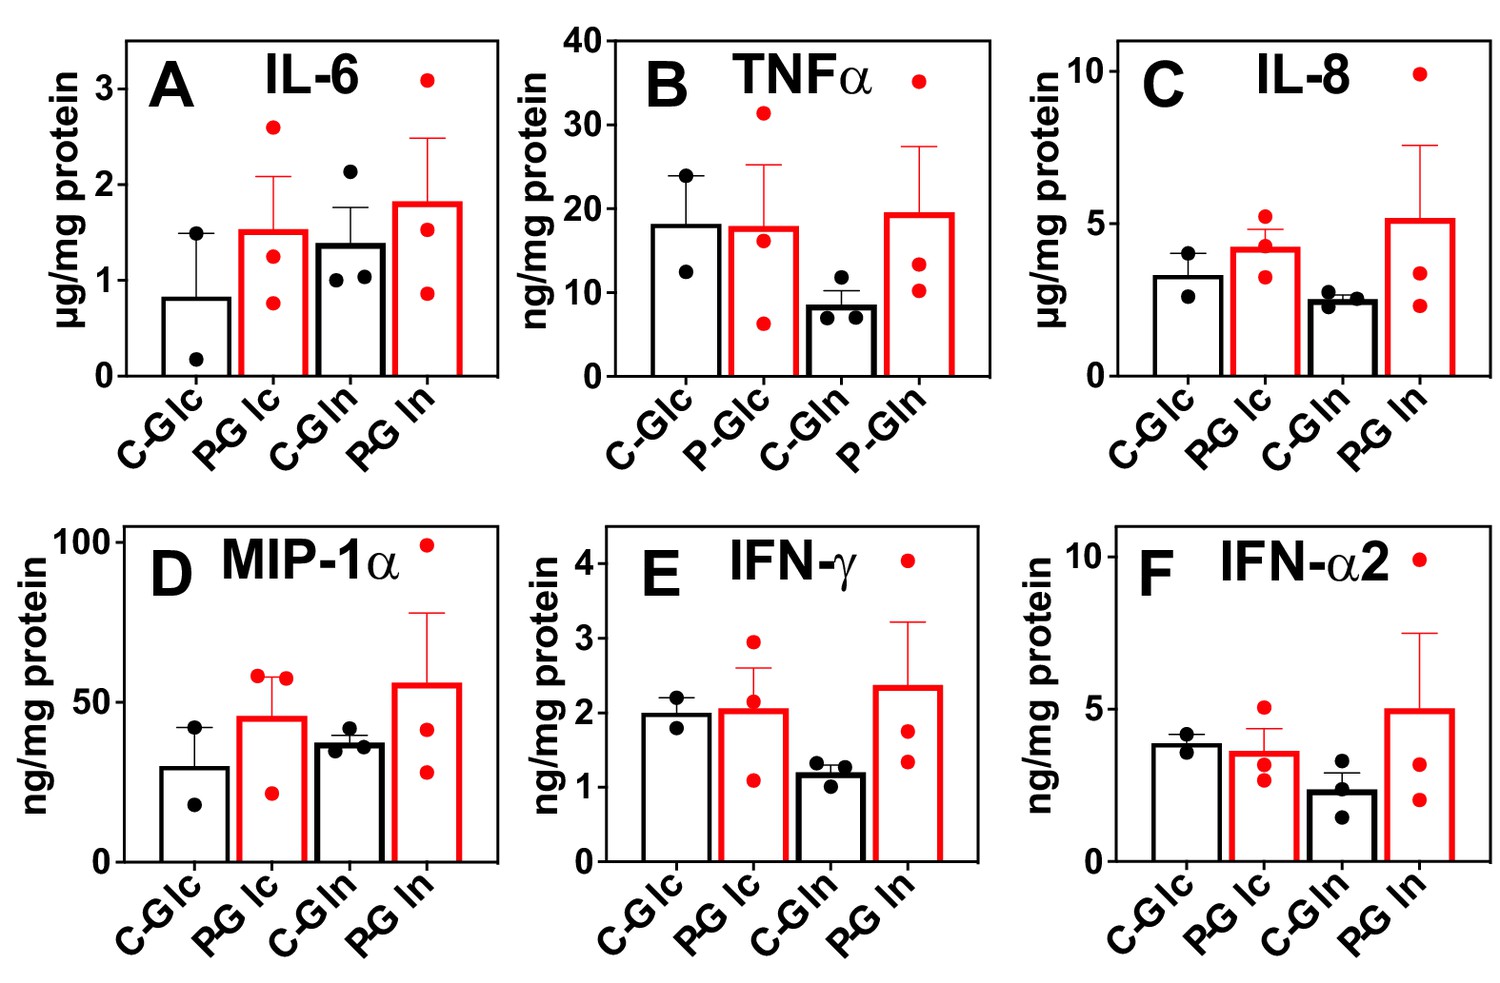
Pembro enhances the release of proinflammatory factors in slice cultures of NSCLC OTC from UK131 patient.
Media (A–F) from the CA samples in Figure 2 were analyzed for cytokines and chemokines as described in the Experimental. C-Glc or C-Gln ( ): Ctl + 13C6-Glc or 13C5,15N2-Gln; P-Glc or P-Gln (
 ): 40 μg/mL Pembro + 13C6-Glc or 13C5,15N2-Gln. Mean ± se (n = 3) are displayed.
Figure 3—figure supplement 1
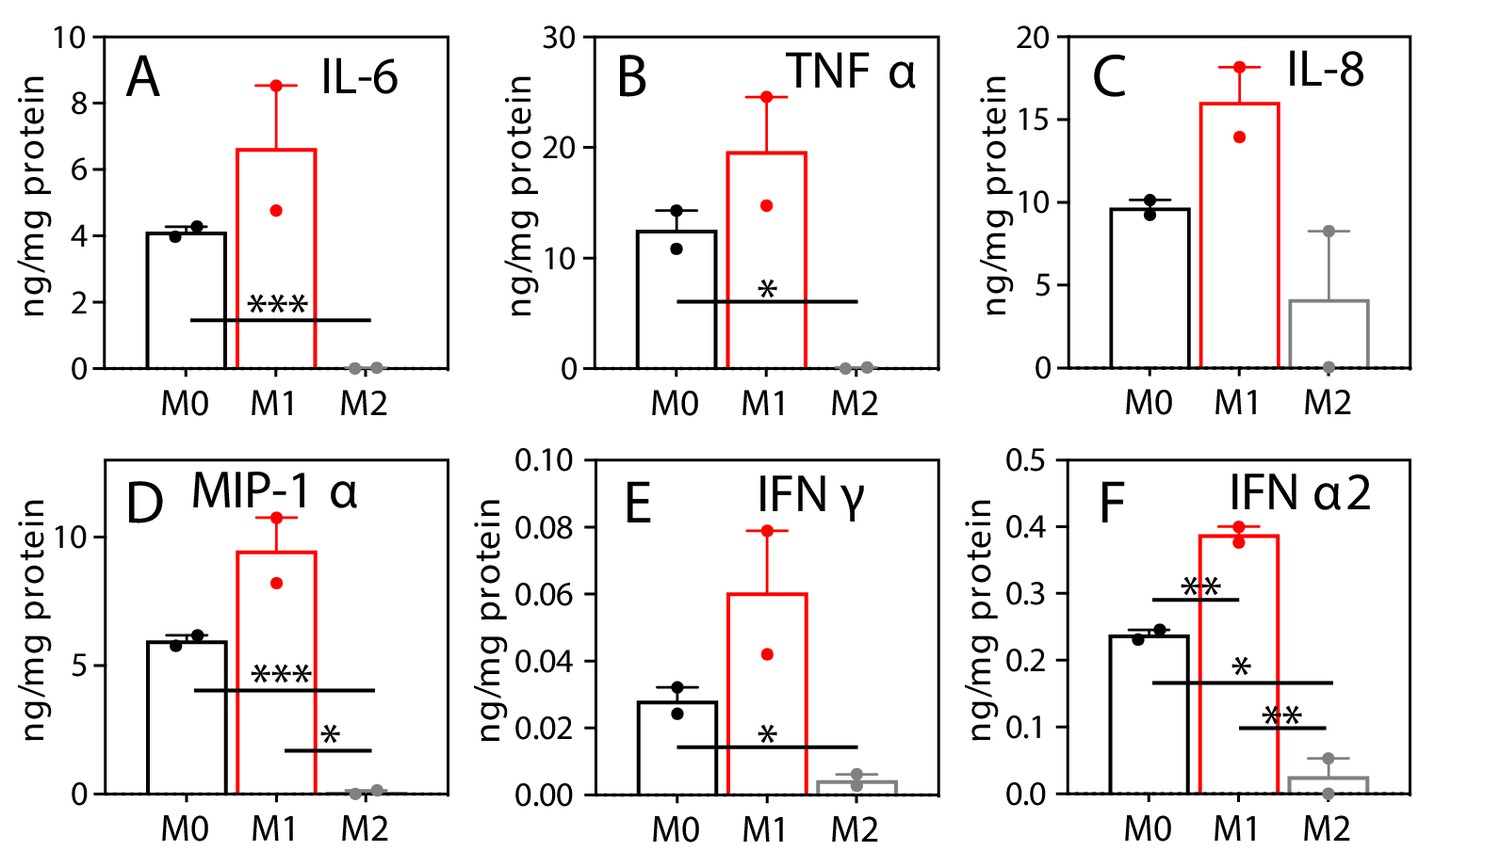
M1 polarization of human MΦ enhances the release of proinflammatory effectors.
M0-, M1-, and M2-MΦ were derived from peripheral blood monocytes of the same donor as in Figure 1—figure supplement 1. Media from M0- ( ), M1- (
 ), and M2-MΦ (
 ) (n = 2) were analyzed for cytokines and chemokines as described in Materials and methods. Data are displayed as mean ± sem. *p<0.05; **p<0.01; ***p<0.005.
Figure 4
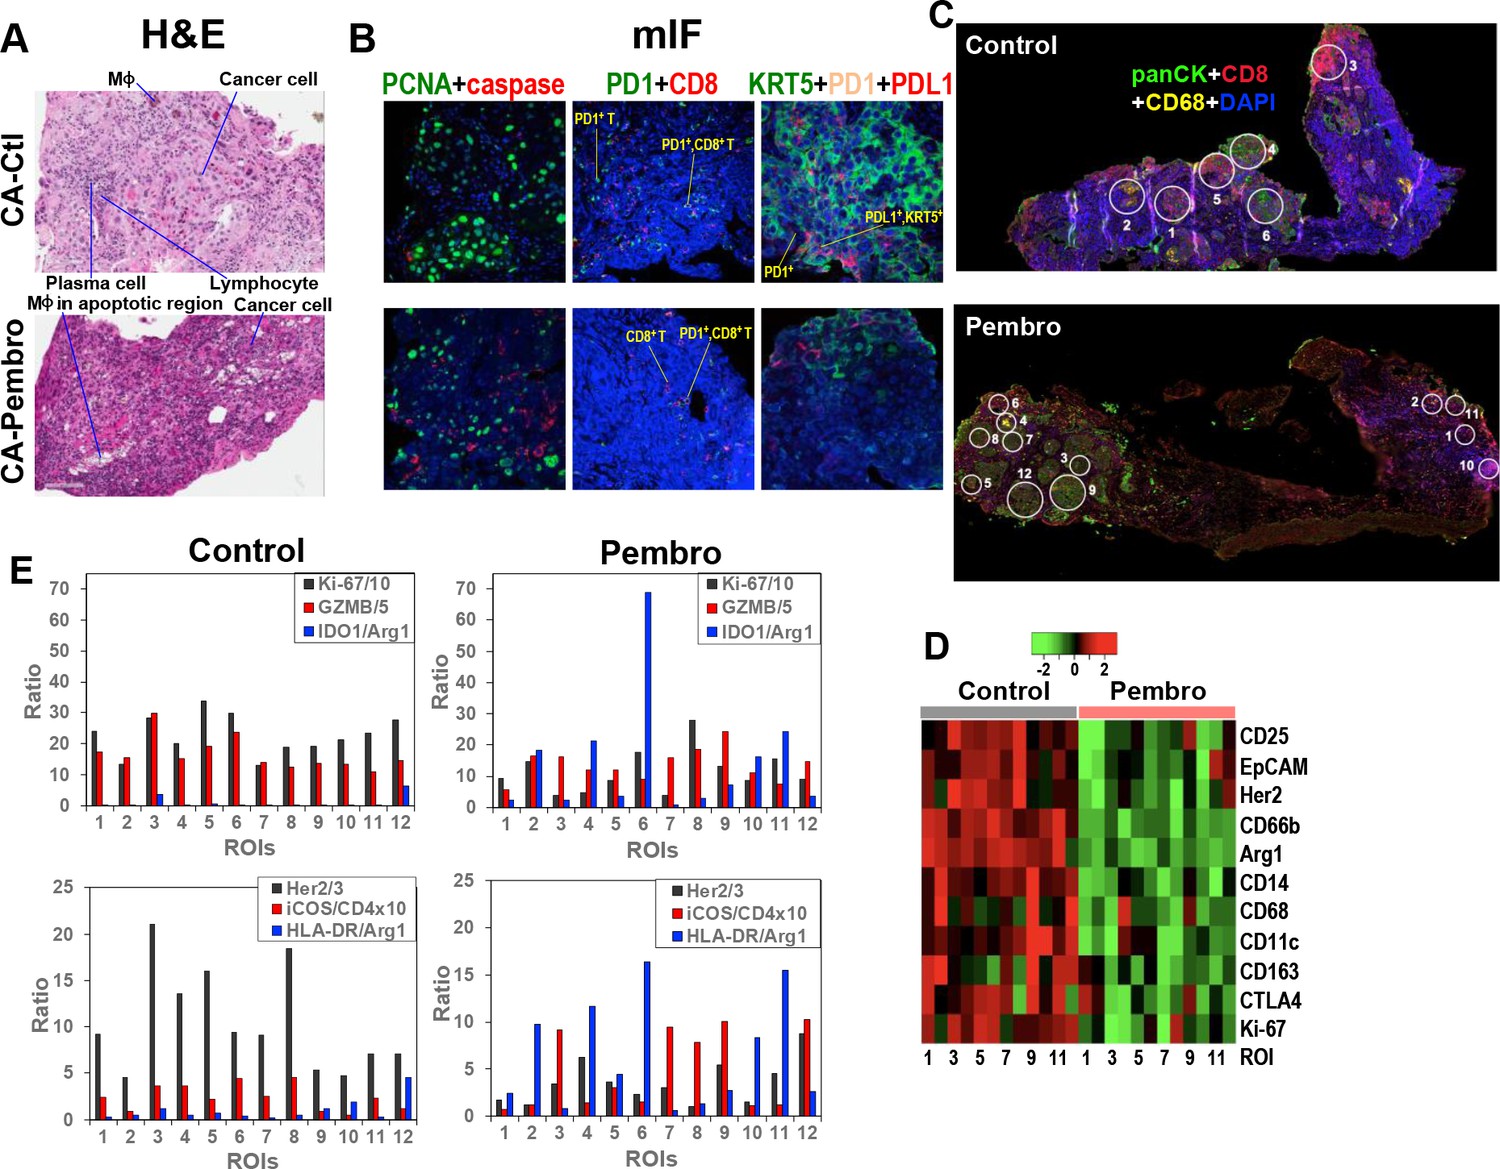
Heterogeneous cellular and functional responses of UK131 tumor tissue slice culture to Pembro.
The treated tissue slices from Figure 2 were subsampled, paraffin-embedded, and sectioned into 4 µm slices for H&E staining (A), mIF staining (B), and digital spatial profiling, as described in the Experimental. White circles in (C) are regions of interest (ROIs) in 100 and 200 µm in diameter, which were selected based on the abundance of cancer cells (panCytokeratin or panCK in green; e.g. 4, 6 in Control; 3, 7–8, 9, 12 in Pembro), CD8+ T cells (CD8 in red; e.g. 3 in Control; 1, 10 in Pembro), MΦ (CD68 in yellow; e.g. 2 in Control; four in Pembro), and mixed cell populations (e.g. 1, 5 in Control; 2, 5, 11 in Pembro). ROIs 7–12 for control tissue was not shown. These ROIs were probed for the expression level of 58 different markers of cancer and immune cell functional states using Oligo-barcoded antibodies, as described in the Experimental. Eleven markers that were differentially expressed region-wide between Control and Pembro treatments are shown as heat map in (D). The scale in D is log2. ROI-specific quantification of notable markers for Ctl- and Pembro-treated tissues is shown in (E), where the ratios displayed were marker-specific Oligo counts were normalized to the geometric mean of the house keeping genes GAPDH, S6, and Histone H3. Some ratios were multiplied or divided for display purposes.
Figure 5
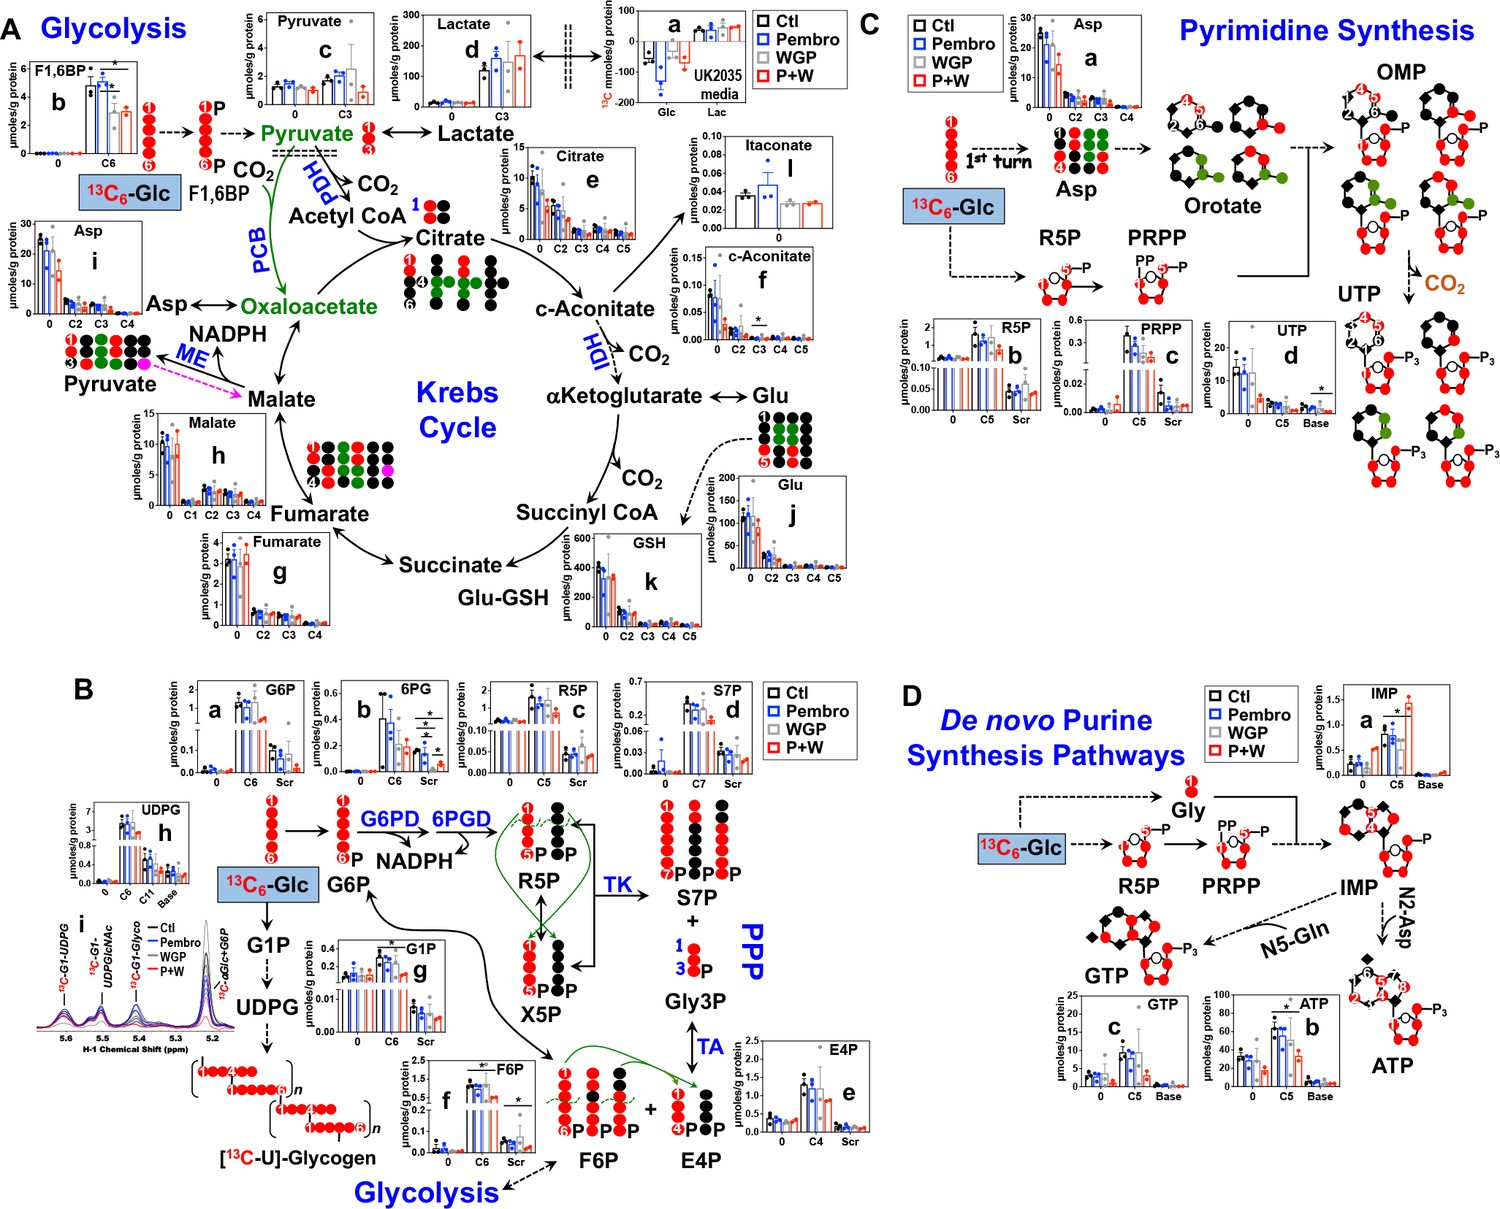
Pembro + WGP attenuates central energy and anabolic metabolism in OTCs of brain-metastasized NSCLC tissues from UK2035 patient.
CA lung OTCs of UK2035 patient were treated with Ctl ( ), 40 μg/mL Pembro (
 ), 0.1 mg/mL WGP (
 ) (n = 3), or Pembro + WGP combined (P + W
  ) (n = 2) in the presence of 13C6-Glc for 24 hr before extraction for polar metabolites and analysis by IC-UHR-FTMS, as described in the Materials and Methods. The diagrams in (A–D) depict atom-resolved transformation of 13C6-Glc via glycolysis+ the Krebs cycle, the PPP+ glycogen synthesis pathway, and pathways of pyrimidine and purine nucleotide synthesis, respectively. Base in X-axis of (C) and (D) denotes 13C-labeled isotopologues of pyrimidine and purine bases. OMP: orotidine 5’-monophosphate; IMP: inosine 5’-monophosphate. All other symbols and abbreviations are as in Figures 1–2. Data are displayed as mean ± sem. *p<0.05.
Figure 6
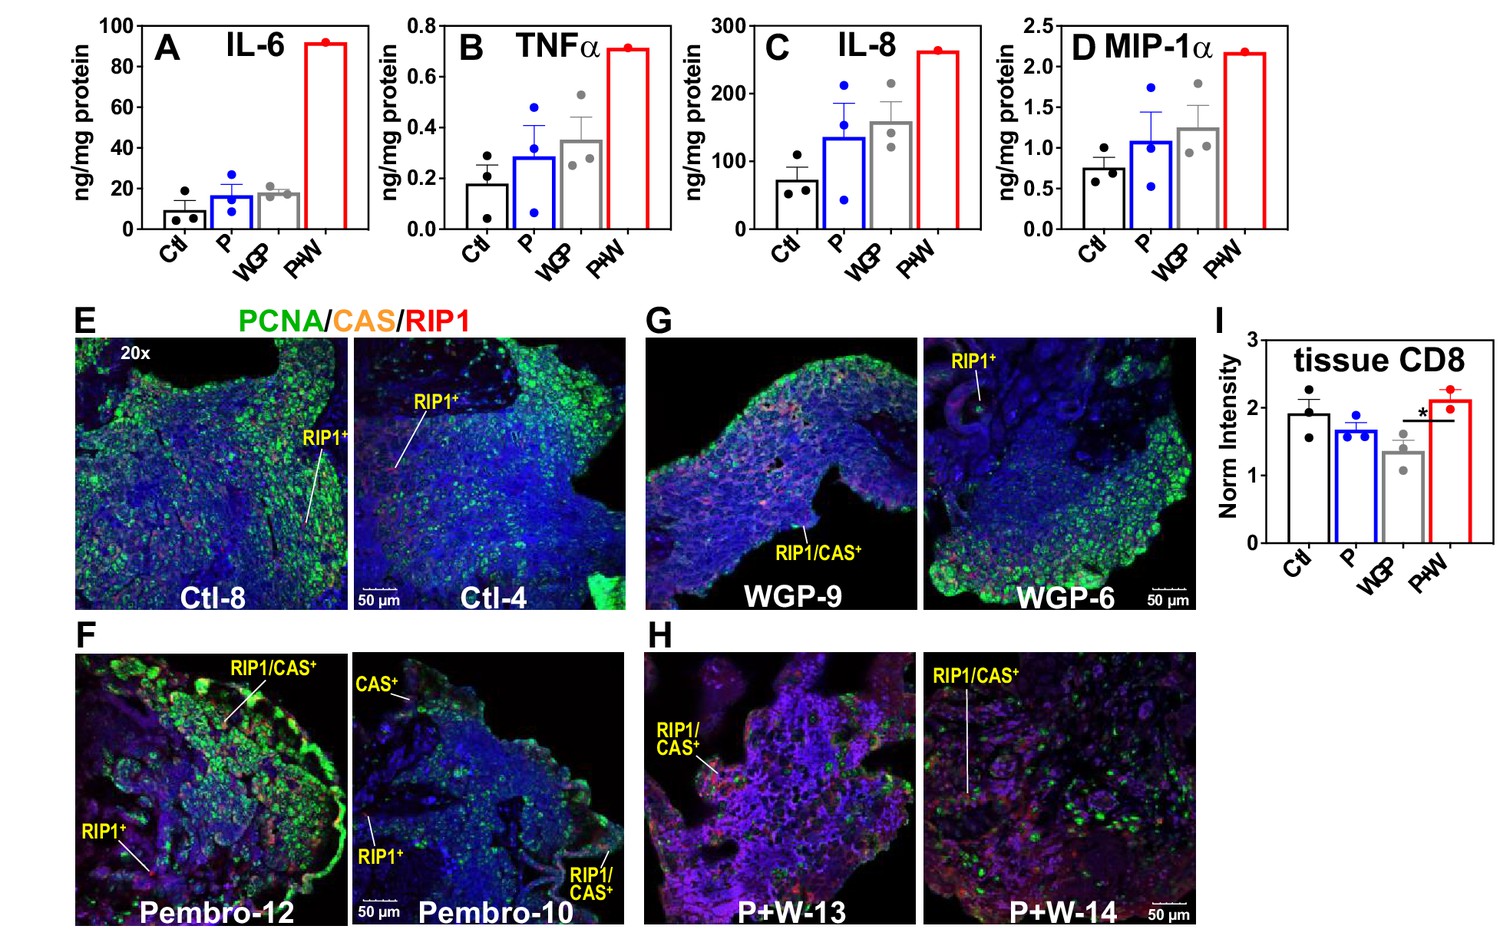
Pembro+ WGP elicits the release of proinflammatory effectors and cell death in UK2035 CA lung tissues.
CA lung OTCs of UK2035 patient were treated with Ctl ( ), 40 μg/mL Pembro (
 ), 0.1 mg/mL WGP (
 ) (n = 3), or Pembro + WGP combined (P + W
  ) (n = 2) in the presence of 13C6-Glc for 24 hr. Tissues were subsampled for polar extraction (Figure 5) and formaldehyde fixation while media were analyzed for immune effectors (A–D). The fixed tissues were FFPE-processed, sectioned as 4 µm slices, stained for PCNA/caspase 3 (CAS)/RIP-1, and analyzed by confocal microscopy (E–H), as described in the Experimental. Also shown are the changes in CD8 protein intensity (I) in response to treatments, acquired from RPPA as described in the Experimental. Ctl: control; P: Pembrolizumab; WGP: whole glucan particulate; P + W: Pembrolizumab + WG. Panels (A–D) display mean ± sem with n = 3. *p<0.05.
Tables
Key resources table
| Reagent type (species) or resource | Designation | Source or reference | Identifiers | Additional information |
|---|---|---|---|---|
| Biological Sample(Homo sapiens) | Primary patient NSCLC and matched non cancerous lung tissue | Fresh thin tissue slices from surgical resection | See Materials and methods section, this study | |
| Biological Sample(Homo sapiens) | NSCLC metastasis to brain patient | Fresh thin tissue slices from surgical resection | See Materials and methods section, this study | |
| Biological sample(H. sapiens) | Primary monocytes | Healthy volunteer | Freshly isolated from healthy male volunteer | |
| Antibody | Pembrolizumab (humanized mouse anti PD-1 monoclonal) | Markey Cancer Center/Merck | IF(1:1000), WB (1:1000) | |
| Antibody | Anti-PanCK(mouse monoclonal) | Invitrogen | Supplementary file 4 | (1:500) |
| Antibody | Anti-CD8(mouse monoclonal) | Cell Signaling | Supplementary file 4 | (1:200) |
| Antibody | Anti-CD68(mouse monoclonal) | SCBT | Supplementary file 4 | (1:400) |
| Chemical compound, drug | WGPBeta glucan | InvivoGen | Whole glucan particles | |
| Software, algorithm | MNOVA 14.1 | Mrestlab | ||
| Other | DAPI stain | Invitrogen | D1306 | (1 µg/mL) |
| Other | AlexaFluor Tyramide Superboost kits, | Invitrogen | See Materials and methods section for detailed use |
Additional files
-
Transparent reporting form
- https://cdn.elifesciences.org/articles/69578/elife-69578-transrepform1-v4.docx
-
Supplementary file 1
Table S1.
Patient demographics and clinical characteristics.
- https://cdn.elifesciences.org/articles/69578/elife-69578-supp1-v4.docx
-
Supplementary file 2
Primary NSCLC tissue of UK131 patient stains positive forsquamous cell carcinoma marker, PD-1 and PD-L1.
Freshly resected CA lung tissue ofUK131 was FFPE-processed, sectioned as 4 μm slices, stained for KRT5 (squamous cellcarcinoma marker)/HIF1α in A, PD-1/CD8 in B, and PD-L1/CD206 in C, and analyzed byconfocal microscopy as described in Materials and methods.
- https://cdn.elifesciences.org/articles/69578/elife-69578-supp2-v4.pdf
-
Supplementary file 3
Brain-metastasized NSCLC tissue of UK2035 patient stains positivefor neuroendocrine markers, PD-1 and PD-L1.
Freshly resected CA lung tissue of UK2035was FFPE-processed, sectioned as 4 μm slices, stained for CgA/NCAM1 (neuroendocrinetumor markers) in A and PD-1/PD-L1/CD8 in B, and analyzed by confocal microscopy, asdescribed in the Materials and Methods.
- https://cdn.elifesciences.org/articles/69578/elife-69578-supp3-v4.pdf
-
Supplementary file 4
Table S2.
Information on primary antibodies used forimmunofluorescent staining.
- https://cdn.elifesciences.org/articles/69578/elife-69578-supp4-v4.docx
Download links
A two-part list of links to download the article, or parts of the article, in various formats.
Downloads (link to download the article as PDF)
Open citations (links to open the citations from this article in various online reference manager services)
Cite this article (links to download the citations from this article in formats compatible with various reference manager tools)
Innate immune activation by checkpoint inhibition in human patient-derived lung cancer tissues
eLife 10:e69578.
https://doi.org/10.7554/eLife.69578


