LRET-derived HADDOCK structural models describe the conformational heterogeneity required for DNA cleavage by the Mre11-Rad50 DNA damage repair complex
- Department of Chemistry and Biochemistry, Texas Tech University, United States
Figures
Figure 1 with 2 supplements
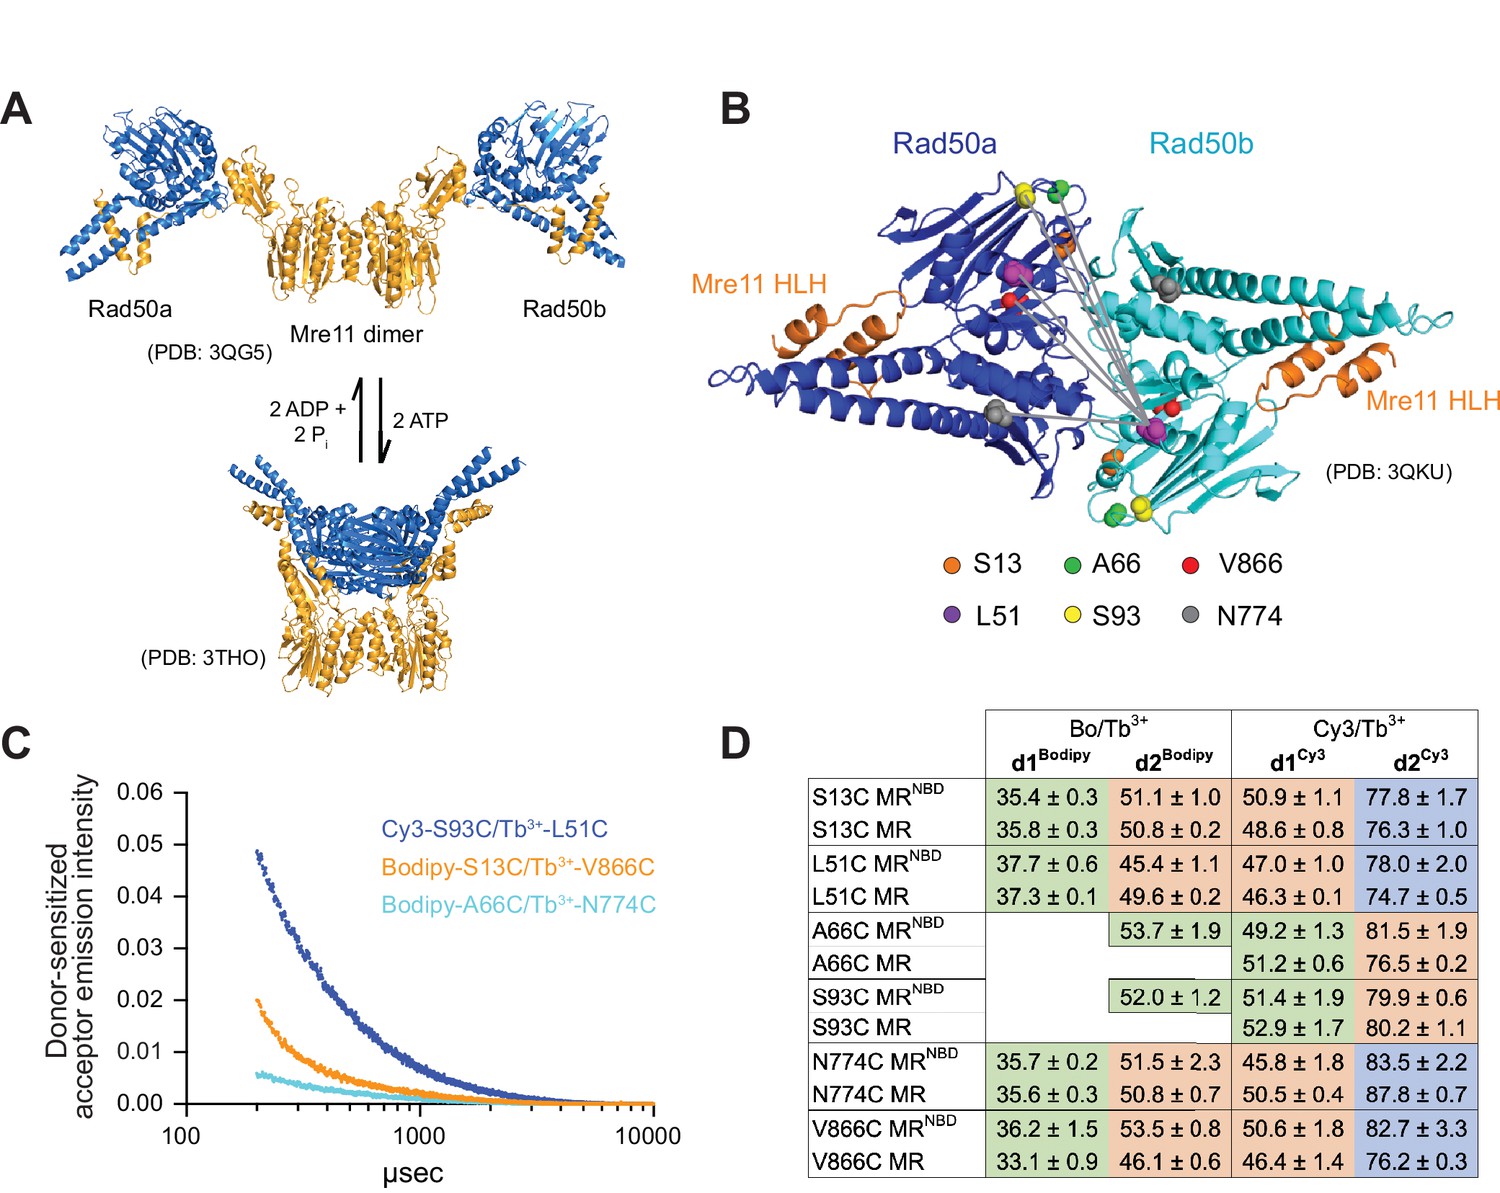
Luminescence resonance energy transfer (LRET) measures distances between Rad50 residues in Pf MRNBD.
(A) X-ray crystal structures of T. maritima MRNBD showing the ATP-dependent transition between extended and closed conformations (Lammens et al., 2011; Möckel et al., 2012). (B) Positions of LRET probes highlighted on the P. furiosus Rad50 AMPPNP-bound dimer (Williams et al., 2011). Gray lines show L51 of Rad50b interacting with each of the probe residues of Rad50a. (C) Plot of representative LRET emission decays versus time after Tb3+-chelate donor excitation. (D) Table of the LRET-determined distances (in Å) for the identity pairs, where the same residue is labeled in each protomer, in MRNBD and full-length MR complexes. One Rad50 was labeled with either with Bodipy FL or Cy3 acceptor and the other with Tb3+-chelate donor. Green, orange, and purple shaded cells indicate distances in the ‘closed,’ ‘partially open,’ and ‘open’ conformations, respectively. Values are the mean and standard deviation of at least three replicates.
Figure 1—figure supplement 1
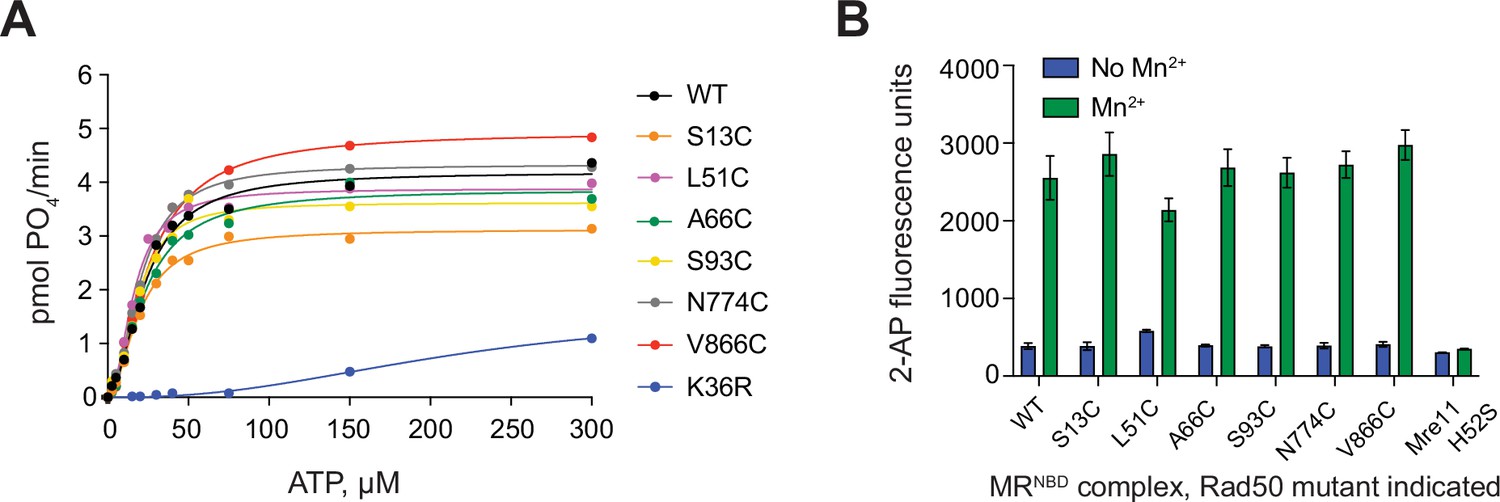
MRNBD complexes made with cysteine mutants of Rad50 are active.
(A) Steady-state Rad50 ATP hydrolysis kinetics for single-cysteine mutants of MRNBD. Lines are the best fit to the Michaelis–Menten Hill equation. K36R is a mutation in the Walker A motif of Rad50 that inhibits hydrolysis. (B) Mre11 Mn2+-dependent exonuclease activity of single-cysteine mutants of MRNBD as determined by the Exo2 substrate (see Materials and methods) in the absence (blue) and presence (green) of 1 mM MnCl2. Mg2+/ATP is not included in these reactions as is it not required for MRNBD activity on this substrate. Mre11 H52S is inactive on this substrate. Bars and errors represent the mean and standard deviation of at least three replicates.
Figure 1—figure supplement 2
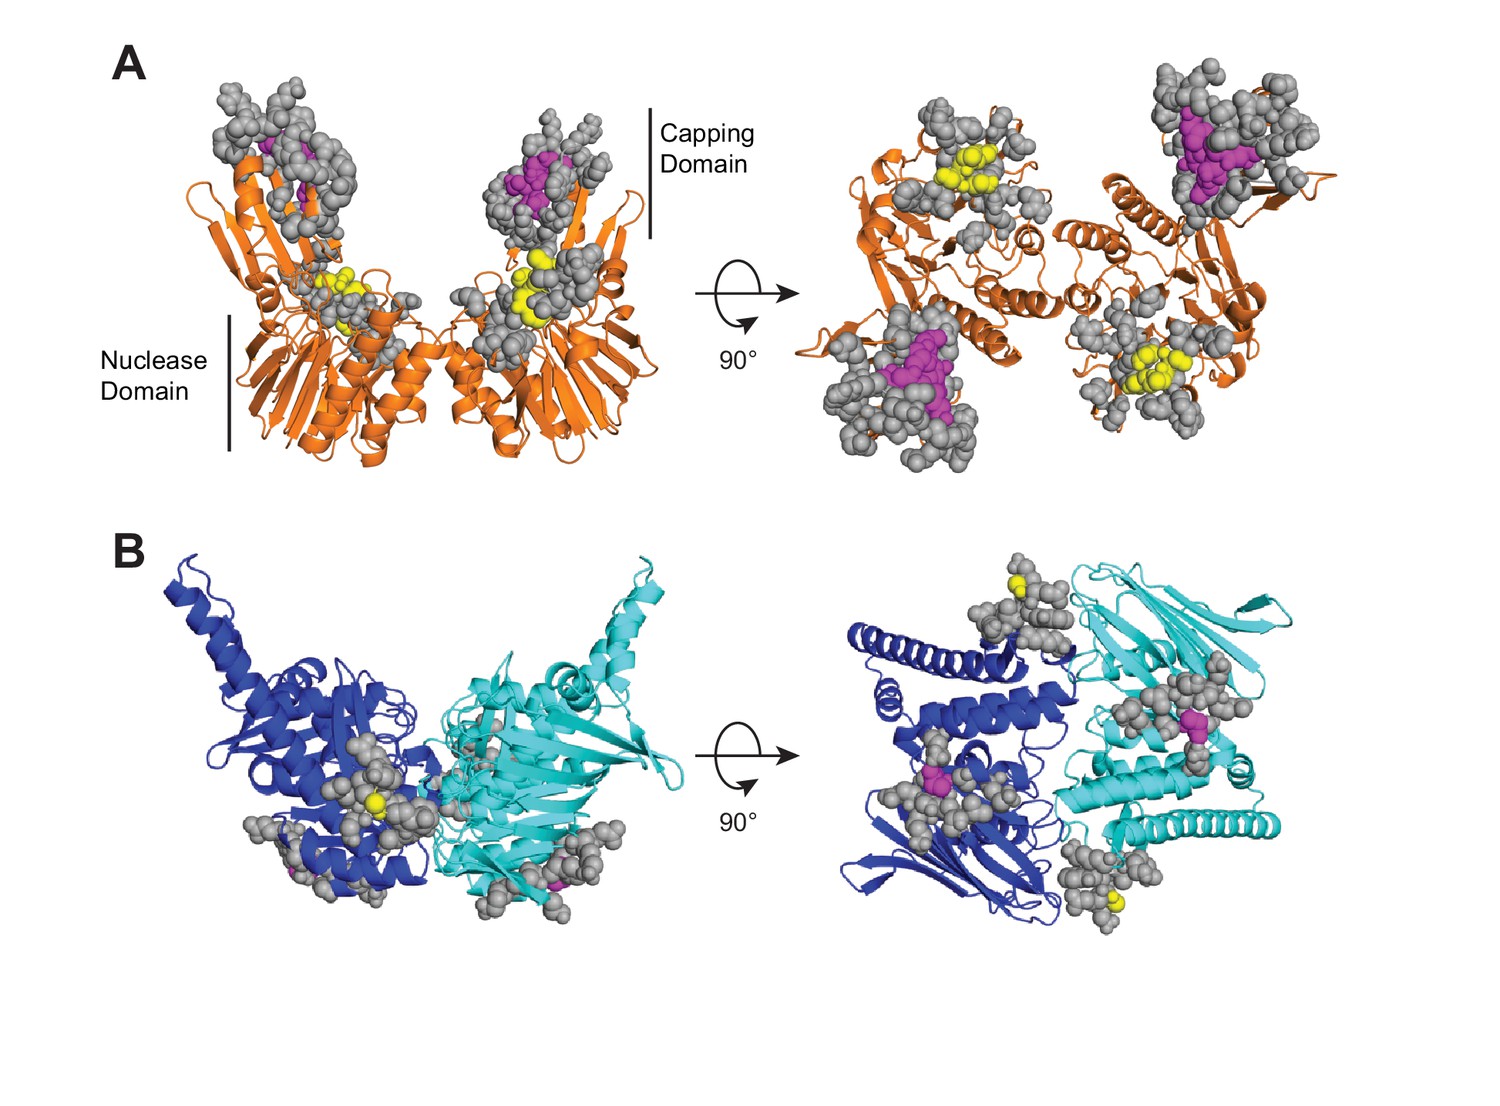
HADDOCK active and passive Mre11 to Rad50 ambiguous interaction restraints (AIRs) are shown on the closed HADDOCK model.
(A) Mre11 residues at the interface with Rad50 are indicated as spheres. Purple spheres in the capping domain (aa 308, 314, 328–330) and yellow spheres in nuclease domain (aa 147–150) were defined as active, while gray spheres were defined as passive. (B) Rad50 residues at the interface with Mre11 are indicated as spheres. Purple spheres (aa 864) and yellow spheres (aa 784) were defined as active, while gray spheres were defined as passive.
Figure 2 with 3 supplements
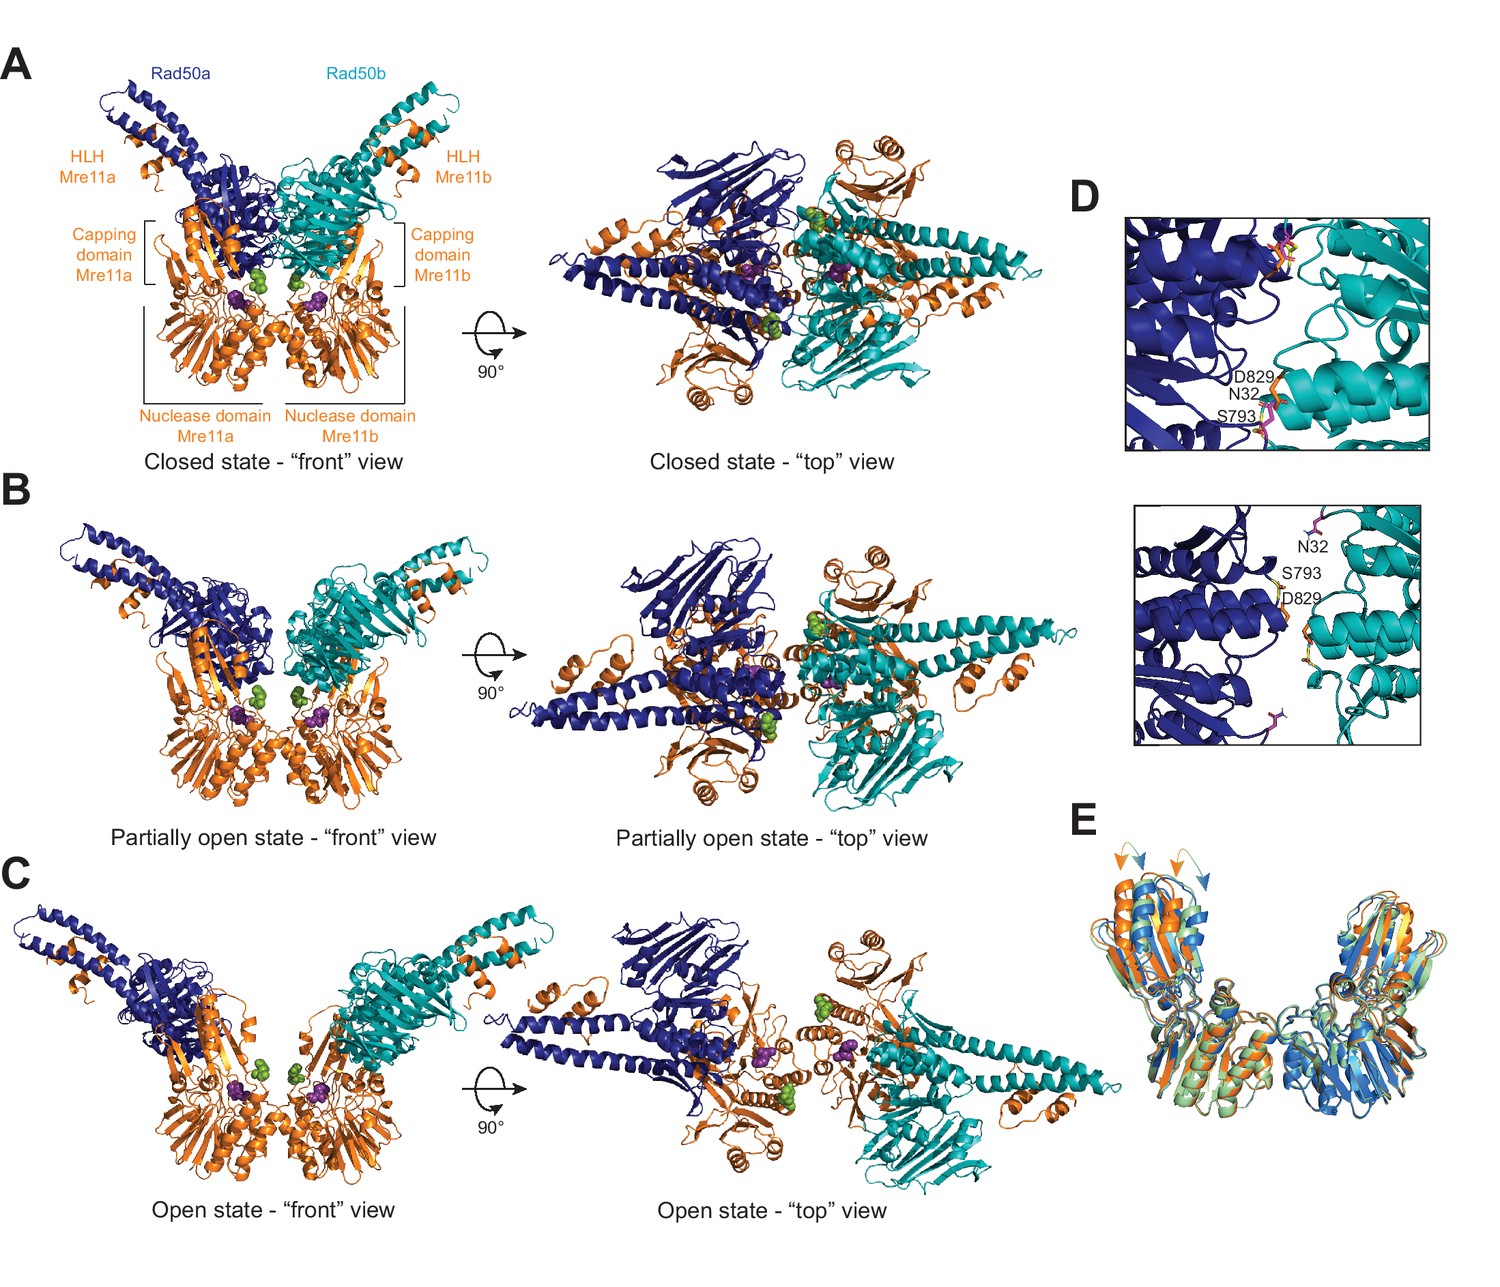
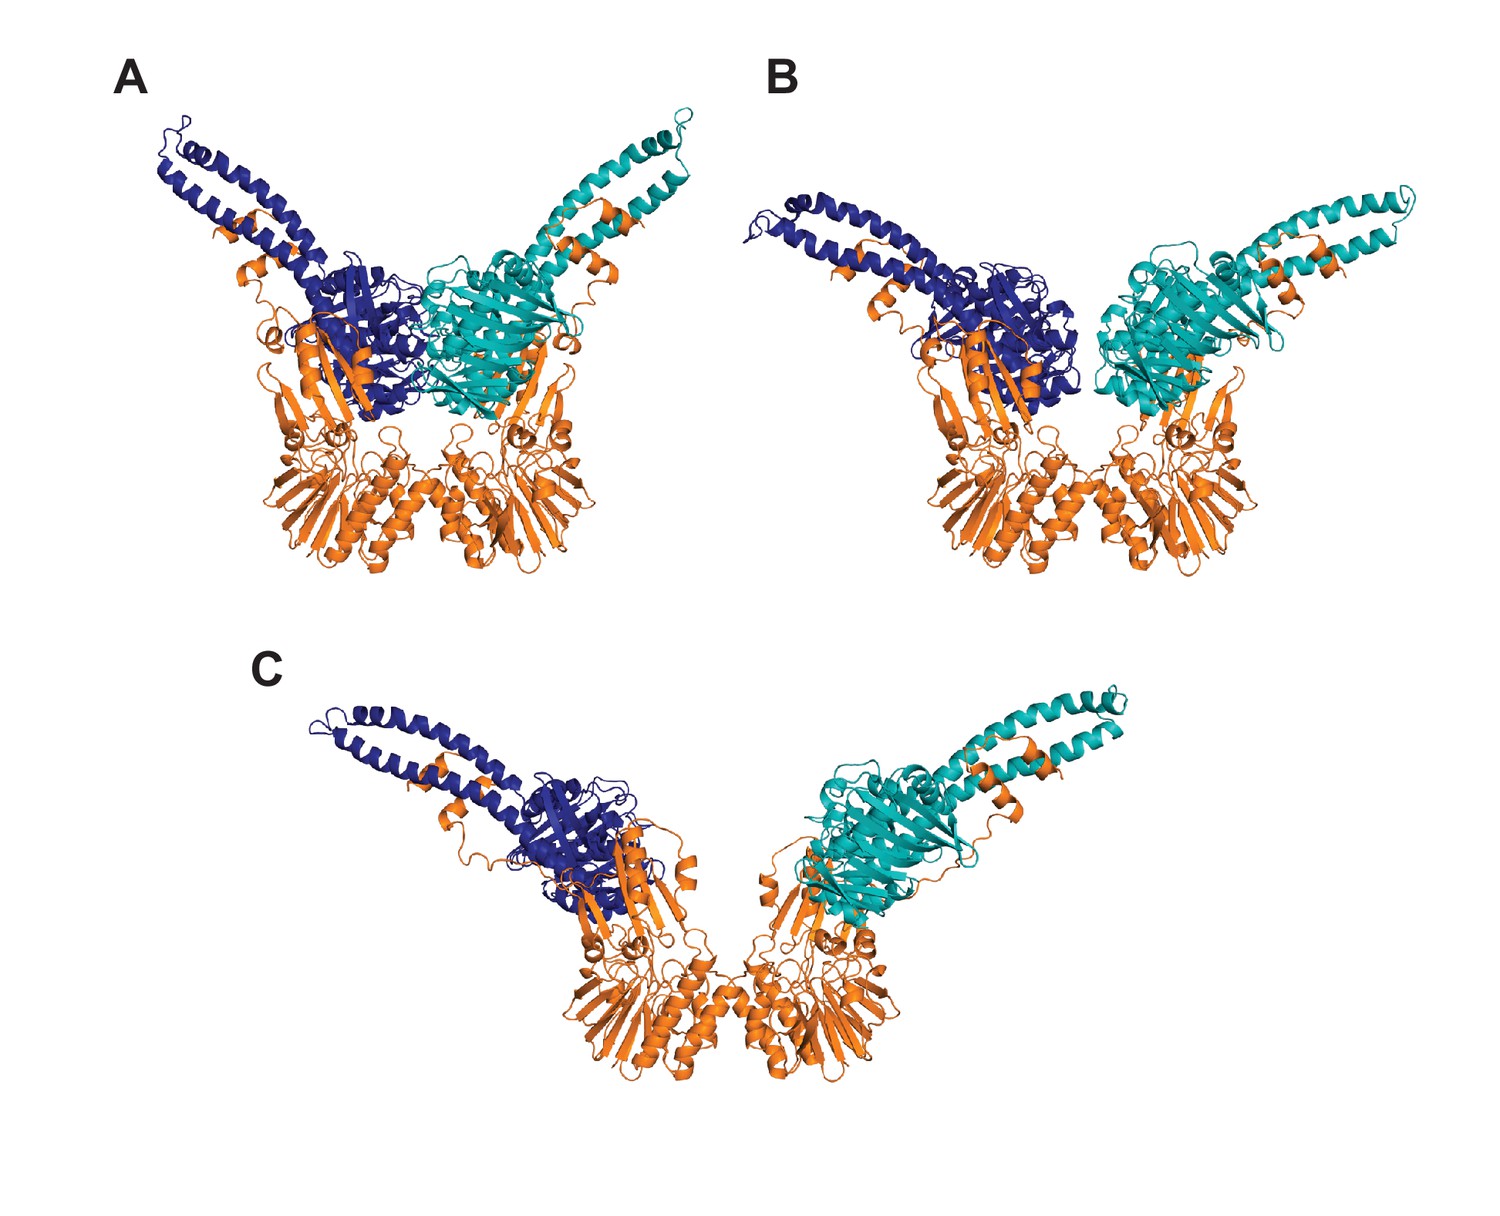
The Pf MRNBD ATP-bound complex has at least three conformations in solution.
HADDOCK structural models of the (A) closed, (B) partially open, and (C) open MRNBD complex. Mre11 H85, which helps to coordinate the catalytic Mn2+ ions, is shown as purple spheres, and Mre11 H17, the wedge residue, is shown as green spheres. (D) The Rad50-Rad50 interface with the Walker A residue (N32, magenta) from Rad50b and the Signature helix (S793, yellow) and D-loop (D829, orange) residues of Rad50a indicated in the closed (top) and partially open (bottom) conformations. (E) Overlay of the Mre11 dimers from the closed (orange), partially open (green), and open (blue) HADDOCK models showing that the capping domain moves out (arrows) to accommodate the associated Rad50s in the closed conformation.
Figure 2—figure supplement 1
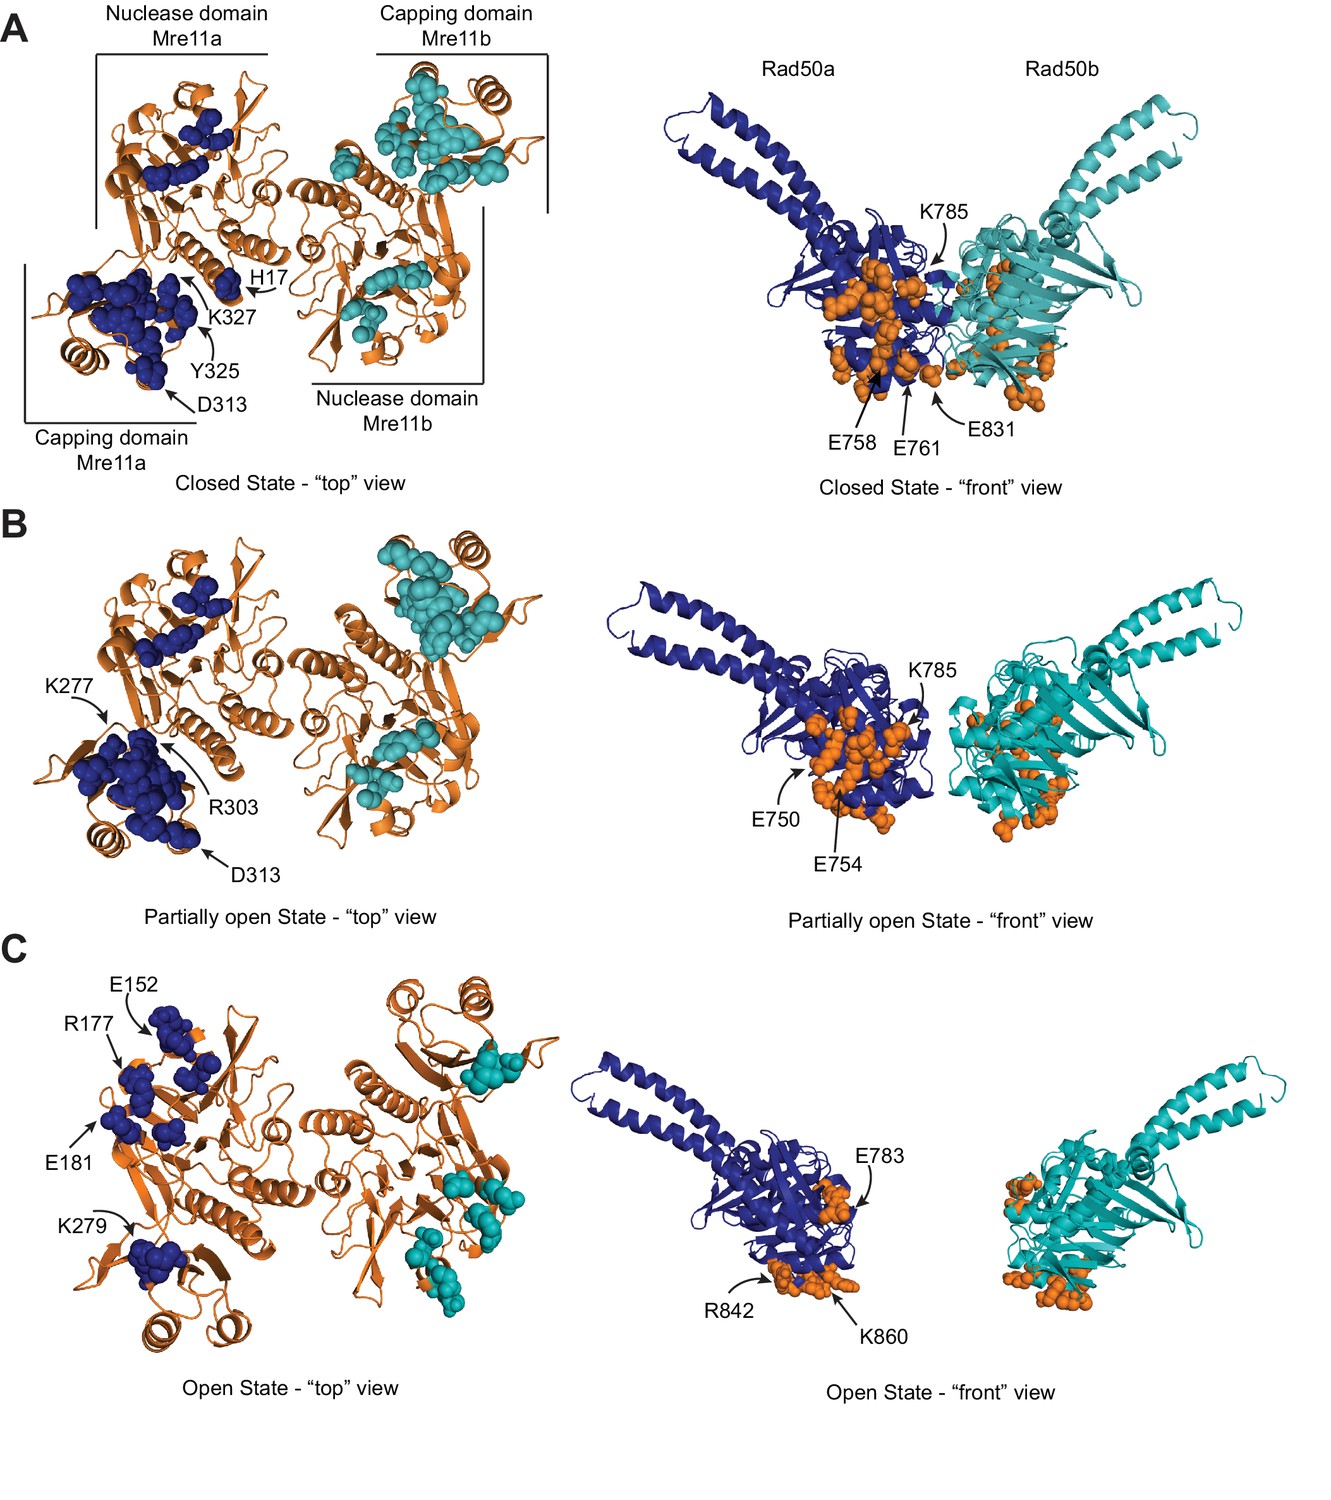
Mre11 and Rad50 make different interactions in the three conformations of the MRNBD complex.
(A) Mre11, left, and Rad50, right, residues within 3 Å of the other protein are highlighted as spheres on the closed HADDOCK model. Dark blue and teal spheres are Mre11 residues close to Rad50, and orange spheres are Rad50 residues close to Mre11. A number of residues mentioned in the text are indicated with arrows. (B) Mre11-Rad50 interactions in the partially open HADDOCK model. (C) Mre11-Rad50 interactions in the open HADDOCK model.
Figure 2—figure supplement 2
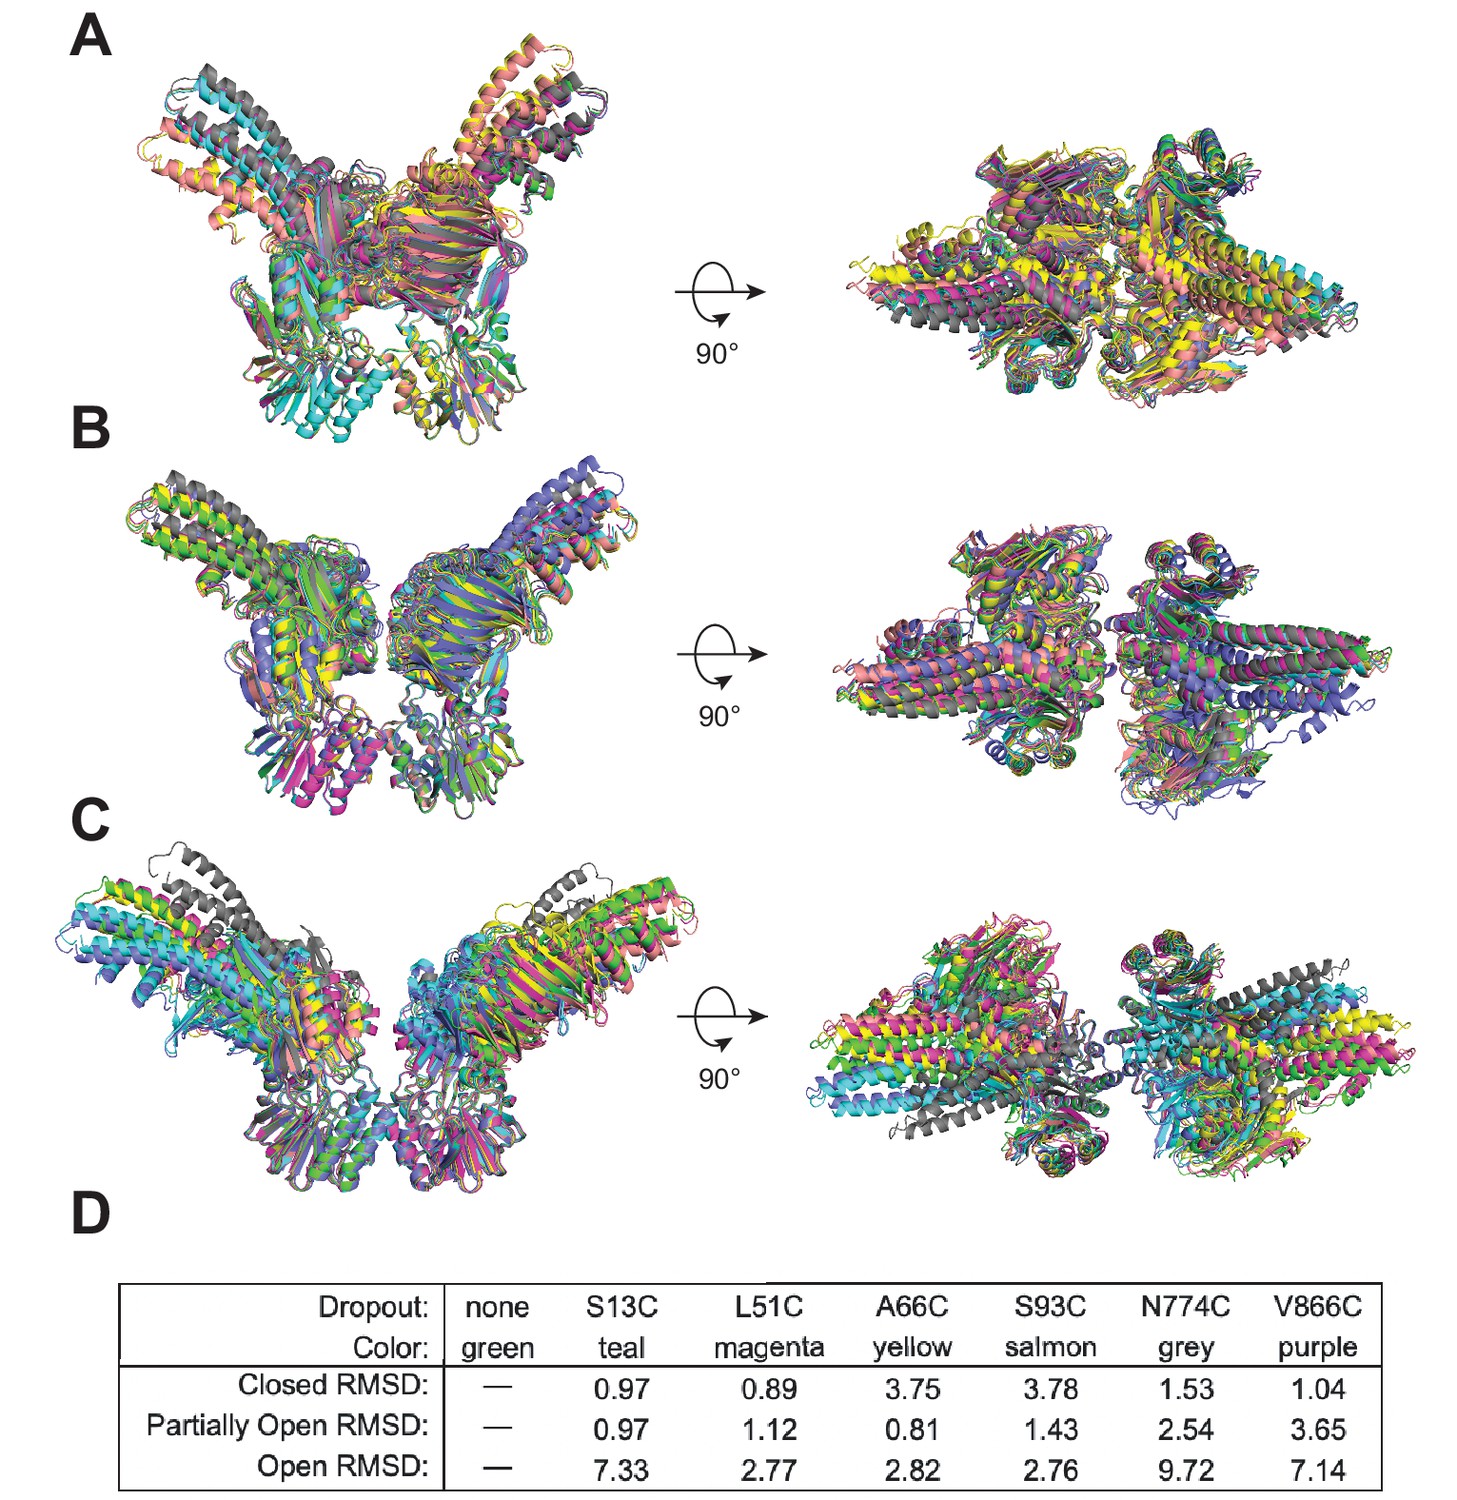
Data from one single luminescence resonance energy transfer (LRET) probe position do not dominate the HADDOCK structure calculations.
HADDOCK models of (A) closed, (B) partially open, and (C) open conformations overlaid and aligned using Mre11. Each color is the model resulting from dropping all of the LRET unambiguous distance restraints associated with that specific probe position. (D) Table indicating the color for each dropout model in the overlays in (A–C) and the all-atom root-mean-square deviation (RMSD) values (Å) calculated by PyMOL for each when compared to the model using all of the LRET data for that conformation (i.e., no dropout).
Figure 2—video 1
The movie depicts the transitions between the closed, partially open, and open conformations first shown from the ‘side’ view and then from the ‘top’ view.
Finally, Mre11 is hidden to highlight the position of the Rad50 Walker A (N32, magenta), signature motif (S793, yellow), and D-loop (D829) in these three conformations. Mre11 is colored orange, whereas Rad50 is colored blue and teal. The morph between the conformations was generated in Chimera (version 1.15) and rendered in PyMOL (version 2.4).
Figure 3 with 2 supplements
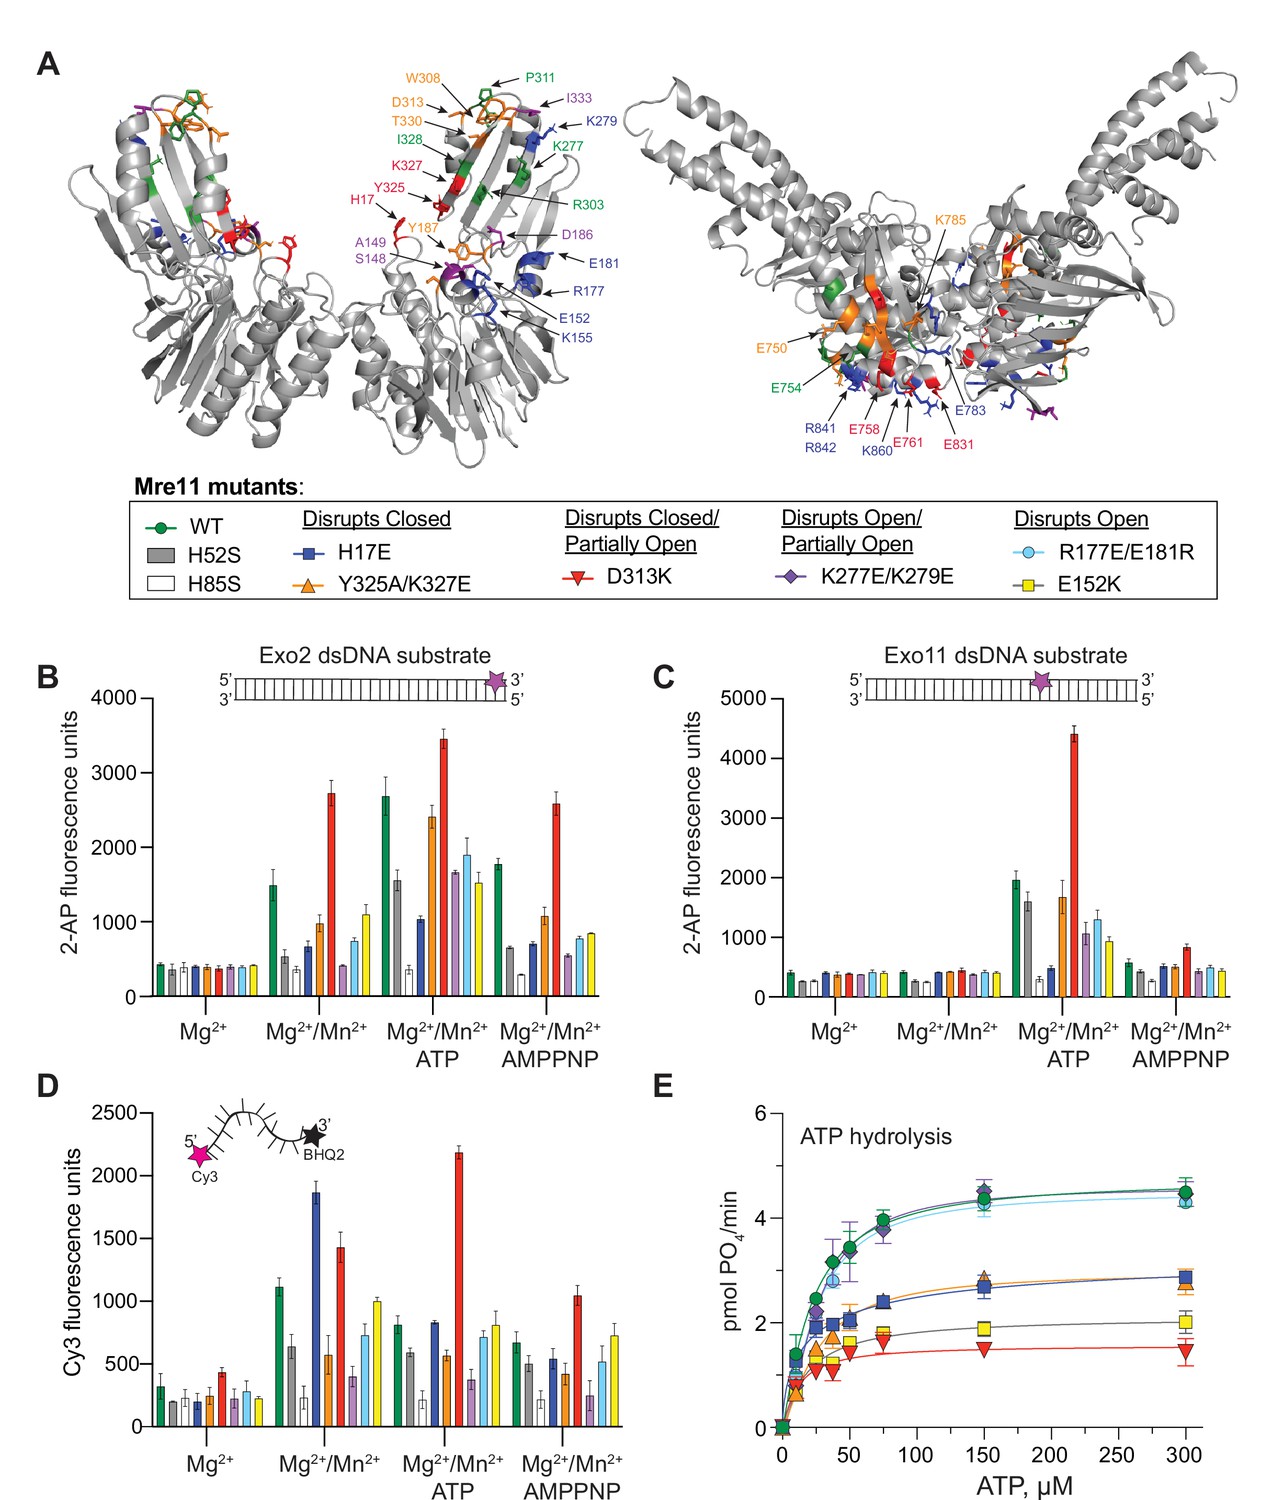
Partially open and open conformations of the MR complex are important for nuclease activities.
(A) Mre11 (left) and Rad50 (right) dimers showing residues involved in protein-protein interactions only in closed (red), only in partially open (green), and only in open (blue) conformations or common to closed and partially open (orange) or common to all three (purple). The box below is a legend providing the color of each mutant for the activity data shown in (B–E) as well as the conformation the mutant was designed to destabilize. (B, C) Full-length MR complex nuclease activity on the Exo2 (B) or Exo11 (C) dsDNA substrates. Position of fluorescent 2-AP is indicated with a star on the cartoon of each substrate. (D) Full-length MR complex endonuclease activity on the Cy3/BHQ2-labeled ssDNA substrate. (E) ATP hydrolysis activity for full-length MR complexes containing the indicated Mre11 mutants. Data are the mean and standard deviation of n ≥ 3 replicates.
Figure 3—figure supplement 1
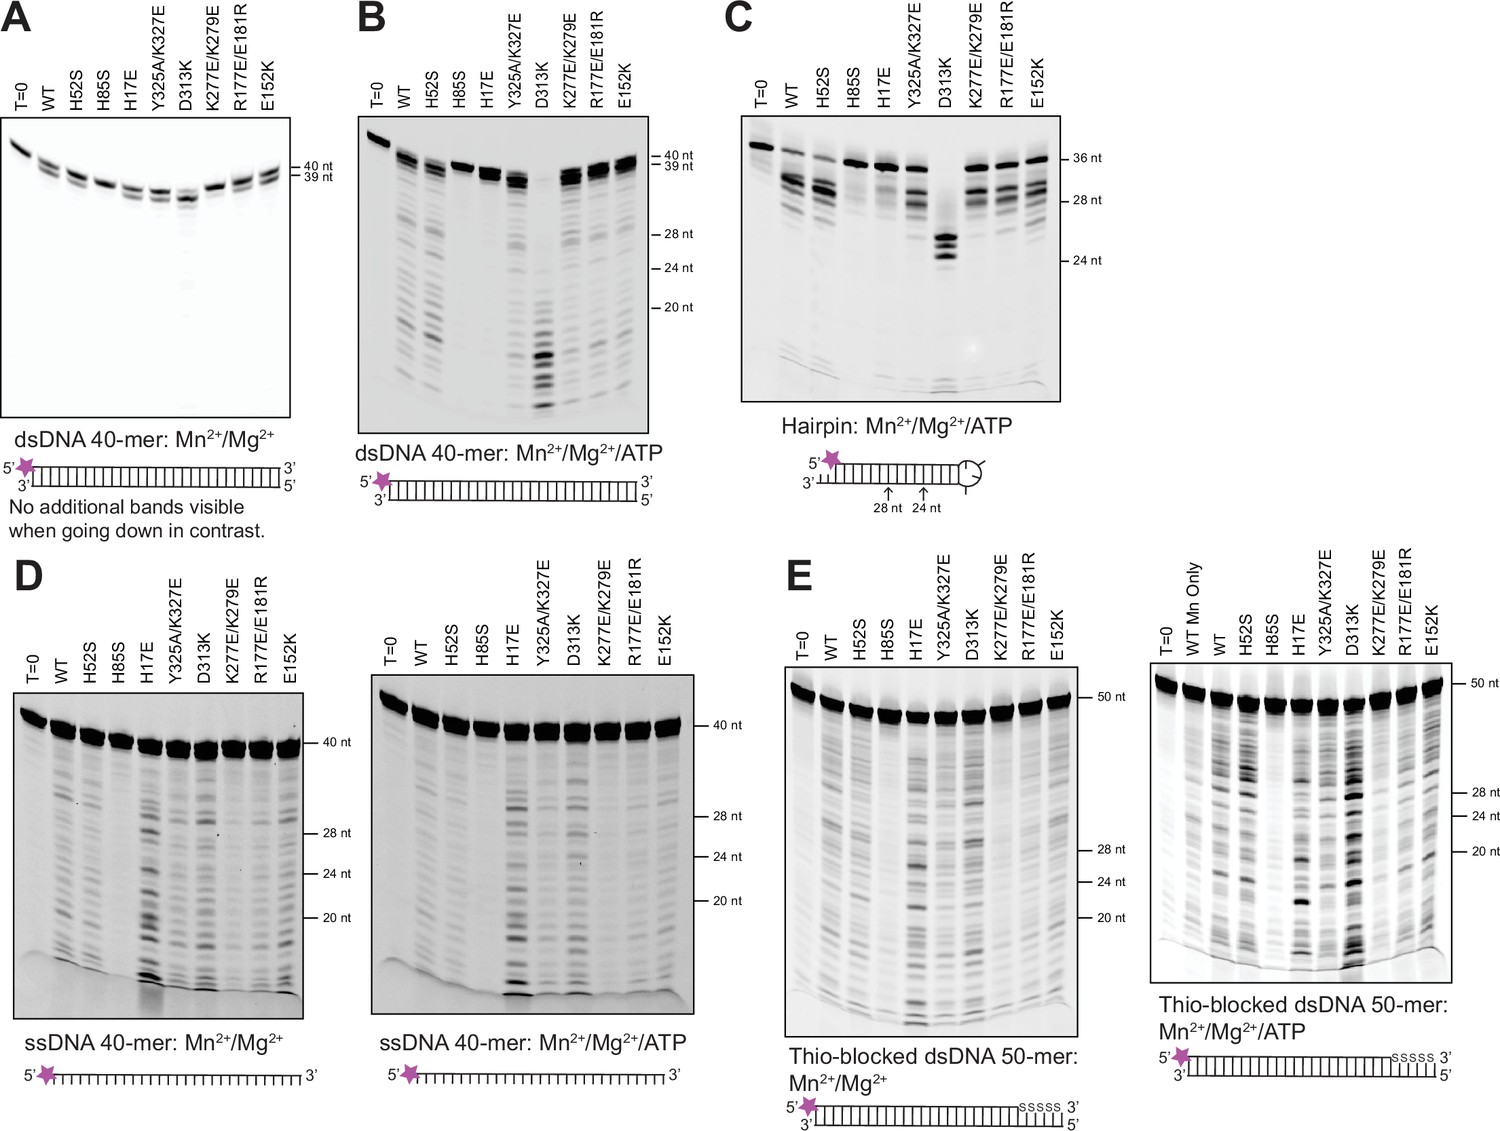
Nuclease activities of the full-length MR complex resolved by denaturing polyacrylamide gel electrophoresis.
Lane 1 is uncleaved substrate, and each subsequent lane is labeled with the Mre11 mutant in that MR complex. Size standards are given to the right of each gel. The reaction conditions and substrate, with the position of the fluorescent label, are given below each gel. (A) 3′-to-5′ dsDNA exonuclease activity on a 5′ Cy3-labeled 40-mer dsDNA. (B) Nuclease activity on the same substrate as in (A) in the presence of 2 mM ATP. (C) Nuclease activity on a 5′ FAM-labeled hairpin DNA in the presence of 2 mM ATP. The 36-nt hairpin has 15 base-pairs, a 4-nucleotide loop, and a 2-nucleotide 3′-overhang. (D) ssDNA endonuclease activity on a 5′ Cy3-labeled 40-mer ssDNA in the absence (left) and presence (right) of 2 mM ATP. (E) Nuclease activity on a 5′ Cy5-labeled 50-mer dsDNA in the absence (left) and presence (right) of 2 mM ATP. The last five phosphate groups on the labeled strand have been replaced with thiophosphates to inhibit 3′-to-5′ exonuclease activity on that strand.
Figure 3—figure supplement 2
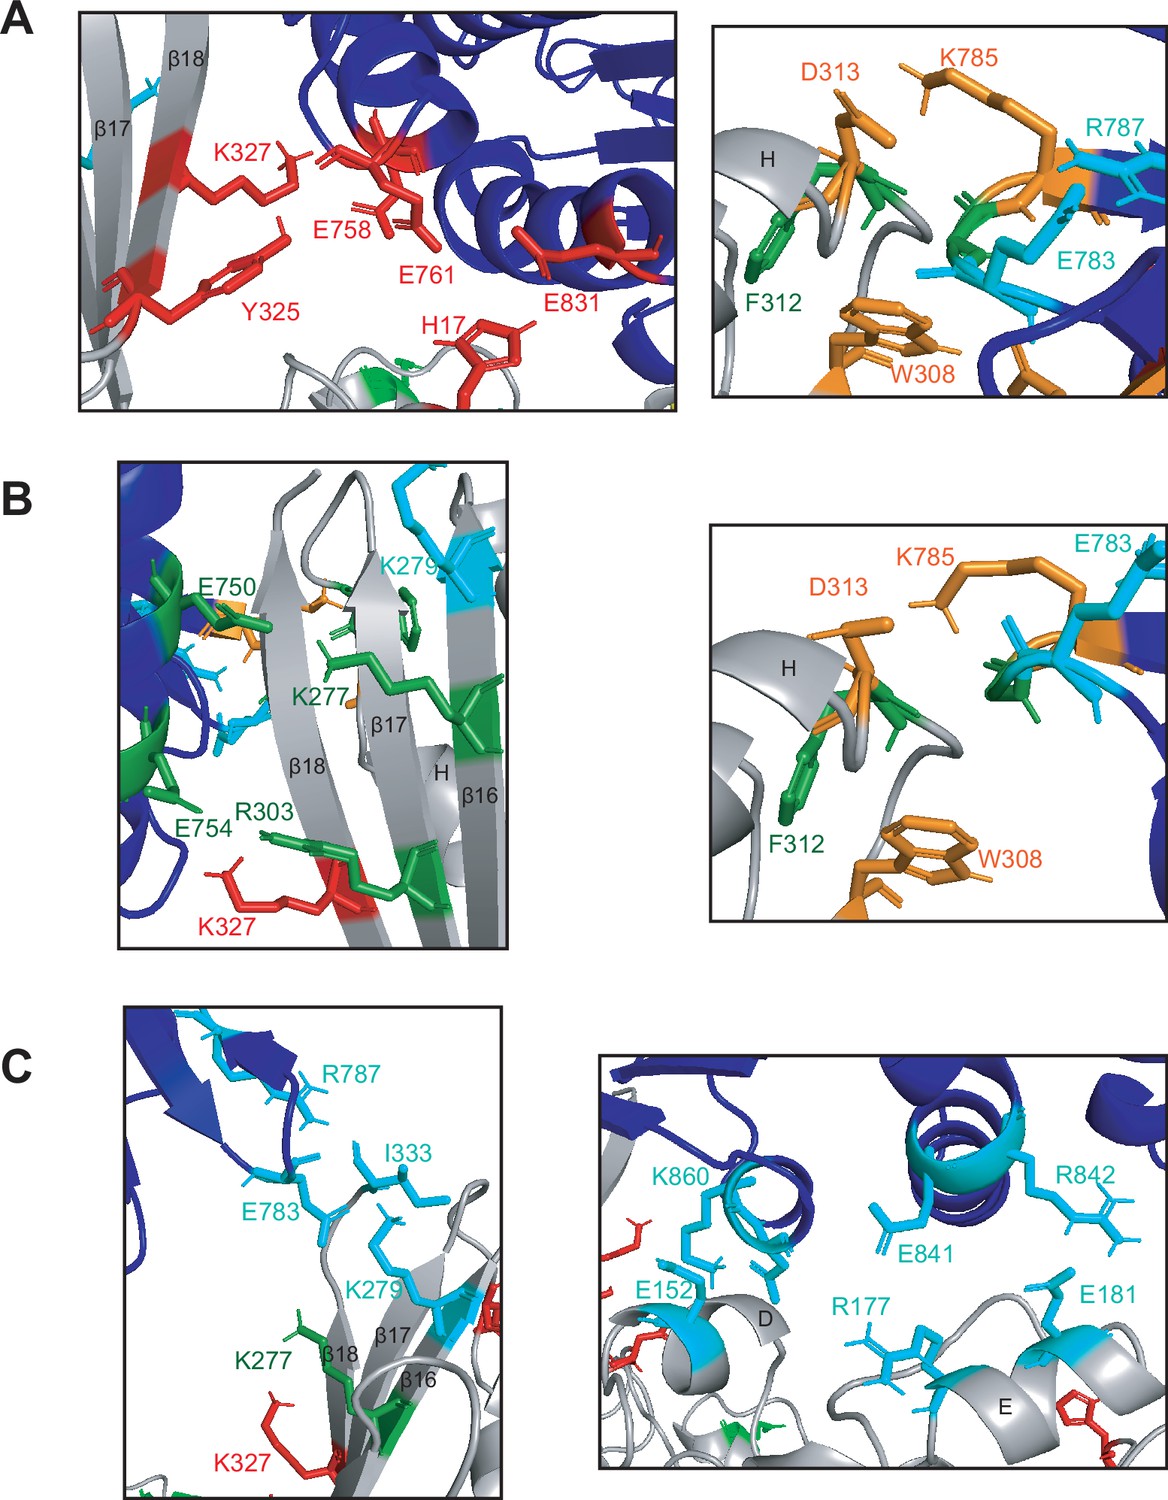
Unique interactions are made between Mre11 and Rad50 in the three conformations of MRNBD.
(A) Specific interactions between residues in Rad50 (dark blue) and the Mre11 capping domain (gray) in the closed conformation. (B) Specific interactions between residues in Rad50 (dark blue) and the Mre11 capping domain (gray) in the partially open conformation. (C) Specific interactions between residues in Rad50 (dark blue) and the Mre11 capping domain (gray, left) or Mre11 nuclease domain (gray, right) in the open conformation. (A–C) Red residues interact only in closed. Orange residues interact in both closed and partially open. Green residues interact only in partially open. Blue residues interact only in open. A number of Mre11 β-sheets and α-helices are labeled.
Figure 4 with 1 supplement
All three MR conformations play a role in the function of the complex.
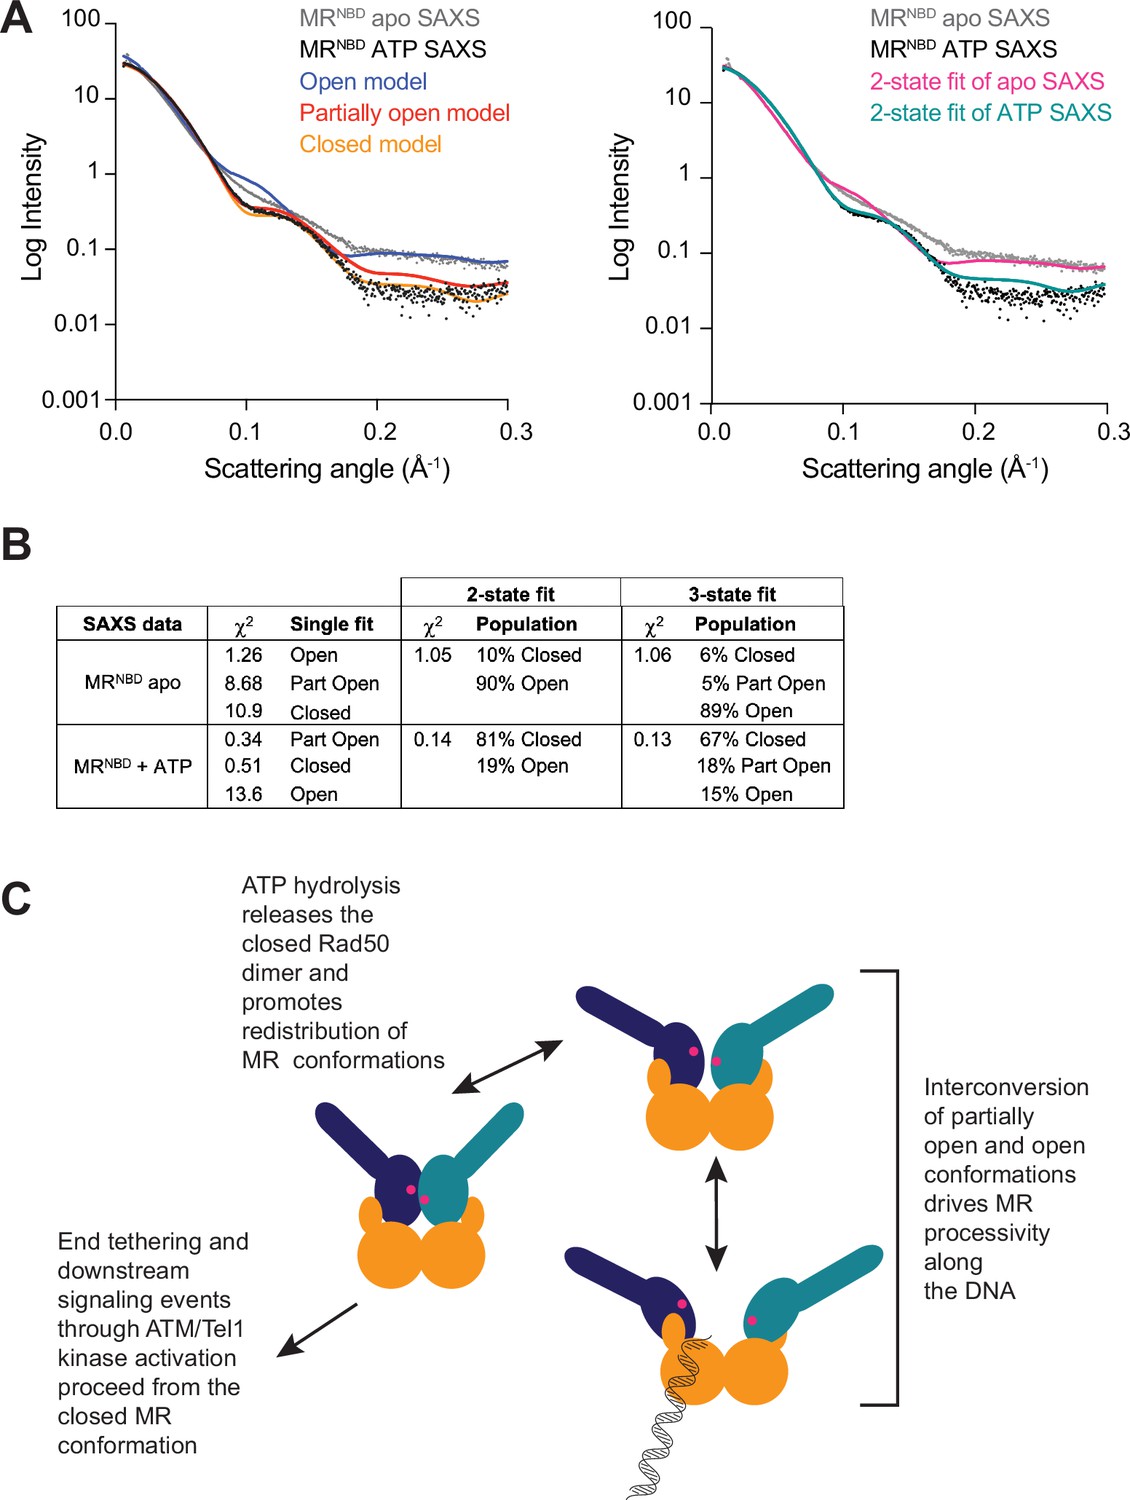
(A) The left panel shows experimental small-angle X-ray scattering (SAXS) data for apo (gray) and ATP-bound (black) MRNBD superimposed with FoXS-calculated theoretical SAXS curves for the closed (orange), partially open (red), and open (blue) HADDOCK models. The right panel shows the experimental SAXS data for apo (gray) and ATP-bound (black) MRNBD superimposed with MultiFoXS-calculated theoretical SAXS curves for the two-state fits of the HADDOCK models, given in (B), for the apo (magenta) and the ATP-bound (teal) data. (B) Goodness of fits of experimental to theoretical SAXS curves calculated by FoXS and MultiFoXS. For fits to two or three of the models, the populations from the fit are shown. (C) Proposed model of the functional role of conformational heterogeneity in the MR complex.
Figure 4—figure supplement 1
Rosetta-refined models of the MRNBD conformations.
Structures of (A) closed, (B) partially open, and (C) open conformations of MRNBD where Rosetta was used to model in Mre11 residues 334–347 (the linker from the capping domain to the HLH motif) and to extend the Rad50 coiled-coils by seven residues on one coil and eight residues on the other, linking them with GGAGGAGG sequence, on the LRET-HADDOCK models. Mre11 is orange, and the two Rad50 protomers are dark blue and teal. These structures were used in the FoXS and MultiFoXS analysis.
Tables
Table 1
Multiple conformations of the MR complex in various nucleotide- and DNA-bound states.
Table of the luminescence resonance energy transfer (LRET)-determined distances (in Å) for a subset of LRET pairs in MRNBD (left column) or full-length MR (right column) determined in the absence of nucleotide (apo), ATP-bound, ATPγS-bound, ATP- and hairpin DNA-bound, and ATP- and ssDNA-bound. For each LRET pair, the first Rad50 was labeled with either with Bodipy FL or Cy3 acceptor and the second Rad50 with Tb3+-chelate donor. Green, orange, and purple shaded cells indicate distances in the ‘closed,’ ‘partially open,’ and ‘open’ conformations, respectively. For the distances describing the partially open state, the individual d2Bodipy and d1Cy3 distances are both given. Values are the mean and standard deviation of at least three replicates.
| MRNBDLRET Pair | Condition | LRET closed | LRET partially open | LRET open |
|---|---|---|---|---|
| (Bo) | (Bo, Cy3) | (Cy3) | ||
| L51/Tb3+- L51 MRNBD | apo | 37.5 ± 0.7 | 46.2 ± 1.3, 46.1 ± 1.7 | 81.4 ± 2.2 |
| ATP | 37.7 ± 0.6 | 45.4 ± 1.1, 47.0 ± 1.0 | 78.0 ± 2.0 | |
| ATPγS | 37.9 ± 0.1 | 47.7 ± 0.4, 48.0 ± 0.5 | 79.1 ± 1.1 | |
| ATP + Hairpin | 37.7 ± 1.2 | 47.9 ± 1.4, 47.2 ± 1.2 | 79.1 ± 1.0 | |
| ATP + ssDNA | 36.7 ± 0.8 | 46.8 ± 1.3, 45.4 ± 1.4 | 74.5 ± 0.7 | |
| N774/Tb3+-N774 MRNBD | apo | 33.7 ± 0.6 | 56.0 ± 0.3, 50.6 ± 1.5 | 85.0 ± 1.2 |
| ATP | 35.7 ± 0.2 | 51.5 ± 2.3, 45.8 ± 1.8 | 83.5 ± 2.2 | |
| ATPγS | 35.6 ± 0.1 | 53.0 ± 1.5, 48.6 ± 0.2 | 82.6 ± 3.0 | |
| ATP + Hairpin | 35.4 ± 0.3 | 53.6 ± 0.5, 46.9 ± 1.3 | 82.7 ± 2.0 | |
| ATP + ssDNA | 35.1 ± 0.5 | 52.8 ± 0.4, 50.0 ± 2.7 | 75.3 ± 0.6 | |
| S13/Tb3+-S13 MRNBD | apo | 36.7 ± 1.0 | 55.6 ± 0.3, 46.0 ± 0.9 | 79.9 ± 2.2 |
| ATP | 35.4 ± 0.3 | 51.1 ± 1.0, 50.9 ± 1.1 | 77.8 ± 1.7 | |
| ATPγS | 37.1 ± 0.1 | 51.9 ± 0.1, 47.0 ± 1.2 | 77.1 ± 0.2 | |
| ATP + Hairpin | 34.4 ± 1.2 | 54.9 ± 0.8, 47.8 ± 0.7 | 74.9 ± 0.2 | |
| ATP + ssDNA | 34.2 ± 0.7 | 53.9 ± 0.7, 48.0 ± 1.7 | 75.0 ± 0.8 | |
| S13/Tb3+- L51 MRNBD | apo | 34.7 ± 0.1 | 55.4 ± 1.0, 50.1 ± 0.8 | 84.1 ± 1.6 |
| ATP | 36.7 ± 1.1 | 51.4 ± 0.9, 51.6 ± 0.3 | 79.7 ± 3.0 | |
| ATPγS | 36.0 ± 0.2 | 52.8 ± 0.2, 51.3 ± 0.2 | 79.7 ± 1.1 | |
| ATP + Hairpin | 34.7 ± 0.7 | 52.3 ± 0.4, 50.9 ± 0.1 | 77.2 ± 0.5 | |
| ATP + ssDNA | 35.1 ± 0.8 | 50.0 ± 0.5, 51.1 ± 0.4 | 74.5 ± 0.7 | |
| N774/Tb3+-L51 MRNBD | apo | 33.0 ± 0.8 | 53.0 ± 0.8, 48.9 ± 1.8 | 84.0 ± 0.9 |
| ATP | 30.9 ± 0.2 | 51.5 ± 0.4, 49.6 ± 1.5 | 80.8 ± 1.9 | |
| ATPγS | 31.2 ± 0.3 | 49.6 ± 0.6, 47.6 ± 0.9 | 77.8 ± 0.2 | |
| ATP + Hairpin | 30.6 ± 0.3 | 49.9 ± 0.9, 51.1 ± 3.0 | 80.9 ± 0.9 | |
| ATP + ssDNA | 30.4 ± 0.4 | 49.6 ± 0.6, 50.7 ± 2.1 | 75.9 ± 1.2 |
Additional files
-
Supplementary file 1
MRNBD luminescence resonance energy transfer (LRET) probe pair distances.
Each row represents data from a unique LRET pair. Distances (in Å) were calculated from the decay of donor-sensitized Bodipy or Cy3 fluorescence emission as described in Materials and methods. Errors are the standard deviation of n ≥ 3 LRET measurements.
- https://cdn.elifesciences.org/articles/69579/elife-69579-supp1-v2.docx
-
Supplementary file 2
MRNBD luminescence resonance energy transfer (LRET) experimental probe distances and HADDOCK model distances.
The average experimental LRET distance measured for each pair of Rad50 LRET probes was used as unambiguous restraints in closed, partially open, and open HADDOCK simulations. The three resulting HADDOCK models had the reported Cβ-Cβ distance between indicated probe positions.
- https://cdn.elifesciences.org/articles/69579/elife-69579-supp2-v2.docx
-
Transparent reporting form
- https://cdn.elifesciences.org/articles/69579/elife-69579-transrepform1-v2.pdf
Download links
A two-part list of links to download the article, or parts of the article, in various formats.
Downloads (link to download the article as PDF)
Open citations (links to open the citations from this article in various online reference manager services)
Cite this article (links to download the citations from this article in formats compatible with various reference manager tools)
LRET-derived HADDOCK structural models describe the conformational heterogeneity required for DNA cleavage by the Mre11-Rad50 DNA damage repair complex
eLife 11:e69579.
https://doi.org/10.7554/eLife.69579


